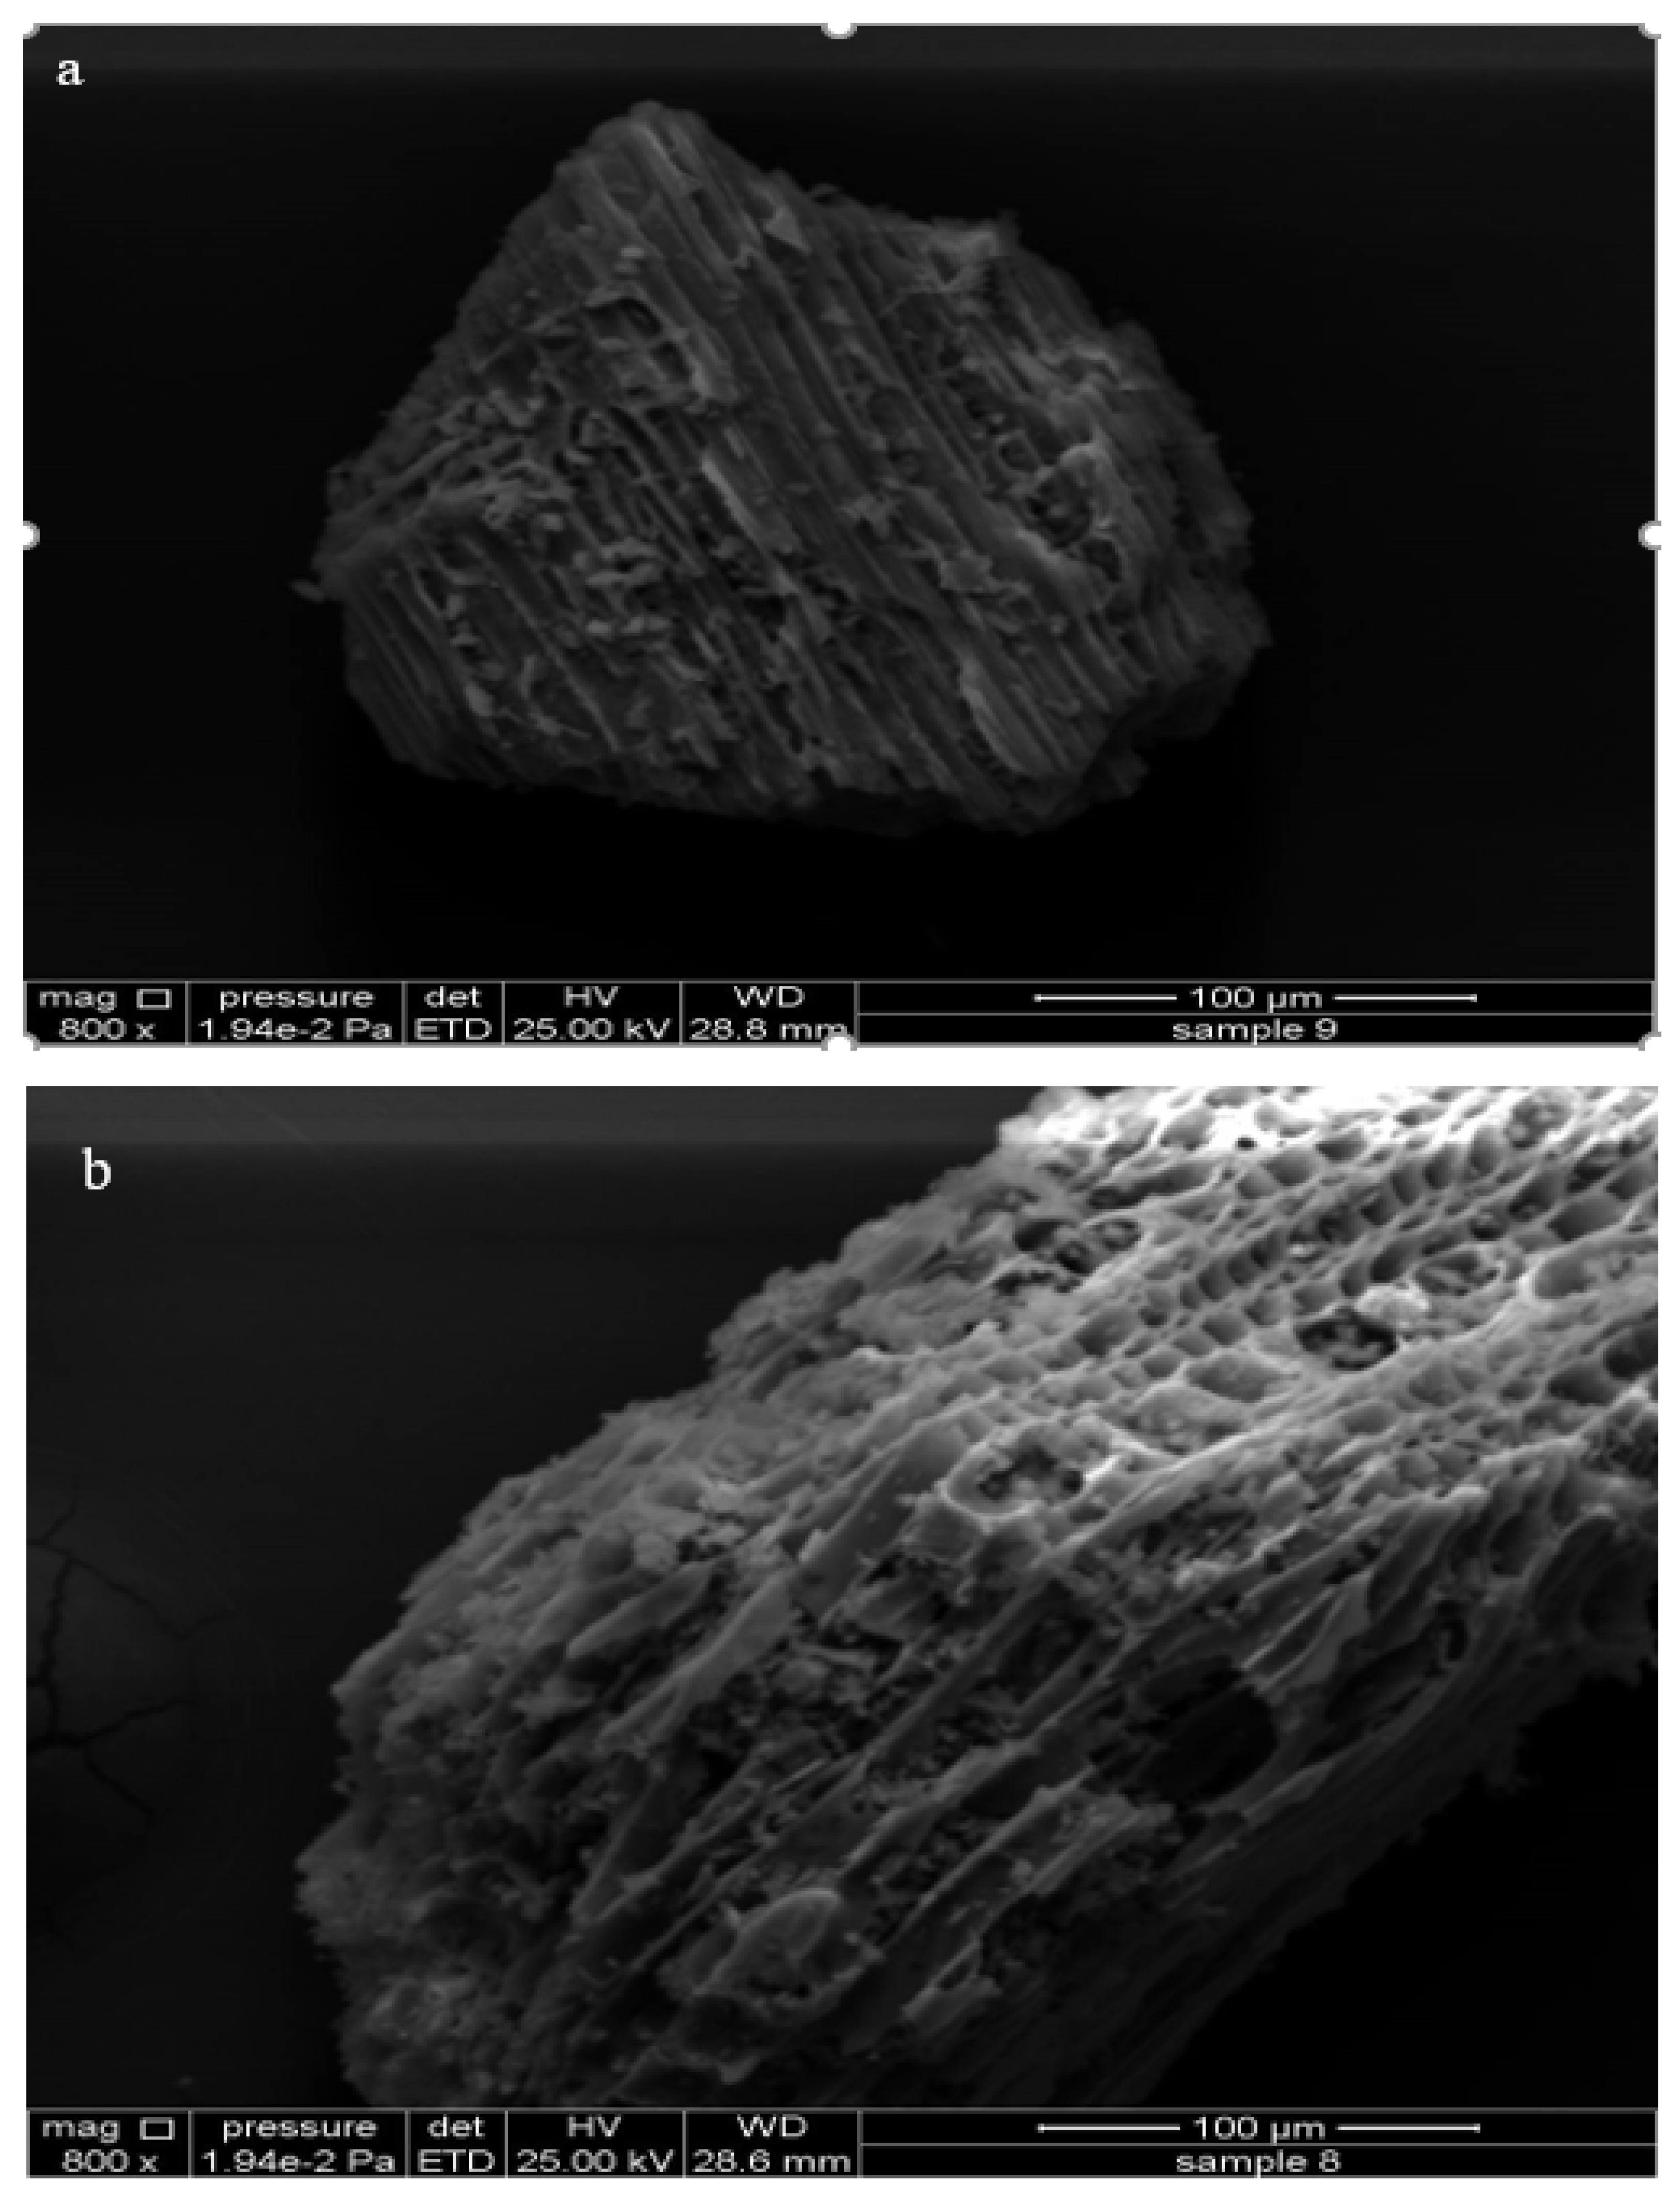
Figure 1.
SEM images of (a) biochar (BC) and (b) acidified biochar (ABC).
Figure 1.
SEM images of (a) biochar (BC) and (b) acidified biochar (ABC).
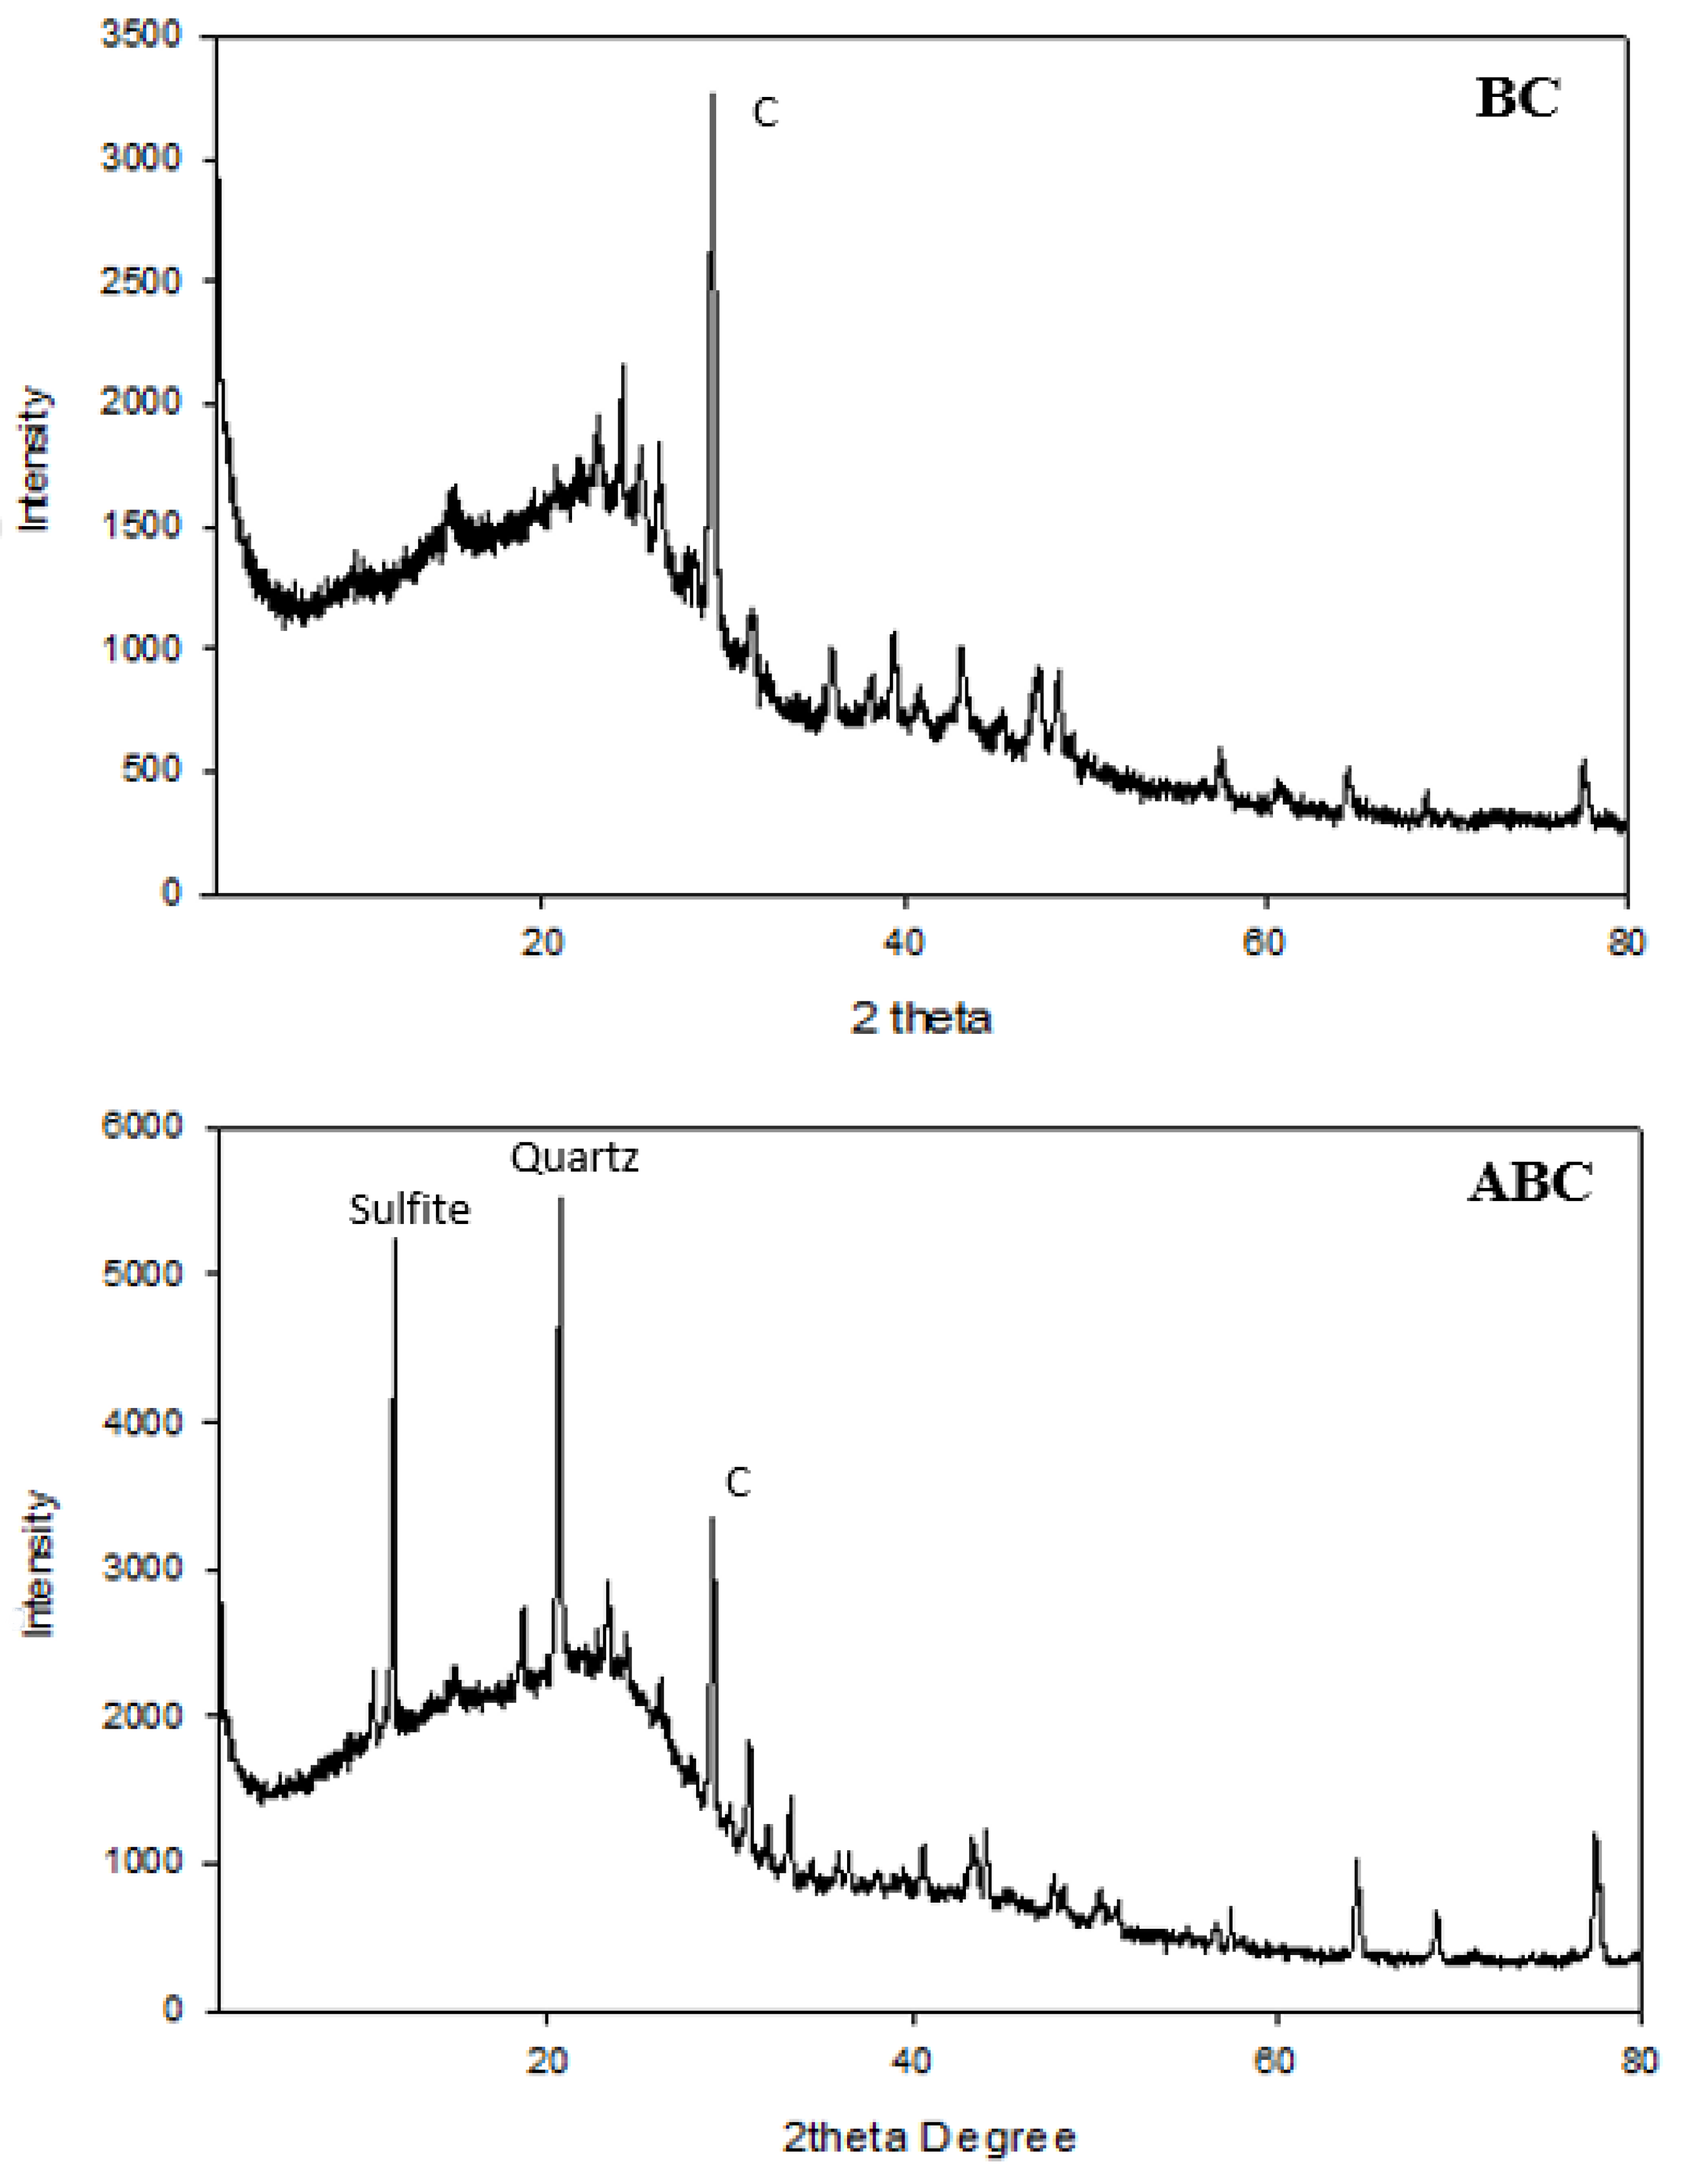
Figure 2.
X-ray diffraction analyses of biochar (BC) and acidified biochar (ABC).
Figure 2.
X-ray diffraction analyses of biochar (BC) and acidified biochar (ABC).
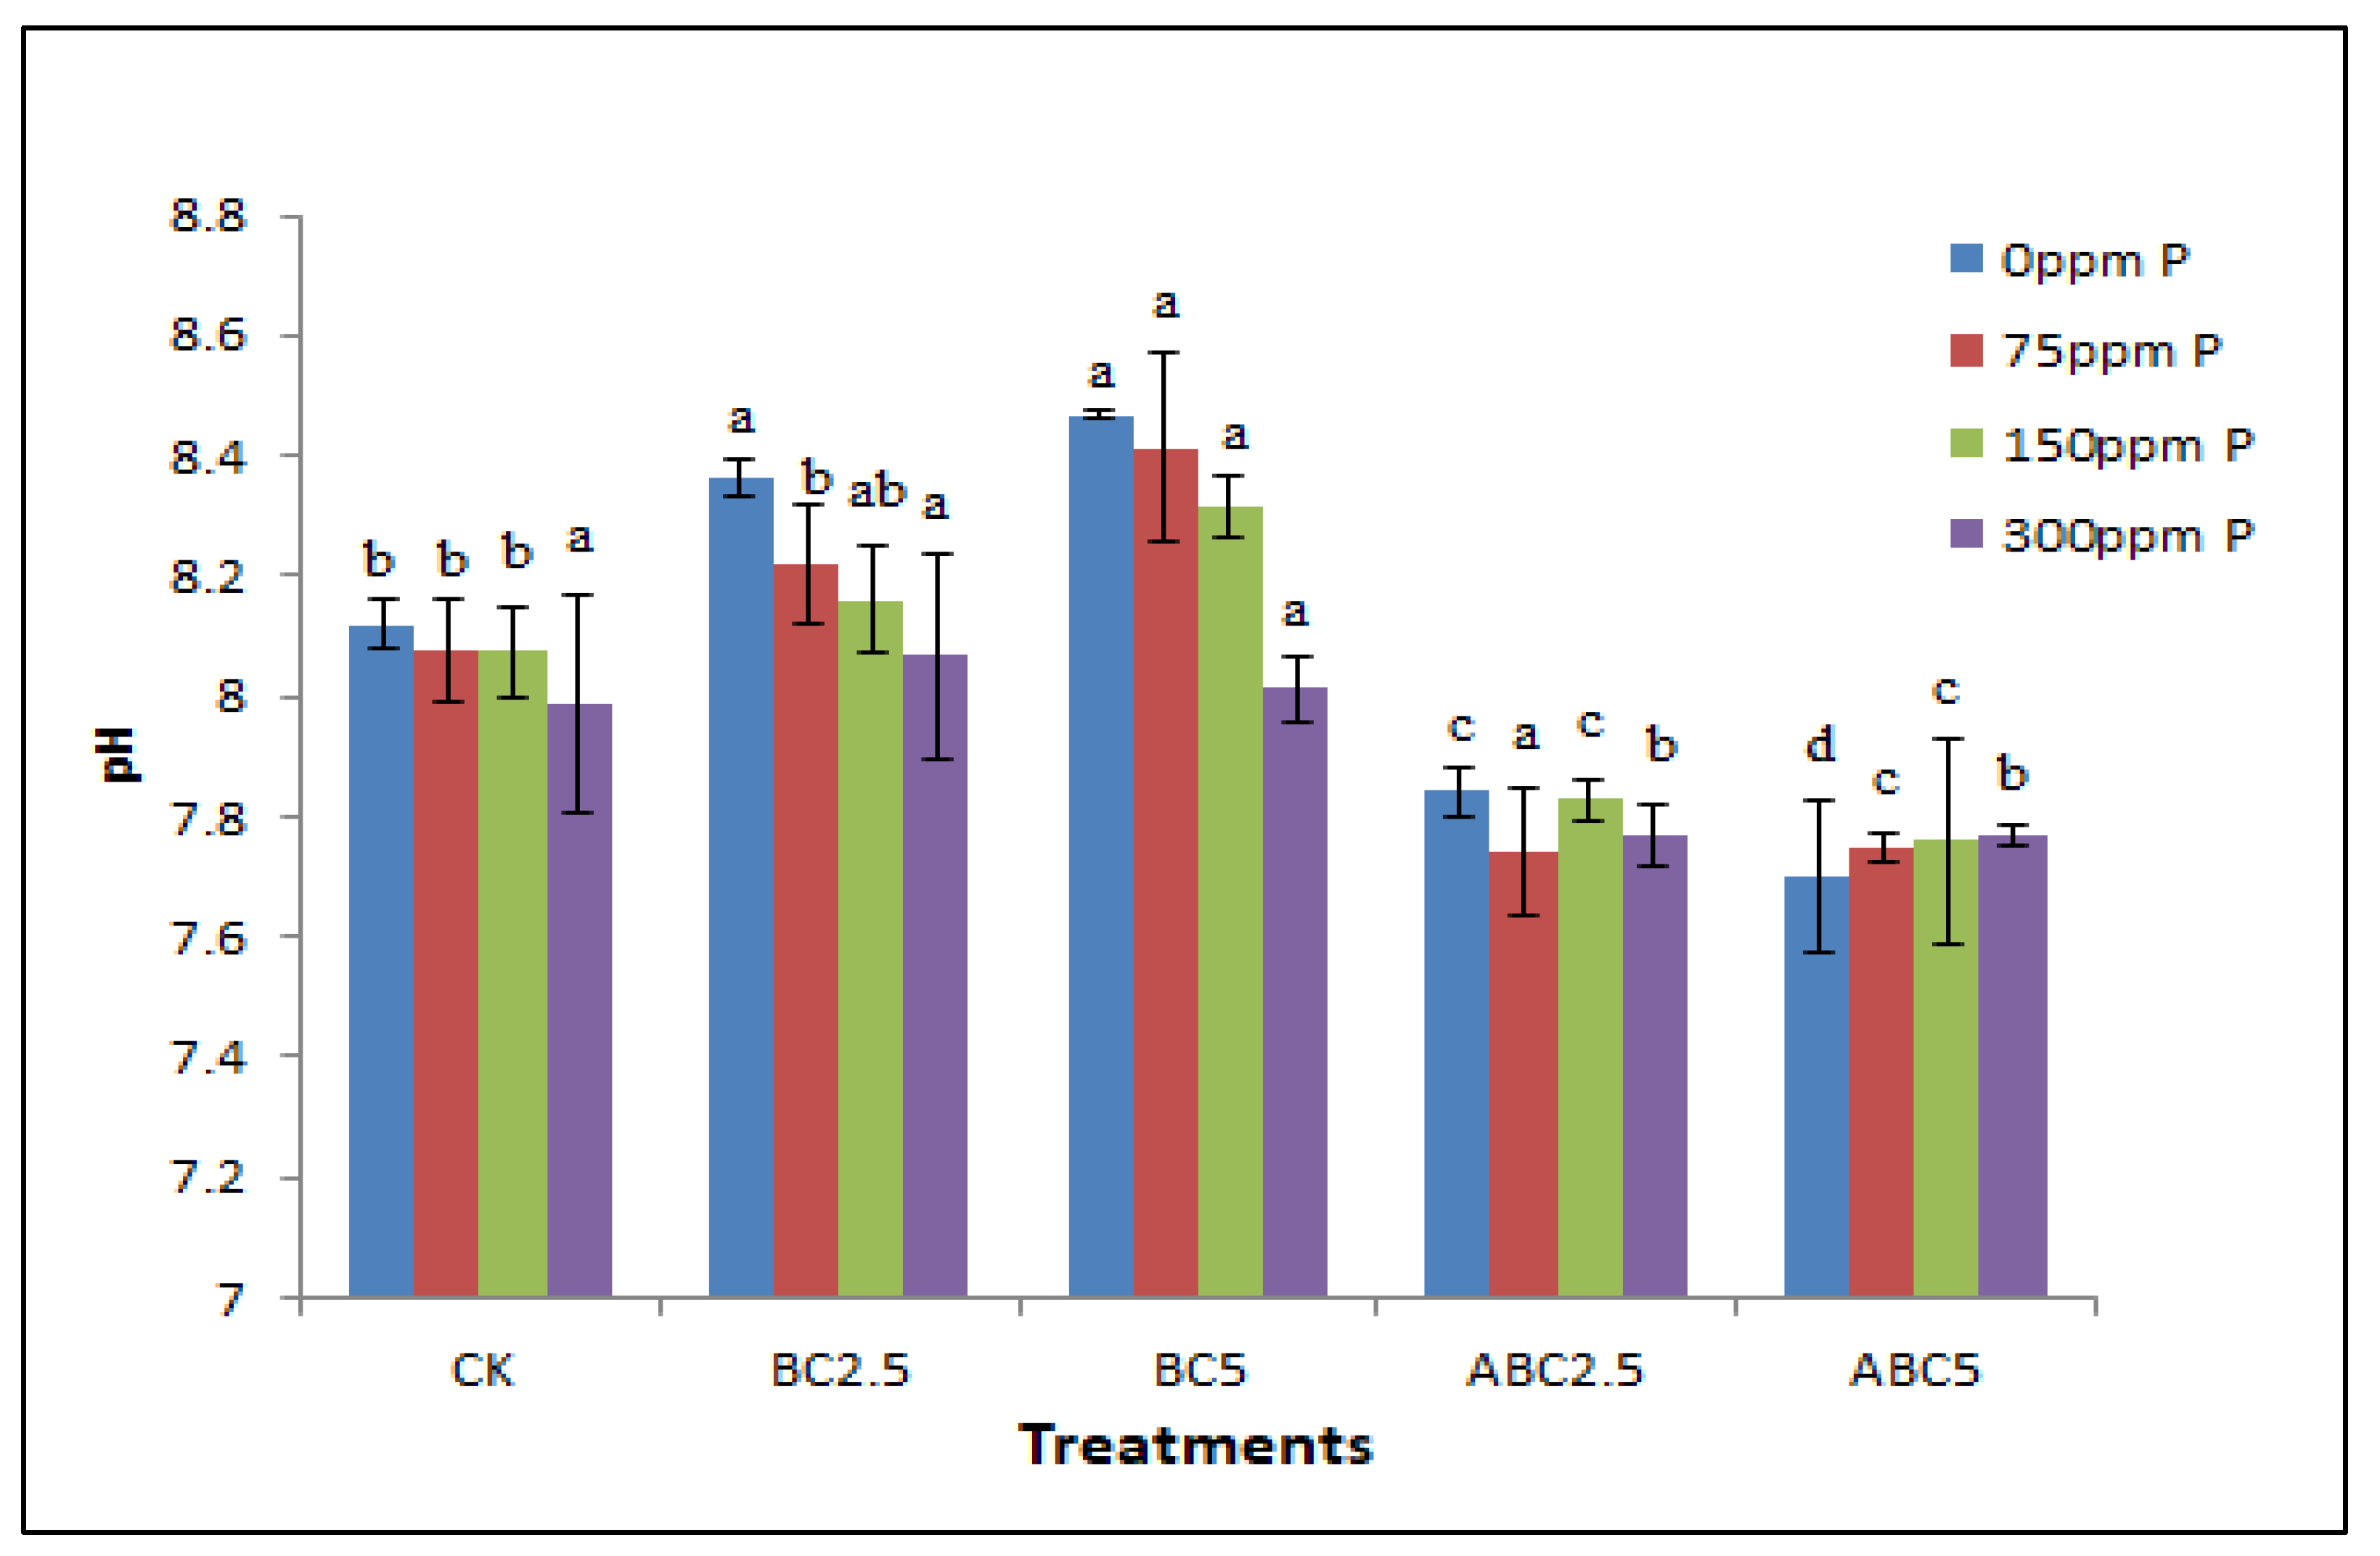
Figure 3.
Effects of BC and ABC applied at different rates with different P fertilizer application rates on soil pH. Means with different letters within each fertilizer rate across each treatment indicate significant differences according to the least significant difference (LSD) test at p < 0.05. CK = Control, BC2.5 = Biochar added at 2.5% w/w, BC5 = Biochar added at 5% w/w, ABC2.5 = Acidified biochar added at 2.5% w/w, and ABC5 = Acidified biochar added at 5% w/w.
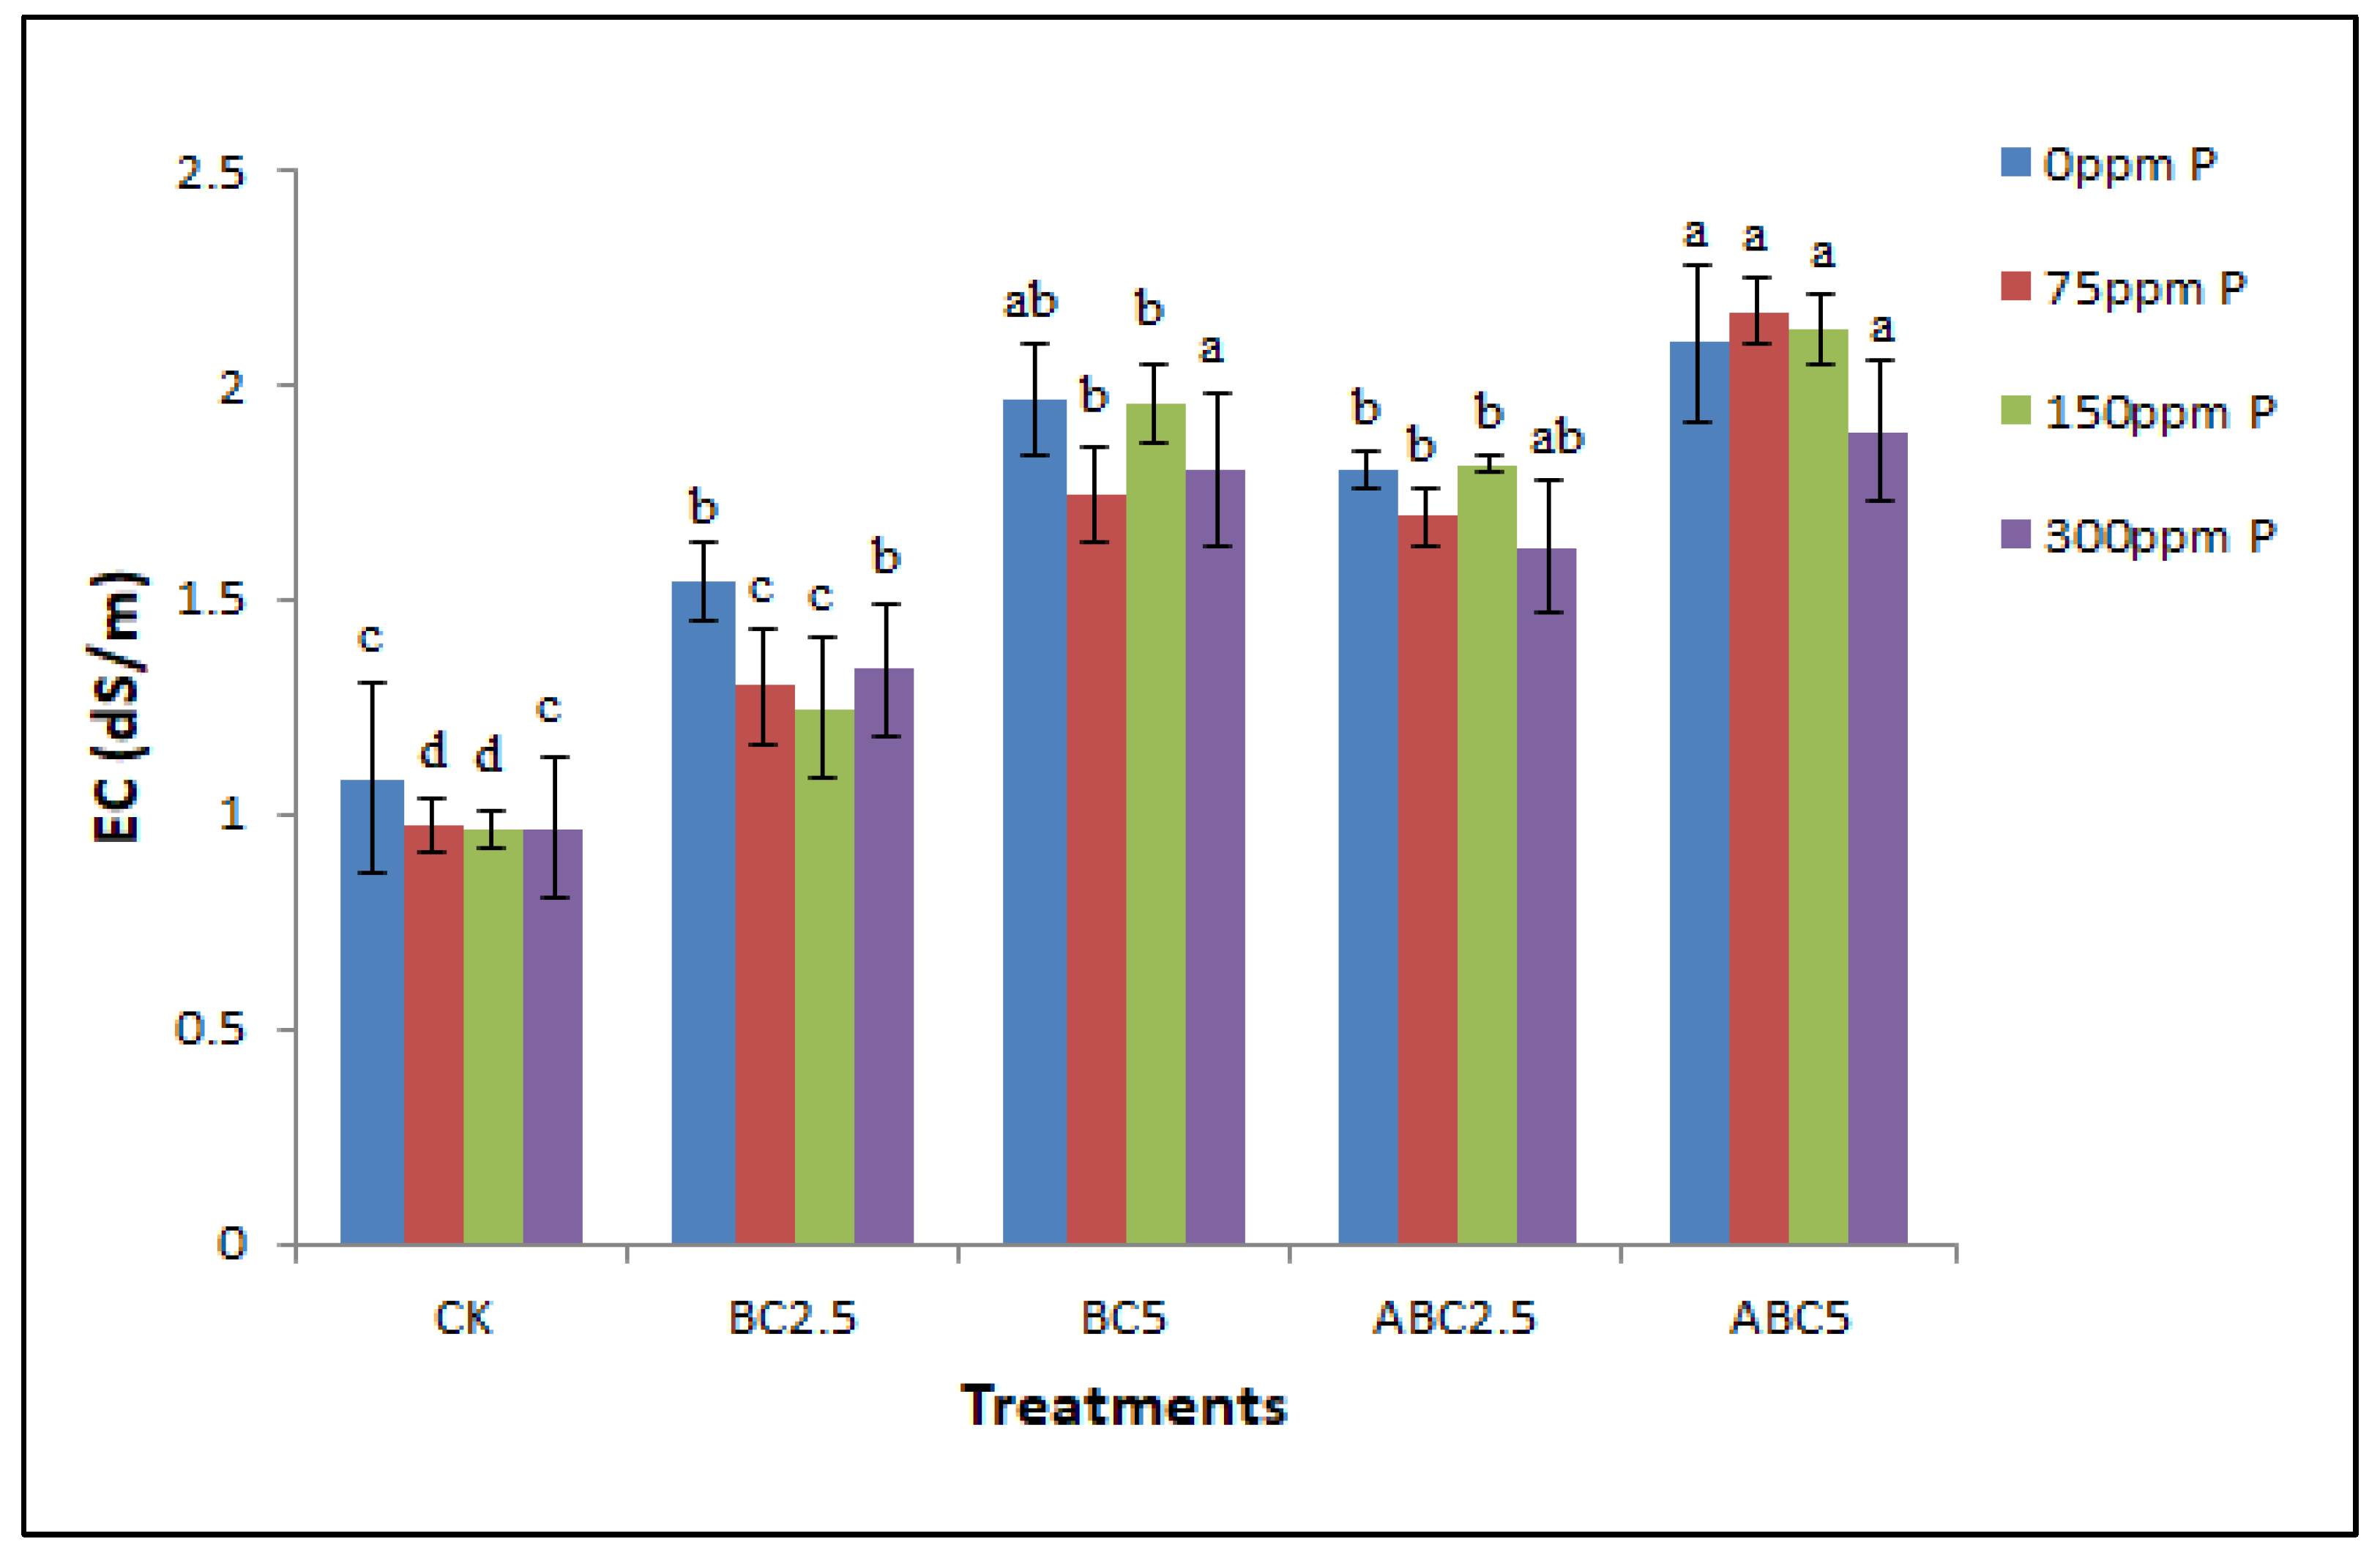
Figure 4.
Effects of BC and ABC applied at different rates with different P fertilizer application rates on Soil EC in dS/m. Means with different letters within each fertilizer rate across each treatment indicate significant differences according to the least significant difference (LSD) test at p < 0.05. CK = Control, BC2.5 = Biochar applied at 2.5% w/w, BC5 = Biochar applied at 5% w/w, ABC2.5 = Acidified biochar applied at 2.5% w/w, and ABC5 = Acidified biochar applied at 5% w/w.
Figure 5.
Effects of BC and ABC applied at different rates with different P fertilizer application rates on soil available Cu (mg kg−1). Means with different letters within each fertilizer rate across each treatment indicate significant differences according to the least significant difference (LSD) test at p < 0.05. CK = Control, BC2.5 = Biochar added at 2.5% w/w, BC5 = Biochar added at 5% w/w, ABC2.5 = Acidified biochar added at 2.5% w/w, and ABC5 = Acidified biochar added at 5% w/w.
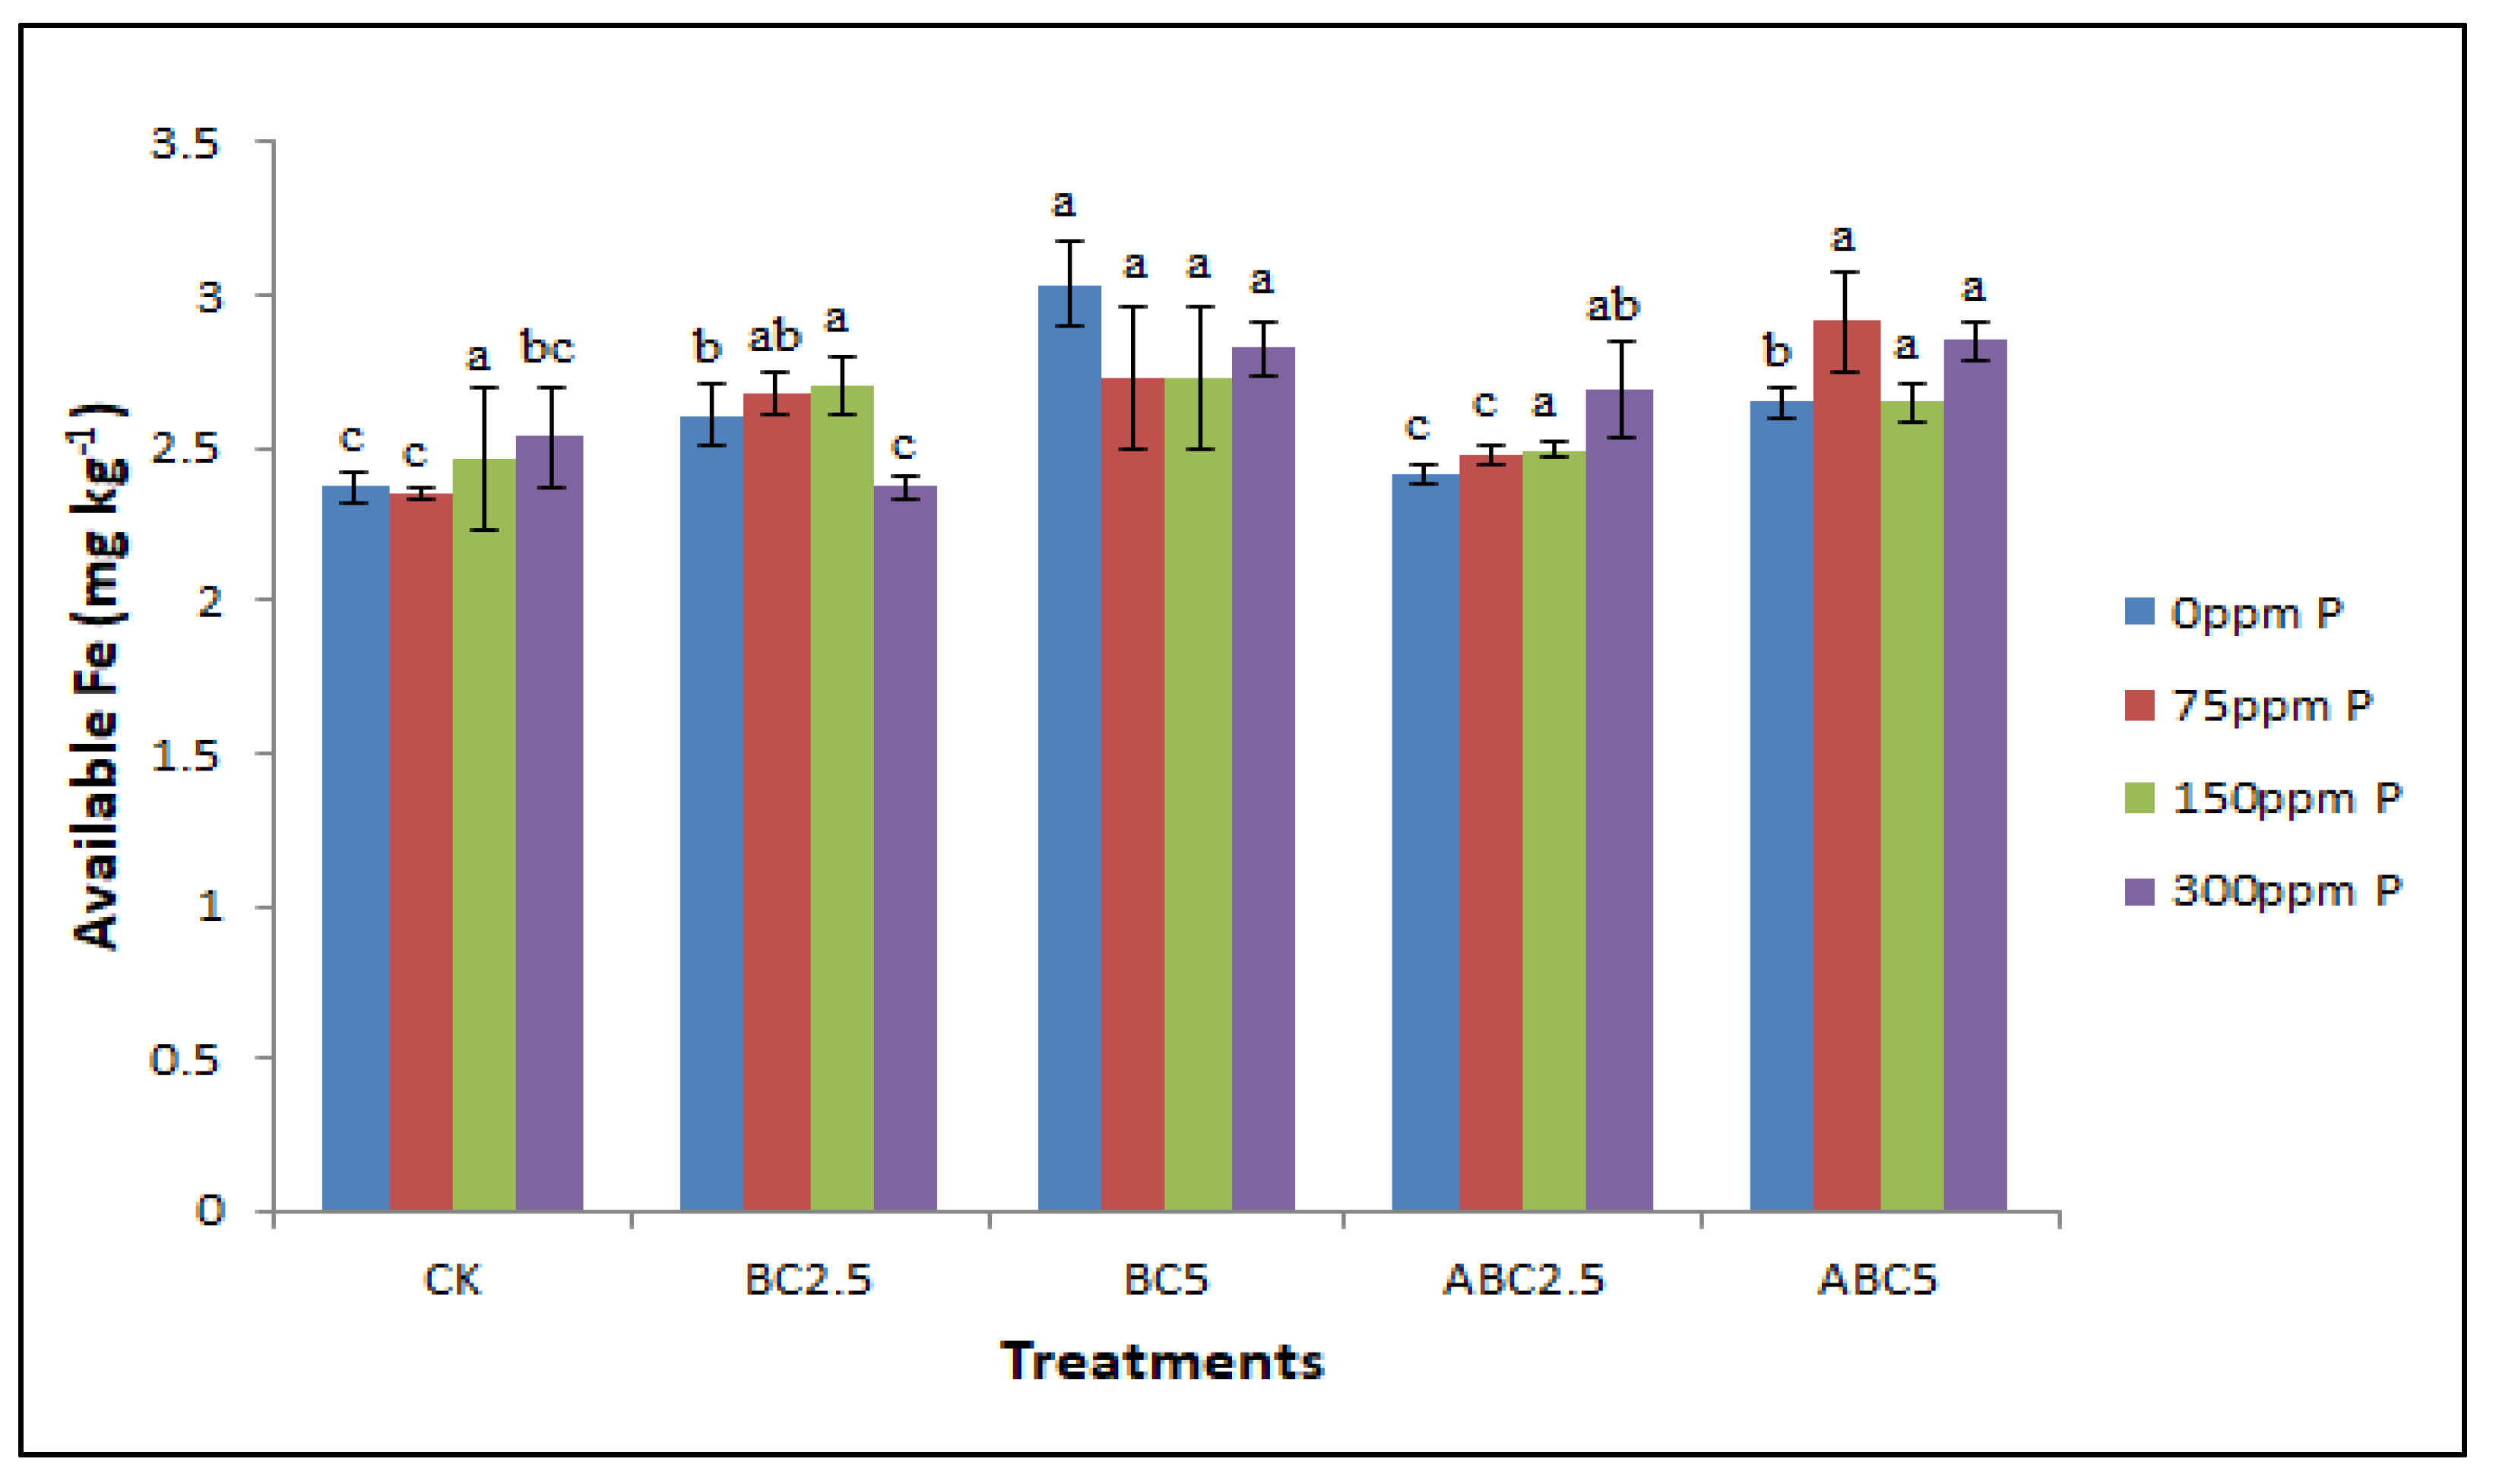
Figure 6.
Effects of BC and ABC applied at different rates with different P fertilizer application rates on soil available Fe (mg kg−1). Means with different letters within each fertilizer rate across each treatment indicate significant differences according to the least significant difference (LSD) test at p < 0.05. CK = Control, BC2.5 = Biochar added at 2.5% w/w, BC5 = Biochar added at 5% w/w, ABC2.5 = Acidified biochar added at 2.5% w/w, and ABC5 = Acidified biochar added at 5% w/w.
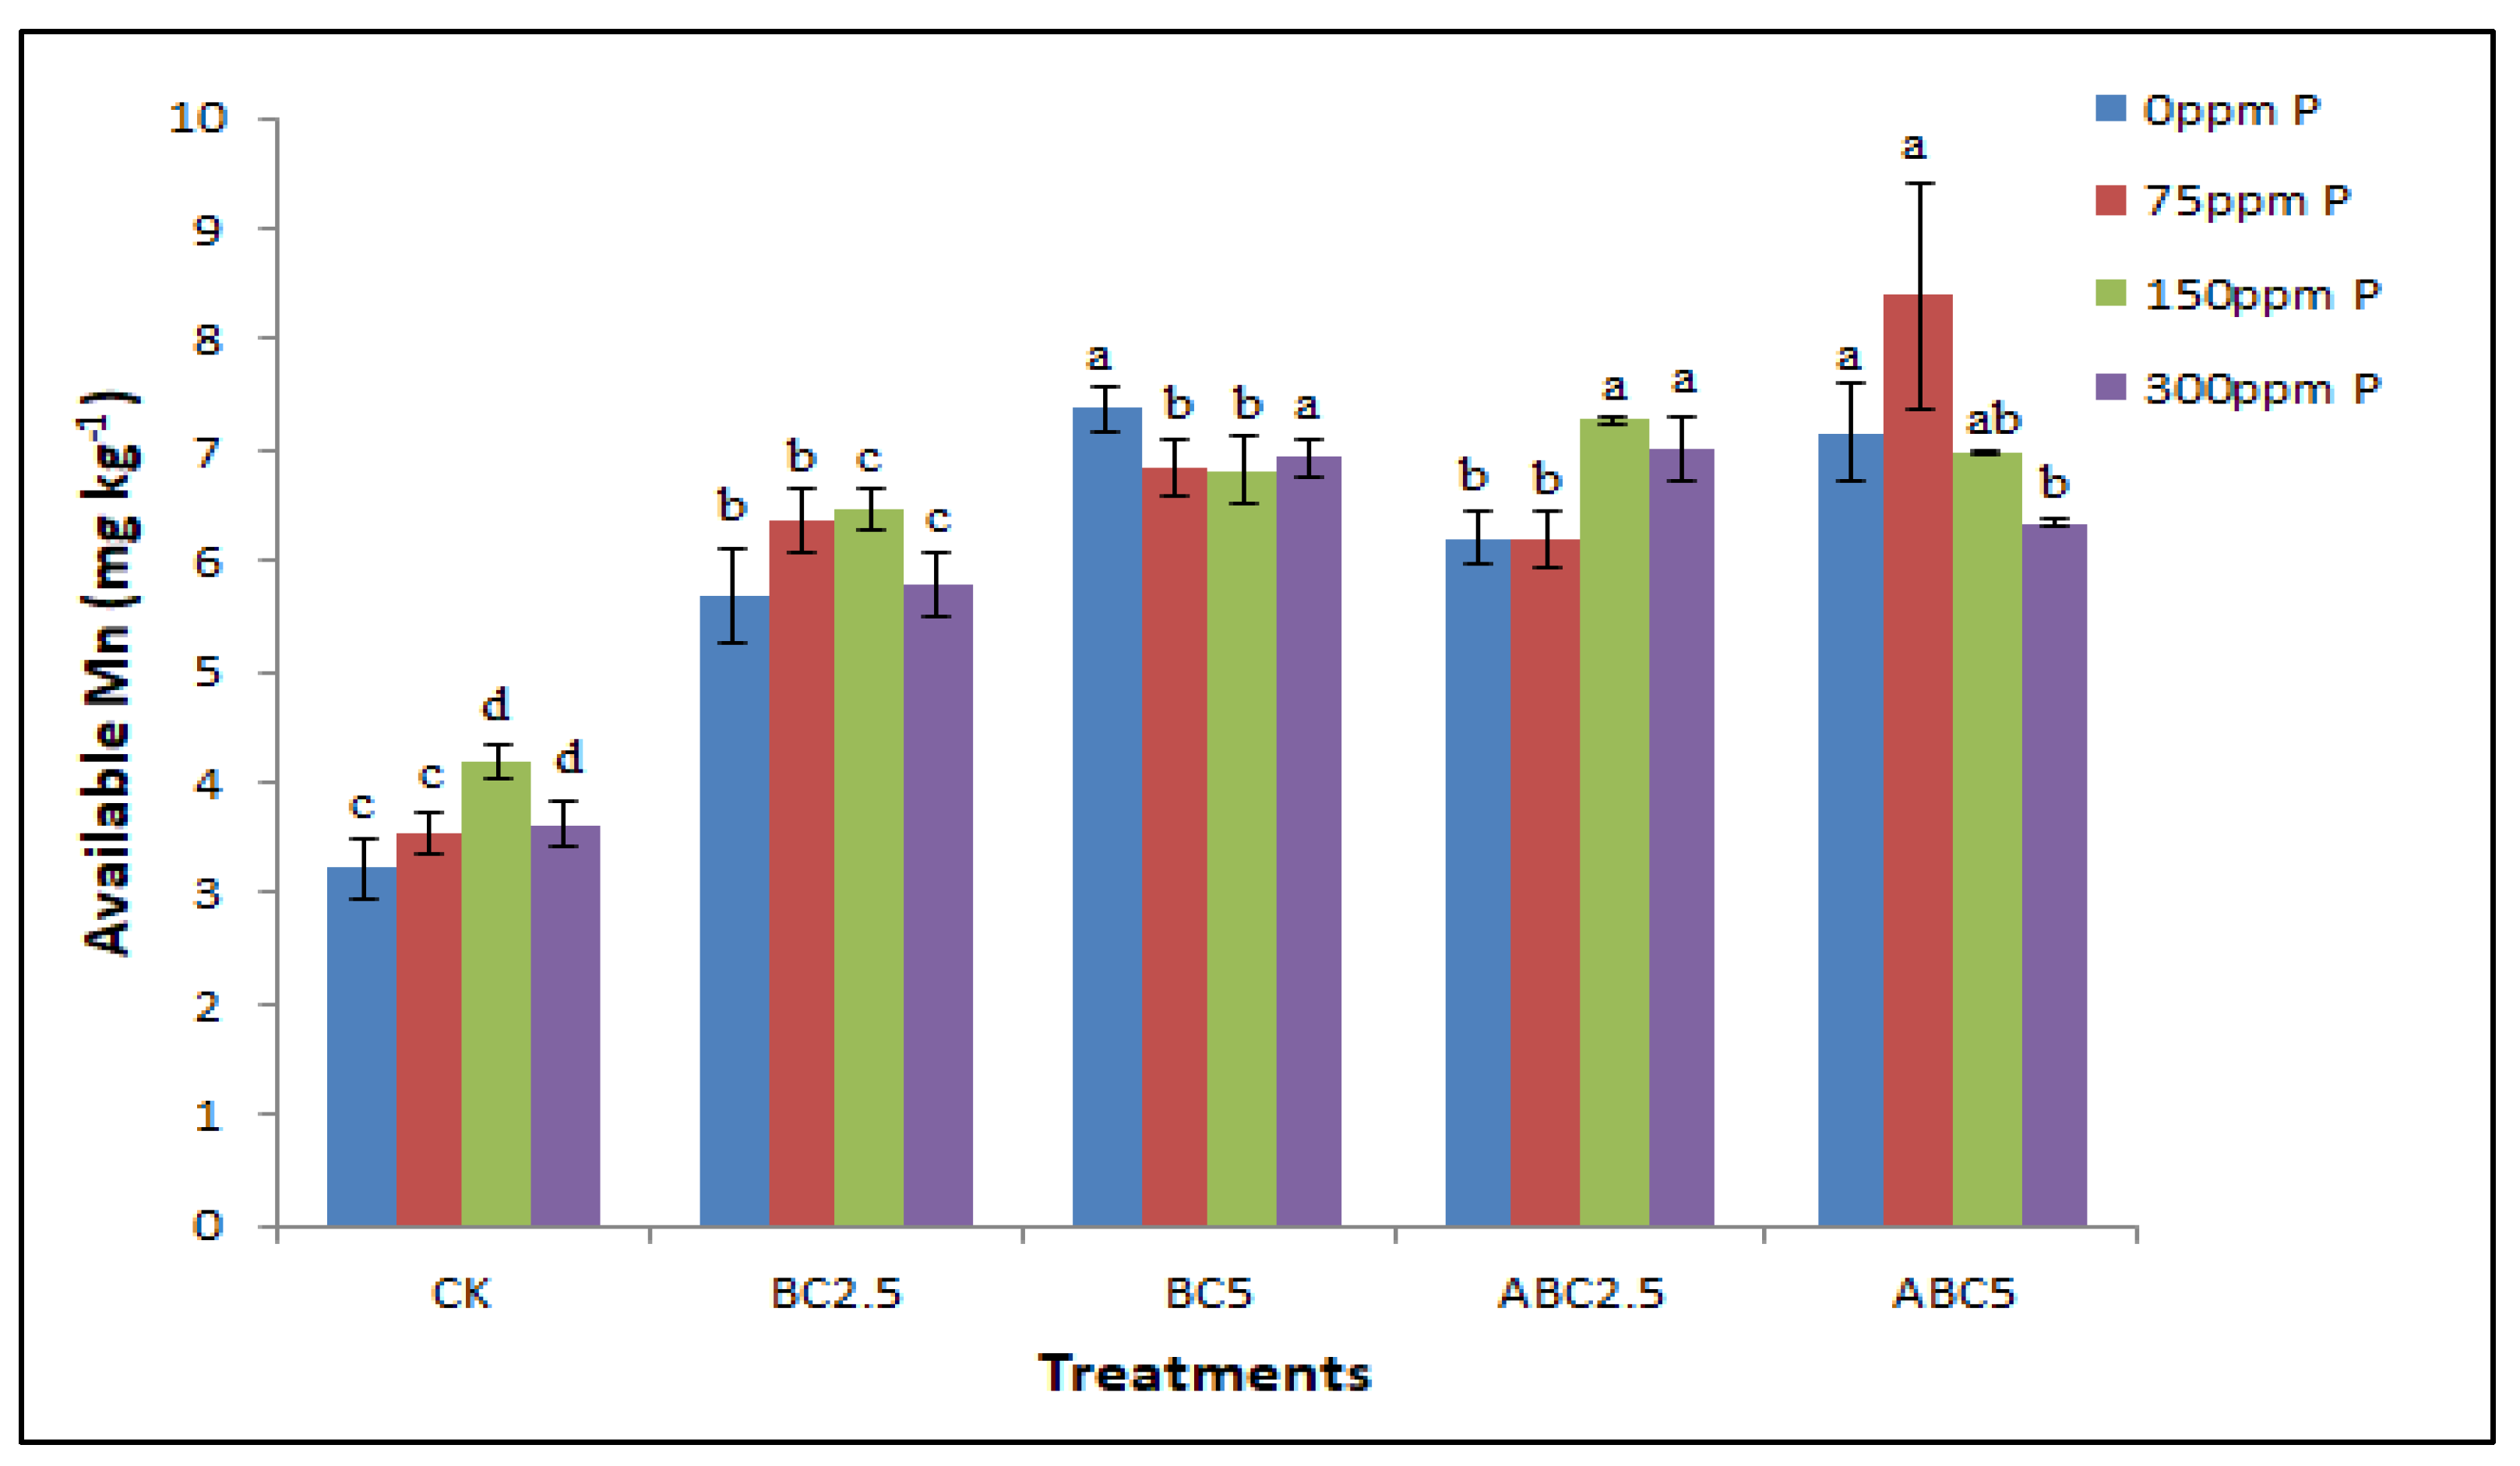
Figure 7.
Effects of BC and ABC applied at different rates with different P fertilizer application rates on soil available Mn (mg kg−1). Means with different letters within each fertilizer rate across each treatment indicate significant differences according to the least significant difference (LSD) test at p < 0.05. CK = Control, BC2.5 = Biochar added at 2.5% w/w, BC5 = Biochar added at 5% w/w, ABC2.5 = Acidified biochar added at 2.5% w/w, and ABC5 = Acidified biochar added at 5% w/w.
Figure 8.
Effects of BC and ABC applied at different rates with different P fertilizer application rates on plant P uptake in shoots in microgram/plant. Means with different letters within each fertilizer rate across each treatment indicate significant differences according to the least significant difference (LSD) test at p < 0.05. CK = Control, BC2.5 = Biochar added at 2.5% w/w, BC5 = Biochar added at 5% w/w, ABC2.5 = Acidified biochar added at 2.5% w/w, and ABC5 = Acidified biochar added at 5% w/w.
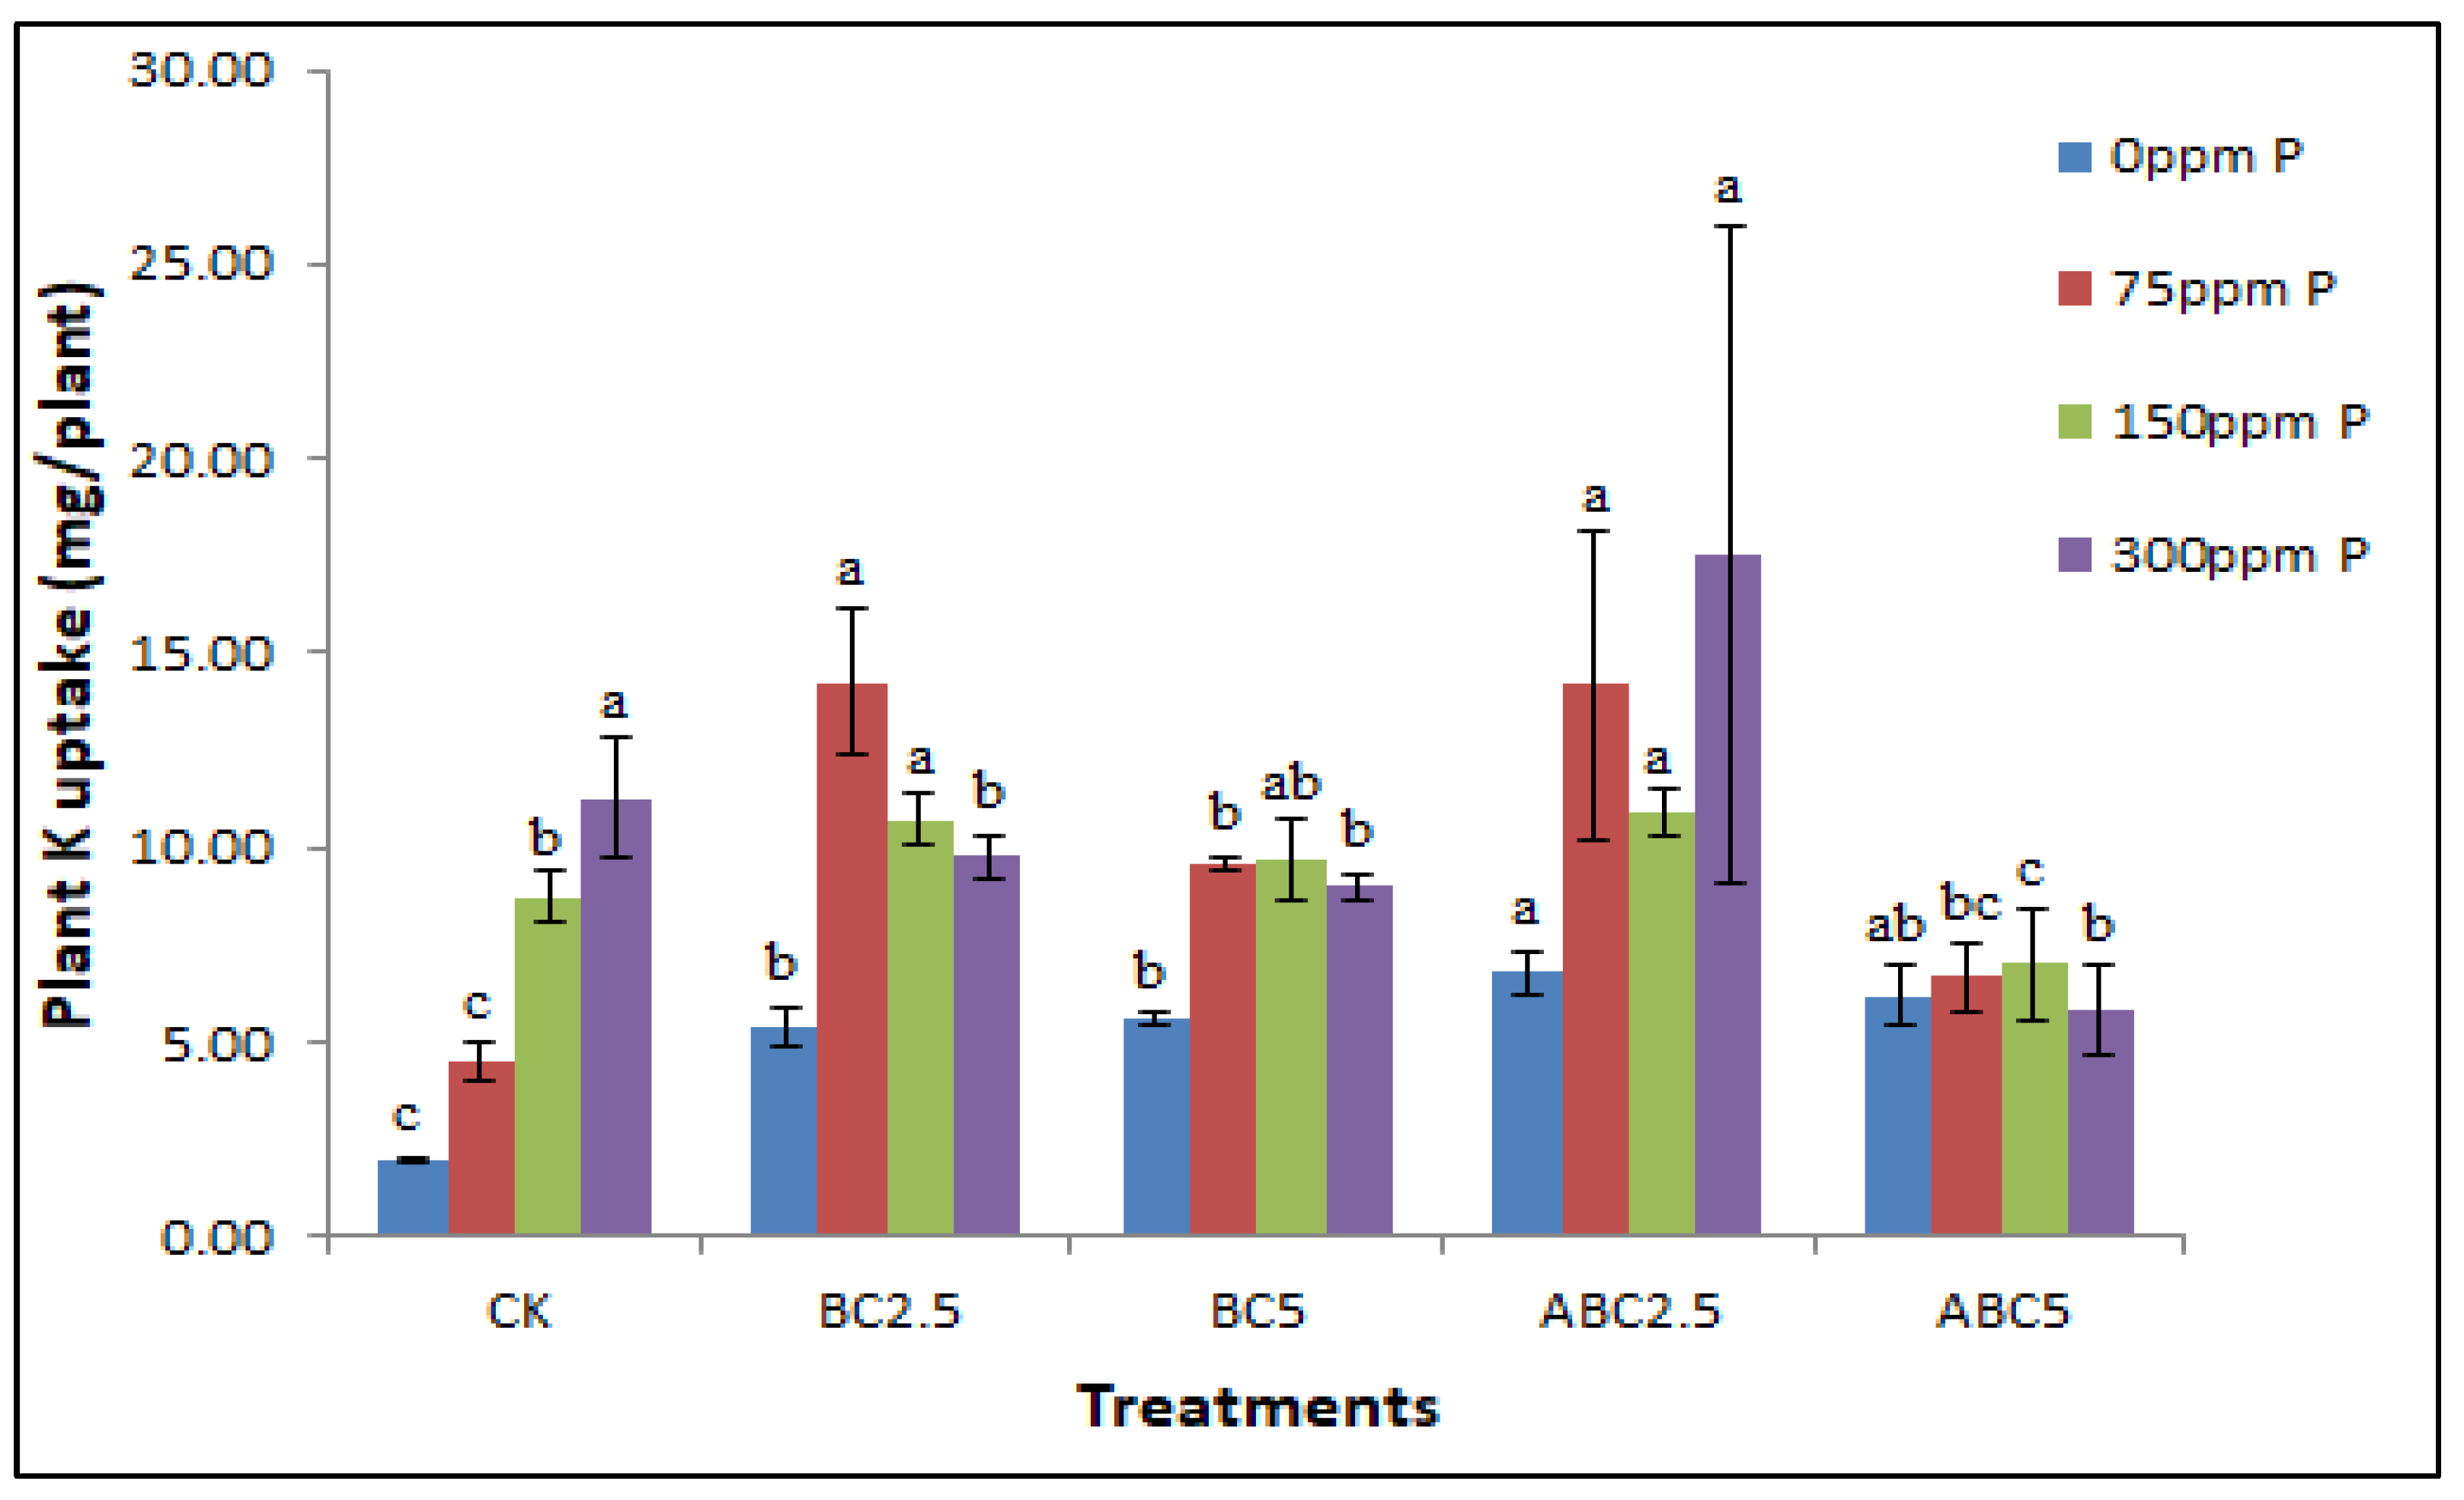
Figure 9.
Effects of BC and ABC applied at different rates with different P fertilizer application rates on plant K uptake in mg/plant. Means with different letters within each fertilizer rate across each treatment indicate significant differences according to the least significant difference (LSD) test at p < 0.05. CK = Control, BC2.5 = Biochar added at 2.5% w/w, BC5 = Biochar added at 5% w/w, ABC2.5 = Acidified biochar added at 2.5% w/w, and ABC5 = Acidified biochar added at 5% w/w.
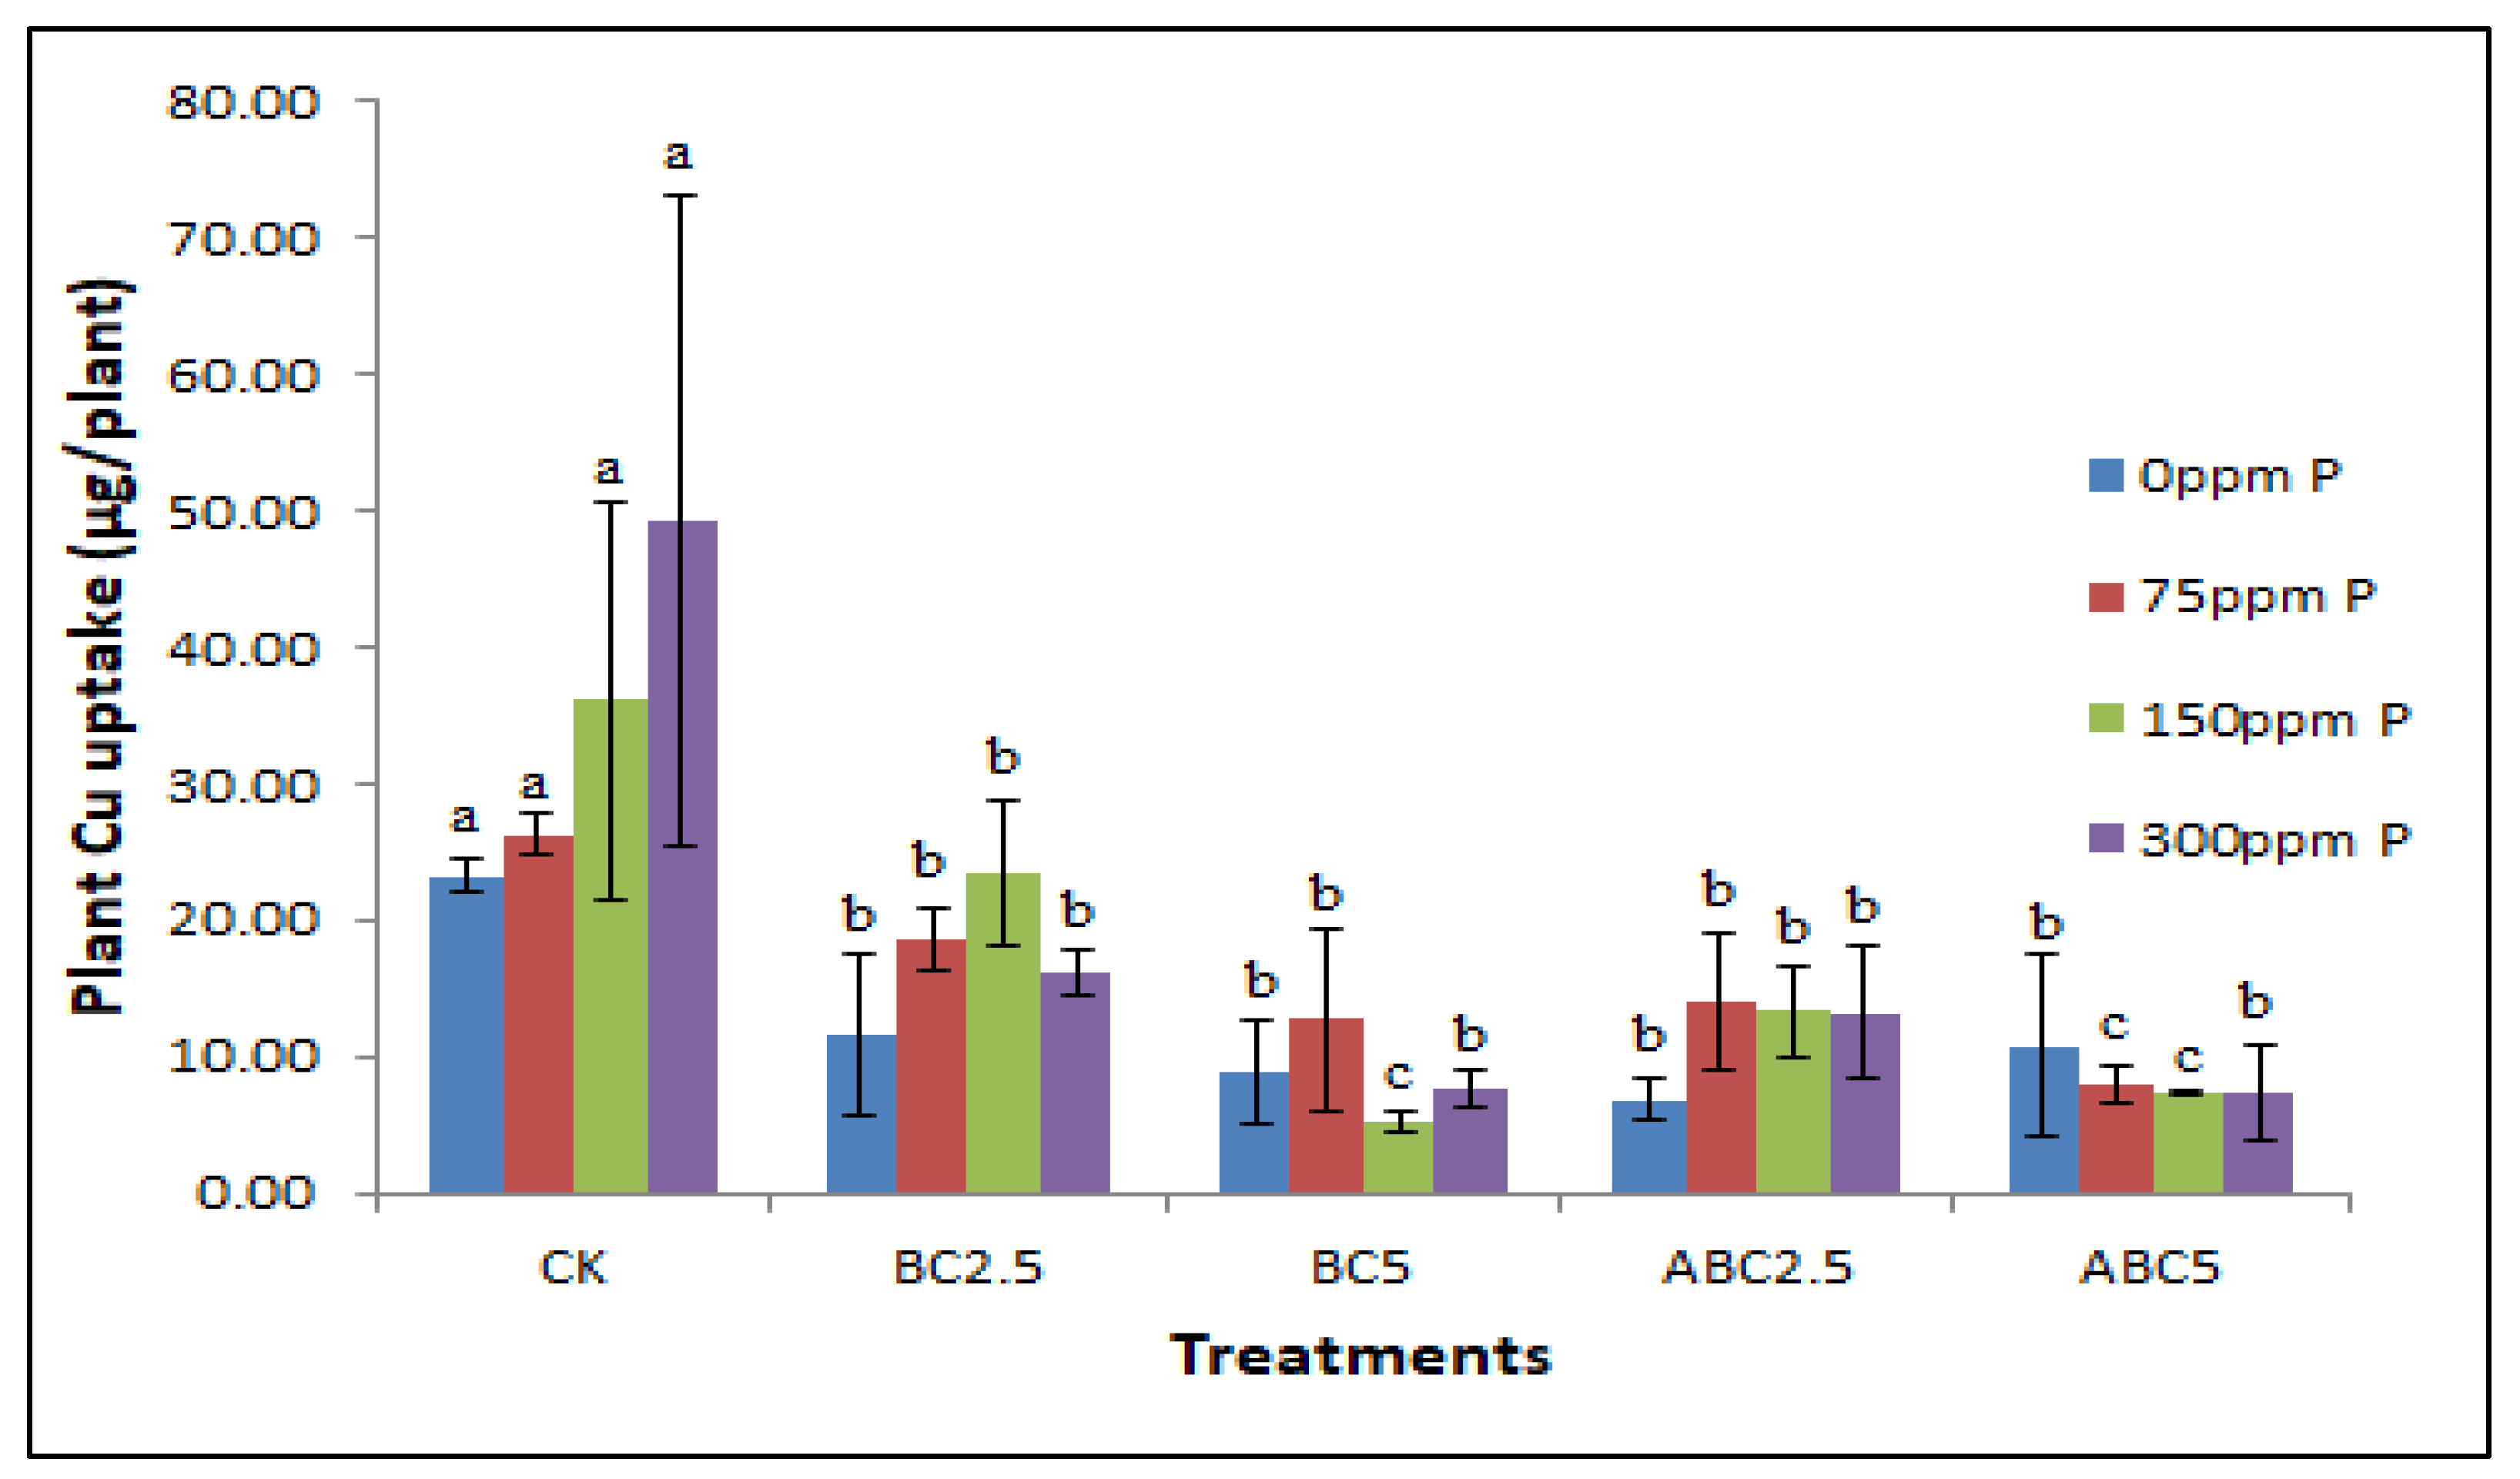
Figure 10.
Effects of BC and ABC applied at different rates with different P fertilizer application rates on Plant Cu uptake (µg/plant). Means with different letters within each fertilizer rate across each treatment indicate significant differences according to the least significant difference (LSD) test at p < 0.05. CK = Control, BC2.5 = Biochar added at 2.5% w/w, BC5 = Biochar added at 5% w/w, ABC2.5 = Acidified biochar added at 2.5% w/w, and ABC5 = Acidified biochar added at 5% w/w.
Figure 11.
Effects of BC and ABC applied at different rates with different P fertilizer application rates on Plant Fe uptake (µg/plant). Means with different letters within each fertilizer rate across each treatment indicate significant differences according to the least significant difference (LSD) test at p < 0.05. CK = Control, BC2.5 = Biochar added at 2.5% w/w, BC5 = Biochar added at 5% w/w, ABC2.5 = Acidified biochar added at 2.5% w/w, and ABC5 = Acidified biochar added at 5% w/w.
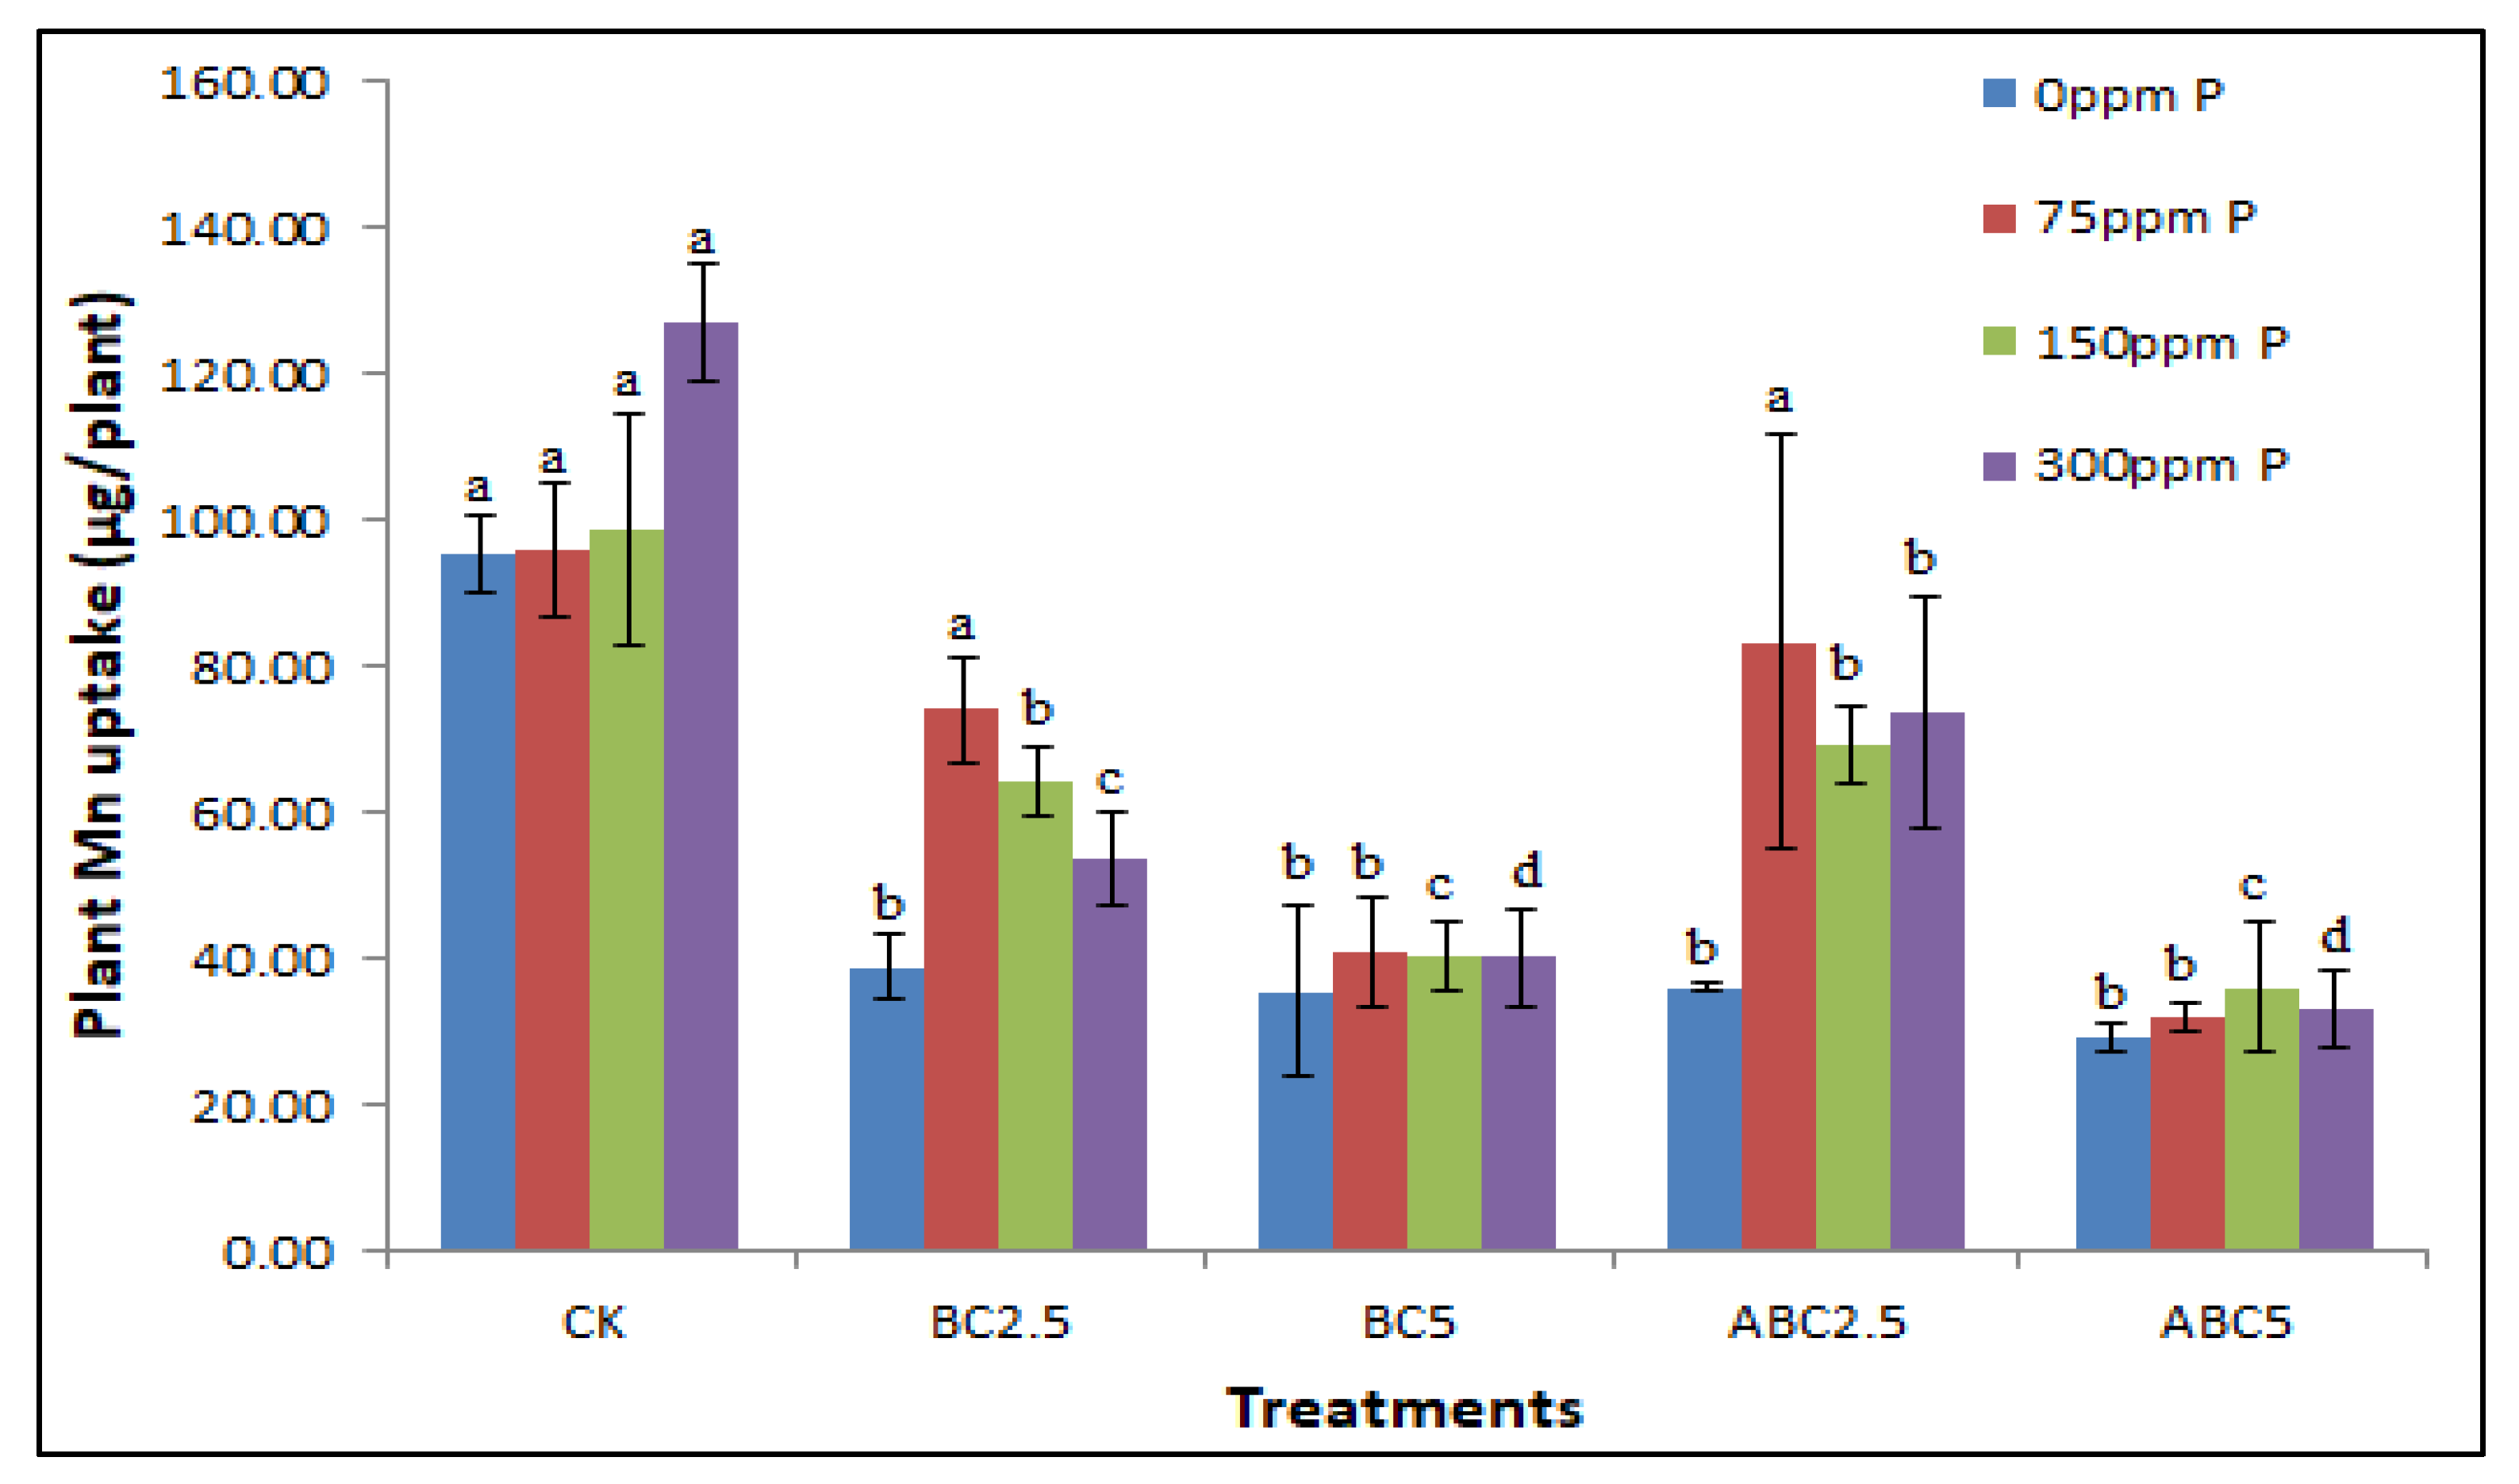
Figure 12.
Effects of BC and ABC applied at different rates with different P fertilizer application rates on Plant Mn uptake (µg/plant). Means with different letters within each fertilizer rate across each treatment indicate significant differences according to the least significant difference (LSD) test at p < 0.05. CK = Control, BC2.5 = Biochar added at 2.5% w/w, BC5 = Biochar added at 5% w/w, ABC2.5 = Acidified biochar added at 2.5% w/w, and ABC5 = Acidified biochar added at 5% w/w.
Figure 13.
Effects of BC and ABC applied at different rates with different P fertilizer application rates on Plant Zn uptake (µg/plant). Means with different letters within each fertilizer rate across each treatment indicate significant differences according to the least significant difference (LSD) test at p < 0.05. CK = Control, BC2.5 = Biochar added at 2.5% w/w, BC5 = Biochar added at 5% w/w, ABC2.5 = Acidified biochar added at 2.5% w/w, and ABC5 = Acidified biochar added at 5% w/w.
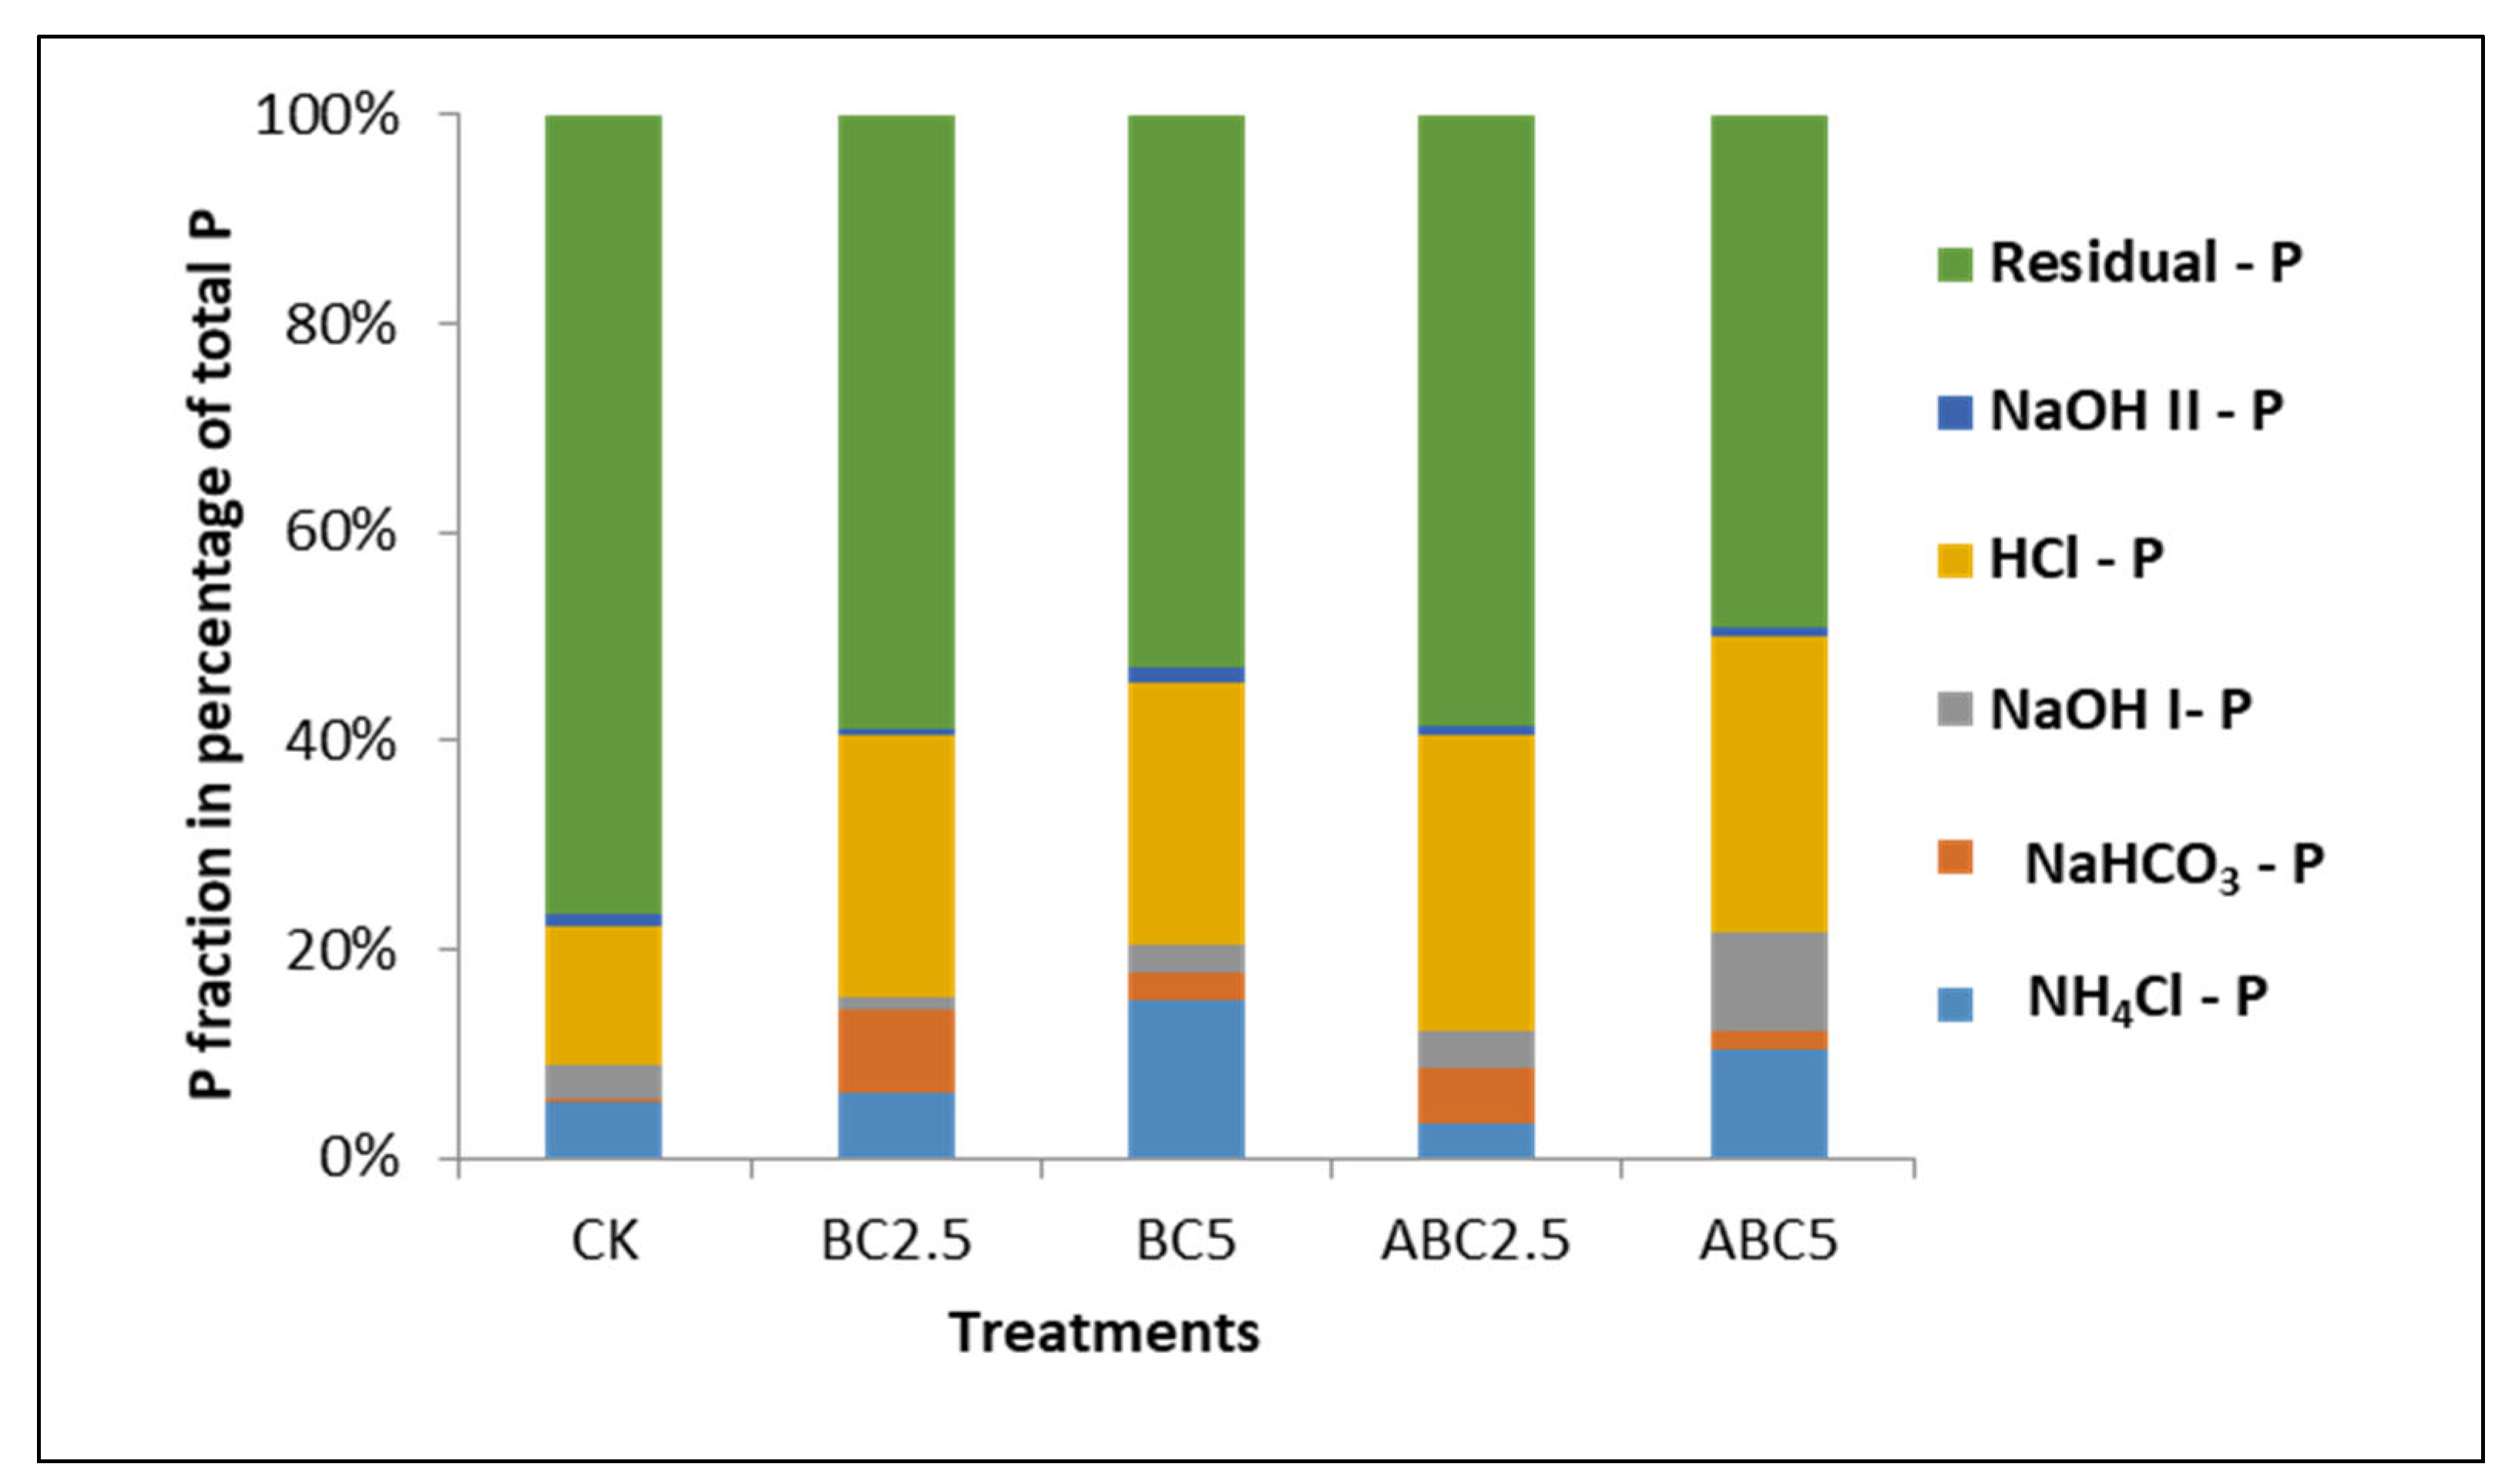
Figure 14.
Effect of BC and ABC applied at different rates on P fractionation on soil treated with 0 ppm P. CK = Control, BC2.5 = Biochar added at 2.5% w/w, BC5 = Biochar added at 5% w/w, ABC2.5 = Acidified biochar added at 2.5% w/w, and ABC5 = Acidified biochar added at 5% w/w.
Figure 14.
Effect of BC and ABC applied at different rates on P fractionation on soil treated with 0 ppm P. CK = Control, BC2.5 = Biochar added at 2.5% w/w, BC5 = Biochar added at 5% w/w, ABC2.5 = Acidified biochar added at 2.5% w/w, and ABC5 = Acidified biochar added at 5% w/w.
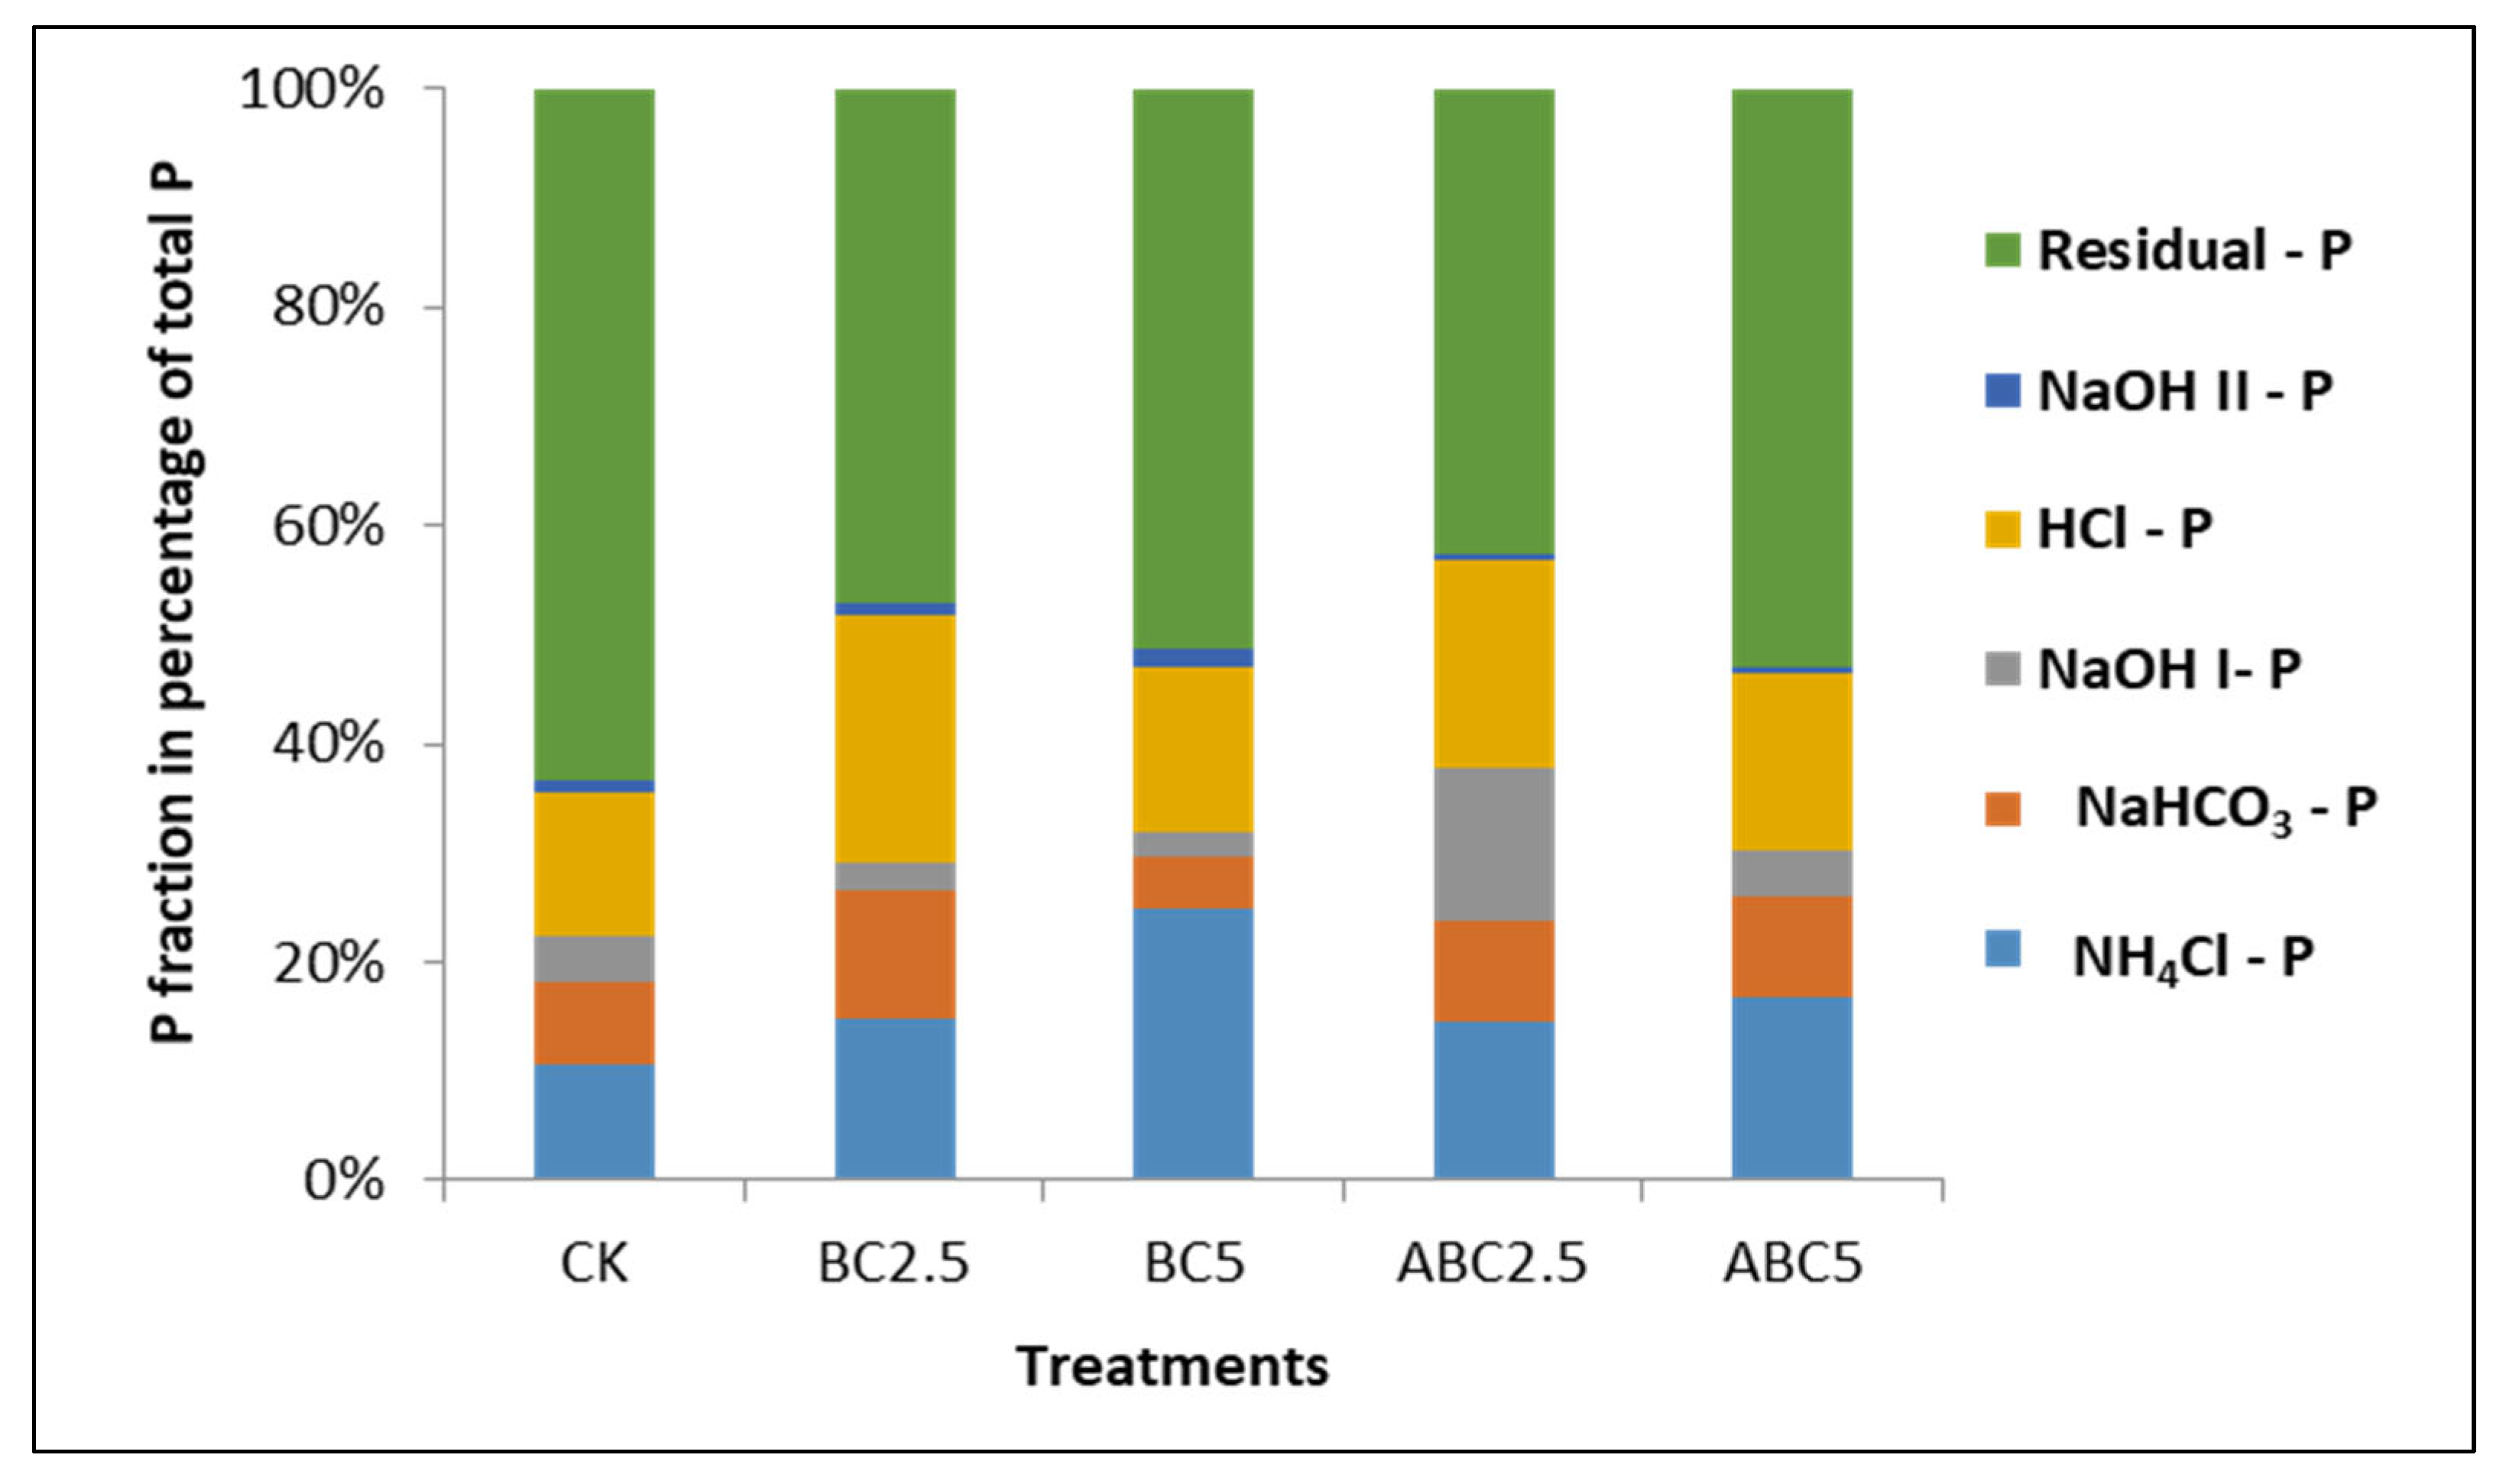
Figure 15.
Effect of BC and ABC applied at different rates on P fractionation on soil treated with 75 ppm P. CK = Control, BC2.5 = Biochar added at 2.5% w/w, BC5 = Biochar added at 5% w/w, ABC2.5 = Acidified biochar added at 2.5% w/w, and ABC5 = Acidified biochar added at 5% w/w.
Figure 15.
Effect of BC and ABC applied at different rates on P fractionation on soil treated with 75 ppm P. CK = Control, BC2.5 = Biochar added at 2.5% w/w, BC5 = Biochar added at 5% w/w, ABC2.5 = Acidified biochar added at 2.5% w/w, and ABC5 = Acidified biochar added at 5% w/w.
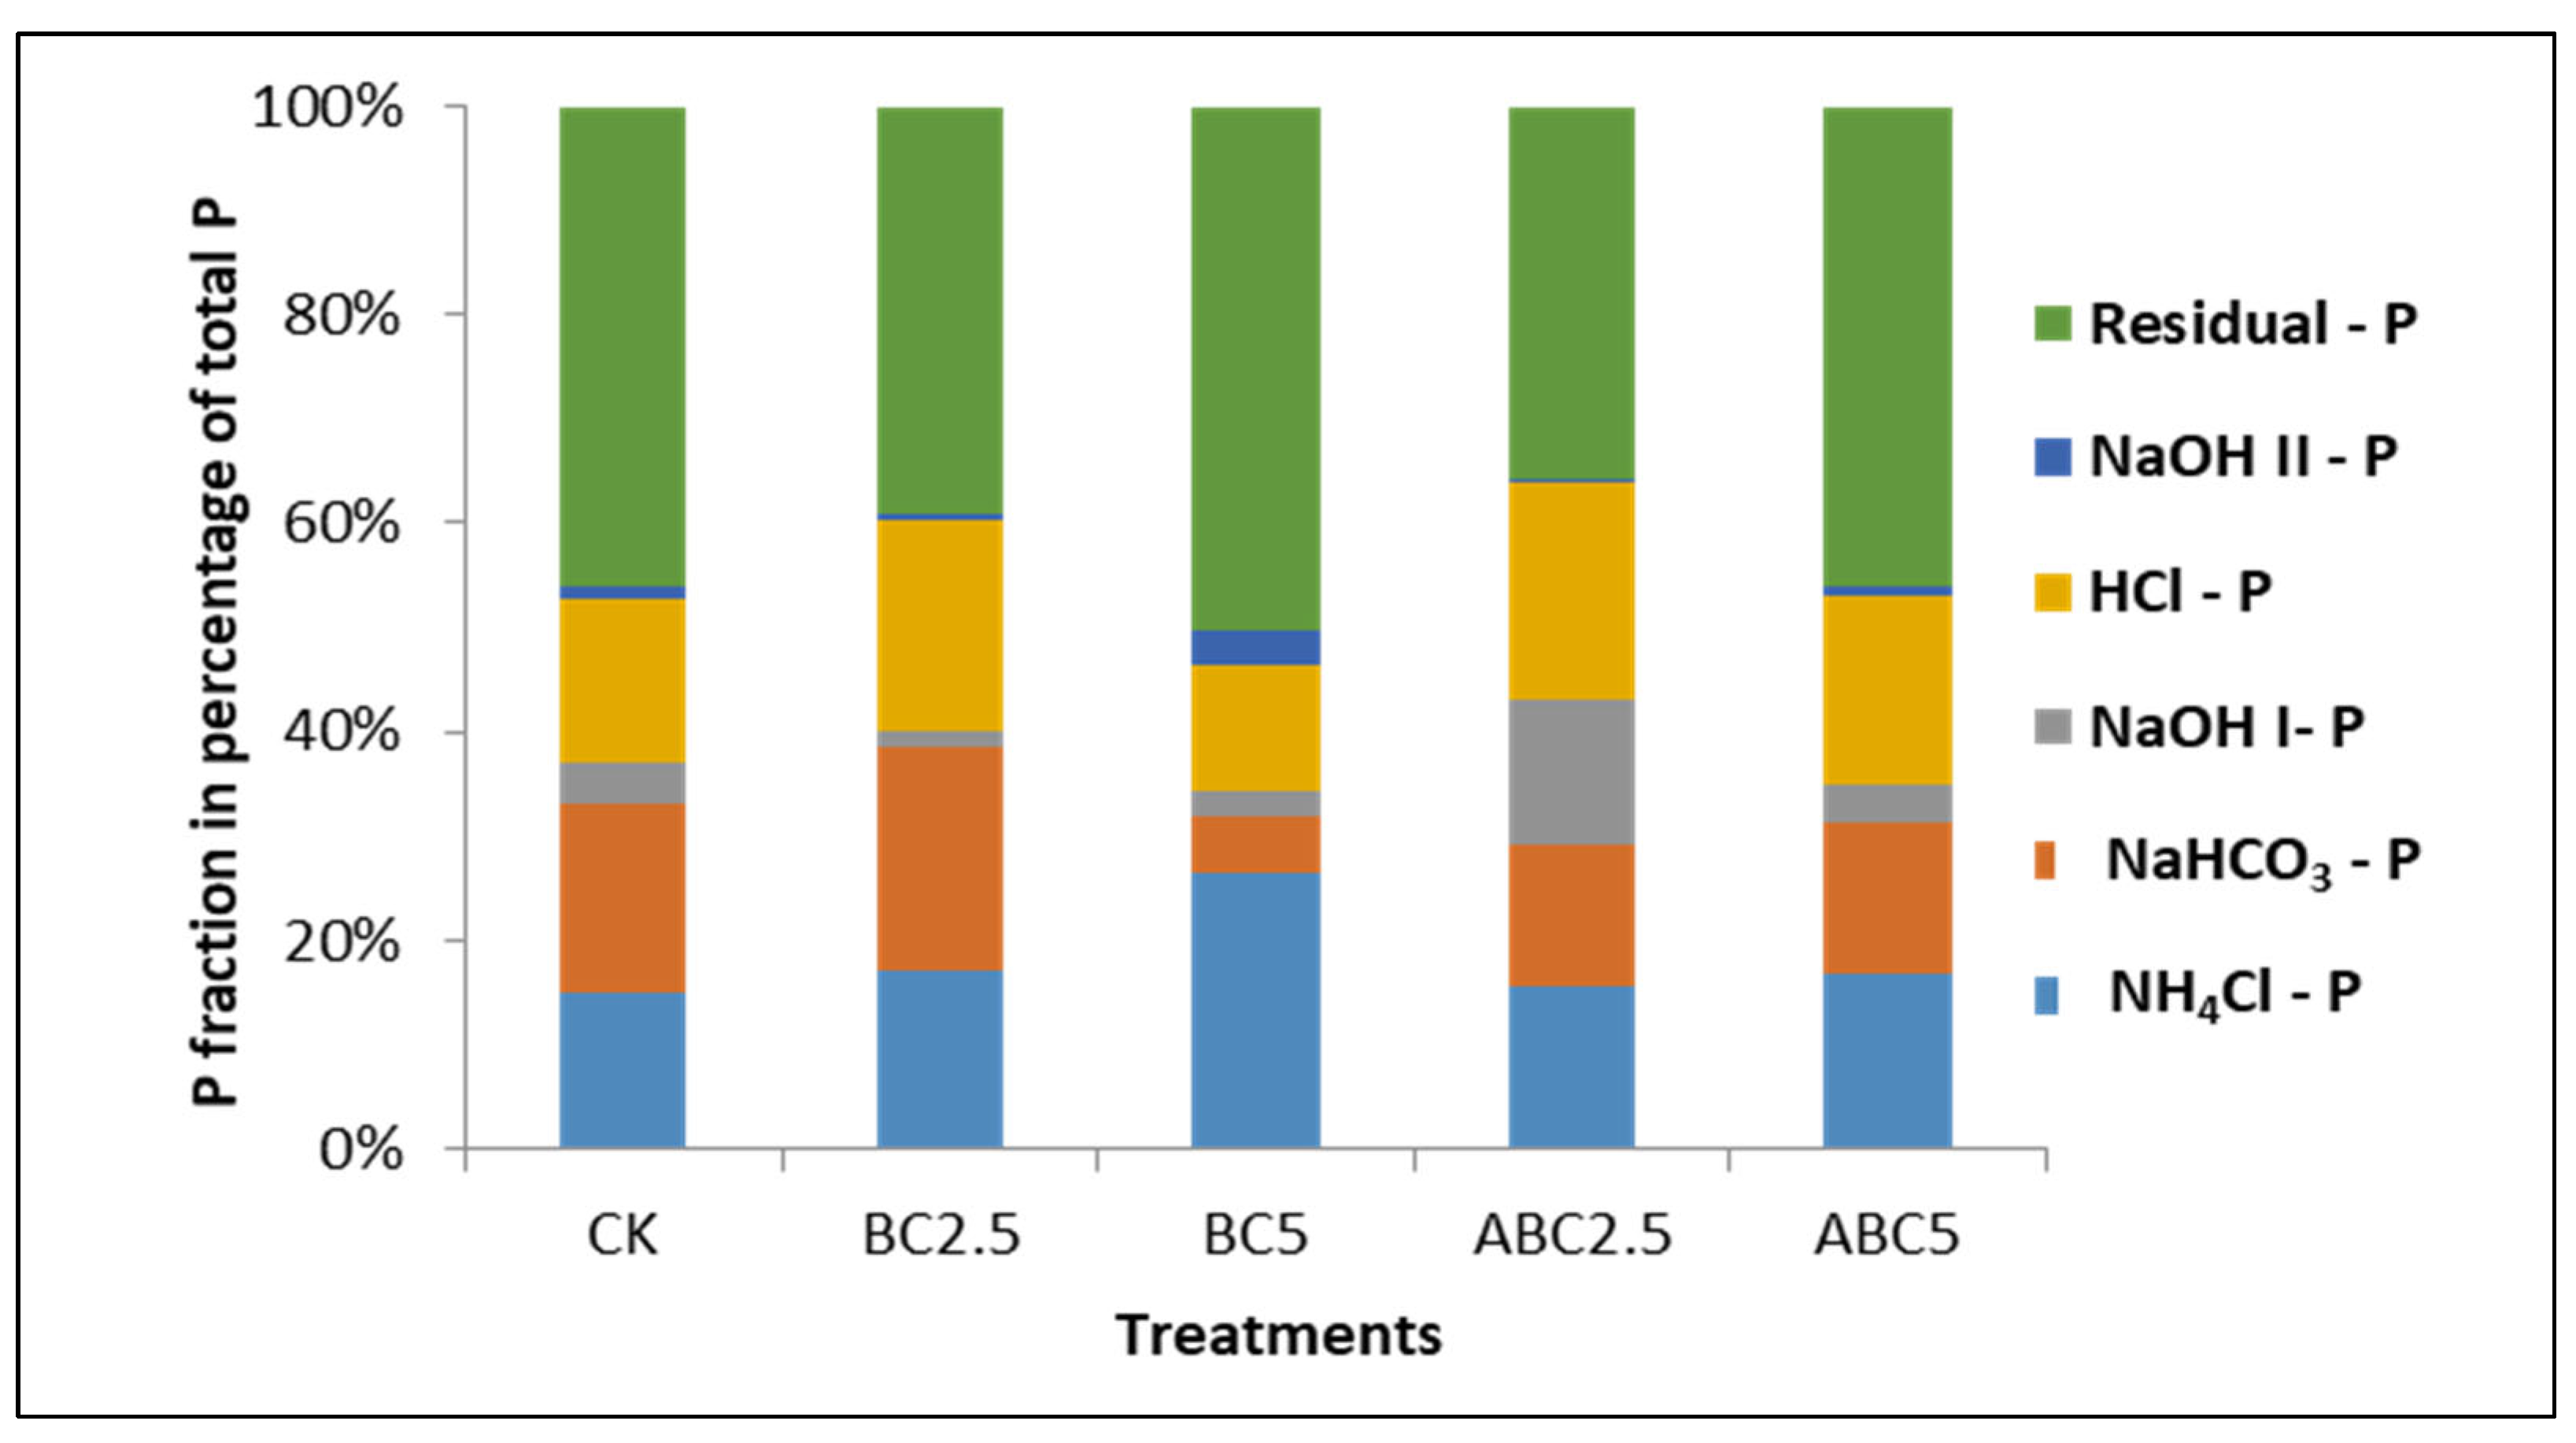
Figure 16.
Effect of BC and ABC applied at different rates on P fractionation on soil treated with 150 ppm P. CK = Control, BC2.5 = Biochar added at 2.5% w/w, BC5 = Biochar added at 5% w/w, ABC2.5 = Acidified biochar added at 2.5% w/w, and ABC5 = Acidified biochar added at 5% w/w.
Figure 16.
Effect of BC and ABC applied at different rates on P fractionation on soil treated with 150 ppm P. CK = Control, BC2.5 = Biochar added at 2.5% w/w, BC5 = Biochar added at 5% w/w, ABC2.5 = Acidified biochar added at 2.5% w/w, and ABC5 = Acidified biochar added at 5% w/w.
Figure 17.
Effect of BC and ABC applied at different rates on P fractionation on soil treated with 300 ppm P. CK = Control, BC2.5 = Biochar applied at 2.5% w/w, BC5 = Biochar applied at 5% w/w, ABC2.5 = Acidified biochar applied at 2.5% w/w, and ABC5 = Acidified biochar applied at 5% w/w.
Figure 17.
Effect of BC and ABC applied at different rates on P fractionation on soil treated with 300 ppm P. CK = Control, BC2.5 = Biochar applied at 2.5% w/w, BC5 = Biochar applied at 5% w/w, ABC2.5 = Acidified biochar applied at 2.5% w/w, and ABC5 = Acidified biochar applied at 5% w/w.
Table 1.
Properties of soil.
Table 1.
Properties of soil.
| | Sand | Silt | Clay | Textural Class | pH (1:2.5) | EC (dS/m) | CEC (meq/100 g) | SOM (g/kg) | CaCO3 (%) | P | Cu | Fe | Mn | Zn |
|---|
| % | AB-DTPA (mg/kg) |
|---|
| Soil | 95.62 | 1.25 | 3.13 | Sandy soil | 8.20 | 0.15 | 5.32 | 1.26 | 42.50 | 15.28 | 0.52 | 2.38 | 3.23 | nd |
Table 2.
Properties of Biochar (BC) and Acidified Biochar (ABC).
Table 2.
Properties of Biochar (BC) and Acidified Biochar (ABC).
| | Ph (1:10) | EC (dS/m) | CEC (meq/100 g) | Yield | Moisture | Volatile Matter | Ash | Fixed Carbon | Surface Area (m2/g) | Total P (mg/kg) | C | H | N |
|---|
| % | % |
|---|
| BC | 9.83 | 1.62 | 41.25 | 32.81 | 4.08 | 32.23 | 13.77 | 49.92 | 58.19 | 907.41 | 60.25 | 1.95 | 1.11 |
| ABC | 2.99 | 2.14 | 35.46 | - | 4.93 | 28.35 | 6.52 | 60.20 | 303.99 | 727.88 | 38.66 | 2.30 | 0.61 |
Table 3.
Impact of BC and ABC applied at different rates with different P fertilizer application rates on AB-DTPA extractable P of soil (mg kg−1).
Table 3.
Impact of BC and ABC applied at different rates with different P fertilizer application rates on AB-DTPA extractable P of soil (mg kg−1).
| Treatment | P Application Rate (ppm) |
|---|
| 0 | 75 | 150 | 300 | LSD |
|---|
| CK | 10.505 c | 45.741 c | 68.104 bc | 89.904 b | 8.324 |
| BC2.5 | 16.707 b | 69.514 a | 99.018 a | 86.333 b | 11.717 |
| BC5 | 37.848 a | 57.956 b | 65.661 bc | 106.065 a | 11.800 |
| ABC2.5 | 8.062 c | 51.097 bc | 61.997 c | 88.306 b | 10.831 |
| ABC5 | 8.344 c | 50.533 bc | 70.547 b | 88.964 b | 5.490 |
| LSD | 6.902 | 9.846 | 8.907 | 11.887 | |
| p-value | 0.0000 | 0.0003 | 0.0000 | 0.0139 | |
| F-value | 49.7413 | 14.9922 | 41.8533 | 5.4199 | |
Table 4.
Influence of BC and ABC applied at different rates with different P fertilizer application rates on soil Extractable K in mg/kg.
Table 4.
Influence of BC and ABC applied at different rates with different P fertilizer application rates on soil Extractable K in mg/kg.
| Treatment | P Application Rate (ppm) |
|---|
| 0 | 75 | 150 | 300 | LSD |
|---|
| CK | 118.33 c | 112.00 c | 103.00 c | 102.83 c | 18.16 |
| BC2.5 | 547.33 b | 711.67 b | 711.67 b | 725.00 b | 210.61 |
| BC5 | 1247.50 a | 1163.33 a | 1231.67 a | 1470.83 a | 376.59 |
| ABC2.5 | 75.50 c | 78.83 c | 86.83 c | 83.17 c | 21.56 |
| ABC5 | 103.83 c | 110.17 c | 98.00 c | 106.67 c | 16.09 |
| LSD | 159.67 | 70.14 | 147.33 | 294.13 | |
| p-value | 0.0000 | 0.0000 | 0.0000 | 0.0000 | |
| F-value | 149.2737 | 722.3653 | 183.1290 | 64.3887 | |
Table 5.
Effects of BC and ABC applied at different rates with different P fertilizer application rates on soil extractable Na in mg/kg.
Table 5.
Effects of BC and ABC applied at different rates with different P fertilizer application rates on soil extractable Na in mg/kg.
| Treatment | P Application Rate (ppm) |
|---|
| 0 | 75 | 150 | 300 | LSD |
|---|
| CK | 227.00 b | 222.17 c | 246.50 c | 224.67 c | 56.43 |
| BC2.5 | 461.17 a | 327.83 b | 357.00 b | 289.83 b | 30.70 |
| BC5 | 440.67 a | 441.00 a | 408.17 a | 405.67 a | 92.52 |
| ABC2.5 | 217.33 b | 211.83 c | 216.83 d | 183.17 cd | 34.95 |
| ABC5 | 164.67 c | 165.67 d | 160.67 e | 136.67 d | 30.49 |
| LSD | 51.50 | 51.15 | 32.75 | 68.16 | |
| p-value | 0.0512 | 0.0000 | 0.0000 | 0.0000 | |
| F-value | 0.6321 | 70.6283 | 146.3657 | 35.4616 | |
Table 6.
Effects of BC and ABC applied at different rates with different P fertilizer application rates on soil CEC in meq/100 g soil.
Table 6.
Effects of BC and ABC applied at different rates with different P fertilizer application rates on soil CEC in meq/100 g soil.
| Treatment | P Application Rate (ppm) |
|---|
| 0 | 75 | 150 | 300 | LSD |
|---|
| CK | 5.246 c | 4.681 c | 4.894 c | 5.372 c | 0.774 |
| BC2.5 | 6.280 b | 6.976 ab | 6.609 b | 6.300 bc | 0.590 |
| BC5 | 7.285 a | 7.681 a | 7.662 a | 7.913 a | 0.590 |
| ABC2.5 | 6.768 ab | 6.502 b | 6.894 b | 6.560 b | 1.529 |
| ABC5 | 7.382 a | 7.522 a | 7.005 b | 6.460 b | 1.136 |
| LSD | 0.820 | 1.077 | 0.767 | 1.327 | |
| p-value | 0.0002 | 0.0002 | 0.0000 | 0.0057 | |
| F-value | 17.0671 | 18.9271 | 27.4386 | 7.0798 | |
Table 7.
Effects of BC and ABC applied at different rates with different P fertilizer application rates on soil OM in g kg−1.
Table 7.
Effects of BC and ABC applied at different rates with different P fertilizer application rates on soil OM in g kg−1.
| Treatment | P Application Rate (ppm) |
|---|
| 0 | 75 | 150 | 300 | LSD |
|---|
| CK | 1.554 c | 1.566 c | 1.350 c | 1.354 c | 0.597 |
| BC2.5 | 2.436 b | 3.453 b | 3.871 bc | 3.627 b | 0.843 |
| BC5 | 6.146 a | 6.750 a | 7.948 a | 7.539 a | 2.761 |
| ABC2.5 | 2.743 b | 2.791 bc | 2.843 c | 3.093 bc | 1.891 |
| ABC5 | 5.240 a | 6.688 a | 5.172 b | 6.246 a | 3.303 |
| LSD | 1.121 | 2.617 | 1.842 | 2.379 | |
| p-value | 0.0000 | 0.0007 | 0.0000 | 0.0002 | |
| F-value | 46.2674 | 12.1833 | 27.8049 | 16.5331 | |
Table 8.
Effects of BC and ABC applied at different rates with different P fertilizer application rates on plant P concentration (g kg−1).
Table 8.
Effects of BC and ABC applied at different rates with different P fertilizer application rates on plant P concentration (g kg−1).
| Treatment | P Application Rate (ppm) |
|---|
| 0 | 75 | 150 | 300 | LSD |
|---|
| CK | 1.30 ab | 1.39 a | 1.51 a | 1.44 ab | 0.53 |
| BC2.5 | 1.17 b | 1.47 a | 1.63 a | 1.71 a | 0.20 |
| BC5 | 1.44 a | 1.48 a | 1.51 a | 1.48 ab | 0.11 |
| ABC2.5 | 0.93 c | 1.01 b | 0.90 c | 1.17 b | 0.20 |
| ABC5 | 1.12 bc | 1.43 a | 1.22 b | 1.35 b | 0.14 |
| LSD | 0.26 | 0.31 | 0.24 | 0.37 | |
| p-value | 0.0032 | 0.0094 | 0.0000 | 0.0292 | |
| F-value | 8.3242 | 6.1041 | 23.0720 | 4.2329 | |
Table 9.
Effects of BC and ABC applied at different rates with different P fertilizer application rates on Plant K concentration (g/kg).
Table 9.
Effects of BC and ABC applied at different rates with different P fertilizer application rates on Plant K concentration (g/kg).
| Treatment | P Application Rate (ppm) |
|---|
| 0 | 75 | 150 | 300 | LSD |
|---|
| CK | 10.80 c | 11.07 b | 18.22 a | 18.30 a | 2.70 |
| BC2.5 | 10.43 c | 12.67 b | 12.73 b | 15.28 a | 2.24 |
| BC5 | 16.92 a | 21.37 a | 18.59 a | 16.77 a | 3.25 |
| ABC2.5 | 12.11 c | 11.67 b | 9.46 c | 15.71 a | 10.04 |
| ABC5 | 14.00 b | 12.89 b | 12.78 b | 10.37 a | 4.43 |
| LSD | 2.16 | 4.43 | 3.05 | 8.51 | |
| p-value | 0.0001 | 0.0005 | 0.0000 | 0.1957 | |
| F-value | 22.8927 | 13.6901 | 25.0178 | 1.8517 | |
Table 10.
Effects of BC and ABC applied at different rates with different P fertilizer application rates on Plant Cu concentration (mg/kg).
Table 10.
Effects of BC and ABC applied at different rates with different P fertilizer application rates on Plant Cu concentration (mg/kg).
| Treatment | P Application Rate (ppm) |
|---|
| 0 | 75 | 150 | 300 | LSD |
|---|
| CK | 87.75 a | 20.75 a | 64.83 a | 105.50 a | 95.92 |
| BC2.5 | 22.67 a | 45.58 a | 28.00 b | 86.92 ab | 39.77 |
| BC5 | 74.58 a | 28.50 a | 9.83 b | 39.75 abc | 119.89 |
| ABC2.5 | 12.08 a | 47.75 a | 11.50 b | 28.42 b | 82.30 |
| ABC5 | 24.00 a | 15.58 a | 13.67 b | 12.92 c | 18.78 |
| LSD | 100.18 | 70.33 | 40.65 | 85.25 | |
| p-value | 0.2110 | 0.6462 | 0.0194 | 0.0593 | |
| F-value | 1.7721 | 0.6397 | 4.8655 | 3.2531 | |
Table 11.
Effects of BC and ABC applied at different rates with different P fertilizer application rates on Plant Fe concentration (mg/kg).
Table 11.
Effects of BC and ABC applied at different rates with different P fertilizer application rates on Plant Fe concentration (mg/kg).
| Treatment | P Application Rate (ppm) |
|---|
| 0 | 75 | 150 | 300 | LSD |
|---|
| CK | 1629.75 a | 517.25 a | 1497.92 a | 1363.17 a | 1214.91 |
| BC2.5 | 796.25 ab | 943.17 a | 1709.00 a | 1176.83 a | 1878.85 |
| BC5 | 1596.75 a | 1571.33 a | 829.17 a | 685.25 a | 1522.86 |
| ABC2.5 | 666.25 b | 632.33 a | 513.17 a | 1797.00 a | 1737.75 |
| ABC5 | 588.25 b | 749.00 a | 717.08 a | 369.00 a | 800.27 |
| LSD | 1057.43 | 1078.99 | 1678.98 | 1741.41 | |
| p-value | 0.0467 | 0.1375 | 0.2890 | 0.2559 | |
| F-value | 3.5688 | 2.2381 | 1.4462 | 1.5707 | |
Table 12.
Effects of BC and ABC applied at different rates with different P fertilizer application rates on Plant Mn concentration (mg/kg).
Table 12.
Effects of BC and ABC applied at different rates with different P fertilizer application rates on Plant Mn concentration (mg/kg).
| Treatment | P Application Rate (ppm) |
|---|
| 0 | 75 | 150 | 300 | LSD |
|---|
| CK | 107.33 a | 65.83 a | 112.58 a | 158.67 a | 154.70 |
| BC2.5 | 74.92 a | 65.83 a | 76.50 ab | 83.58 a | 21.23 |
| BC5 | 107.00 a | 91.58 a | 77.42 ab | 74.17 a | 49.83 |
| ABC2.5 | 64.58 a | 68.00 a | 60.00 b | 65.50 a | 32.42 |
| ABC5 | 65.00 a | 61.83 b | 65.67 b | 58.33 a | 20.07 |
| LSD | 47.13 | 32.42 | 54.36 | 121.42 | |
| p-value | 0.0613 | 0.1645 | 0.1511 | 0.2295 | |
| F-value | 3.2103 | 2.0392 | 2.1331 | 1.6834 | |
Table 13.
Effects of BC and ABC applied at different rates with different P fertilizer application rates on Plant Zn concentration (mg/kg).
Table 13.
Effects of BC and ABC applied at different rates with different P fertilizer application rates on Plant Zn concentration (mg/kg).
| Treatment | P Application Rate (ppm) |
|---|
| 0 | 75 | 150 | 300 | LSD |
|---|
| CK | 101.45 a | 82.08 a | 236.00 a | 345.58 a | 76.07 |
| BC2.5 | 80.08 a | 87.88 a | 255.58 a | 42.50 c | 67.14 |
| BC5 | 66.00 ab | 39.00 b | 35.08 b | 106.08 b | 59.08 |
| ABC2.5 | 30.00 b | 34.42 b | 18.75 b | 149.75 b | 27.12 |
| ABC5 | 36.83 b | 32.17 b | 230.42 a | 24.75 c | 53.05 |
| LSD | 52.58 | 43.64 | 58.78 | 68.64 | |
| p-value | 0.0197 | 0.0102 | 0.0000 | 0.0000 | |
| F-value | 4.8392 | 5.9630 | 60.2873 | 52.8265 | |
Table 14.
Effects of BC and ABC applied at different rates with different P fertilizer application rates on plant height in cm.
Table 14.
Effects of BC and ABC applied at different rates with different P fertilizer application rates on plant height in cm.
| Treatment | P Application Rate (ppm) |
|---|
| 0 | 75 | 150 | 300 | LSD |
|---|
| CK | 9.23 e | 17.84 d | 20.54 d | 27.68 c | 2.57 |
| BC2.5 | 23.01 b | 38.60 b | 34.58 b | 28.91 b | 1.65 |
| BC5 | 15.59 d | 19.24 d | 24.26 c | 24.81 d | 1.20 |
| ABC2.5 | 25.56 a | 46.16 a | 38.51 a | 38.27 a | 1.81 |
| ABC5 | 18.57 c | 22.58 c | 24.73 c | 25.12 d | 1.15 |
| LSD | 1.90 | 1.87 | 1.88 | 0.85 | |
| p-value | 0.0000 | 0.0000 | 0.0000 | 0.0000 | |
| F-value | 171.7498 | 695.1940 | 247.5158 | 631.5768 | |
Table 15.
Effects of BC and ABC applied at different rates with different P fertilizer application rates on plant dry weight in g/pot.
Table 15.
Effects of BC and ABC applied at different rates with different P fertilizer application rates on plant dry weight in g/pot.
| Treatment | P Application Rate (ppm) |
|---|
| 0 | 75 | 150 | 300 | LSD |
|---|
| CK | 0.547 e | 1.222 d | 1.436 d | 1.846 b | 0.142 |
| BC2.5 | 1.547 b | 3.376 b | 2.521 b | 1.923 b | 0.203 |
| BC5 | 0.991 d | 1.350 d | 1.564 cd | 1.615 c | 0.114 |
| ABC2.5 | 1.675 a | 3.667 a | 3.462 a | 3.368 a | 0.195 |
| ABC5 | 1.333 c | 1.547 c | 1.632 c | 1.701 c | 0.137 |
| LSD | 0.101 | 0.201 | 0.164 | 0.140 | |
| p-value | 0.0000 | 0.0000 | 0.0000 | 0.0000 | |
| F-value | 309.5435 | 523.8641 | 417.3279 | 402.9944 | |


