Article

Tracking Wind Deposits on Fluvisols in a Citrus Orchard in Southeast Spain: A Test in Real Time

by
Carlos Asensio-Amador
1,
Antonio Giménez
1,
José Luis Torres
1,
Alejandro I. Monterroso
2 and
Carlos Asensio
3,*
1
Department of Enginnering, University of Almería, 04120 Almería, Spain
2
Department of Soils, Chapingo Autonomous University, Texcoco 56230, Mexico
3
Department of Agronomy, Campus of International Excellence (CEIA3), CIAIMBITAL, University of Almeria, 04120 Almería, Spain
*
Author to whom correspondence should be addressed.
Agriculture 2022, 12(12), 2138; https://doi.org/10.3390/agriculture12122138
Submission received: 19 October 2022 / Revised: 5 December 2022 / Accepted: 9 December 2022 / Published: 12 December 2022
(This article belongs to the Special Issue Soil Erosion Modeling and Monitoring)

Abstract

:
We used wind-transported particle collectors of our own inhouse design to monitor the sediment flow in a citrus orchard in Southeast Spain. These collectors, which can differentiate sediment collected by direction of origin, are very efficient, economical, and easy to manufacture from thermoplastic filaments with an industrial 3D printer. Data were acquired from six vaned masts, each with four collectors at different heights, and on one of those masts, the collectors included load cells with one end attached to the collector floor and the other end to each oriented compartment in the collectors. The load cell values were interpreted in real time by a microcontroller and amplifier. The remote monitoring system was developed with an internet of things (IoT) platform. The results showed clear predominance of winds from the Northeast after dark, and from the South during the middle of the day. After analyzing the sediment transport rates and their balance, we found that those being deposited in the citrus orchard from the Northeast had a higher carbonate content (mainly calcite), which had an aggregating and therefore stabilizing effect against wind erosion of the soil. Furthermore, significant amounts of highly adhesive phyllosilicates were captured by the upper traps, which also contributed to reducing soil wind erodibility because of their adhesiveness. However, the sediments from the South with much more total transported mass were not deposited in the study zone, but leeward of it and contained a large amount of quartz, promoting abrasion and increasing wind erodibility of the soil.

1. Introduction

The phenomenon of soil wind erosion is responsible for important problems in agronomy and the environment in general, with negative repercussions on the population, especially in arid and semiarid zones where winds are often strong and precipitation is scarce [1,2,3,4]. There is therefore a need for research in these areas to be able to advise in decision-making and environmental policy design [5].
In tree crops, there is usually a larger contribution of plant remains in the soil and natural vegetation, favoring its aggregation. Moreover, soil loss from wind is reduced as windspeed is slowed down, increasing capture of transported material [6,7,8]. Nevertheless, cultivation causes loss of organic matter and reduces stability of the aggregates in dry medium-texture soils, which conditions an increase in the erodible fraction of the soil by wind [9,10,11]. Under the absence of conservationist strategies, which usually occur in secluded areas, grazing, abandonment of farmlands, and deforestation increase the effects of wind erosion, producing significant loss of soil material, mainly from the most fertile layers [12]. Along with the loss of organic material and nutrients, the effect of soil being dried out by the wind promotes surface compaction [13].
Our main objectives were to analyze the total deposited or lost material by the wind in soil in a citrus orchard in Southeast Spain, find the quali and semiquantitative variance on transported soil minerals at different times and provenances, and evaluate the possible effects on the soil with the crop studied. It was also intended to test the application of new devices that enable sediment capture to be monitored in real time.

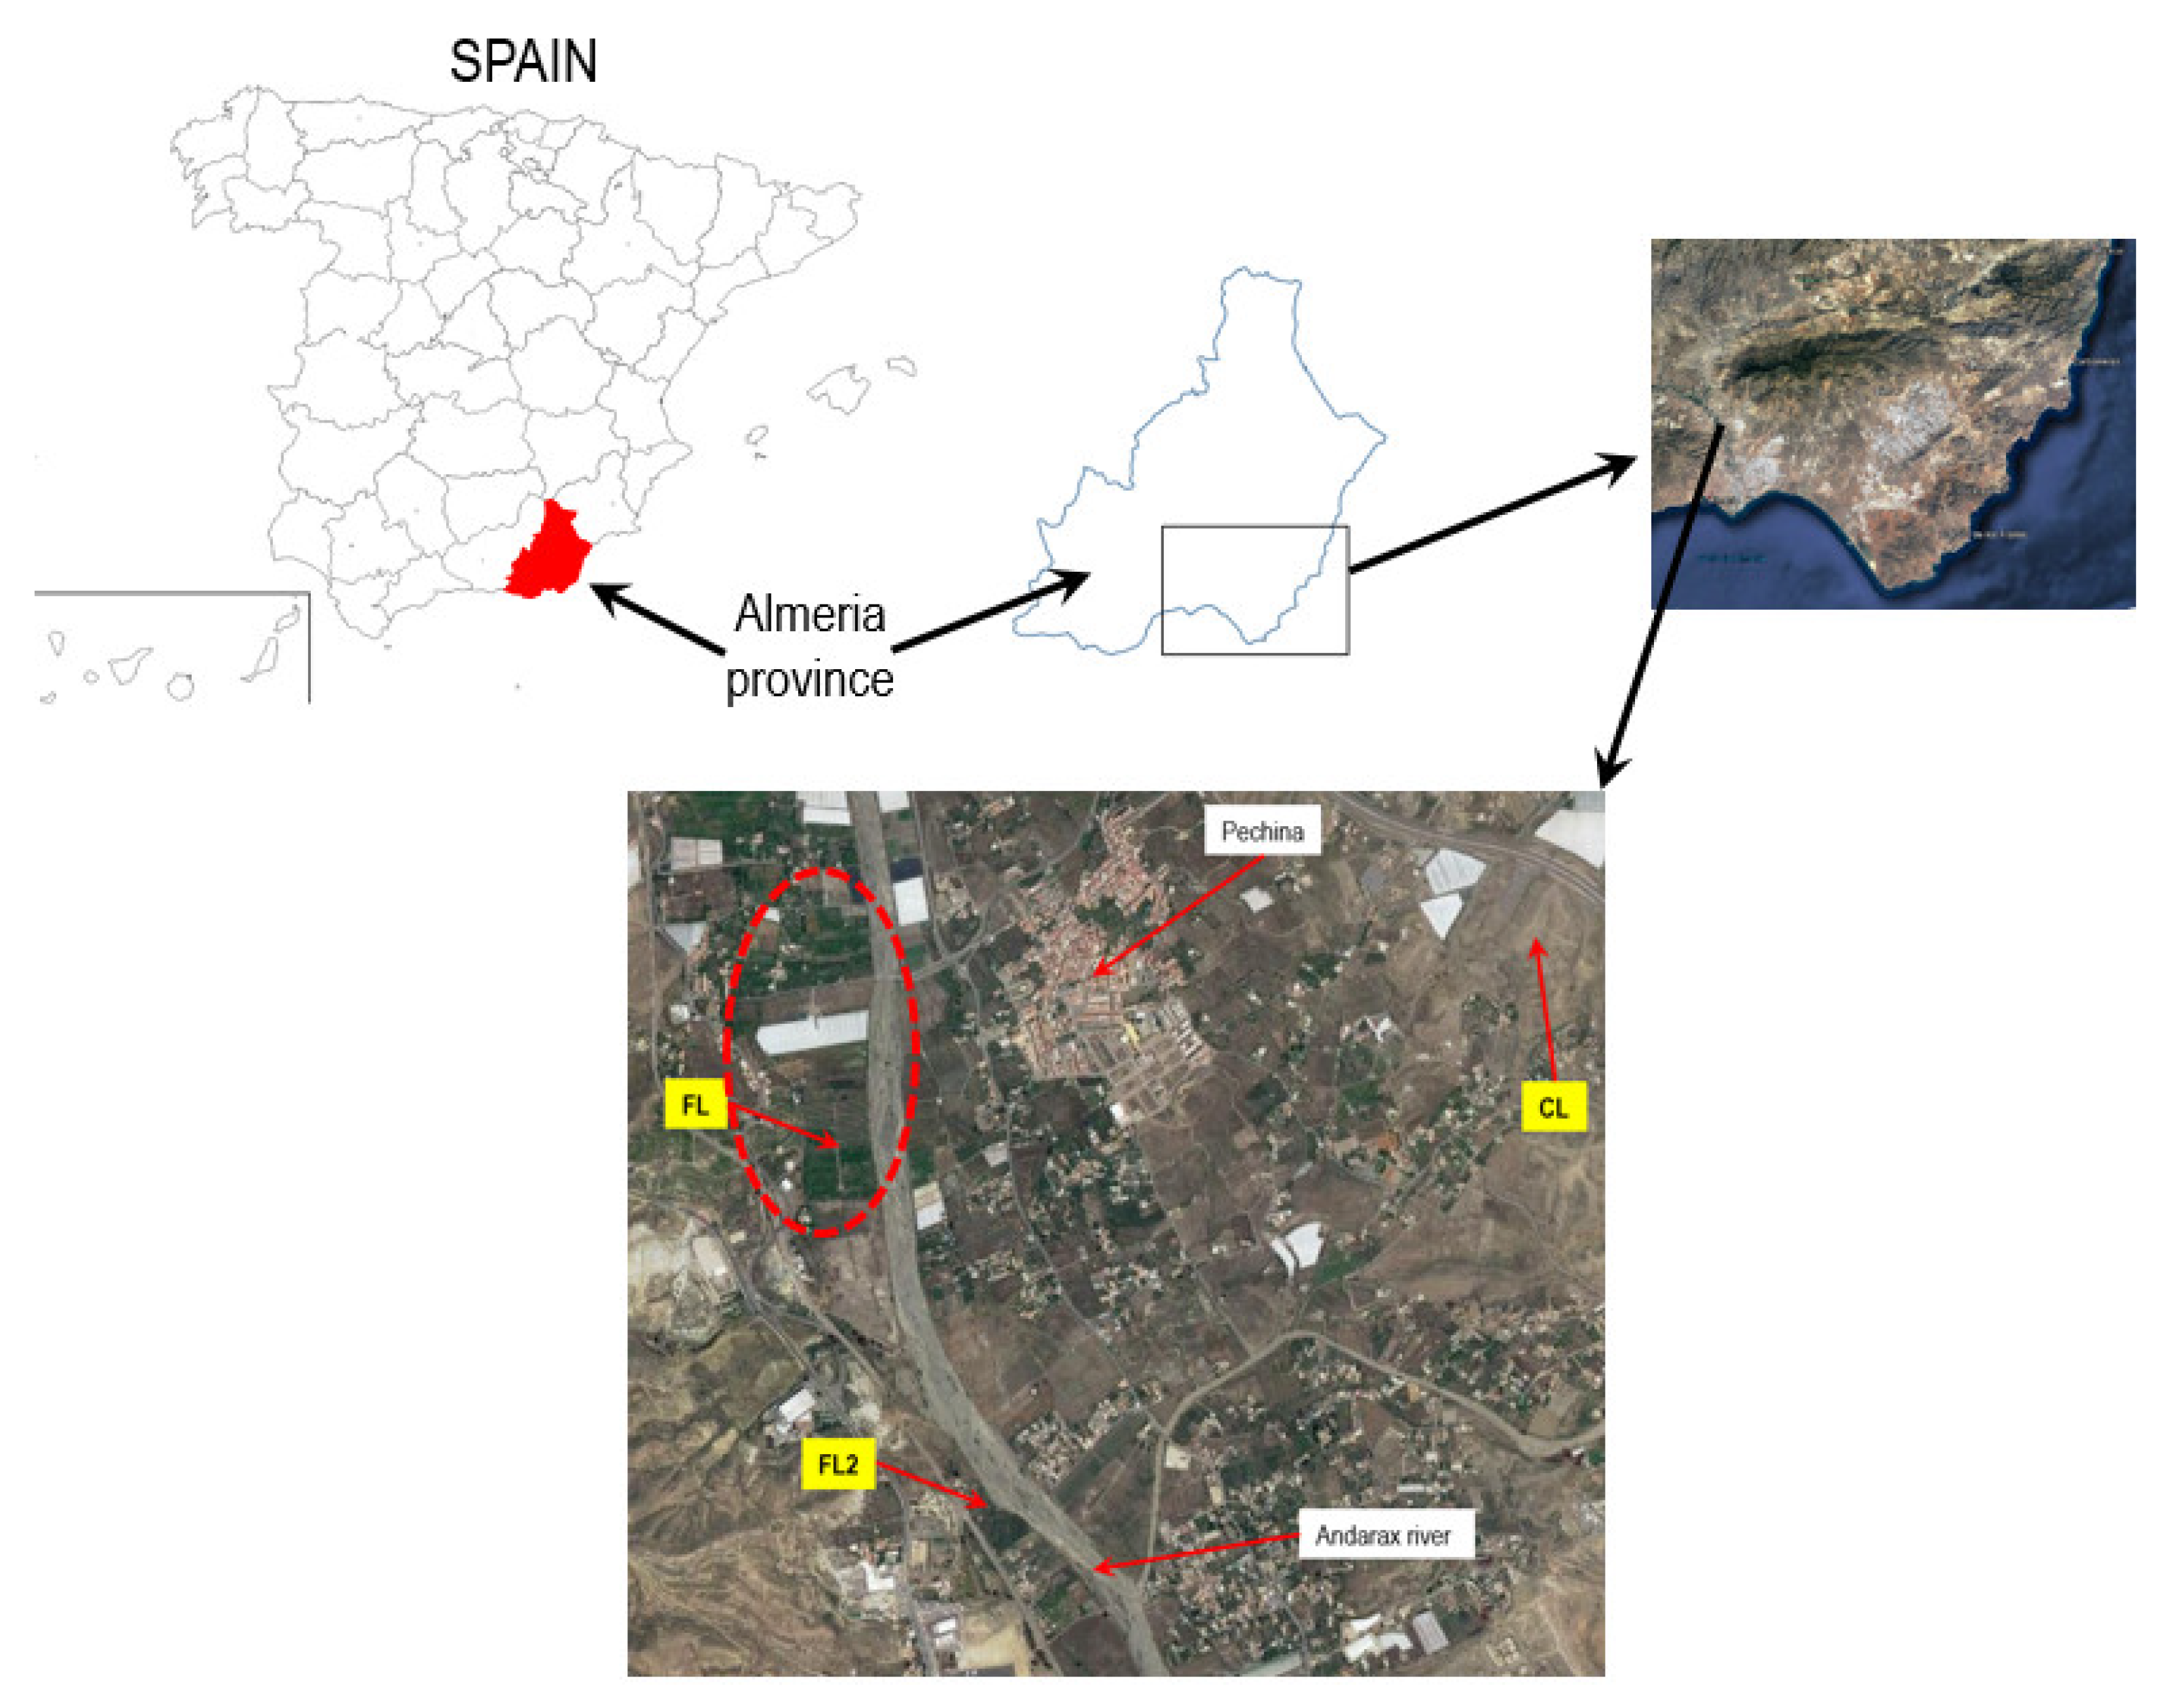
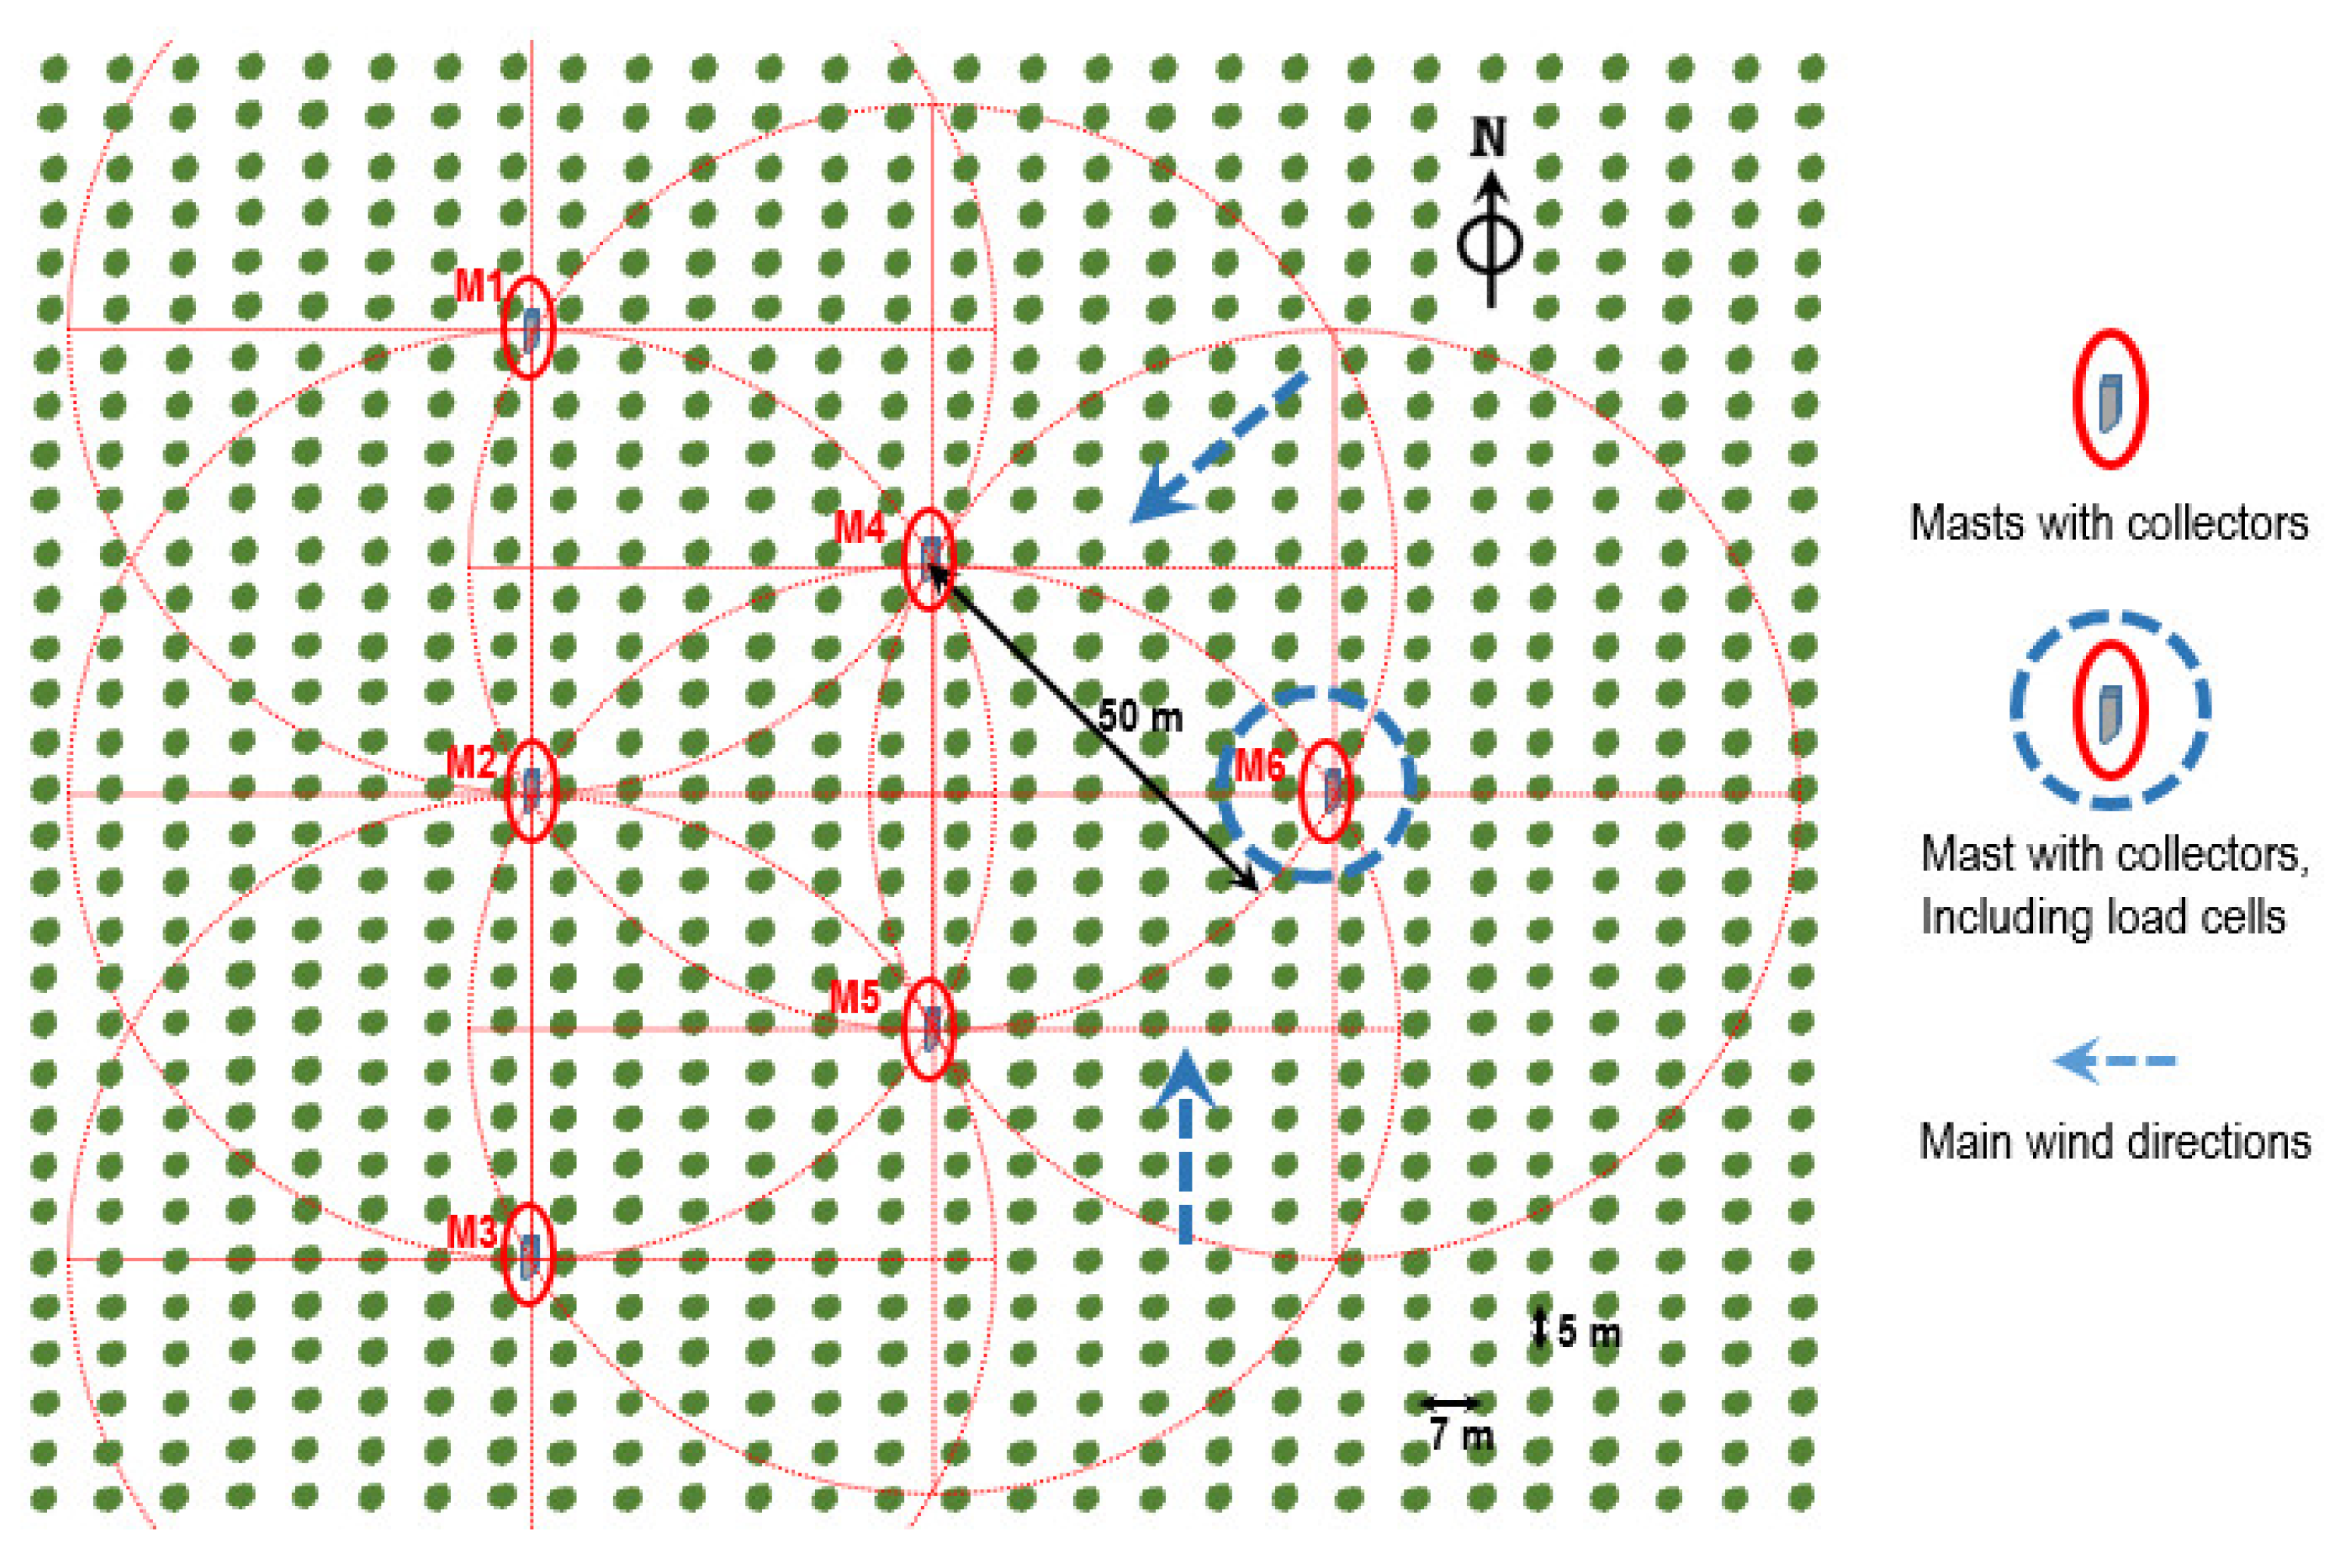
2. Materials and Methods

The location of our study area is in the province of Almeria in Southeast Spain (36°54′38″ N, 02°26′54″ O) at 93 m o.s.l. (Figure 1 and Table 1). The climate is semiarid Thermo-Mediterranean with an annual mean temperature of 21.1 °C and 249 mm of mean annual precipitation (Andalusian Government’s automatic meteorological stations) for the last 20 years. Metamorphic material is dominant, with Pliocene and Quaternary basin sediments [14]. The natural vegetation communities are mainly compounds of isolated native bushes surrounded by barren soil, occasionally accompanied by annual plants. The soils are calcaric Fluvisols (FL) planted with citrus trees with loamy texture, subangular blocky structure and frequent gravel fragments. We also analyzed surrounding Fluvisols (FL2) and haplic Calcisols (CL). By using a PCE-423 hot-wire anemometer (manufactured by PCE Instruments) connected in parallel to a computer 24 h a day, we found that the mean wind speed during testing was 5.6, with gusts over 24 m s−1 for no longer than 6 min from the Northeast and gusts of over 8 m s−1 for no longer than 4 min from the South.
We took four replicate samples from the upper 5 cm of soils in the study area and surroundings because at greater depths it was unaffected by wind. The soil texture was analyzed by a Robinson pipette. The organic matter content was determined from the organic carbon content found by Walkley–Black wet digestion by applying the Van Bemmelen factor. The equivalent carbonate content was calculated by gas volumetry.
In the various models of dust traps used for analyzing wind-transported material [15], the efficiency of particle capture depends on the mean particle size and increases with wind speed [16]. The vertical flow of sediments can be studied using particle collectors laid at different heights [17]. In front of usually performed collectors (Modified Wilson and Cook, MWAC, or Big Spring number eight model, BSNE, from Fryrear), we used a collector of our own design that we called Multidirectional trap (MDt), which can differentiate the sediments collected by the direction they come from. Apart from its efficiency, MDt is economical and easy to manufacture with an industrial 3D printer [18,19,20]. As six masts with four MDt collectors at different heights were used, we were able to find the average loss or deposit of particles in the citrus orchard subject of this study. Using X-ray diffraction, we were also able to distinguish the composition of the particles collected by their origin. In addition, the possibility of remote monitoring of the results using the message queuing telemetry transport (MQTT) protocol [21] includes a new range of possibilities for these wind-transported particle collectors. We used wind-transported particle collectors on a mast with a vane (Figure 2). These inhouse-designed collectors [22] were manufactured with a 3D industrial printer from glycol-modified ethylene polyterephthalate (PETg) thermoplastic filaments. The material transported by wind enters the collectors through a 10 cm2 inlet; inside the collector, a grill reduces the air speed, causing the deposition of transported material in a removable ring with a fixed base. Eight compartments with capsules are inside the ring, with the first facing North, differentiating the trapped materials by direction of origin. Collector efficiency is better for fine-grained soils, where 74% is achieved [7]. Our experiments were carried out uninterrupted for 24 h. For this, we distributed six masts with collectors at heights of 0.35, 0.70, 1.05, and 1.40 m, as shown in Figure 3. The vaned masts always keep the collector inlets facing the main wind direction. To prevent masts from interfering with each other, they are spaced 50 m apart. Figure 3 shows the distribution of the masts facing the dominant wind directions in the citrus orchard studied.
As the collectors lowest on each mast are 0.35 m from the surface, the soil loss rate has to be calculated empirically using a mathematical model which predicts the amount of material that can be trapped from the soil surface carried by the wind [17]. Thus, the sediment flow at each collector height is found by dividing the sediment trapped weight by the area of the collector inlet. The sediment transport rate (Qr) is calculated by using the following equation:
Q r = 0 h q 0 · e α z d z
where
  • h—maximum height of record;
  • q0—sediment at surface;
  • α—slope regression factor;
  • z—collector height.
Thus, the total mass transport is evaluated considering the efficiency of our collectors and the plot width based on the sediment transport rate. With these data, we are able to differentiate loss or deposit as the difference in the sediment transport rate between data from consecutive masts positioned windward and leeward to the main wind direction at any given time (negative differences showed material loss, and positive differences showed material gain).
In the four collectors on Mast nº6, a Phidgets® Micro Load Cell CZL639HD screwed to the collector floor on one side and to each of the eight compartments on the other continuously monitors the weight of the material deposited in each compartment. The load cell signals are read by an Arduino Mega 2560 microcontroller with a Sparkfun® amplifier model HX711. The four load cell output wires corresponding to a Wheatstone bridge circuit are connected to the amplifier along with its supply voltage to provide an output signal that is received by the microcontroller through its general-purpose input-output (GPIO) pins [23]. For the filtering of the data from the load cell, we take the mean value of all the data belonging to a sliding window equivalent to 15 min. Those data comprising a standard deviation greater than a certain threshold are discarded since these may be readings due to vibrations under the wind effects.
As mentioned above, one of the improvements made in the collector is that it can be remotely monitored. The internet connection for this is achieved with a wireless SIM800L GPRS quad band (GSM 850, EGSM 900, DCS 1800, and PCS 1900) module, which can connect to any global GSM network through a conventional 2G SIM. A helical GSM antenna, which consumes only 0.7 mA in sleep mode, is soldered directly onto the module NET pin and connected to the microcontroller by connecting the GPRS module RXD and TXD serial communication pins to its digital D18 (TX1) and D19 (RX1) pins, respectively.
Once the measurement system sensors had been properly calibrated and the microcontroller managing their signals had an internet connection, the next step was the development of the IoT platform. For this, the sensor readings are published to an Eclipse Mosquitto open source MQTT (Message Queing Telemetry Transport) broker (part of the Eclipse Foundation) that implements the MQTT protocol [20]. Use of an MQTT broker in the cloud makes it possible for several IoT devices to communicate through the MQTT protocol even if these devices belong to different networks and provides a lightweight method of sending messages using the publish/subscribe model. This makes Mosquitto suitable for IoT communication with low-power sensors, mobile devices, or microcontrollers [24]. The module connects to the internet through the SIM, publishes the sensor readings with the MQTT protocol, and Node-RED software [25] graphically displays the measurements on the Node-RED dashboard. Node-RED is a programming tool for connecting hardware devices, APIs, and online services using block programming to perform a task and provides a dashboard that can be used as a platform to interact with IoT devices such as monitoring sensors. Figure 4 shows the architecture of the network.
We also analyzed the dust samples collected in the collector traps by X-ray diffraction. Under standardized conditions, variations in this semiquantitative technique are reproducible. We utilized a “Davinci D8 Advance” (Bruker Co., Madison, WI, USA) diffractometer with a copper radiation tube (CuKα, λ = 1.54 Å). The results were evaluated by XPrep and EVA, both in the Diffrac.Suite Evaluation 2.1 software. The Wilcoxon signed-rank nonparametric test was used to determine the differences in sediment flow in the collectors at the same height on all six masts. The total amount was compared with the amount trapped in the windward compartments.

3. Results

The averages of four replicates of some of the soil characteristics recorded in the Fluvisols in the study area, as well as the windward surrounding soils, Calcisols to the Northeast, and other uncultivated Fluvisols to the South, are shown in Table 2. The Fluvisols in the citrus orchard in this study were not very stony on the surface, with an average gravel content of around 23%. Sampling was done 10 days after tilling. Figure 5 shows the average sediment flows captured in the eight directional compartments of the MDt collectors at the various heights on the masts where they are located. Table 2 also shows the main characteristics of the sediments from the directions where the winds are clearly predominant (Northeast and South). The differences at each height in windward trapped material and the total amount of trapped material by the MDt collectors did not show statistical significance (p > 0.05). Figure 6 shows the time distribution during the day of the sediment flow monitored by the load cells on Mast 6. We found a maximum Flow from the South from 12 h to 15 h on the test day, with a new, less intensive rise from the Northeast at around 22 h.
As described above, the sediment flow data were established from the quantity of recorded material in the windward capsules and the entire collector (the sum of all the compartments). The sediment transport rates (Table 3) were obtained by integration. We decided to estimate the flow of sediments by vertical integration because it allows our results to be compared with those of other authors using the same method and climate conditions in arid or semiarid zones [16] for future studies.
As described above, there are two dominant wind directions, so we compiled a dataset with the differences between the amount of sediments from the masts positioned downwind and leeward in those directions. The differences in sediment transport rate for internal MDt collector compartments facing Northeast (NE) and South (S) on the six masts (M) used were conditioned by the distribution of the masts (Figure 3). For sediments from the NE, the differences values result of M4-M2; M6-M5; M5-M4. For sediments from the S, the differences values of M3-M2; M2-M1; M5-M4. The resulting sediment transport rate balance is shown in Table 4. It is positive, and therefore the deposition of particles from the Northeast, along with a negative balance, implies particle loss when the dominant winds are from the South. Finally, Table 5 shows the results for total mass transport considering the material trapped in the windward compartments alone and the total.
The characteristics of the soil sediments trapped from the surrounding area are rather different. We therefore analyzed the original samples of Calcisols from the NE and Fluvisols from the S and compared their mineralogy. Next to the organic matter, different clay minerals condition the cationic exchange capacity of soils. Therefore, their loss from the effect of the wind lessens soil fertility and requires fertilization to avoid losing productivity [26,27]. When X-ray diffraction was applied to the samples, wide differences in calcite content was observed in favor of sediments trapped from the Calcisol zone (NE) or in quartz, which dominates in the areas of Fluvisols from the S, as observed in Figure 7.

4. Discussion

As the tillage intensity is not high in these soils and the organic matter content is moderate, we found no mechanical reduction in the size of the aggregates that would decrease their stability, particularly under dry soil conditions [28]. Therefore, there is not much wind-erodible material on the surface of our tilled Fluvisols, which implies less nutrient loss. However, the prolonged drought in the area makes the situation more serious. Furthermore, a physical crust tends to develop on the surface around ten days after tilling, which also decreases the effect of erodible materials being swept by the wind in loose soil [19]. Added to all of the above is the protection provided by theorchard from wind attacking the soil surface.
The sediment transport rate balance from the Northeast shows that the material was being deposited in the study area, similar to what happens at Northeast of Almeria province [18]. In our study area, NE-facing collector compartments trapped a significant amount of phyllosilicates in the upper collectors, especially type 2:1, which implies more adhesiveness of the sediments, increasing aggregation, and decreasing their erodibility. This adhesiveness is strengthened as most of those sediments are generated during the night when there is dew, which is moderate in this area. Furthermore, these sediments are rich in calcite; like calcic carbonate, this is a powerful soil aggregate that also diminishes the erodibility of soil by wind where they are deposited.
The contrary occurs with the sediments from uncultivated Fluvisols in the South, where the total transported mass is almost double. The higher quartz content in the trapped material (much higher in the lower traps) favors abrasion, which increases wind erodibility of the soil along with the predominance of saltation mechanisms,. Nevertheless, the higher organic matter content in the sediments from the South conditions a certain aggregation, balancing loss of material. The South-facing collector compartments trapped more Type 1:1 phyllosilicate in the upper traps, implying less adhesiveness of the sediments. In this case, the balance of the transport rates of sediment from the South indicated that matter was lost in the study area and deposited leeward. Those losses of organic matter and clay influence soil productivity and are responsible for a reduction in the cationic exchange capacity of these soils. In the end, the loss of fertility must be compensated by external contributions in the form of fertilizers and their corresponding cost.
The total mass transport found implies the need for further study to evaluate the use of measures to reduce soil erosion by wind. For example, Asensio et al. [29] used removable textile windbreakers immediately after tilling in olive orchards until physical crusts had formed on the surface. This reduced wind erosion in recently tilled olive orchards up to 72% at a height of 0.4 m, mainly affecting a decrease in particle saltation on the soil surface.

5. Conclusions

Our inhouse-designed MDt collectors are highly efficient and easy and cheap to manufacture. Their inner capsules discriminate the sediments by predominant wind direction. The use of these collectors shows how materials transported by the wind differ by direction of origin and the height at which they are trapped. The new collectors can also be used with load cells in the compartments; along with appropriate design of hardware and software architecture, this makes it possible to know the sediment flow remotely and in real time. This study showed how the deposits (both calcic carbonate and phyllosilicates 2:1) from the NE favor aggregation on Fluvisols planted with citrus trees when there is dew. In contrast with this, we found an abrasive effect of quartz from the S as material passing through in our study zone since in it, the balance of the sediment transport rate shows loss of material, which ends up being deposited leeward of the citrus trees. The total sediment mass in the study area implies the need to take certain preventive measures to minimize wind erosion as a form of degradation of these soils.

Author Contributions

Conceptualized, conceived and designed the experiments: C.A.-A., A.G., J.L.T. and C.A.; Performed the experiments and formal analysis: C.A.-A., A.I.M. and C.A.; Writing, original draft preparation: C.A.-A., A.G. and J.L.T.; Writing, review and editing: C.A.-A.; Supervision, grant management and funding acquisition, C.A. All authors have read and agreed to the published version of the manuscript.

Funding

This study was funded by the Andalusia Regional Government (P18-RT-5130 grant) and European Union ERDF funds.

Institutional Review Board Statement

Not applicable.

Informed Consent Statement

Not applicable.

Data Availability Statement

Not applicable.

Conflicts of Interest

The authors declare no conflict of interest.

References

  1. Novara, A.; Gristina, L.; Saladino, S.S.; Santoro, A.; Cerdà, A. Soil erosion assessment on tillage and alternative soil managements in a Sicilian vineyard. Soil Tillage Res. 2011, 117, 140–147. [Google Scholar] [CrossRef] [Green Version]
  2. Sharifikia, M. Environmental challenges and drought hazard assessment of Hamoun Desert Lake in Sistan region, Iran, based on the time series of satellite imagery. Nat. Hazards 2013, 65, 201–217. [Google Scholar] [CrossRef]
  3. Kravchenko, Y.S.; Chen, Q.; Liu, X.; Herbert, S.J.; Zhang, X. Conservation practices and management in Ukrainian mollisols. J. Agric. Sci. Technol. 2016, 16, 1455–1466. [Google Scholar]
  4. Yildiz, S.; Enç, V.; Kara, M.; Tabak, Y.; Acet, E. Assessment of the potential risks of airbone microbial contamination in solid recovered fuel plants: A case study in Istanbul. Environ. Eng. Manag. J. 2017, 16, 1415–1421. [Google Scholar]
  5. Panagos, P.; Van Liedekerke, M.; Jones, A.; Montanarella, L. European Soil Data Centre: Response to European policy support and public data requirements. Land Use Policy 2012, 29, 329–338. [Google Scholar] [CrossRef]
  6. Touré, A.A.; Rajot, J.L.; Garba, Z.; Marticorena, B.; Petit, C.; Sebag, D. Impact of very low crop residues cover on wind erosion in the Sahel. Catena 2011, 85, 205–214. [Google Scholar] [CrossRef]
  7. Asensio, C.; Lozano, F.J.; Ortega, E.; Kikvidze, Z. Study on the effectiveness of an agricultural Technique based on aeoliandeposi- tion, in a semiarid environment. Environ. Eng. Manag. J. 2015, 14, 1143–1150. [Google Scholar] [CrossRef]
  8. De Oro, L.A.; Buschiazzo, D.E. Threshold wind velocity as an index of soil susceptibility to wind erosion under variable climatic conditions. Land Degrad. Dev. 2009, 20, 14–21. [Google Scholar] [CrossRef]
  9. Colazo, J.C.; Buschiazzo, D.E. Soil dry aggregate stability and wind erodible fraction in a semiarid environment of Argentina. Geoderma 2010, 159, 228–236. [Google Scholar] [CrossRef]
  10. Colazo, J.C.; Buschiazzo, D.E. The impact of agriculture on soil texture due to wind erosion. Land Degrad. Dev. 2015, 26, 62–70. [Google Scholar] [CrossRef]
  11. Zobeck, T.M.; Baddock, M.; Van Pelt, R.S.; Tatarko, J.; Acosta-Martínez, V. Soil property effects on wind erosion of organic soils. Aeolian Res. 2013, 10, 43–51. [Google Scholar] [CrossRef]
  12. Borrelli, P.; Panagos, P.; Ballabio, C.; Lugato, E.; Weynantgs, M.; Montanarella, L. Towards a Pan-European assessment of land susceptibility to wind erosion. Land Degrad. Dev. 2016, 27, 1093–1105. [Google Scholar] [CrossRef]
  13. Molchanov, E.N.; Savin, I.Y.; Yakovlev, A.S.; Bulgakov, D.S.; Makarov, O.A. National approaches to evaluation of the degree of soil degradation. Eurasian Soil Sci. 2015, 48, 1268–1277. [Google Scholar] [CrossRef]
  14. Marin, C. Estructura y Evolucion Tectonica Reciente del Campo de Dalias y de Nijar en el Contexto del Limite Meridional de las Cordilleras Beticas Orientales. Ph.D. Thesis, Universidad de Granada, Granada, Spain, 2005. [Google Scholar]
  15. Goossens, D.; Offer, Z.; London, G. Wind tunnel and field calibration of five aeolian sand traps. Geomorphology 2000, 35, 233–252. [Google Scholar] [CrossRef]
  16. Mendez, M.J.; Funk, R.; Buschiazzo, D.E. Field wind erosion measurements with Big Spring Number Eight (BSNE) and Modified Wilson and Cook (MWAC) samplers. Geomorphology 2011, 129, 43–48. [Google Scholar] [CrossRef]
  17. Basaran, M.; Erpul, G.; Uzun, O.; Gabriels, D. Comparative efficiency testing for a newly designed cyclone type sediment trap for wind erosion measurements. Geomorphology 2011, 130, 343–351. [Google Scholar] [CrossRef]
  18. Guerrero, R.; Valenzuela, J.L.; Monterroso, A.I.; Asensio, C. Impact of wind direction on erodibility of a hortic Anthrosol in Southeastern Spain. Agriculture 2021, 11, 589. [Google Scholar] [CrossRef]
  19. Guerrero, R.; Valenzuela, J.L.; Torres, J.L.; Lozano, F.J.; Asensio, C. Soil wind erosion characterization in South-Eastern Spain using traditional methods in front of an innovative type of dust collector. Int. Agrophysics 2020, 34, 503–510. [Google Scholar] [CrossRef]
  20. Guerrero, R.; Valenzuela, J.L.; Chamizo, S.; Torres, J.L.; Asensio, C. Multidirectional traps as a new assessment system of soil wind erosion. Sci. Agric. 2022, 79, 1–7. [Google Scholar] [CrossRef]
  21. Pulver, T. Hands-On Internet of Things with MQTT: Build Connected IoT Devices with Arduino and MQ Telemetry Transport (MQTT)/Tim Pulver, 1st ed.; Packt: Birmingham, UK, 2019. [Google Scholar]
  22. Asensio, C.; López, J.; Lozano, F.J. Colector Multidireccional de Partículas Transportadas por el Viento [Multidirectional Collector of Particles Carried by the Wind]. Patent No. ES 2 470 090 B1, 17 April 2015. [Google Scholar]
  23. Sparkfun. Sparkfun Load Cell Amplifier–HX711. Available online: https://www.sparkfun.com/products/13879 (accessed on 18 March 2022).
  24. Eclipse Mosquitto™. An Open Source MQTT Broker. Available online: https://mosquitto.org/ (accessed on 18 March 2022).
  25. Node-RED. Low-Code Programming for Event-Driven Applications. Available online: https://nodered.org/ (accessed on 18 March 2022).
  26. Gallardo, P.; Salazar, J.; Lozano, F.J.; Navarro, M.C.; Asensio, C. Economic impact of nutrient losses from wind erosion of cereal soils in Southeast Spain. Int. J. Environ. Res. 2016, 10, 333–340. [Google Scholar]
  27. Segovia, C.; Gómez, J.D.; Gallardo, P.; Lozano, F.J.; Asensio, C. Soil nutrients losses by wind erosion in a citrus crop at Southeast Spain. Eurasian Soil Sci. 2017, 50, 756–763. [Google Scholar] [CrossRef]
  28. Marzen, M.; Iserloh, T.; Fister, W.; Seeger, M.; Rodrigo Comino, J.; Ries, J.B. On-site water and wind erosion experiments reveal relative impact on total soil erosion. Geosciences 2019, 9, 478. [Google Scholar] [CrossRef] [Green Version]
  29. Asensio, C.; Molina-Aiz, F.D.; Lozano, F.J.; López, A.; Valera., D.L. Use of mesh windbreaks for soil erosion in olive groves in Southeastern Spain. Environ. Eng. Manag. J. 2019, 18, 2397–2403. [Google Scholar] [CrossRef]
Figure 1. Location of Fluvisols (FL) from the study area. In the surroundings, there are Calcisols (CL) and Fluvisols (FL2) that will show an important wind flow influence.
Agriculture 12 02138 g001
Figure 2. Mast and vane with collectors at different heights. Operating scheme.
Agriculture 12 02138 g002
Figure 3. Mast distribution at field and main wind directions.
Agriculture 12 02138 g003
Figure 4. Hardware and software architecture.
Agriculture 12 02138 g004
Figure 5. Averaged sediment flux (qz) by height and direction of provenance.
Agriculture 12 02138 g005
Figure 6. Hourly distribution of sediment flow monitored with load cells.
Agriculture 12 02138 g006
Figure 7. X-ray diffractograms of sediments caught from Calcisols and Fluvisols.
Agriculture 12 02138 g007
Table 1. Location and climatic characteristics of studied soils and surroundings.
SAMPLELocationDateAveraged
Wind Speed
Averaged
Direction
Averaged
Temperature
Averaged
Relative Humidity
CoordinatesAltitude
(m) o.s.l.(m·s−1)(°)(°C)(%)
CL36°55′03″ N2°25′27″ W13815 March 20223.473.421.139.6
FL36°54′38″ N2°26′54″ W9315 March 20223.473.421.139.6
FL236°54′04″ N2°26′30″ W8215 March 20223.473.421.139.6
Table 2. Characteristics of soils and sediments in MDt compartments.
SAMPLEV.C. SandCoarse SandMedium SandFine SandV.F. SandCoarse SiltFine
Silt
ClayO.C.CO3=
(%)
CL5.8 ± 0.56.3 ± 0.49.5 ± 0.716.3 ± 1.625.5 ± 1.87.5 ± 0.813.7 ± 1.115.4 ± 1.40.85 ± 0.1141 ± 3
From NE0.0 ± 0.00.0 ± 0.00.3 ± 0.111.3 ± 0.638.0 ± 2.622.8 ± 1.816.4 ± 1.611.2 ± 2.80.72 ± 0.1437 ± 3
FL2.6 ± 0.45.0 ± 0.57.0 ± 0.68.4 ± 0.916.5 ± 1.221.0 ± 1.919.3 ± 1.720.2 ± 2.32.16 ± 0.3324 ± 2
From S0.0 ± 0.00.0 ± 0.10.2 ± 0.19.4 ± 0.736.7 ± 2.322.4 ± 2.919.1 ± 2.512.2 ± 1.11.12 ± 0.2318 ± 2
FL24.1 ± 0.46.2 ± 0.511.0 ± 0.612.7 ± 0.919.5 ± 1.220.0 ± 1.912.3 ± 1.714.2 ± 2.31.38 ± 0.4520 ± 2
Table 3. Sediment transport rate (Qr).
SAMPLEQr (Windward NE)
(kg·m−1)
123456
FL0.10960.10290.08890.11440.09840.1173
SAMPLEQr (Windward S)
(kg·m−1)
123456
FL0.19280.17880.15400.20130.17260.2051
SAMPLEQr (MDt Total)
(kg·m−1)
123456
FL0.35050.32510.28000.36600.31380.3729
Table 4. Results of sediment transport rate (Qr) balance.
SAMPLEQr Balance
Windward NEWindward S
FL0.0133−0.0225
Table 5. Results of total mass transport (Qt).
SAMPLEQt (kg)
Windward NEWindward SMDt Total
FL7.109612.436022.6101
Publisher’s Note: MDPI stays neutral with regard to jurisdictional claims in published maps and institutional affiliations.

