Article

Recycling Nutrients Contained in Biomass Bottom Ash from Industrial Waste to Enhance the Fertility of an Amazonian Acidic Soil

by
Alan R. L. Albuquerque
1,*,
Marcos A. P. Gama
2,
Vitória M. N. Lima
2,
Andréia O. Rodrigues
1,
Rômulo S. Angélica
1 and
Simone P. A. Paz
1
1
Mineral Characterization Laboratory, Institute of Geosciences, Federal University of Pará (LCM/IG/UFPA), Belém 66075-110, Brazil
2
Institute of Agricultural Sciences, Federal Rural University of the Amazon (ICA/UFRA), Belém 66077-530, Brazil
*
Author to whom correspondence should be addressed.
Agriculture 2022, 12(12), 2093; https://doi.org/10.3390/agriculture12122093
Submission received: 11 October 2022 / Revised: 16 November 2022 / Accepted: 17 November 2022 / Published: 7 December 2022
(This article belongs to the Special Issue Organic Fertilizers and Soil Amendments)

Abstract

:
The present study aimed to evaluate the effects of recycling ash from Amazonian biomass on the fertility of a dystrophic Yellow Latosol. For this purpose, a laboratory incubation experiment was performed with Yellow Latosol using four increasing doses of ash (8.75, 17.5, 35, and 70 Mg ha−1), three incubation times (20, 40, and 60 days), two positive treatments (13 Mg ha−1 lime and 2 Mg ha−1 phosphate fertilizer), and one control soil. The chemical analyses of the soil revealed that the application of increasing doses of ash positively affected the pH values and significantly increased the availability of the nutrients P, K, Ca, and Mg, the levels of which were adequate for the soils and main crops of the state of Pará, Brazil. The input of these nutrients and the moderate increase in pH contributed to the increase in base saturation and thus reduced the potential acidity of the soil and neutralized Al3+. Therefore, recycling ash from Amazonian biomasses in agricultural or forest soils may represent a sustainable and integrative alternative that balances the management of industrial waste and the fertility of acidic and nutrient-deficient soils in the state of Pará.

1. Introduction

Since the 1970s, Brazil has been experiencing vigorous agricultural growth and has become a world leader in the food commodities sector. According to the Brazilian Agriculture and Livestock Confederation, CNA [1], in 2020, agribusiness reached its largest share in the country’s gross domestic product (GDP), reaching 27.4%.
Agricultural and forestry success in Brazil was achieved by the combination of good edaphoclimatic conditions, soil availability, technological advances, and public policies to encourage agricultural research and development. However, even with this favorable scenario, the supply of agrominerals did not follow the vigorous growth of agricultural production, which made Brazil the fourth largest consumer of NPK fertilizers in the world, with high import rates of nitrogen fertilizers (84%), phosphates (46%), and potassium (95%) [2]. Thus, dependence on the importation of agrominerals and fertilizers in Brazil has represented a burden on its trade balance and has acted as an obstacle to the consolidation plans of the country as an agricultural power.
In the Amazon region, to which the expansion of the national agricultural frontier has also been directed, this scenario has been even more unfavorable because this region has limited resources and poorly developed technology. These factors have intensified the deforestation of large areas for low-yield agricultural production.
In addition to the natural increase in demand for fertilizers resulting from population growth, another factor that has influenced the dependence on agricultural inputs is the reinsertion of biomasses in the national energy matrix, which has resulted in the use of high rates of fertilizers to produce raw materials.
To increase the contribution of biofuels in the energy matrix, and therefore reduce the consumption of fossil fuels, Brazil has been investing in the conversion to and production of renewable energy from lignocellulosic waste and energy forest plantations. Consequently, biomass has become the second largest source of primary energy in the country [3,4].
Although Brazil uses mostly lignocellulosic waste and energy forests, mitigating competition for agri-food products, the intensive use of biomass, especially in the form of combustion, has caused two other major problems. The first problem is associated with intense extraction and low nutrient cycling in energy forest soils, which have increased the need for fertilizers and Brazil’s dependence on agricultural inputs [5,6,7]. The second problem is directly related to the production of large amounts of ash and the difficulties of handling these mineral residues [8,9].
According to Vassilev et al. [10], biomass ash is characterized by the predominance of inorganic compounds and may sometimes contain organic components when there is incomplete combustion of the fuel. These inorganic compounds are represented mainly by Ca and Mg oxides, hydroxides, carbonates, and silicates, which release OH ions in contact with soil solutions. The OH ions are responsible for reducing soil acidity, by neutralizing H+ and Al3+, which, when in large levels and free form, decrease the availability of macro and micronutrients, cause irreversible fixation of phosphorus, and affect the plants’ root system. Thus, besides the good capacity to neutralize soil acidity, biomass ash has a high capacity to provide essential plant nutrients, such as Ca, Mg, as well as P and K [11,12]. Based on these properties, instead of being disposed of, ash has been reused as an alternative source of nutrients for agricultural and forest soils, especially in countries or regions with scarce or restricted access to fertilizers [9,13,14].
Although there is extensive knowledge of the agronomic potential of these residues, compositional variability may restrict their application in agriculture [15,16]. The concentration and solubility of nutrients as well as the effects of ash on soils and plants may vary according to the nature, handling, and combustion conditions of the precursor biomass as well as the storage conditions of the waste itself [10,17,18]. In addition, the effects of ash depend on the physical and chemical attributes of the soils [11,12].
Therefore, the recycling of biomass ash in acidic soils with low nutrient levels requires systematic chemical, mineralogical, and agronomic evaluation. In particular, additional investigation is needed for the ashes of little-known biomasses, such as Amazonian species, represented here by açaí seeds and tropical wood chips, which have been gaining prominence due to their wide availability and increasing production [16].
Therefore, to contribute to the recirculation of nutrients in the soil and the expansion of knowledge and sustainable management of biomass residues and their ashes, the present study aimed to evaluate the effects of ash from Amazonian biomasses on the fertility of an acidic and nutrient-deficient soil in the northeastern region of the state of Pará, Brazil.

2. Materials and Methods

2.1. Properties of Ash from Amazonian Biomasses, Phosphate Fertilizer and Lime

The materials used in this study include ash from Amazonian biomasses and two commercial products, namely, phosphate fertilizer and lime.
Samples of ash from Amazonian biomasses and phosphate fertilizer were collected from a calcined phosphate fertilizer company (Viso Fertilizantes, formerly known as Phosfaz Fertilizantes), which is located in Bonito in the northeast of the state of Pará, Brazil (coordinates: 1°23′35″ S and 47°24′40″ W).
The ash from Amazonian biomasses is the mineral waste coproduced by the direct combustion of a mixture of residual agricultural and forest biomasses, such as açaí (Euterpe oleracea Mart.) seeds without pulp and tropical woodchips, respectively. This mineral residue is the material deposited at the base of the combustion furnace and occurs in the form of slag. Among the main characteristics of ash, the following stand out: alkaline character, moderate concentrations of total and soluble nutrients, and low levels of heavy metals (Table 1). For the incubation test, the ash was homogenized by crushing and grinding to a size <0.3 mm.
Phosphate fertilizer comprises the commercial product of calcined phosphate, which was collected in powder form (<0.3 mm). Its most important properties include a total P2O5 content of 23%, a content of P2O5 soluble in neutral citrate of ammonia plus water of 20%, and a total neutralizing value of 6.7%.
The lime used is classified as dolomitic, originating from northeastern Brazil. In its commercialized form, it has the following characteristics: reactivity, 98.14%; neutralization power, 100%; total neutralizing value, 92.4%; CaO, 33%; and MgO, 16%.

2.2. Sampling and Preparation of Yellow Latosol

The soil used in this study was collected in a forest area of the Federal Rural University of the Amazon (Universidade Federal Rural da Amazônia—UFRA) in the municipality of Belém (Figure 1), Pará, Brazil (coordinates: 1°27′07″ S and 48°26′22″ W).
The material collected comprises the surface layer (0–20 cm) of dystrophic Yellow Latosol (Oxisol according to the USDA Soil Taxonomy) with a sandy texture (Figure 1a,b). For the incubation test, the soil was air-dried and classified after being passed through a 4 mm sieve.

2.3. Design and Experimental Procedures

To evaluate the chemical effects of ash from Amazonian biomasses on the Yellow Latosol, an experiment was conducted to incubate this residue in a soil sample. A randomized block experimental design with a 4 × 3 + 3 factorial scheme was used, with four increasing doses of ash (8.7, 17.5, 35, and 70 Mg ha−1), three incubation times (20, 40, and 60 days), two positive treatments (13 Mg ha−1 lime and 2 Mg ha−1 phosphate fertilizer), and a control soil. The doses of ash and lime applied to the soil were selected to increase the Ca saturation of the cation exchange capacity (CEC) at pH 7.0 to 60%, and the dose of the phosphate fertilizer was selected to increase the P2O5 content in the soil to 400 kg ha−1. The experiment was performed in 3 replicates, and each experimental unit included 500 mL polyethylene cups, which received 400 cm3 of soil mixed with their respective treatments. To maintain the moisture at 80% of the field capacity of the soil, distilled water was added every 2 or 3 days. The response variables of the experiment were as follows: pH in H2O and CaCl2; organic matter (OM) content; extractable concentrations of P, K, Ca, S, and Al; sum of bases (SB); saturation by bases (V) and by Al (m) of CEC at pH 7.0; potential acidity (H + Al); and CEC.

2.4. Preparation and Analysis of Soils before and after Incubation

Aliquots of the soils before and after each incubation time were dried at 40 °C and subjected to chemical and mineralogical analyses.
The mineralogical analyses were performed at the Laboratory of Mineral Characterization (LCM), Institute of Geosciences, UFPA. X-ray diffractometry (XRD) analyses were performed with the aid of a Malvern Panalytical Empyrean diffractometer with a ceramic Co X-ray tube (Kα1 = 1.790 Å), Fe kβ filter, 40 kV voltage and 35 mA, scan from 3° to 110° 2θ, step of 0.007° 2θ, time/step of 20 s, ° rad divergent slit and ½ ° rad anti-scattering slit, and 10 mm mask.
The chemical analyses were performed by the commercial laboratory of the Department of Soil Sciences of the “Luiz de Queiroz” School of Agriculture, University of São Paulo, according to the methods proposed in the “Manual of chemical analysis of soils, plants and fertilizers” [19]. The pH values were obtained in H2O and in a 0.01 mol L−1 CaCl2 solution with a pH meter. The OM content was quantified by dichromate extraction and determined by colorimetry. The concentrations of P and K were obtained by extraction with Mehlich 1 reagent and measured by photocolorimetry and flame photometry, respectively. Ca, Mg, and Al were extracted in KCl mol L−1 solution and determined by atomic absorption spectrophotometry. To evaluate the H + Al parameter, a calcium acetate reagent was used at pH 7.0, and the contents were measured by alkalimetric titration. S was extracted in a 0.01 mol L−1 calcium phosphate solution and determined by spectrometry. Notably, the CEC, SB, V, and m values were indirectly determined from the measurements of the other soil components.

2.5. Statistical Analyses

One-way analysis of variance (ANOVA) was used to examine significant differences between treatments and response variables. The data were evaluated for homogeneity and normality. When significant differences (p < 0.05) were observed, Tukey’s HSD test was applied to evaluate the differences in the mean values of the responses of each treatment. Pearson correlations were also used to evaluate the interactions between treatments and responses. In addition, regression analyses were used. All data analysis was performed using STATISTICA 7 (Dell, Rondelock, TX, USA) software.

3. Results and Discussion

3.1. Initial Physical and Chemical Properties of Yellow Latosol

The Yellow Latosol used in the incubation test had a sandy texture (Table 2) and consisted of 74.7% quartz, 15.1% kaolinite, 4.8% organic matter, and 5.4% amorphous phase from oxide and hydroxide compounds (Figure 2).
Among the main chemical characteristics of Yellow Latosol, the following stand out: acid character, low levels of macronutrients (P, K, Ca, Mg, and S), high concentrations of Al and H + Al, and low CEC (Table 2). The low CEC and low base saturation (V) reflect the predominance of quartz sand and the small concentration of clay (Table 2), with the latter fraction consisting of low-activity minerals, such as kaolinite and Fe oxides and hydroxides (Figure 2). In addition, 87% of the effective CEC points were occupied by Al3+ (m), which can compromise the growth of most plants. Thus, to improve the properties of the soil in question, for example, by reducing the potential for losses by leaching and increasing the retention of cations, it is necessary to add adequate amounts of lime to the soil and, consequently, generate pH-dependent loads.

3.2. Effects of Treatments on the Chemical Properties of Yellow Latosol

The chemical analyses of the Yellow Latosol after incubation revealed that increasing doses of biomass ash (8.75, 17.5, 35, and 70 Mg ha−1) promoted significant and positive changes (p < 0.05) in the soil chemical attributes, such as increases in the soil pH values and P, K, Ca, and Mg contents. These increases subsequently caused increases in the soil base saturation and reduced the Al3+ levels and potential acidity (H + Al).
The increasing ash levels conferred significant effects on the pH values in water (r > 0.85) and in CaCl2 (r > 0.88) at the three soil incubation times (Table 3). The applications of 35 and 70 Mg ha−1 of ash contributed most to the increase in soil pH, with increases between 1.17 and 1.60 pH units when compared to the soil that did not receive ash input. Among the three incubation times, these two treatments did not differ significantly from each other, which caused a reduction in the linearity between the increasing ash input and the increase in pH values. Thus, the quadratic polynomial regression model adequately fit the results (Figure 3a,b). To determine the pH values in H2O, Equations (1)–(3) were used (Figure 3a), and for the pH values in CaCl2, Equations (4)–(6) were used (Figure 3b). The greatest increases in pH due to ash applications were observed at 40 days of incubation (Figure 3a,b). Equations (2) and (5) (Figure 3a,b) were used to determine the point of maximum neutralization of the soil acidity, with the results indicating that with the addition of 58 Mg ha−1 of ash, pH values of 5.71 in H2O and 4.84 in CaCl2 were obtained. It is important to note that although the ash applications caused positive effects on the soil pH, the variation in the pH values between the ash treatments and control soil was low, with coefficients of variation (CV) lower than 15.7% (Table 3).
Even the high-dose ash treatments (35 and 70 Mg ha−1) did not result in pH values or exchangeable cation (Ca2+ and Mg2+) contents that were significantly similar to those obtained in the lime treatment (Table 3 and Figure 3c). However, the treatment with the lowest ash concentration (8.75 Mg ha−1) showed higher pH values than those obtained in the treatment with phosphate fertilizer (Table 3 and Figure 3c). As expected, the higher pH values obtained with the application of lime are due to its high total neutralizing value (92.4%) and relatively high concentrations of Ca and Mg carbonates. In contrast, biomass ash and phosphate fertilizer have low total neutralizing values (20.5% and 6.7%, respectively) and lower carbonate concentrations.
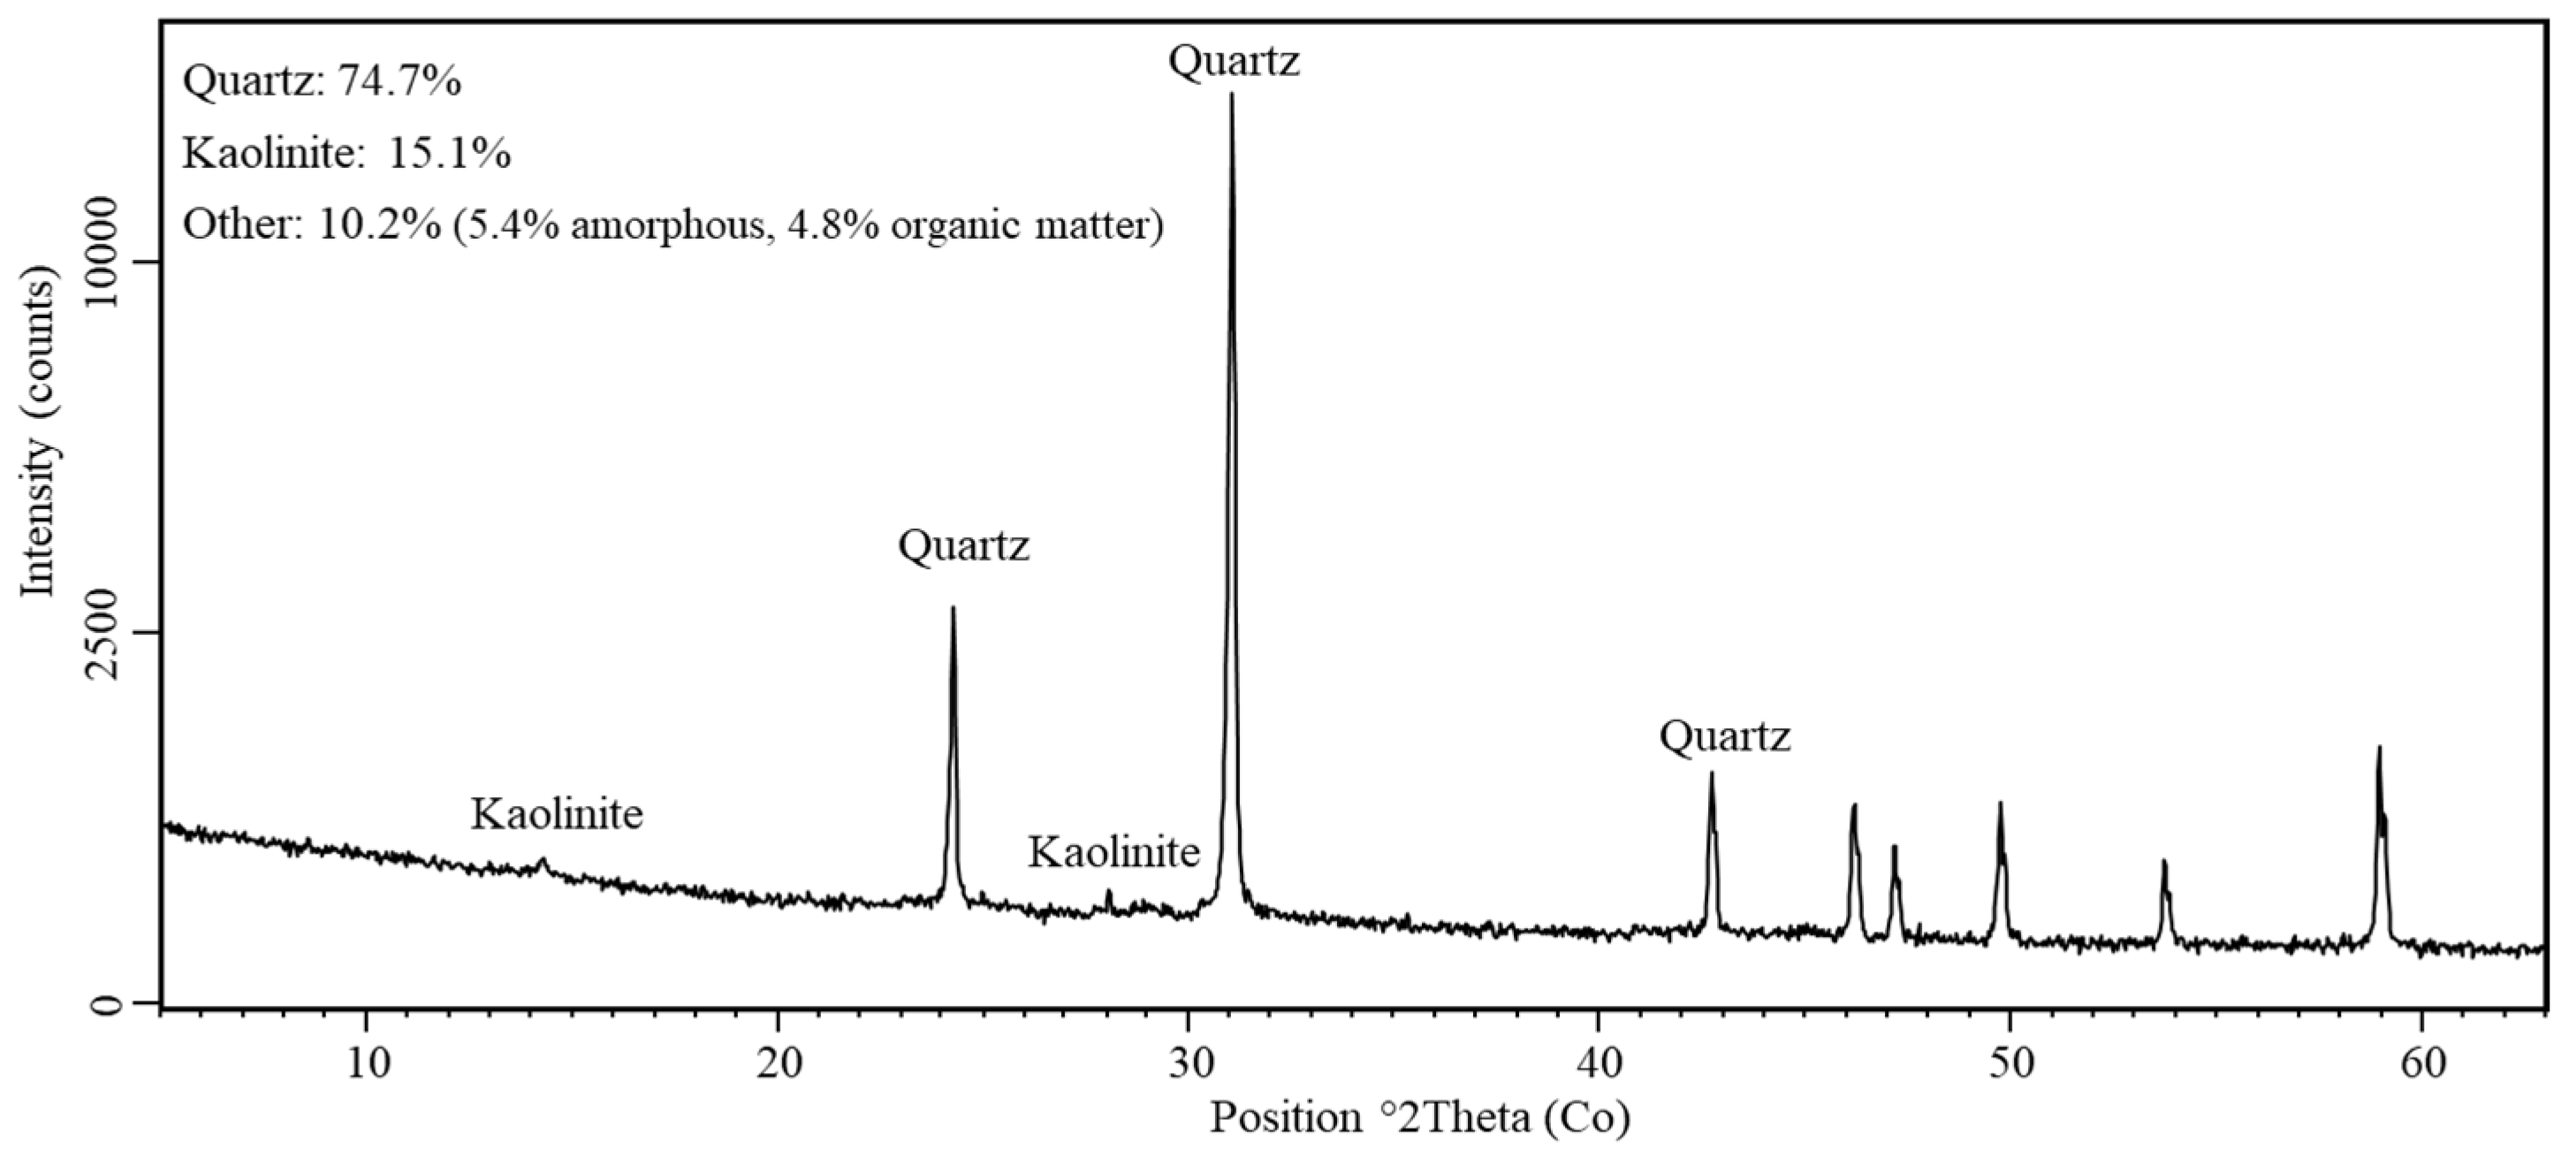
The increase in soil pH caused by the application of ash was possibly attributed to the large number of amorphous components in this material, accounting for more than 50% of the total content [14]. These amorphous compounds host Ca, Mg, and K oxides, which can form carbonates and bicarbonates when in contact with atmospheric conditions [16]. When exposed to soil solutions, these minerals dissociate into OH or HCO3, and these ions, in turn, neutralize H+ and Al+3 ions that are mainly responsible for soil acidity [9].
The release of OH or HCO3 ions and increases in the pH values of the soils were also accompanied by release of the exchangeable cations Ca2+ and Mg2+ in the soil solutions. As shown in Figure 3 and Table 3, the increases in the levels of these nutrients were caused by the increasing input of ash in the soil, with significant and positive correlation coefficients (r > 0.92).
The Ca and Mg levels showed significant and positive differences among the ash treatments and control soil, with moderate coefficients of variation (CV between 57.7 and 65.9%) (Table 3). The highest concentrations of these nutrients were obtained at 20 days of incubation, with a slight decrease at 40 and 60 days (Figure 3d,e). As expected, the treatment with 70 Mg ha−1 of ash provided the highest amounts of Ca and Mg, with moderate to high levels of Ca (2.70–4.17 cmolc dm−3) and Mg (1.30–1.40 cmolc dm−3), while the concentrations of these nutrients in the control soil were only 0.33 and 0.20 cmolc dm−3, respectively (Table 3). The polynomial regression model best fit these results, obtaining, from Equations (7) and (10) (Figure 3d,e), the maximum Ca (4.34 cmolc dm−3) and Mg (1.62 cmolc dm−3) contents with 64 and 69 Mg ha−1 of ash, respectively. According to the recommendations for the liming and fertilization of the soils of the state of Pará [20], the sums of the Ca and Mg contents obtained by ash applications were within the mean (2–5 cmolc dm−3) and high (>5 cmolc dm−3) values required for most crops in the region. Notably, moderate levels of Ca + Mg were observed in the treatment with the lowest ash level (8.75 Mg ha−1).
The Ca and Mg values obtained in the soils with increasing ash doses were lower than the levels obtained in the lime treatment (Figure 3f and Table 3). This effect was expected because lime has Ca and Mg concentrations of 240 and 83 g dm−3, respectively, while ash contains 74 g dm−3 of Ca and 12 g dm−3 of Mg. On the other hand, the treatment with the lowest dose of ash (8.75 t ha−1) showed Ca + Mg contents higher than those observed in the treatment with phosphate fertilizer (Figure 3f).
Saarsalmi et al. [21], in a study on the application of wood ash to soil in which wild pine (Pinus sylvestris L.) was grown, also demonstrated that ash input can reduce soil acidity and increase the levels of exchangeable cations (Ca2+ and Mg2+). In addition, these authors demonstrated that these effects persisted even after 16 years of ash application. Hansen et al. [7], in a study on the application of a mixture of heavy ash and fly ash, showed that the application of even high doses of ash (30 t ha−1) did not cause heavy metal toxicity in the soil.
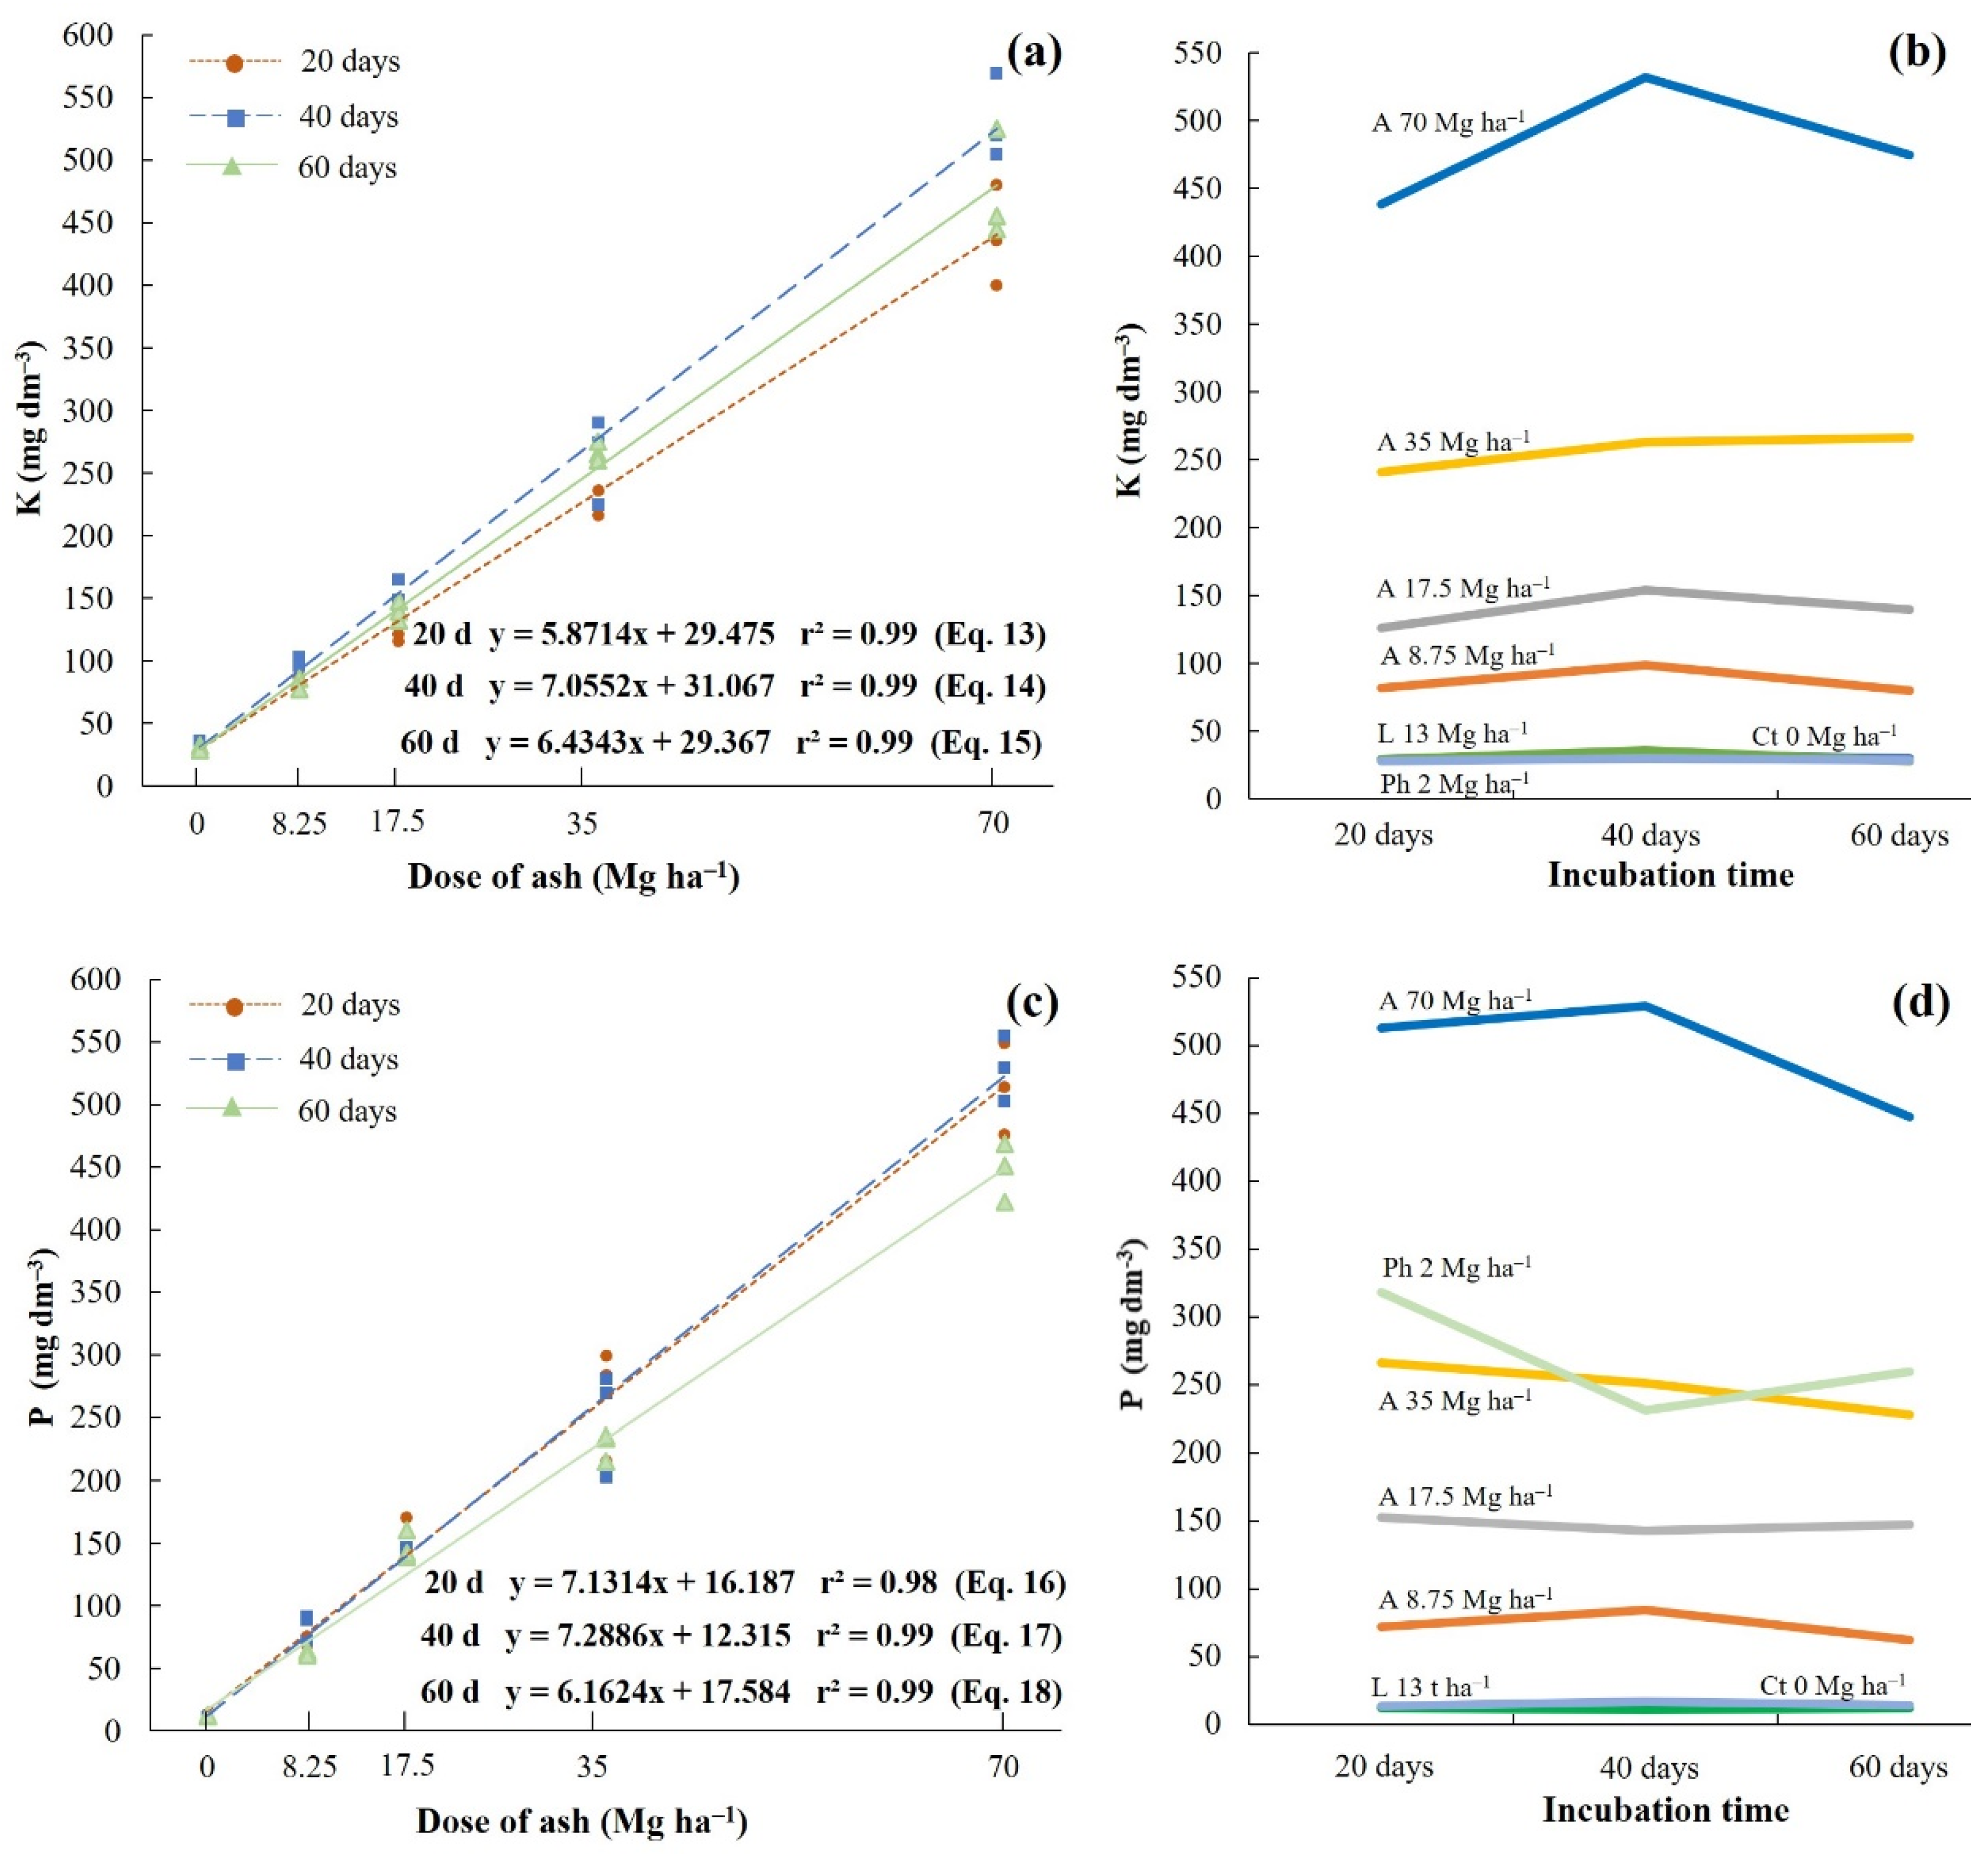
Increasing doses of ash also had positive effects on the release and increase of exchangeable K+ levels in the soil. The concentrations of this nutrient showed significant differences between the ash treatments and the control soil, with coefficients of variation above 88.5% (Table 4). As shown in Figure 4a and Table 4, the three incubation times showed linear relationships between the increasing ash doses and the nutrient K levels in the soil, demonstrating a high correlation coefficient between these two variables (r > 0.99). The highest concentrations of K were obtained after 40 days of incubation, and as with the other cations (Ca2+ and Mg2+), the dose of 70 Mg ha−1 of ash was responsible for the greatest input of this nutrient (531.7 g dm−3) (Figure 4a,b). According to the liming and fertilization recommendations [20], this content is considered very high for the soils of the State of Pará, especially Latosols. It is important to note that the smallest ash addition (8.75 Mg ha−1) increased the low level of soil K (from an initial value of 33.7 g dm−3) to a high level (80 to 98.7 g dm−3). As shown in Figure 4b, the K levels obtained in the treatments with ash were higher and, in general, showed significant differences from the levels obtained in the treatments with lime and phosphate fertilizer.
The concentration of exchangeable cations, such as K+, Ca2+, and Mg2+, increases in soils treated with ash because these elements are present mainly in the form of highly reactive oxides and/or hydroxides, making K, Ca, and Mg the most soluble elements in ashes [14,22].
Similar to K, the extractable P contents increased linearly with increasing ash doses (Figure 4c), with a high correlation coefficient between these two variables (r > 0.99) (Table 4). The concentration of this nutrient in the soil also showed significant changes among the treatments with ash, with a coefficient of variation above 95%. The highest p levels were obtained within 40 days of incubation and at a dose of 70 Mg ha−1 of ash, which is directly related to better soil pH conditions (Figure 3a,b) [23,24]. The average content obtained in this treatment was 529 g dm−3, which is considered very high for a Latosol from the state of Pará, Brazil [20]. It is important to note that the lowest ash dose (8.75 Mg ha−1) also provided very high levels of available P in the soil (84.4 g dm−3). In addition, the P levels obtained in the treatment with 35 Mg ha−1 of ash (228.07–266.50 mg dm−3) showed significant similarities with the levels obtained in the treatment with phosphate fertilizer (231.23–318.20 mg dm−3) (Table 4 and Figure 4d).
Another important factor that contributed to the increase in P availability in the soil treated with ash was a reduction in the concentration of exchangeable Al3+, which is one of the main elements responsible for P immobilization and its precipitation in the form of Al-phosphates in acidic soils from the Amazon region [25].
As shown in Table 5, increases in the concentrations of exchangeable cations in the soil (K+, Ca2+, and Mg2+), conferred by the increases in ash doses, produced significant and positive effects on the base saturation of CEC at a soil pH of 7.0 (V), increasing from ~3.6% in the control soil to ~40% in the treatment with 70 Mg h−1 of ash. Consequently, the increasing base saturation of CEC contributed significantly to a reduction in the CEC of aluminum saturation (m), reducing from ~81.6% in the control soil to ~1.7% in the treatment with 70 Mg h−1 ash, thus resulting in an inversely proportional relationship between these two attributes. A base saturation (V) of ~20%, obtained at 17.5 Mg ha−1, reduced the aluminum saturation (m) to less than 4% at 40 and 60 days of incubation, which is considered adequate for most crops of the state of Pará [20].
The application of ash to the soil, even in large quantities, did not increase the potential acidity (H + Al) of the soil or increase the concentration of exchangeable Al+ (Table 5). As seen in Table 5, increasing ash doses caused significant reductions in Al3+ levels and moderate changes in potential acidity. The lower concentration of exchangeable Al+3 probably resulted from the release of OH or HCO3 ions or from the presence of soluble Si in the ash, which may have captured Al to form aluminum silicates. Regarding potential acidity, moderate reduction was mainly promoted by the immobilization of Al3+, which favors the absorption of micronutrients by plants [11].
The application of ash generally did not have significant effects on the levels of OM and CEC (Table 6). This behavior was expected because OM contents are oxidized and transformed into gaseous constituents during biomass combustion [10,16]. Low levels of CEC are associated with the absence of clay minerals and reduced concentrations of OM in the ash.
The benefits of ash on soil fertility, such as reduced acidity and increased nutrient input, were also demonstrated by [7,12,26] and other studies. However, its application to soil requires attention because high doses can result in high soil salinity, promote toxicity by micronutrients and heavy metals, and compromise soil aeration [27,28,29].
Therefore, due to the large amount of ash necessary to promote increases in pH and increase the availability of P and exchangeable cations, the reuse of the mineral waste studied here is more suitable for the cultivation of undemanding agricultural species or for silviculture purposes [14,30]. A second alternative is its reuse as a nutritional additive/supplement to phosphate fertilizer. In addition to representing a solution to the waste disposal problem produced by the industry, this approach could also improve the agronomic efficiency of phosphate fertilizer because ash can raise the soil pH, increase the availability of P, K, Ca, and Mg, and reduce the toxicity of exchangeable Al3+.

4. Conclusions

The application of ash from Amazonian biomasses to an acidic and nutrient-deficient Yellow Latosol showed that this mineral residue can moderately raise the soil pH, with an increase between 1.17 and 1.60 in pH units. The doses of 35 and 70 Mg ha−1 of ash and the incubation time of 40 days were the treatments that most contributed to the decrease in soil acidity. The ash application also promoted significant and positive changes in the availability of essential nutrients for plants, such as K, P, Ca, and Mg, with higher levels obtained in the 70 Mg ha−1 treatment and between 20 and 40 days of incubation. The increase in exchangeable cations (K+, Ca2+, and Mg2+) and the release of OH ions caused positive effects on the base saturation of the soil CEC, which reduced Al3+ saturation and toxicity. In addition, in general, the effects of ash on the soil chemical attributes remained positive and significant during the two months of soil incubation.
Therefore, the recycling of ash from Amazonian biomasses in soils, either in a pure form or as an additive to other fertilizers, is an alternative method for returning to the soils the nutrients extracted through agricultural and forest production. For this purpose and as a guide for future research, agronomic field tests with agricultural or forest crops should be performed to evaluate the short- and long-term effects of ash on the soil-plant system.

Author Contributions

Conceptualization, validation, formal analysis, investigation, visualization, writing—original draft preparation, A.R.L.A.; methodology, M.A.P.G., V.M.N.L. and A.O.R.; project administration, funding acquisition, and supervision, R.S.A. and S.P.A.P. All authors have read and agreed to the published version of the manuscript.

Funding

This research was funded by the National Council for Scientific and Technological Development—CNPq, Brazil, grant numbers: 166.437/2020-4 for the first author; 309.176/2019-0 and 407.067/2021-3 for the fifth author; and 313.571/2021-0 for the last author.

Institutional Review Board Statement

Not applicable.

Data Availability Statement

The data presented in this research are contained within the present article.

Acknowledgments

The authors acknowledge the Viso Fertilizantes company for assistance with fieldwork and providing samples, the PPGG-UFPA for the use of laboratory space, collaborators from the LCM laboratory, and the CNPq foundation for providing grants to the authors. This research work is part of Ph.D. Thesis No. 158 in Geology and Geochemistry of the Federal University of Pará, Brazil.

Conflicts of Interest

The authors declare no conflict of interest.

References

  1. CNA, Confederação da Agricultura e Pecuária do Brasil (Brazilian Confederation of Agriculture and Livestock). Agro maduro e Moderno (Mature and Modern Agribusiness). 2021. Available online: https://www.cnabrasil.org.br/artigos/agro-maduro-e-moderno (accessed on 9 May 2022).
  2. ANDA, Associação Nacional para Difusão de Adubos (Brazilian Association for the Diffusion of Fertilizers). Fertilizantes: Controle de qualidade (Fertilizers: Quality Control). 2018. Available online: http://www.anda.org.br (accessed on 8 July 2022).
  3. EPE, Empresa de Pesquisa Energética (Energy Research Company). Anauário Estatísitico de Energia Elétrica (Statistical Yearbook of Electric Energy). 2021. Available online: https://www.epe.gov.br/pt/imprensa/noticias/fact-sheet-anuario-estatistico-de-energia-eletrica-2022 (accessed on 5 June 2022).
  4. Vidal, A.C.F.; Hora, A.B. Perspectivas do Setor de Biomassa de Madeira Para a Geração de Energia (Perspectives of the Wood Biomass Sector for Energy Generation); BNDES: Brasília, Brazil, 2011; pp. 261–314. Available online: https://www.bnds.bov.br/bibliotecadigital (accessed on 15 May 2022).
  5. Costa, L.M.; Silva, M.F.O. A Indústria Química e o Setor de Fertilizantes (The Chemical Industry and the Fertilizer Business); BNDES: Brasília, Brazil, 2012; p. 50. [Google Scholar]
  6. Almeida, M.E.; Abram, M.B.; Chemale, L.T.; Paes, V.J.C.; Silveira, F.V. Diretrizes Para Avaliação dos Minerais Estratégicos: Fosfato, Potássio, Terras Raras e lítio (Guidelines for the Assessment of Strategic Minerals: Phosphate, Potassium, Rare Eath, and Lithium); CPRM—Geological Survey of Brazil: Brasília, Brazil, 2015; p. 31. [Google Scholar]
  7. Hansen, M.; Kepfer-Rojas, S.; Bjerager, P.E.R.; Holm, P.E.; Skov, S.; Ingerslev, M. Effects of ash application on nutrient and heavy metal fluxes in the soil and soil solution in a Norway spruce plantation in Denmark. For. Ecol. Manag. 2018, 424, 494–504. [Google Scholar] [CrossRef]
  8. Vassilev, S.V.; Baxter, D.; Andersen, L.K.; Vassileva, C.G. An overview of the composition and application of biomass ash. Part 1. Phase-mineral and chemical composition and classification. Fuel 2013, 105, 40–76. [Google Scholar] [CrossRef]
  9. Adotey, N.; Harrell, D.L.; Weatherford, W.P. Characterization and Liming Effect of Wood Ash Generated from a Biomass-Fueled Commercial Power Plant. Commun. Soil Sci. Plant Anal. 2018, 49, 38–49. [Google Scholar] [CrossRef]
  10. Vassilev, S.V.; Baxter, D.; Andersen, L.K.; Vassileva, C.G. An overview of the composition and application of biomass ash.: Part 2. Potential utilisation, technological and ecological advantages and challenges. Fuel 2013, 105, 19–39. [Google Scholar] [CrossRef]
  11. Demeyer, A.; Voundi Nkana, J.C.; Verloo, M.G. Characteristics of wood ash and influence on soil properties and nutrient uptake: An overview. Bioresour. Technol. 2001, 77, 287–295. [Google Scholar] [CrossRef]
  12. Quirantes, M.; Calvo, F.; Romero, E.; Nogales, R. Soil-nutrient availability affected by different biomass-ash applications. J. Soil Sci. Plant Nutr. 2016, 16, 159–163. [Google Scholar] [CrossRef] [Green Version]
  13. Silva, C.; Cruz, N.C.; Tarelho, L.A.C.; Rodrigues, M.; Santiago, D. Use of biomass ash-based materials as soil fertilisers: Critical review of the existing regulatory framework. J. Clean. Prod. 2019, 214, 112–124. [Google Scholar] [CrossRef]
  14. Albuquerque, A.R.L.; Merino, A.; Angélica, R.S.; Omil, B.; Paz, S.P.A. Performance of ash from Amazonian biomasses as an alternative source of essential plant nutrients: An integrated and eco-friendly strategy for industrial waste management in the lack of raw fertilizer materials. J. Clean. Prod. 2022, 360, 132222. [Google Scholar] [CrossRef]
  15. Vassilev, S.V.; Vassileva, C.G.; Vassilev, V.S. Advantages and disadvantages of composition and properties of biomass in comparison with coal: An overview. Fuel 2015, 158, 330–350. [Google Scholar] [CrossRef]
  16. Albuquerque, A.R.L.; Angélica, R.S.; Merino, A.; Paz, S.P.A. Chemical and mineralogical characterization and potential use of ash from Amazonian biomasses as an agricultural fertilizer and for soil amendment. J. Clean. Prod. 2021, 295, 126472. [Google Scholar] [CrossRef]
  17. Romero, E.; Quirantes, M.; Nogales, R. Characterization of biomass ashes produced at different temperatures from olive-oil-industry and greenhouse vegetable wastes. Fuel 2017, 208, 1–9. [Google Scholar] [CrossRef]
  18. Vassilev, S.V.; Baxter, D.; Andersen, L.K.; Vassileva, C.G.; Morgan, T.J. An overview of the organic and inorganic phase composition of biomass. Fuel 2012, 94, 1–33. [Google Scholar] [CrossRef]
  19. Embrapa. Manual de Análises Químicas de Solos, Plantas e Fertilizantes (Handbook of Chemical Analysis of Soils, Plants and Fertilizers), 2nd ed.; Embrapa—Brazilian Agricultural Research Company: Brasília, Brazil, 2009; p. 225. [Google Scholar]
  20. Embrapa. Recomendação de Calagem e Adubação para o Estado do Pará (Liming and Fertilization Recommendation for Pará State), 2nd ed.; Embrapa—Brazilian Agricultural Research Company: Brasília, Brazil, 2020; p. 424. [Google Scholar]
  21. Saarsalmi, A.; Mälkönen, E.; Piirainen, S. Effects of wood ash fertilization on forest soil chemical properties. Silva Fenn. 2001, 35, 355–368. [Google Scholar] [CrossRef] [Green Version]
  22. Etiegni, L.; Campbell, A.G. Physical and chemical characteristics of Wood Ash. Bioresour. Technol. 1991, 37, 173–178. [Google Scholar] [CrossRef]
  23. Maresca, A.; Hyks, J.; Astrup, T.F. Long-term leaching of nutrients and contaminants from wood combustion ashes. Waste Manag. 2018, 74, 373–383. [Google Scholar] [CrossRef] [Green Version]
  24. Maresca, A.; Krüger, O.; Herzel, H.; Adam, C.; Kalbe, U.; Astrup, T.F. Influence of wood ash pre-treatment on leaching behaviour, liming and fertilising potential. Wast Manag. 2019, 83, 113–122. [Google Scholar] [CrossRef]
  25. Brasil, E.C.; Dantas, R.C.R.; Silva Júnior, M.L.; Gama, M.A.P. Phosphorus Fraction in a Yellow Latosol Cropped Under No-tilage System in the Brazilian Amazon. J. Agric. Stud. 2020, 8, 484–504. [Google Scholar] [CrossRef]
  26. Omil, B.; Sánchez-Rodríguez, F.; Merino, A. Effects of ash applications on soil status, nutrition, and growth of Pinus radiata D. Don plantations. Recycl. Biomass Ashes 2011, 1, 68–86. [Google Scholar] [CrossRef]
  27. Khan, A.A.; Jong, W.; Jansens, P.J.; Spliethoff, H. Biomass combustion in fluidized bed boilers: Potential problems and remedies. Fuel Process. Technol. 2009, 90, 21–50. [Google Scholar] [CrossRef]
  28. James, A.K.; Thring, R.W.; Helle, S.; Ghuman, H.S. Ash management review-Applications of Biomass Bottom Ash. Energies 2012, 5, 3856–3873. [Google Scholar] [CrossRef]
  29. Voshell, S.; Mäkelä, M.; Dahl, O. A review of biomass ash properties towards treatment and recycling. Renew. Sustain. Energy Rev. 2018, 96, 479–486. [Google Scholar] [CrossRef]
  30. Pandey, V.C.; Singh, N. Impact of fly ash incorporation in soil systems. Agric. Ecosyst. Environ. 2010, 136, 16–27. [Google Scholar] [CrossRef]
Figure 1. Yellow Latosol profile (a) and the surface horizon used in the incubation test (b).
Agriculture 12 02093 g001
Figure 2. X-ray diffractogram of the Yellow Latosol showing its main constituents, represented by quartz, kaolinite, amorphous phase, and organic matter.
Agriculture 12 02093 g002
Figure 3. Chemical attributes of the Yellow Latosol after the three incubation times: pH in H2O (a), pH in CaCl2 (b), and extractable Ca (d) and Mg (e) levels as a function of ash doses; evolution of pHCaCl2 (c) and Ca + Mg (f) contents as a function of the three incubation times in the control soil (Ct) and soil treated with different ash doses (A), lime (L), and phosphate fertilizer (Ph).
Agriculture 12 02093 g003
Figure 4. Chemical attributes of the Yellow Latosol after the three incubation times: extractable K (a) and P (c) as a function of the ash doses; evolution of K (b) and P (d) levels as a function of the three incubation times of the control soil (Ct) and soil treated with different ash doses (A), lime (L), and phosphate fertilizer (P).
Agriculture 12 02093 g004
Table 1. Total and soluble chemical components of ash from Amazonian biomasses.
Parameters/ElementsTotalParameters/ElementsTotal
pH (CaCl2)12mg kg−1
%B39.98
Total neutralizing value20.5Co<4.0
Organic matter2.08Cu51.0
C0.30Mn1082.0
N0.17Fe37,903.0
g kg−1Na4235.5
P total15.51Ni5.0
P (2% citric acid soluble)11.02Zn17.0
K total22.03Mo18.0
K (2% citric acid soluble)7.89Sr8886.0
Ca73.71Cr35.7
Mg12.20As<4.0
S1.26Cd<0.00
Si170.81Hg<0.01
Al71.40Pb0.75
CCE, calcium carbonate equivalence. Modified from Albuquerque et al. [16].
Table 2. Initial chemical and physical properties of the Yellow Latosol.
pH 1pH 2OMPKSCaMgAlH + AlSBCECmVSdStCl
g dm−3mg dm−3cmolc dm−3%
3.93.04882890.20.12120.413872.582513
1 pH in H2O; 2 pH in CaCl2; OM, organic matter; SB, sum of bases; CEC, cation exchange capacity at pH 7; m, Al saturation; V, base saturation; Sd, sand; St, silt; Cl, clay.
Table 3. Chemical properties of Yellow Latosol as a function of the application of ash from Amazonian biomasses, lime, and phosphate fertilizer. The mean values and standard deviations of the pH and exchangeable cations obtained after the three incubation times are shown.
TreatmentspH H2OpH CaCl2
20 Days40 Days60 Days20 Days40 Days60 Days
Ct 0 Mg ha−14.1 ± 0.14 d4.1 ± 0.12 d4.1 ± 0.17 c3.1 ± 0.05 d3.1 ± 0.05 d3.1 ± 0.09 d
A 8.75 Mg ha−14.5 ± 0.05 cd4.9 ± 0.12 c4.4 ± 0.08 c3.6 ± 0.05 cd3.8 ± 0.05 c3.4 ± 0.05 d
A 17.5 Mg ha−14.8 ± 0.12 bc5.0 0.12 c5.1 ± 0.12 b3.8 ± 0.05 c4.0 ± 0.09 bc3.9 ± 0.05 c
A 35 Mg ha−15.3 ± 0.00 b5.5 ± 0.08 bc5.4 ± 0.12 b4.3 ± 0.12 b4.4 ± 0.05 b4.2 ± 0.05 bc
A 70 Mg ha−15.4 ± 0.12 b5.7 0.05 b5.6 ± 0.29 b4.7 ± 0.33 b4.7 ± 0.05 b4.4 ± 0.17 b
CV11.01%12.18%13.61%15.69%15.44%14.79%
r0.860.860.850.910.900.88
L 13 Mg ha−16.0 ± 0.05 a6.6 ± 0.14 a6.1 ± 0.50 a5.6 ± 0.12 a5.9 ± 0.12 a5.4 ± 0.26 a
Ph 2 Mg ha−14.1 ± 0.05 d4.2 0.12 d4.0 ± 0.08 c3.2 ± 0.05 d3.2 ± 0.05 d3.2 ± 0.05 d
TreatmentsCa cmolc dm−3Mg cmolc dm−3
20 days40 days60 days20 days40 days60 days
Ct 0 Mg ha−10.33 ± 0.05 f0.20 ± 0.00 f0.20 ± 0.00 e0.20 ± 0.00 e0.20 ± 0.00 e0.20 ± 0.00 e
A 8.75 Mg ha−11.53 ± 0.05 e1.27 ± 0.05 e0.90 ± 0.00 d0.53 ± 0.05 d0.50 ± 0.00 d0.50 ± 0.00 d
A 17.5 Mg ha−12.23 ± 0.05 d1.87 ± 0.05 d1.53 ± 0.05 c0.73 ± 0.05 d0.70 ± 0.00 cd0.70 ± 0.00 cd
A 35 Mg ha−13.37 ± 0.05 c2.50 ± 0.08 c1.97 ± 0.05 c1.10 ± 0.00 c0.97 ± 0.05 c0.97 ± 0.05 c
A 70 Mg ha−14.17 ± 0.24 b3.17 ± 0.19 b2.70 ± 0.00 b1.40 ± 0.08 b1.30 ± 0.00 b1.37 ± 0.05 b
CV64.75%63.38%65.88%59.30%57.68%59.69%
r0.940.920.950.950.960.97
L 13 Mg ha−15.73 ± 0.25 a4.03 ± 0.12 a3.50 ± 0.14 a4.03 ± 0.21 a3.87 ± 0.05 a5.03 ± 0.25 a
Ph 2 Mg ha−10.67 ± 0.24 f0.37 ± 0.05 f0.37 ± 0.05 e0.20 ± 0.00 e0.20 ± 0.00 e0.10 ± 0.00 e
Means and standard deviations of three replicates; coefficient of variation (CV) and correlation coefficient (r) between the treatments with increasing ash doses (A) and the control soil (Ct); lime (L) and phosphate fertilizer (Ph) treatments. Different letters denote significant differences at a level of p < 0.05.
Table 4. Chemical attributes of Yellow Latosol as a function of the application of ash from Amazonian biomasses, lime, and phosphate fertilizer. Mean values and standard deviations of extractable K and P nutrients after the three incubation times.
TreatmentsK mg dm−3P mg dm−3
20 Days40 Days60 Days20 Days40 Days60 Days
Ct 0 Mg ha−129.7 ± 1.9 d33.7 ± 1.7 d30.0 ± 1.4 d12.7 ± 0.5 d11.1 ± 0.6 d12.1 ± 0.4 d
A 8.75 Mg ha−182.3 ± 3.4 cd98.7 ± 3.1 c80.0 ± 4.2 d72.3 ± 2.9 cd84.4 ± 8.4 cd62.1 ± 1.3 cd
A 17.5 Mg ha−1126.0 ± 10.8 c154.0 ± 7.8 c139.7 ± 6.5 c152.5 ± 12.7 c142.7 ± 3.8 c147.1 ± 9.2 bc
A 35 Mg ha−1241.3 ± 23.2 b263.3 ± 27.8 b266.6 ± 6.2 b266.5 ± 36.3 b251.0 ± 34.5 b228.1 ± 9.2 b
A 70 Mg ha−1438.7 ± 32.7 a531.7 ± 27.8 a475.0 ± 35.6 a512.9 ± 29.8 a529.0 ± 21.3 a447.3 ± 19.2 a
CV88.52%90.36%89.87%97.08%99.15%95.33%
r0.990.990.990.990.991.00
L 13 Mg ha−129.7 ± 1.2 d36.0 ± 2.9 d28.3 ± 1.2 d13.6 ± 0.3 d16.7 ± 0.9 d14.5 ± 0.4 d
Ph 2 Mg ha−128.3 ± 1.2 d30.0 ± 1.6 d28.7 ± 0.9 d318.2 ± 94.7 a231.2 ± 94.8 b259.7 ± 26.9 b
Means and standard deviations of three replicates; coefficient of variation (CV) and correlation coefficient (r) between the treatments with increasing ash doses (A) and the control soil (Ct); lime (L) and phosphate fertilizer (Ph) treatments. Different letters denote significant differences at a level of p < 0.05.
Table 5. Chemical attributes of the Yellow Latosol as a function of the application of ash from Amazonian biomasses, lime, and phosphate fertilizer. Mean values and standard deviations of base saturation (V) and Al (m), Al content, and potential acidity (H + Al) obtained after the three incubation times.
TreatmentsV%m%
20 Days40 Days60 Days20 Days40 Days60 Days
Ct 0 Mg ha−14.62 ± 0.37 f3.11 ± 0.54 f3.20 ± 0.17 f80.21 ± 0.92 d82.34 ± 0.30 c82.39 ± 0.58 c
A 8.75 Mg ha−116.04 ± 1.01 e15.13 ± 0.54 e10.80 ± 0.41 e39.06 ± 2.70 c33.86 ± 1.60 b48.78 ± 1.85 b
A 17.5 Mg ha−122.25 ± 0.99 d21.30 ± 1.44 d17.90 ± 0.65 d23.90 ± 0.42 b3.27 ± 0.07 a3.72 ± 0.05 a
A 35 Mg ha−133.86 ± 0.57 c31.16 ± 0.77 c26.52 ± 1.17 c1.93 ± 0.04 a2.36 ± 0.11 a2.69 ± 0.08 a
A 70 Mg ha−143.19 ± 1.49 b41.57 ± 1.26 b34.97 ± 3.49 b1.48 ± 0.08 a1.69 ± 0.06 a1.86 ± 0.04 a
CV62.78%65.71%67.14%111.06%141.59%130.56%
r0.950.950.95−0.81−0.69−0.73
L 13 Mg ha−165.11 ± 1.67 a69.21 ± 2.98 a66.57 ± 3.06 a1.01 ± 0.05 a1.24 ± 0.03 a1.15 ± 0.04 a
Ph 2 Mg ha−17.46 ± 1.50 f4.75 ± 0.46 f4.04 ± 0.42 f70.44 ± 5.04 d75.01 ± 1.62 c79.80 ± 1.80 c
TreatmentsAl cmolc dm−3H + Al cmolc dm−3
20 days40 days60 days20 days40 days60 days
Ct 0 Mg ha−12.47 ± 0.12 d2.27 ± 0.05 c2.23 ± 0.09 c12.60 ± 0.75 c15.70 ± 3.11 c14.47 ± 0.78 c
A 8.75 Mg ha−11.47 ± 0.17 c1.03 ± 0.05 b1.53 ± 0.12 b11.97 ± 0.8 bc11.33 ± 0.21 b13.47 ± 0.5 bc
A 17.5 Mg ha−11.03 ± 0.05 b0.10 ± 0.00 a0.10 ± 0.00 a11.53 ± 0.9 bc11.00 ± 0.94 b11.90 ± 0.4 bc
A 35 Mg ha−10.10 ± 0.00 a0.10 ± 0.00 a0.10 ± 0.00 a9.93 ± 0.19 bc9.17 ± 0.69 b10.03 ± 0.46 b
A 70 Mg ha−10.10 ± 0.00 a0.10 ± 0.00 a0.10 ± 0.00 a8.80 ± 0.50 b8.20 ± 0.51 b9.93 ± 1.23 b
CV96.59%132.56%123.89%14.24%26.07%16.68%
r−0.85−0.69−0.72−0.88−0.72−0.81
L 13 Mg ha−10.10 ± 0.00 a0.10 ± 0.00 a0.10 ± 0.00 a5.27 ± 0.17 a3.57 ± 0.42 a4.37 ± 0.71 a
Ph 2 Mg ha−12.20 ± 0.08 d1.93 ± 0.12 c2.13 ± 0.05 c11.53 ± 0.34 c12.93 ± 0.52 c12.83 ± 0.26 c
Means and standard deviations of three replicates; coefficient of variation (CV) and correlation coefficient (r) between the treatments with increasing ash doses (A) and control soil (Ct); lime (L) and phosphate fertilizer (Ph) treatments. Different letters denote significant differences at a level of p < 0.05.
Table 6. Chemical attributes of Yellow Latosol as a function of the application of ash from Amazonian biomasses, lime, and phosphate fertilizer. Mean values and standard deviations of the organic matter (OM) content and cation exchange capacity (CEC) obtained after the three incubation times.
TreatmentsOM g dm−3CEC cmolc dm−3
20 Days40 Days60 Days20 Days40 Days60 Days
Ct 0 Mg ha−147.67 ± 1.25 b51.67 ± 2.49 b48.67 ± 3.86 b13.21 ± 0.76 a16.19 ± 3.11 a14.94 ± 0.78 a
A 8.75 Mg ha−153.00 ± 3.56 a46.00 ± 1.41 b53.00 ± 2.45 a14.24 ± 0.81 a13.35 ± 0.16 ab14.87 ± 0.54 a
A 17.5 Mg ha−153.67 ± 4.03 a58.67 ± 2.62 a59.33 ± 3.30 a14.82 ± 0.94 a13.96 ± 0.95 ab14.49 ± 0.41 a
A 35 Mg ha−157.00 ± 2.45 a49.67 ± 2.05 b55.67 ± 4.99 a15.02 ± 0.23 a13.31 ± 0.87 ab13.63 ± 0.46 a
A 70 Mg ha−151.33 ± 5.19 b48.33 ± 1.25 b52.67 ± 6.60 a15.49 ± 0.74 a14.03 ± 0.66 ab15.22 ± 1.11 a
CV6.50%9.48%7.33%6.01%8.31%4.16%
r0.17−0.210.100.63−0.220.05
L 13 Mg ha−152.00 ± 1.41 b45.33 ± 3.86 b49.33 ± 1.89 b15.11 ± 0.34 a11.56 ± 0.26 b12.97 ± 1.00 a
Ph 2 Mg ha−149.00 ± 1.41 b49.67 ± 3.68 b46.00 ± 3.56 b12.47 ± 0.57 a13.58 ± 0.50 a13.37 ± 0.22 a
Means and standard deviations of three replicates; coefficient of variation (CV) and correlation coefficient (r) between the treatments with increasing ash doses (A) and control soil (Ct); lime (L) and phosphate fertilizer (Ph) treatments. Different letters denote significant differences at a level of p < 0.05.
Publisher’s Note: MDPI stays neutral with regard to jurisdictional claims in published maps and institutional affiliations.

