

Identification of Optimal Starting Time Instance to Forecast Net Blotch Density in Spring Barley with Meteorological Data in Finland

Abstract
:1. Introduction
2. Materials and Methods
2.1. Data
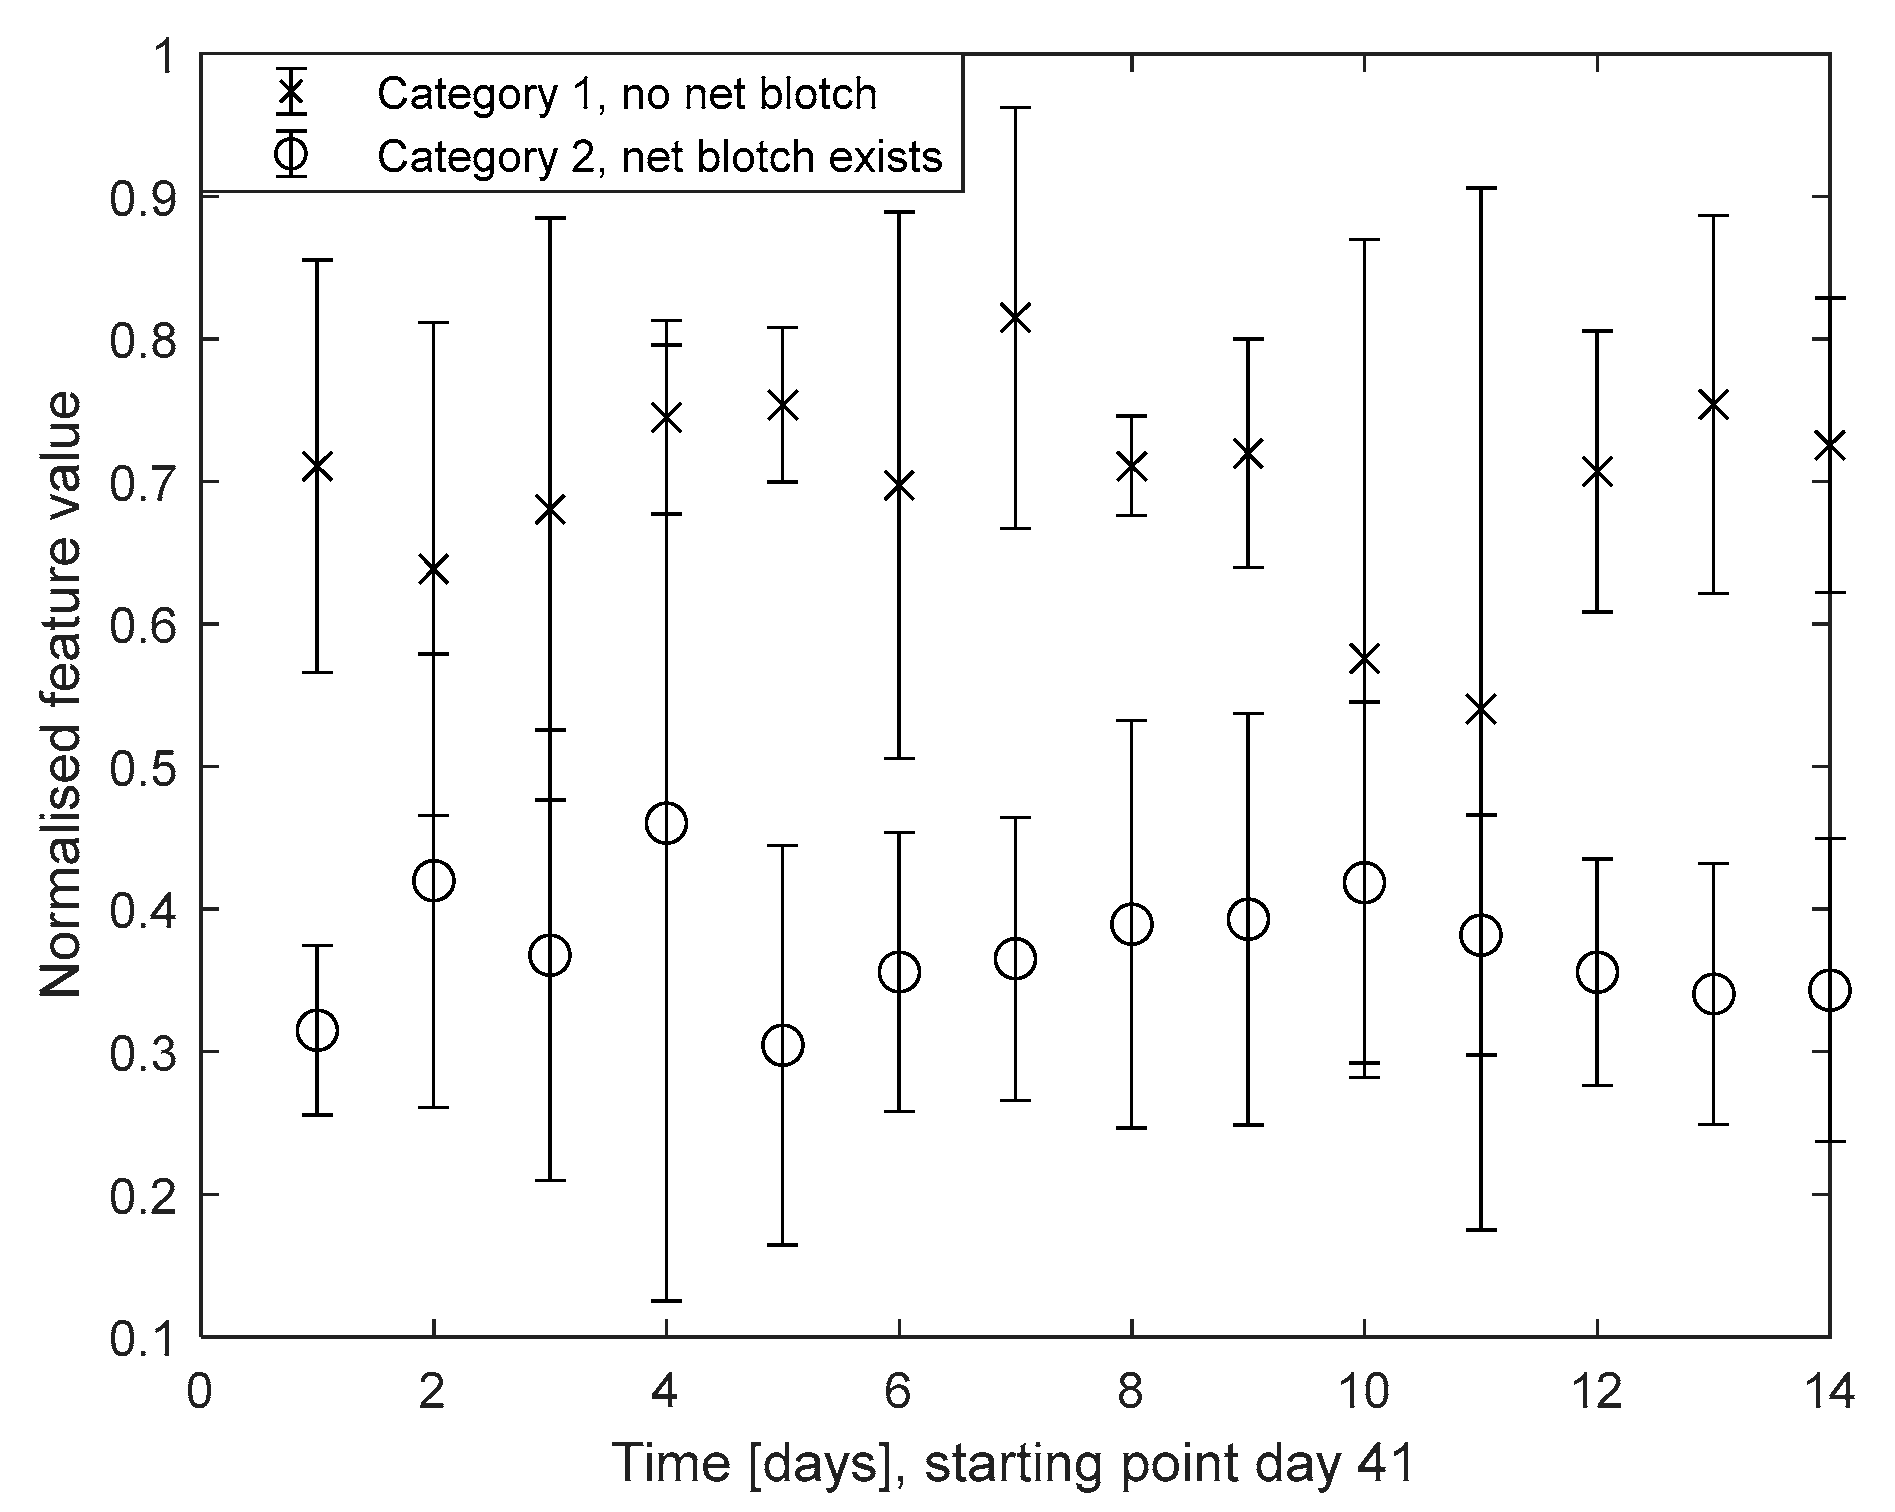
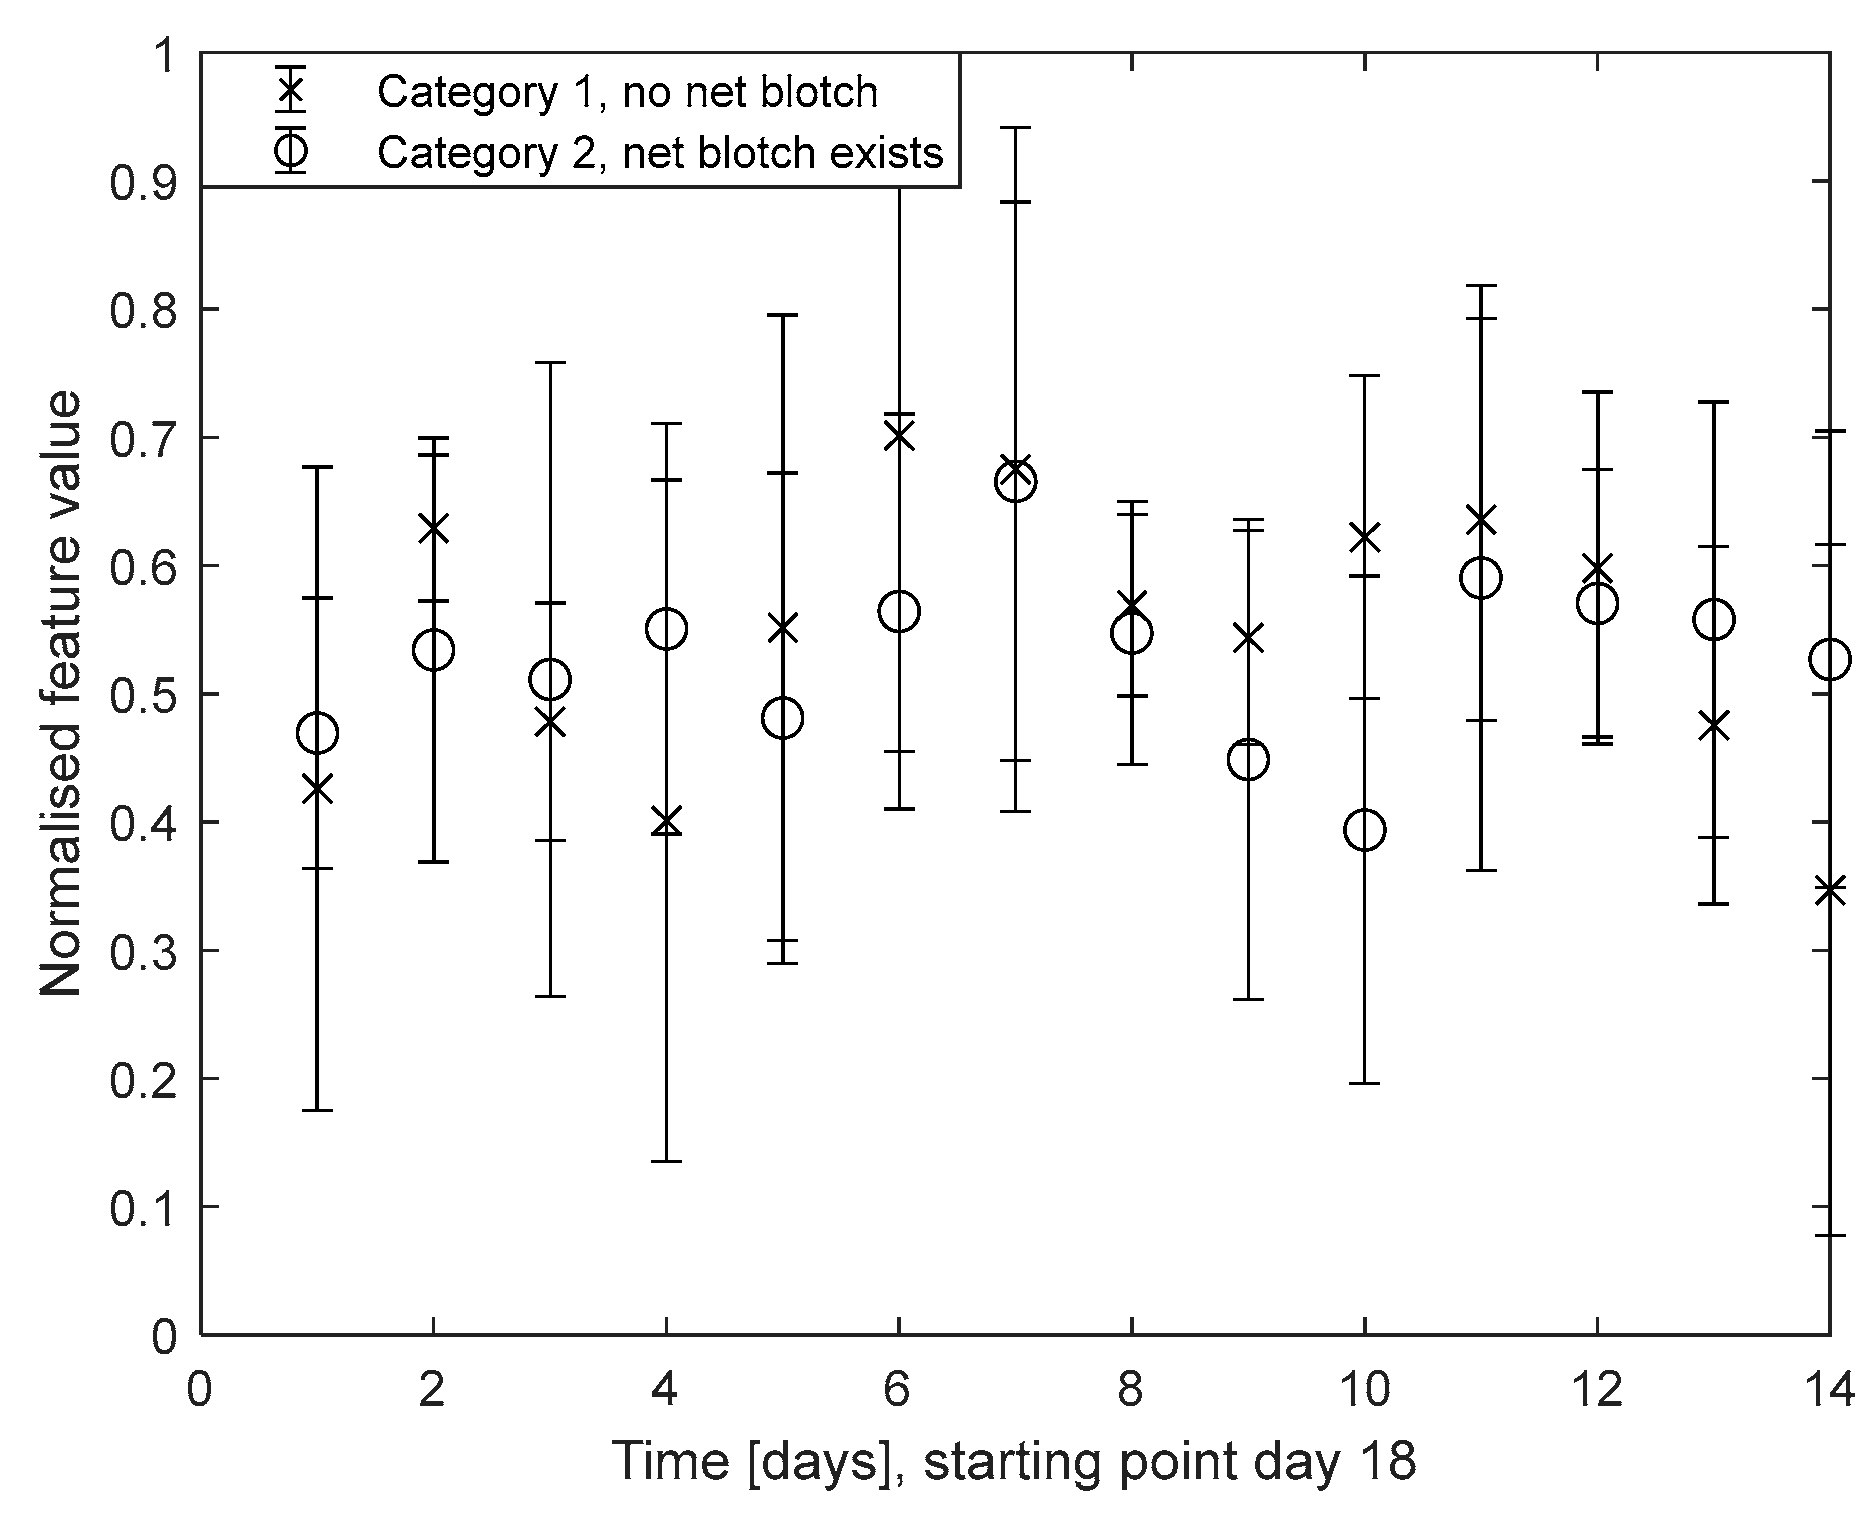
- Category 1 (very low net blotch density, maximum net blotch severity value of 0.5%);
- Category 2 (net blotch appears in the selected observation fields in these years, severity value of 0.6−5%).
- Atmospheric pressure (hPa);
- Relative humidity (RH %);
- Temperature (°C);
- Dew point temperature (°C).
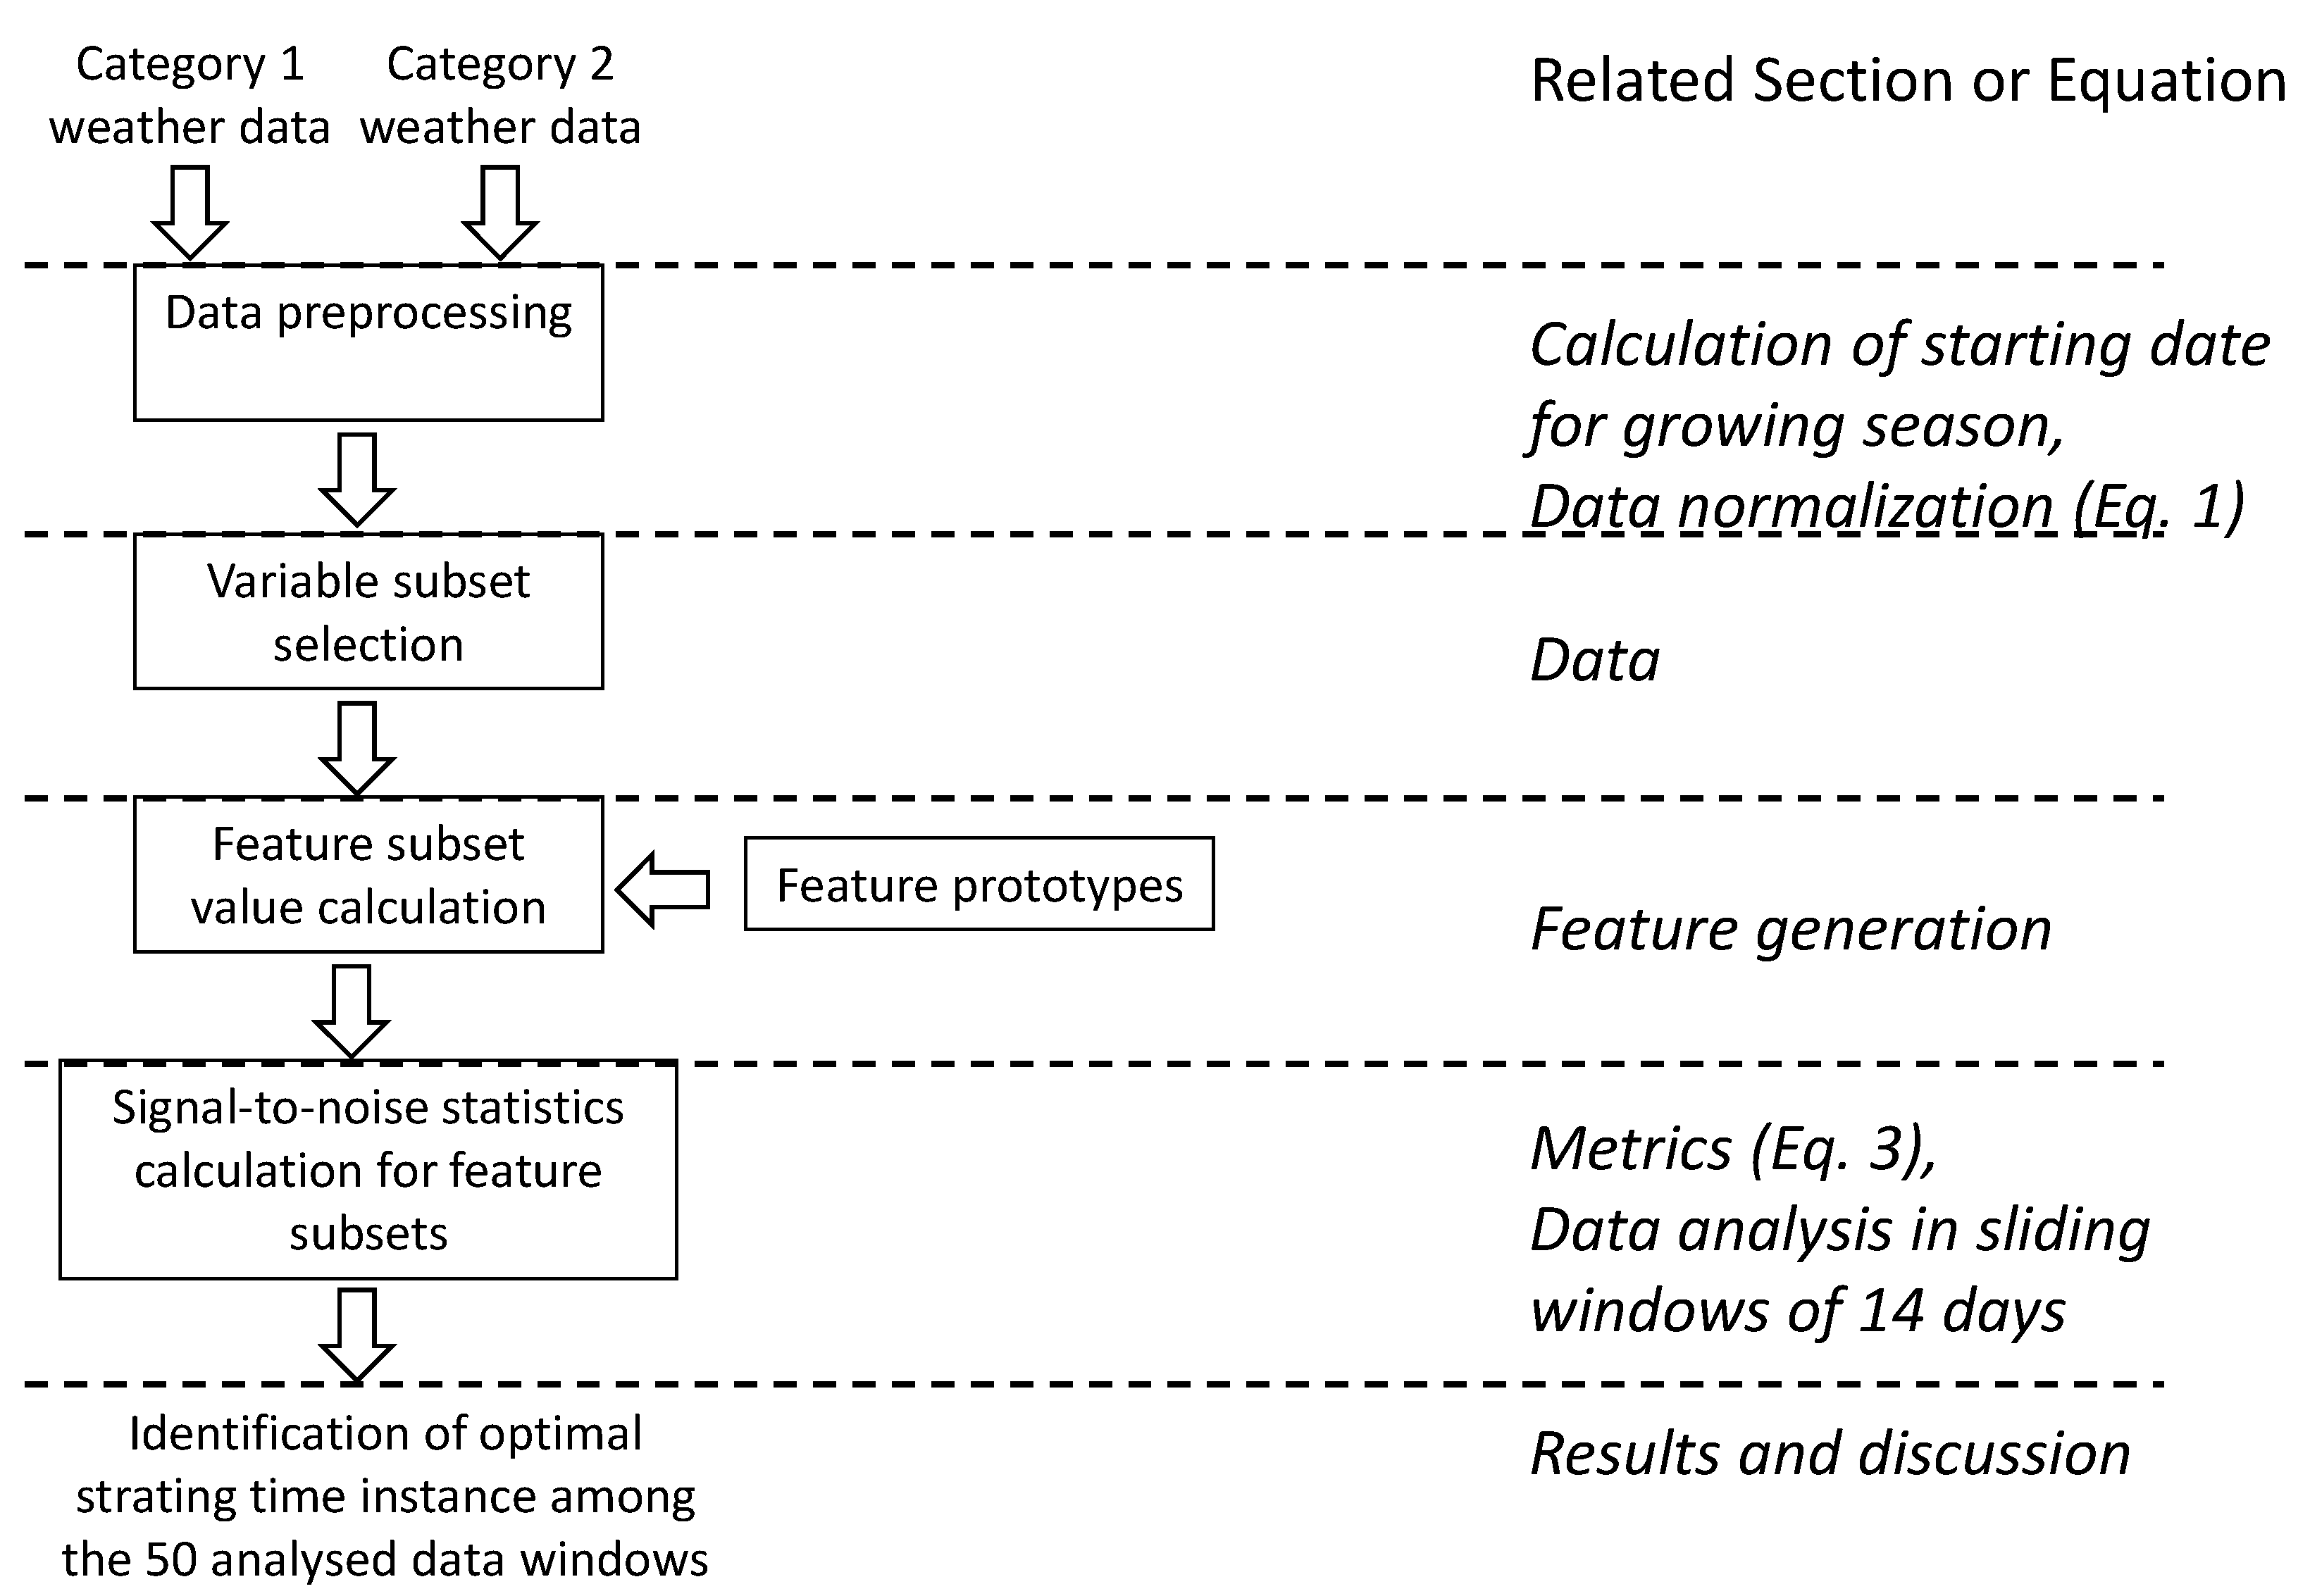
2.2. General Structure of Data Analysis
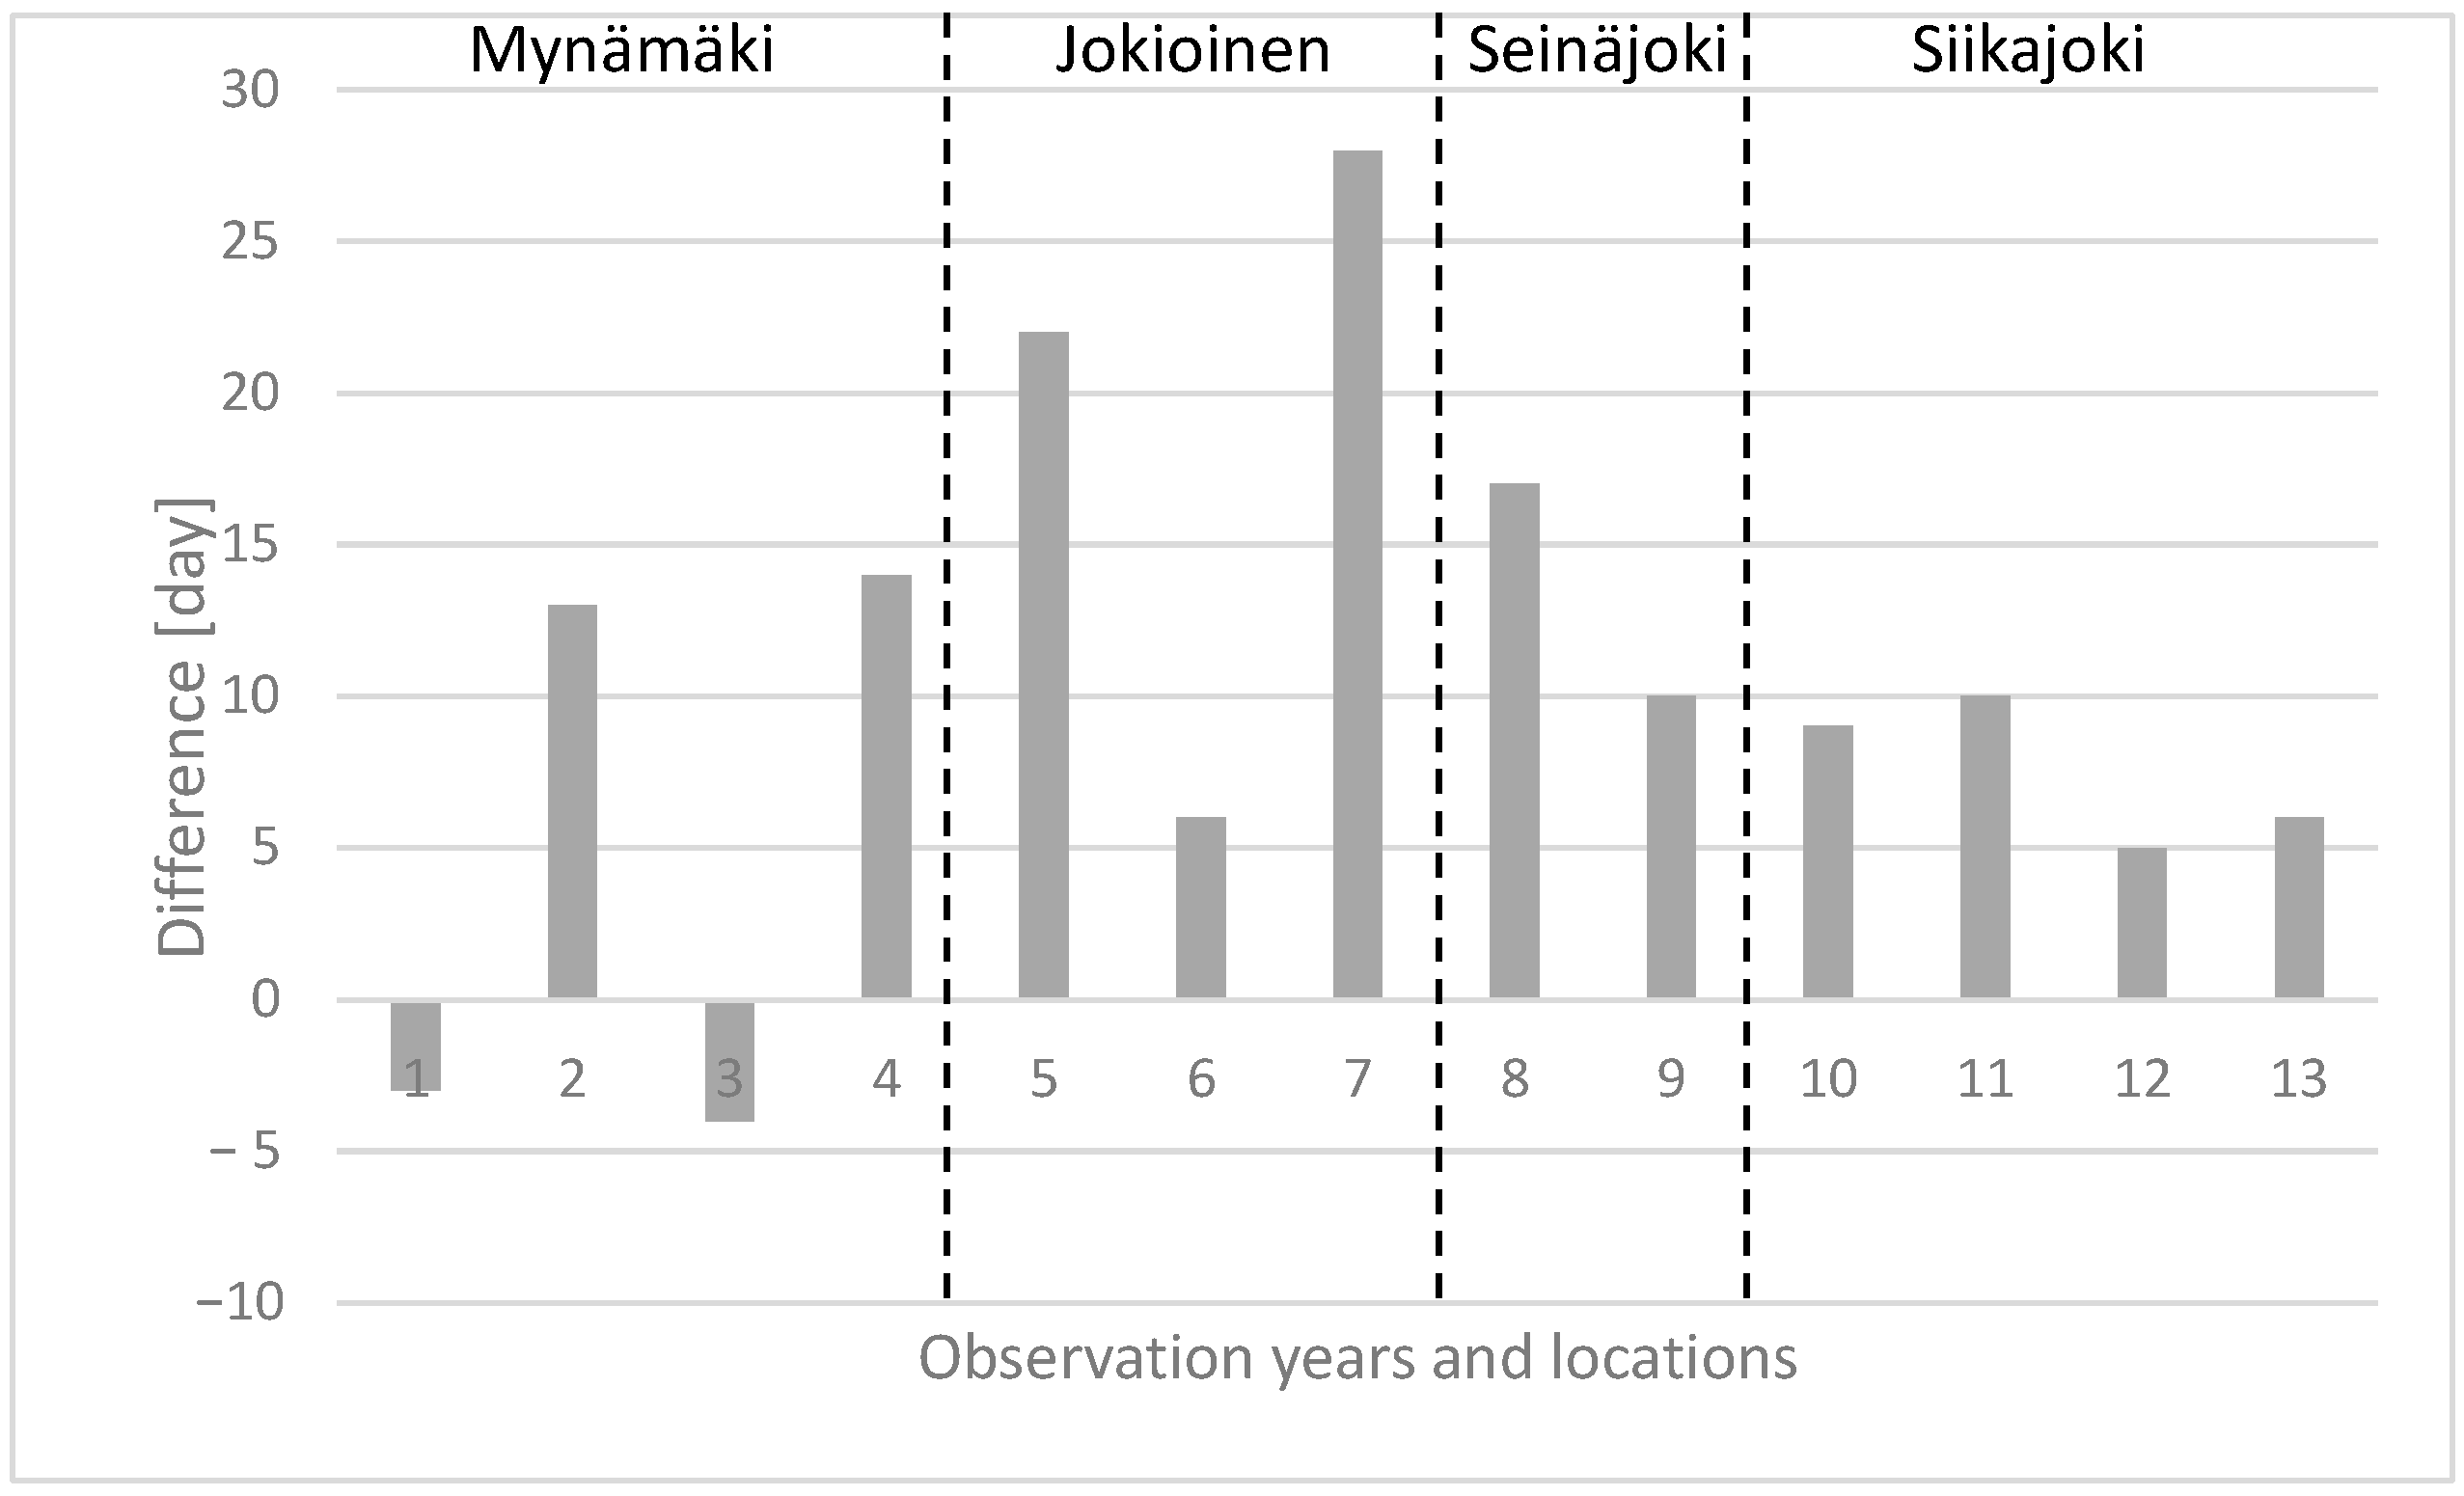
2.3. Starting Date of Growing Season, Automatic Calculation
2.4. Feature Generation
- If the relative humidity is >87%, then the leaf is humid → LWD = 1;
- If the relative humidity is >70%–<87% and increasing >3% per 30 min, then the leaf is humid → LWD = 1;
- If the relative humidity is >70%–<87% and decreasing >2% per 30 min, then the leaf is dry → LWD = 0;
- If the relative humidity <70%, then the leaf is dry → LWD = 0.
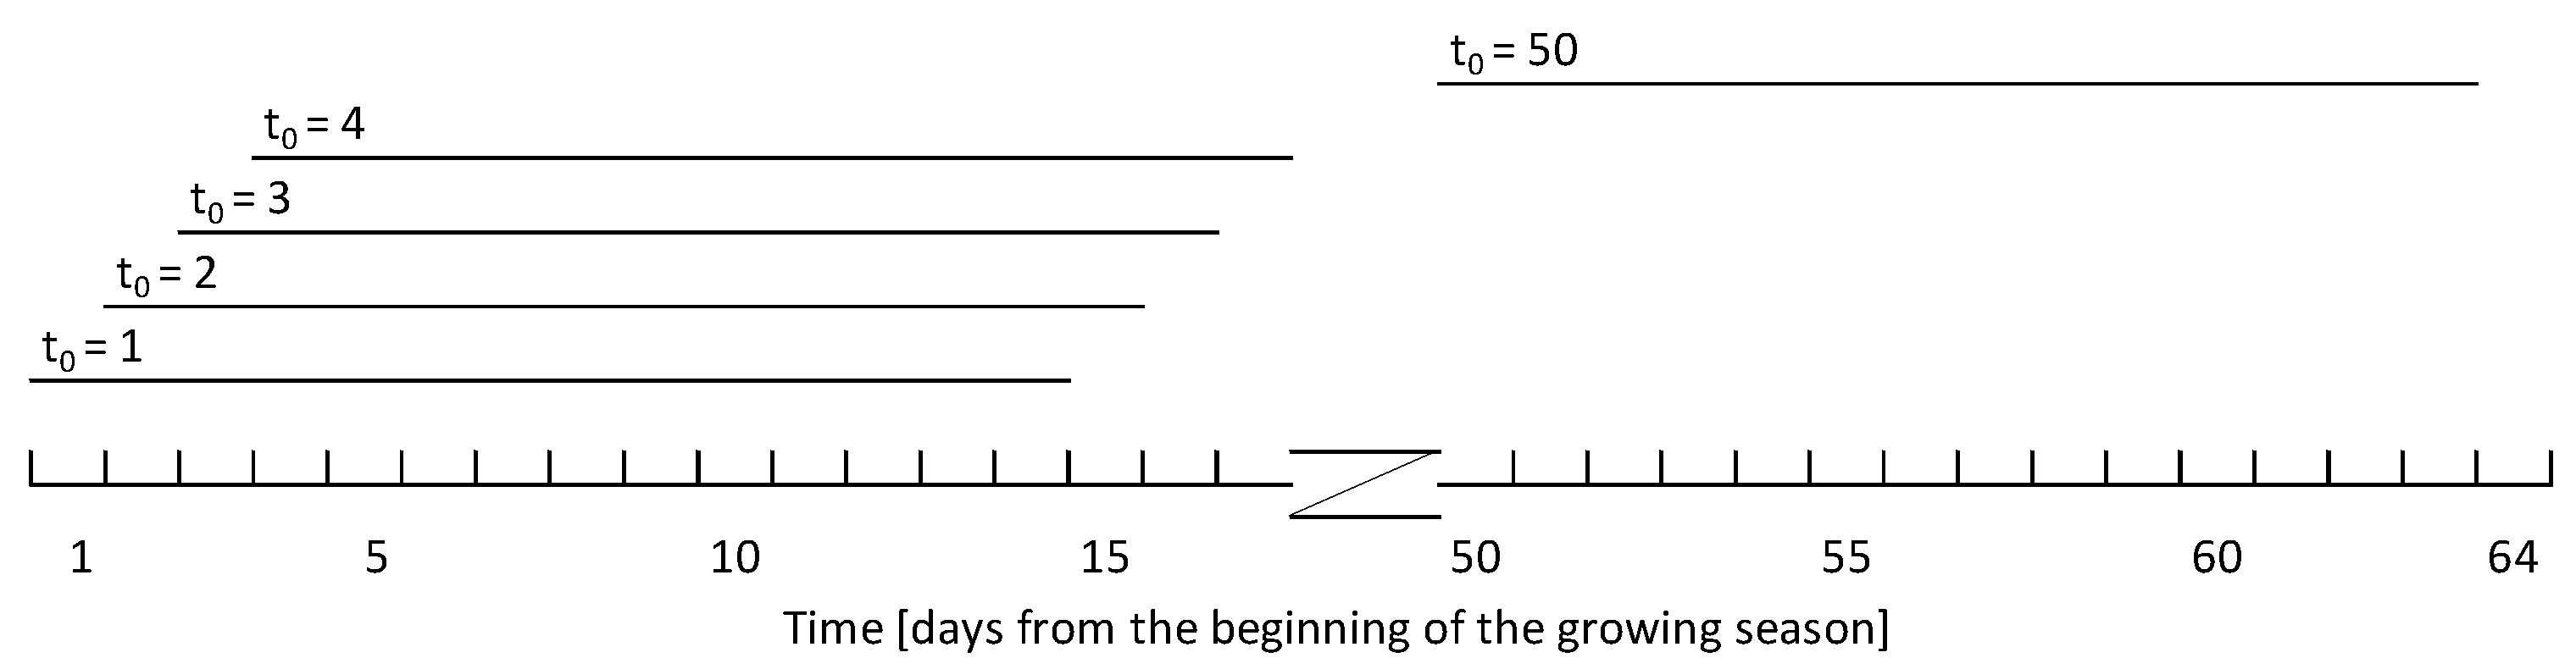
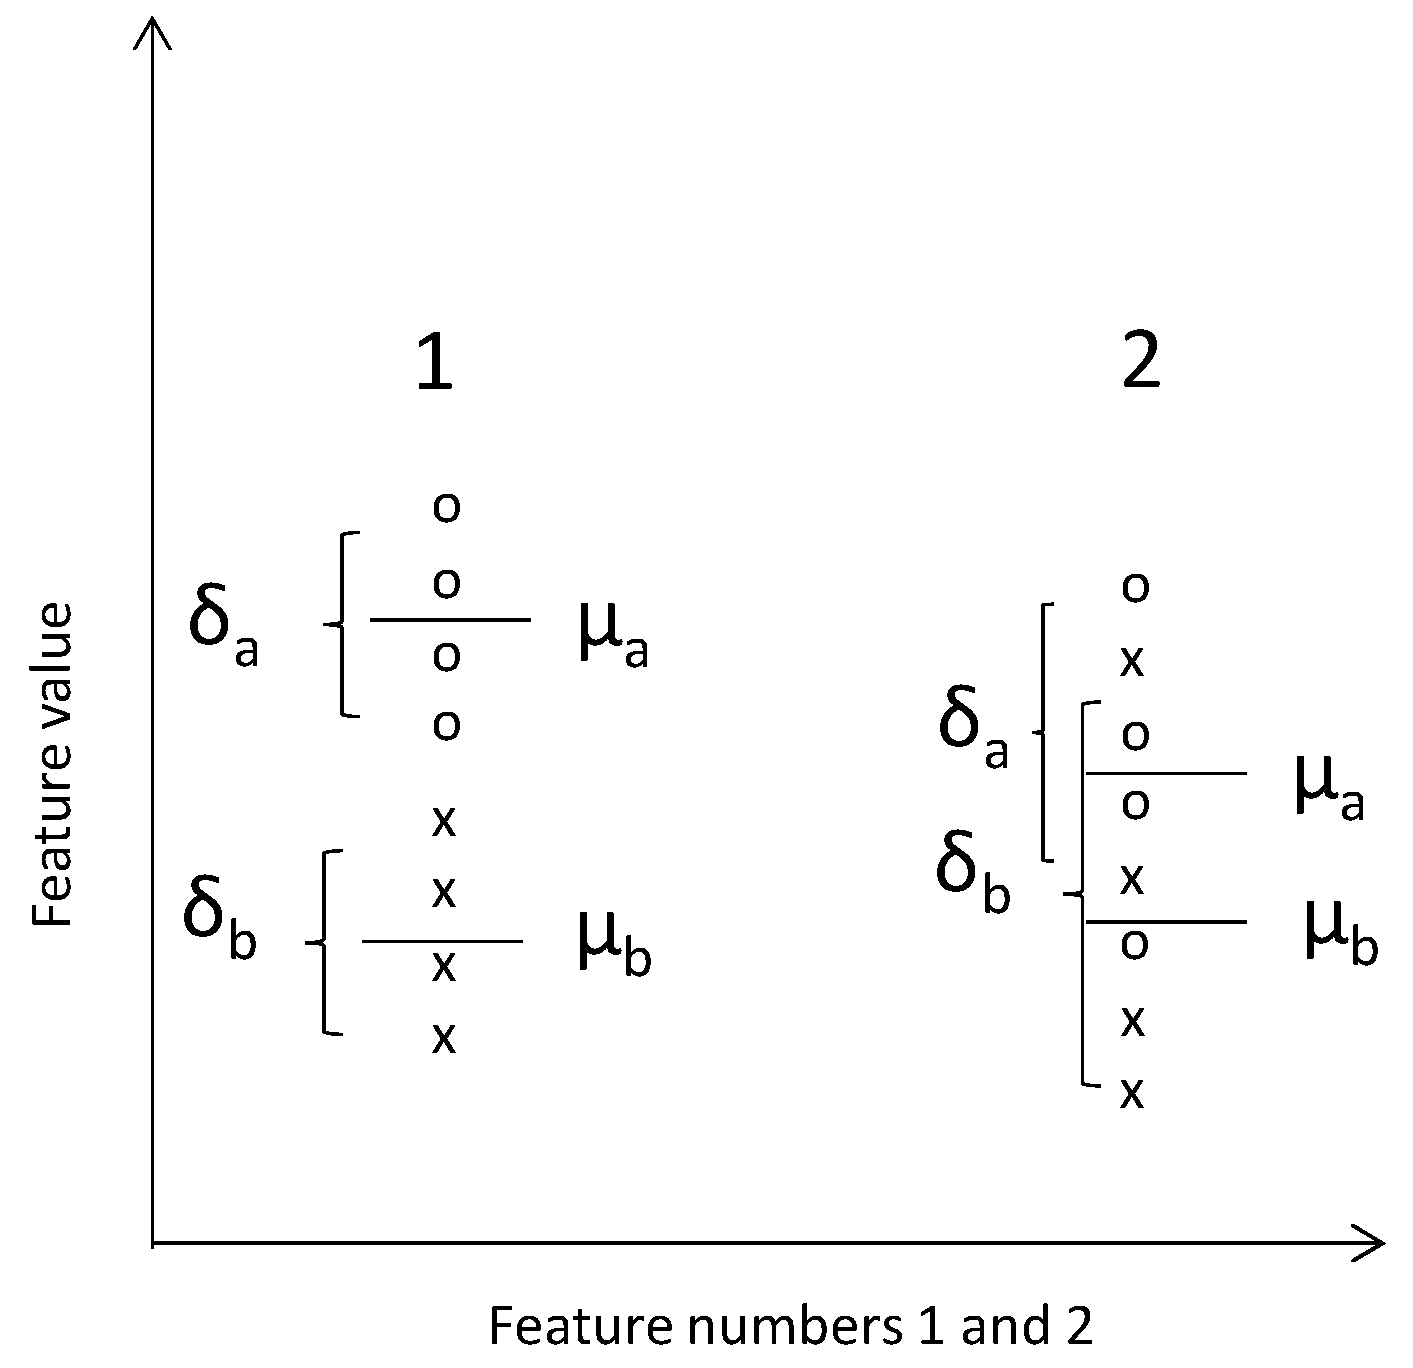
2.5. Metrics
3. Results and Discussion
4. Conclusions
Author Contributions
Funding
Data Availability Statement
Conflicts of Interest
Appendix A

| features(1) = x − y; |
| features(2) = x − z; |
| features(3) = y − z; |
| features(4) = (x − y) × y; |
| features(5) = (y − x) × z; |
| features(6) = (z − x) × z; |
| features(7) = (y − z) × z; |
| features(8) = (z − y) × x; |
| features(9) = (x − z) × y; |
| features(10) = ln(x); |
| features(11) = ln(y); |
| features(12) = ln(z); |
| features(13) = x × y; |
| features(14) = x × z; |
| features(15) = x × y × z; |
| features(16) = y × z; |
| features(17) = ln(x) − ln(y); |
| features(18) = ln(x) − ln(z); |
| features(19) = ln(y) − ln(z); |
| features(20) = ln(x) − ln(y) × ln(z); |
| features(21) = ln(y) − ln(x) × ln(y); |
| features(22) = ln(z) − ln(x) × ln(z); |
| features(23) = ln(y) − ln(z) × ln(z); |
| features(24) = ln(z) − ln(y) × ln(x); |
| features(25) = ln(x)/ln(y); |
| features(26) = ln(x) × ln(y); |
| features(27) = ln(x) × ln(z); |
| features(28) = ln(x) × ln(y) × ln(z); |
| features(29) = ln(y) × ln(z); |
| features(30) = sqrt(x); |
| features(31) = sqrt(y); |
| features(32) = sqrt(z); |
| features(33) = sqrt(x) − sqrt(y); |
| features(34) = sqrt(x) − sqrt(z); |
| features(35) = sqrt(y) − sqrt(z); |
| features(36) = sqrt(ln(x)); |
| features(37) = sqrt(ln(y)); |
| features(38) = sqrt(ln(z)); |
| features(39) = sqrt(x)/y; |
| features(40) = x/z; |
| features(41) = y/z; |
| features(42) = (x × y)/z; |
| features(43) = (x × z)/y; |
| features(44) = (y × z)/x; |
| features(45) = sqrt(x)/sqrt(y); |
| features(46) = sqrt(x)/z; |
| features(47) = (y/x)^2; |
| features(48) = (sqrt(x) × y)/z; |
| features(49) = (sqrt(x) × z)/y; |
| features(50) = (y × z)/sqrt(x); |
| features(51) = x^2; |
| features(52) = y^2; |
| features(53) = z^2; |
| features(54) = x^2 − y^2; |
| features(55) = x^2 − z^2; |
| features(56) = x; |
| features(57) = y; |
| features(58) = z; |
| features(59) = x + y + z; |
| features(60) = x + y − z; |
| features(61) = ln(x) + ln(y) + ln(z); |
| features(62) = sqrt(y) + sqrt(z) + sqrt(x); |
| features(63) = (x − y)/x; |
| features(64) = (x/y)^3; |
| features(65) = (y^(0.7) − 1)/(0.7); |
| features(66) = (y − z)/y; %(y − z)/z, 23.12.2011 |
| features(67) = (z − y)/x; |
| features(68) = (y^(−1) − 1)/(−1); |
| features(69) = x + y; |
| features(70) = x + z; |
| features(71) = y + z; |
| features(72) = (x + y)/y; |
| features(73) = (y + x)/z; |
| features(74) = (y^(0.5) − 1)/(0.5); |
| features(75) = (z^(2.5) − 1)/(2.5); |
| features(76) = (z + y)/x; |
| features(77) = (y^(1.5) − 1)/(1.5); |
| features(78) = (x + z)/x; |
| features(79) = (y^(−2) − 1)/(−2); |
| features(80) = (x + z)/y; |
| features(81) = ln(x) + ln(y); |
| features(82) = ln(x) + ln(z); |
| features(83) = ln(y) + ln(z); |
| features(84) = (ln(x) + ln(y)) × ln(z); |
| features(85) = (ln(y) + ln(x)) × ln(y); |
| features(86) = (ln(z) + ln(x)) × ln(z); |
| features(87) = (ln(y) + ln(z)) × ln(z); |
| features(88) = (ln(z) + ln(y)) × ln(x); |
| features(89) = (ln(x) + ln(z)) × ln(y); |
| features(90) = sqrt(x) + sqrt(y); |
| features(91) = sqrt(x) + sqrt(z); |
| features(92) = sqrt(y) + sqrt(z); |
| features(93) = (x + y) × y; |
| features(94) = (y + x) × z; |
| features(95) = (z + x) × z; |
| features(96) = (y + z) × z; |
| features(97) = (z + y) × x; |
| features(98) = (x + z) × y; |
| features(99) = (x + z) × x; |
| features(100) = (x − y) × x; |
| features(101) = x + (y × y); |
| features(102) = y + (x × z); |
| features(103) = z + (x × z); |
| features(104) = y + (z × z); |
| features(105) = z + (y × x); |
| features(106) = x + (z × y); |
| features(107) = x + (z × x); |
| features(108) = x − (y × x); |
| features(109) = y^2 − z^2; |
| features(110) = x^2 × y^2; |
| features(111) = (x − y) × z; |
| features(112) = (x + y) × z; |
| features(113) = (x/y) × z; |
| features(114) = (x/y) + z; |
| features(115) = ln(x)/ln(y) × ln(z); |
Appendix B
| The weather data used has been downloaded from the fmi open database: https://www.ilmatieteenlaitos.fi/havaintojen-lataus#!/ (accessed on 2 October 2022) |
| Mynämäki: until 2011, the FMI weather station “Turku airport” and 2012–2017 the FMI weather station “Kaarina, Yltöinen”. |
| Jokioinen: the FMI weather station “Jokioinen”. |
| Seinäjoki: the FMI weather station “Seinäjoki, Pelmaa”. |
| Siikajoki: the FMI weather station “Siikajoki, Revonlahti”. |
References
- Ruusunen, O.; Jalli, M.; Jauhiainen, L.; Ruusunen, M.; Leiviskä, K. Data Analysis in Moving Windows for Optimizing Barley Net Blotch Prediction. J. Adv. Agric. Technol. 2020, 7, 154–196. [Google Scholar] [CrossRef]
- FAO. FAOSTAT. 2020. Available online: http://www.fao.org/faostat/en/ (accessed on 21 January 2022).
- Jalli, M.; Laitinen, P.; Latvala, S. The emergence of cereal fungal diseases and the incidence of leaf spot diseases in Finland. Agric. Food Sci. 2011, 20, 62–73. [Google Scholar] [CrossRef]
- Jalli, M.; Kaseva, J.; Andersson, B.; Ficke, A.; Nistrup-Jørgensen, L.; Ronis, A.; Kaukoranta, T.; Ørum, J.-E.; Djurle, A. Yield increases due to fungicide control of leaf blotch diseases in wheat and barley as a basis for IPM decision-making in the Nordic-Baltic region. Eur. J. Plant Pathol. 2020, 158, 315–333. [Google Scholar] [CrossRef]
- Teferi, T.A.; Wubshet, M.L.; Aregawi, T.B. Occurrence and intensity of net and spot blotch of barley in South Tigray, Ethiopia. Glob. Sci. Res. J. 2015, 3, 113–123. [Google Scholar]
- Agriculture Victoria Net blotches of barley. 2020. Available online: https://agriculture.vic.gov.au/biosecurity/plant-diseases/grain-pulses-and-cereal-diseases/net-blotches-of-barley (accessed on 1 September 2022).
- El Yousfi, B.; Ezzahiri, B. Net Blotch on semi-arid regions of Morocco II—Yield and yield-loss modelling. Field Crops Res. 2002, 73, 81–93. [Google Scholar] [CrossRef]
- Jayasena, K.W.; Van Burgel, C.A.; Tanaka, K.; Majewski, J.; Loughman, R. Yield reduction in barley in relation to spot-type net blotch. Australas. Plant Pathol. 2007, 36, 429–433. [Google Scholar] [CrossRef]
- Turkington, T.K.; Tekauz, A.; Xi, K.; Kutcher, H.R. Foliar diseases of barley: Don’t rely on a single strategy from the disease management toolbox. Prairies Soils Crops J. 2011, 4, 142–150. [Google Scholar]
- Aktar, W.; Sengupta, D.; Chowdhury, A. Impact of pesticides use in agriculture: Their benefits and hazards. Interdiscip. Toxicol. 2009, 2, 1–12. [Google Scholar] [CrossRef] [Green Version]
- European Union. Directive 2009/128/EC of the European Parliament and the Council of 21 October 2009: Establishing a Framework for Community Action to Achieve the Sustainable use of Pesticides. Off. J. Eur. Union 2009, 309, 71–86. [Google Scholar]
- European Commission. Green Deal: Pioneering Proposals to Restore Europe’s Nature by 2050 and Halve Pesticide Use by 2030. 2022. Available online: https://ec.europa.eu/commission/presscorner/detail/en/ip_22_3746 (accessed on 1 September 2022).
- Charaya, M.U.; Upadhyay, A.; Bhati, H.P.; Kumar, A. Plant disease forecasting: Past practices to emerging technologies. In Plant Disease: Management Strategies; Nehra, S., Ed.; Agrobios Research: Rajasthan, India, 2021; pp. 1–30. [Google Scholar]
- Fenu, G.; Malloci, F.M. Forecasting Plant and Crop Disease: An Explorative Study on Current Algorithms. Big Data Cogn. Comput. 2021, 5, 2. [Google Scholar] [CrossRef]
- Gent, D.H.; Mahaffee, W.F.; McRoberts, N.; Pfender, W.F. The Use and Role of Predictive Systems in Disease Management. Annu. Rev. Phytopathol. 2013, 51, 267–289. [Google Scholar] [CrossRef] [PubMed] [Green Version]
- Jørgensen, L.N.; Matzen, N.; Ficke, A.; Andersson, B.; Jalli, M.; Ronis, A.; Nielsen, G.C.; Erlund, P.; Djurle, A. Using risk models for control of leaf blotch diseases in barley minimises fungicide use—Experiences from the Nordic and Baltic countries. Acta Agric. Scand. Sect. B Soil Plant Sci. 2021, 71, 247–260. [Google Scholar] [CrossRef]
- Secher, B.J.M.; Jørgensen, L.N.; Murali, N.S.; Boll, P.S. Field validation of a decision support system for the control of pests and diseases in cereals in denmark. Pestic. Sci. 1995, 45, 195–199. [Google Scholar] [CrossRef]
- Henriksen, K.E.; Jørgensen, L.N.; Nielsen, G.C. PC-plant protection—A tool to reduce fungicide input in winter wheat, winter barley and spring barley in Denmark. In Proceedings of the Brighton Crop Protection Conference—Pest and Diseases, Brighton, UK, 13–16 November 2000; pp. 835–840. [Google Scholar]
- Bligaard, J.; Jørgensen, L.N.; Axelsen, J.; Hansen, J.G.; Ørum, J.E.; Baby, S.; Nielsen, G.C. Udvikling af Nye Risikomodeller for Septoria (Zymoseptoria tritici) i Vinterhvede; Miljø-og Fødevareministeriet, Miljøstyrelsen. Bekæmpelsesmiddelforskning: Odense, Denmark, 2017; p. 168. ISBN 978-87-93529-68-7. [Google Scholar]
- WisuEnnuste. 2022. Available online: https://www.minunmaatilani.fi/ohjelmistot-ja-palvelut/viljelysuunnitteluohjelmat/wisuennuste-kasvinsuojelun-tasmalliseen-ajoittamiseen (accessed on 3 February 2022).
- El Jarroudi, M.; Kouadio, A.L.; El Jarroudi, M.; Junk, J.; Bock, C.; Diouf, A.A.; Delfosse, P. Improving fungal disease forecasts in winter wheat: A critical role of intra-day variations of meteorological conditions in the development of Septoria leaf blotch. Field Crops Res. 2017, 213, 12–20. [Google Scholar] [CrossRef]
- Fernando, W.G.D.; Oghenekaro, A.O.; Tucker, J.R.; Badea, A. Building on a foundation: Advances in epidemiology, resistance breeding, and forecasting research for reducing the impact of fusarium head blight in wheat and barley. Can. J. Plant Pathol. 2021, 43, 495–526. [Google Scholar] [CrossRef]
- Landschoot, S.; Waegeman, W.; Audenaert, K.; Van Damme, P.; Vandepitte, J.; De Baets, B.; Haesaert, G. A field-specific web tool for the prediction of Fusarium head blight and deoxynivalenol content in Belgium. Comput. Electron. Agric. 2013, 93, 140–148. [Google Scholar] [CrossRef]
- Musa, T.; Hecker, A.; Vogelgsang, S.; Forrer, H.R. Forecasting of Fusarium head blight and deoxynivalenol content in winter wheat with FusaProg. EPPO Bull. 2007, 37, 283–289. [Google Scholar] [CrossRef]
- Shah, D.A.; Paul, P.A.; De Wolf, E.D.; Madden, L.V. Predicting plant disease epidemics from functionally-represented weather series. Phil. Trans. R. Soc. B 2019, 374, 20180273. [Google Scholar] [CrossRef] [Green Version]
- Shah, D.A.; De Wolf, E.D.; Paul, P.A.; Madden, L.V. Functional data analysis of weather variables linked to Fusarium head blight epidemics in the United States. Phytopathology 2019, 109, 96–110. [Google Scholar] [CrossRef] [Green Version]
- Shah, D.A.; De Wolf, E.D.; Paul, P.A.; Madden, L.V. Predicting Fusarium head blight epidemics with boosted regression tree. Phytopathology 2014, 104, 702–714. [Google Scholar] [CrossRef] [Green Version]
- Shah, D.A.; Molineros, J.E.; Paul, P.A.; Willyerd, K.T.; Madden, L.V.; De Wolf, E.D. Predicting Fusarium head blight epidemics with weather-driven pre- and post-anthesis logistic regression model. Phytopathology 2013, 103, 906–919. [Google Scholar] [CrossRef] [Green Version]
- Ruusunen, O.; Jalli, M.; Jauhiainen, L.; Ruusunen, M.; Leiviskä, K. Advanced Data Analysis as a Tool for Net Blotch Density Estimation in Spring Barley. Agriculture 2020, 10, 179. [Google Scholar] [CrossRef]
- Saari, E.E.; Prescott, M. A scale for appraising the foliar intensity of wheat diseases. Plant Dis. Rep. 1975, 59, 377–379. [Google Scholar]
- Blum, A.L.; Langley, P. Selection of relevant features and examples in machine learning. Artif. Intell. 1997, 97, 245–271. [Google Scholar] [CrossRef]
- Dash, M.; Liu, H. Feature selection for classification. Intell. Data Anal. 1997, 1, 131–156. [Google Scholar] [CrossRef]
- García-Torres, M.; Gómez-Vela, F.; Melián-Batista, B.; Moreno-Vega, J.M. High-dimensional feature selection via feature grouping: A Variable Neighborhood Search approach. Inf. Sci. 2016, 326, 102–118. [Google Scholar] [CrossRef]
- Pérez-Rodríguez, J.; Arroyo-Peña, A.G.; García-Pedrajas, N. Simultaneous instance and feature selection and weighting using evolutionary computation: Proposal and study. Appl. Soft Comput. 2015, 37, 416–443. [Google Scholar] [CrossRef]
- Uncu, Ö.; Türkşen, I.B. A novel feature selection approach: Combining feature wrappers and filters. Inf. Sci. 2007, 177, 449–466. [Google Scholar] [CrossRef]
- Ruusunen, M. Signal Correlations in Biomass Combustion—An Information Theoretic Analysis. Acta Univ. Ouluensis Ser. C 2013, 459, 1–120. [Google Scholar]
- Kruit, R.J.W.; van Pul, W.A.J.; Jacobs, A.F.G.; Heusinkveld, B.G. Comparison between four methods to estimate leaf wetness caused by dew on grassland. In Proceedings of the 26th Conference on Agricultural and Forest Meteorology, Session 10.1, Vancouver, BC, Canada, 23–26 August 2004. [Google Scholar]
- Pomeroy, S.; Tamayo, P.; Gaasenbeek, M.; Sturla, L.M.; Angelo, M.; McLaughlin, M.E.; Kim, J.Y.H.; Goumnerovak, L.C.; Blackk, P.M.; Lau, C.; et al. Prediction of central nervous system embryonal tumour outcome based on gene expression. Nature 2002, 415, 436–442. [Google Scholar] [CrossRef] [PubMed]
| Location of Test Fields | Mynämäki N = 6,732,402.033 E = 218,702.907 | Jokioinen N = 6,746,822.331 E = 308,359.757 | Seinäjoki N = 6,986,750.229 E = 271,138.563 | Siikajoki N = 7,174,584.799 E = 408,818.353 | Years in Total |
|---|---|---|---|---|---|
| Years of observations Category 1 | 2011 | 2013 | 2011 | 2010 | 4 |
| Years of observations Category 2 | 2013, 2014, 2016 | 2014, 2015 | 2016 | 2012, 2014, 2015 | 9 |
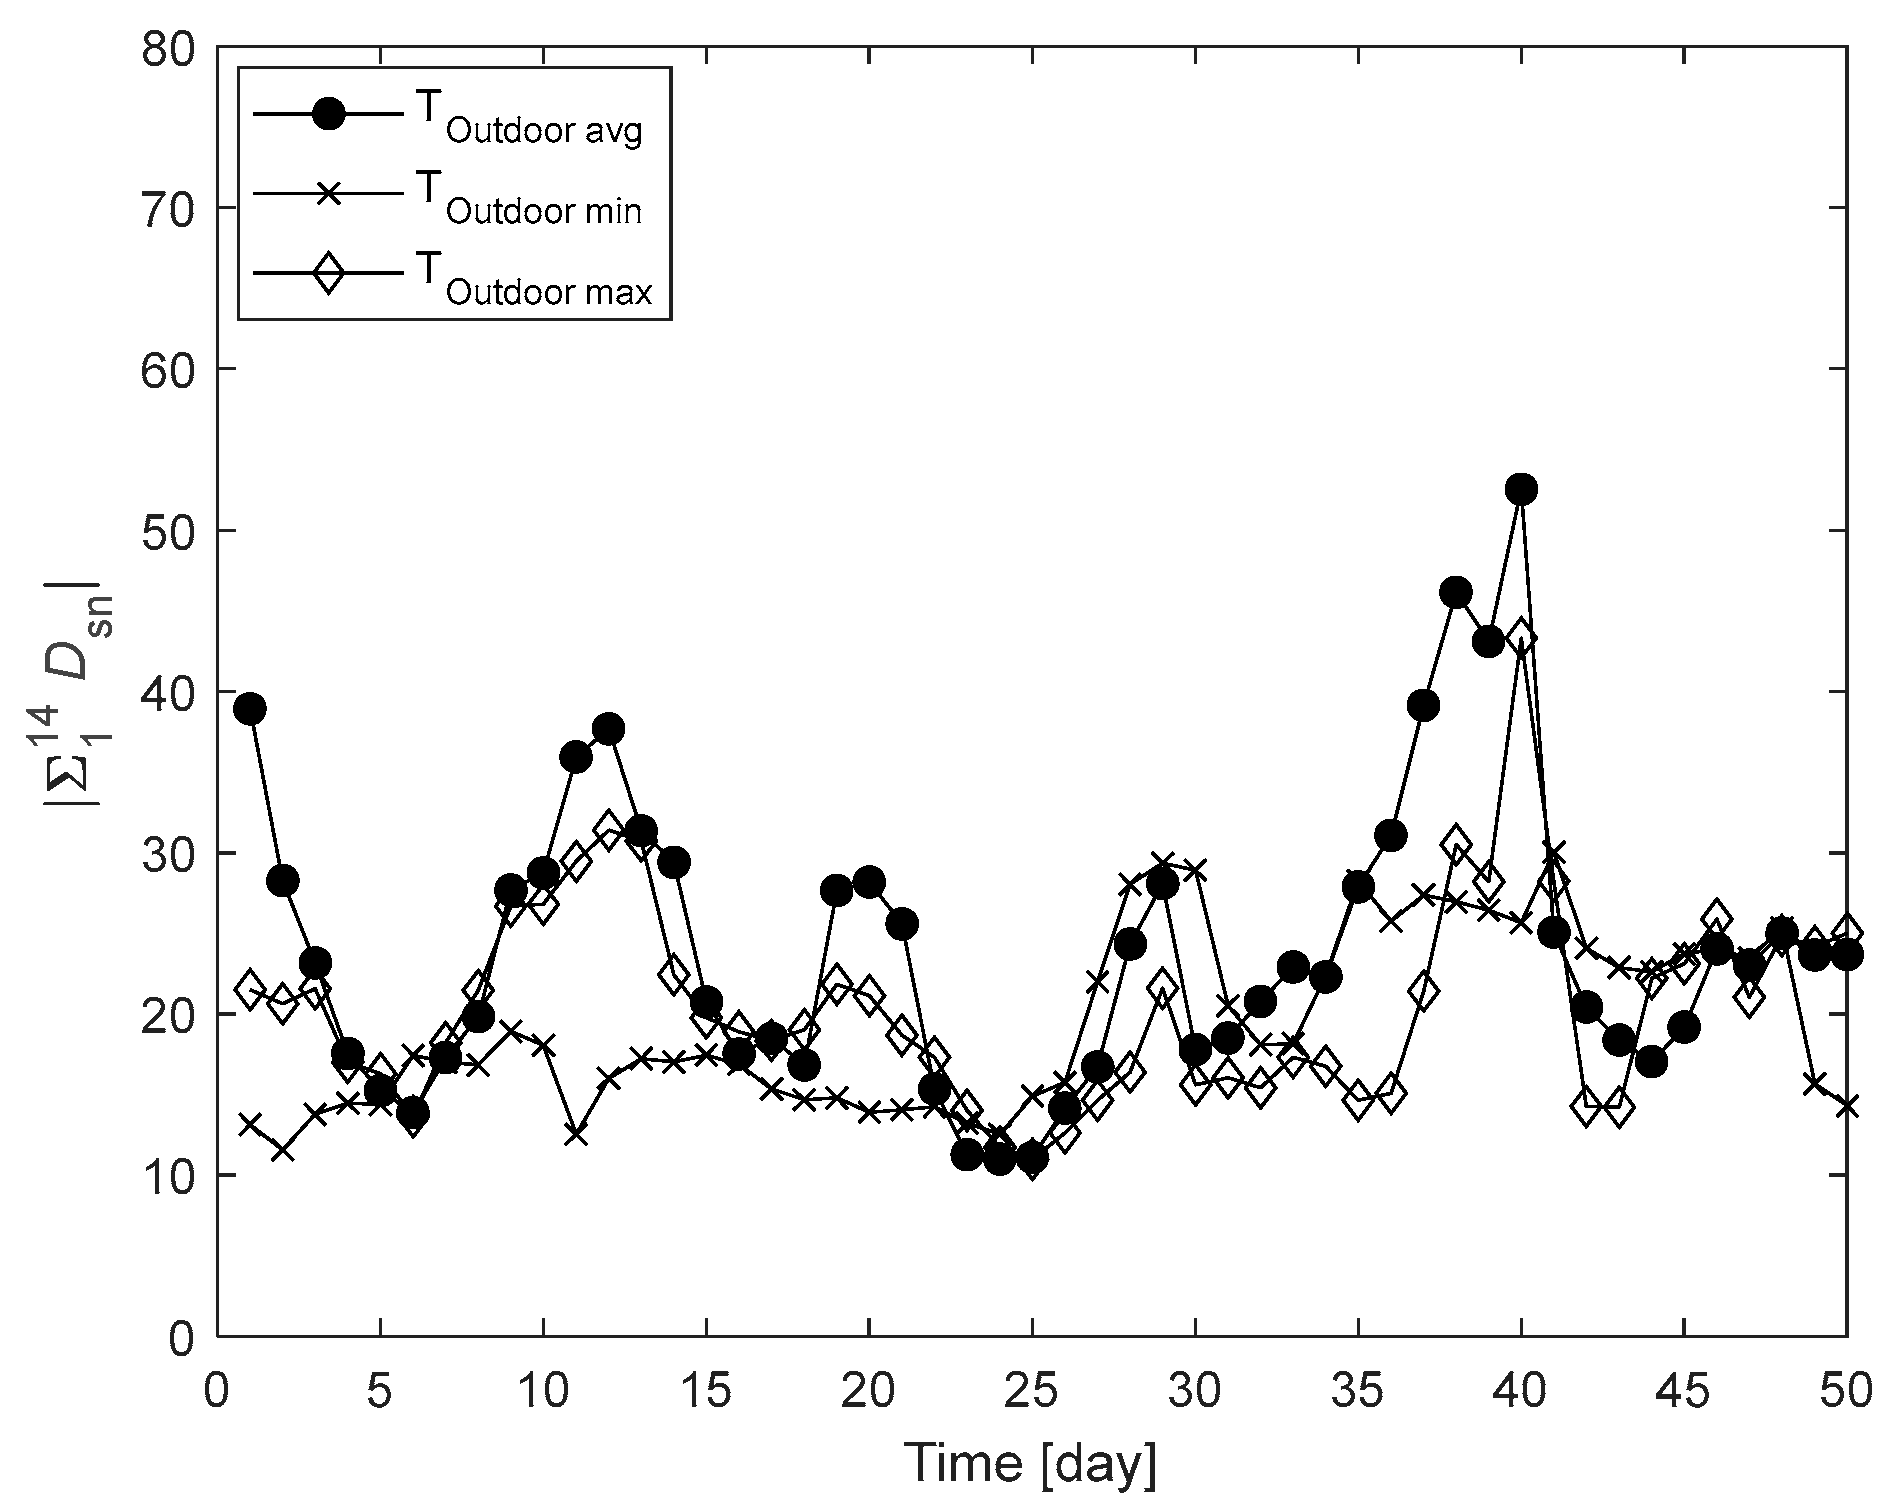
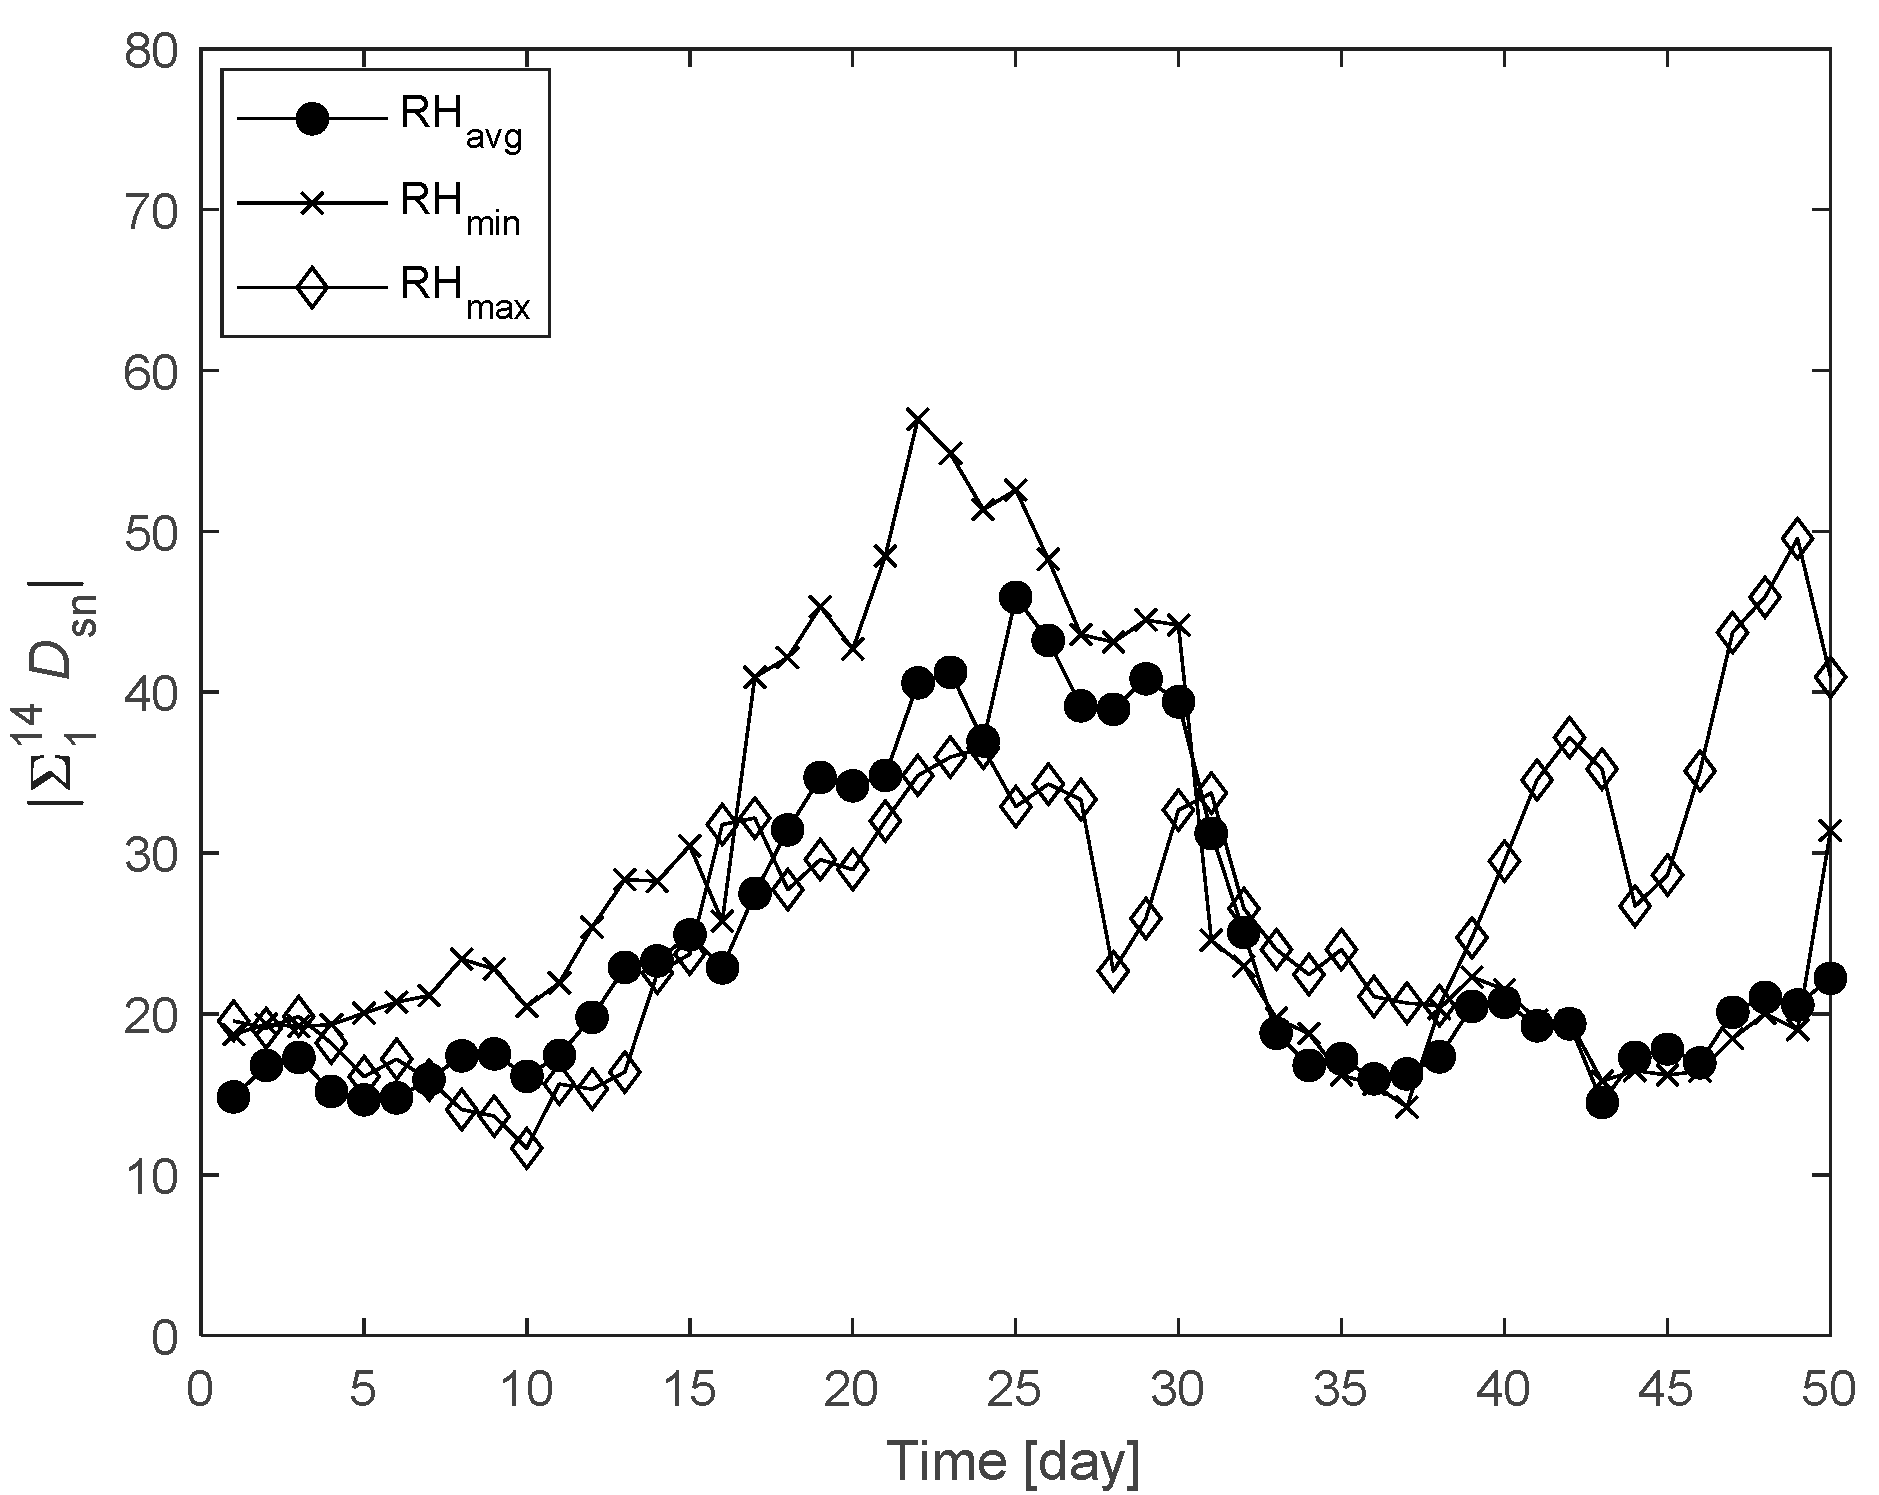
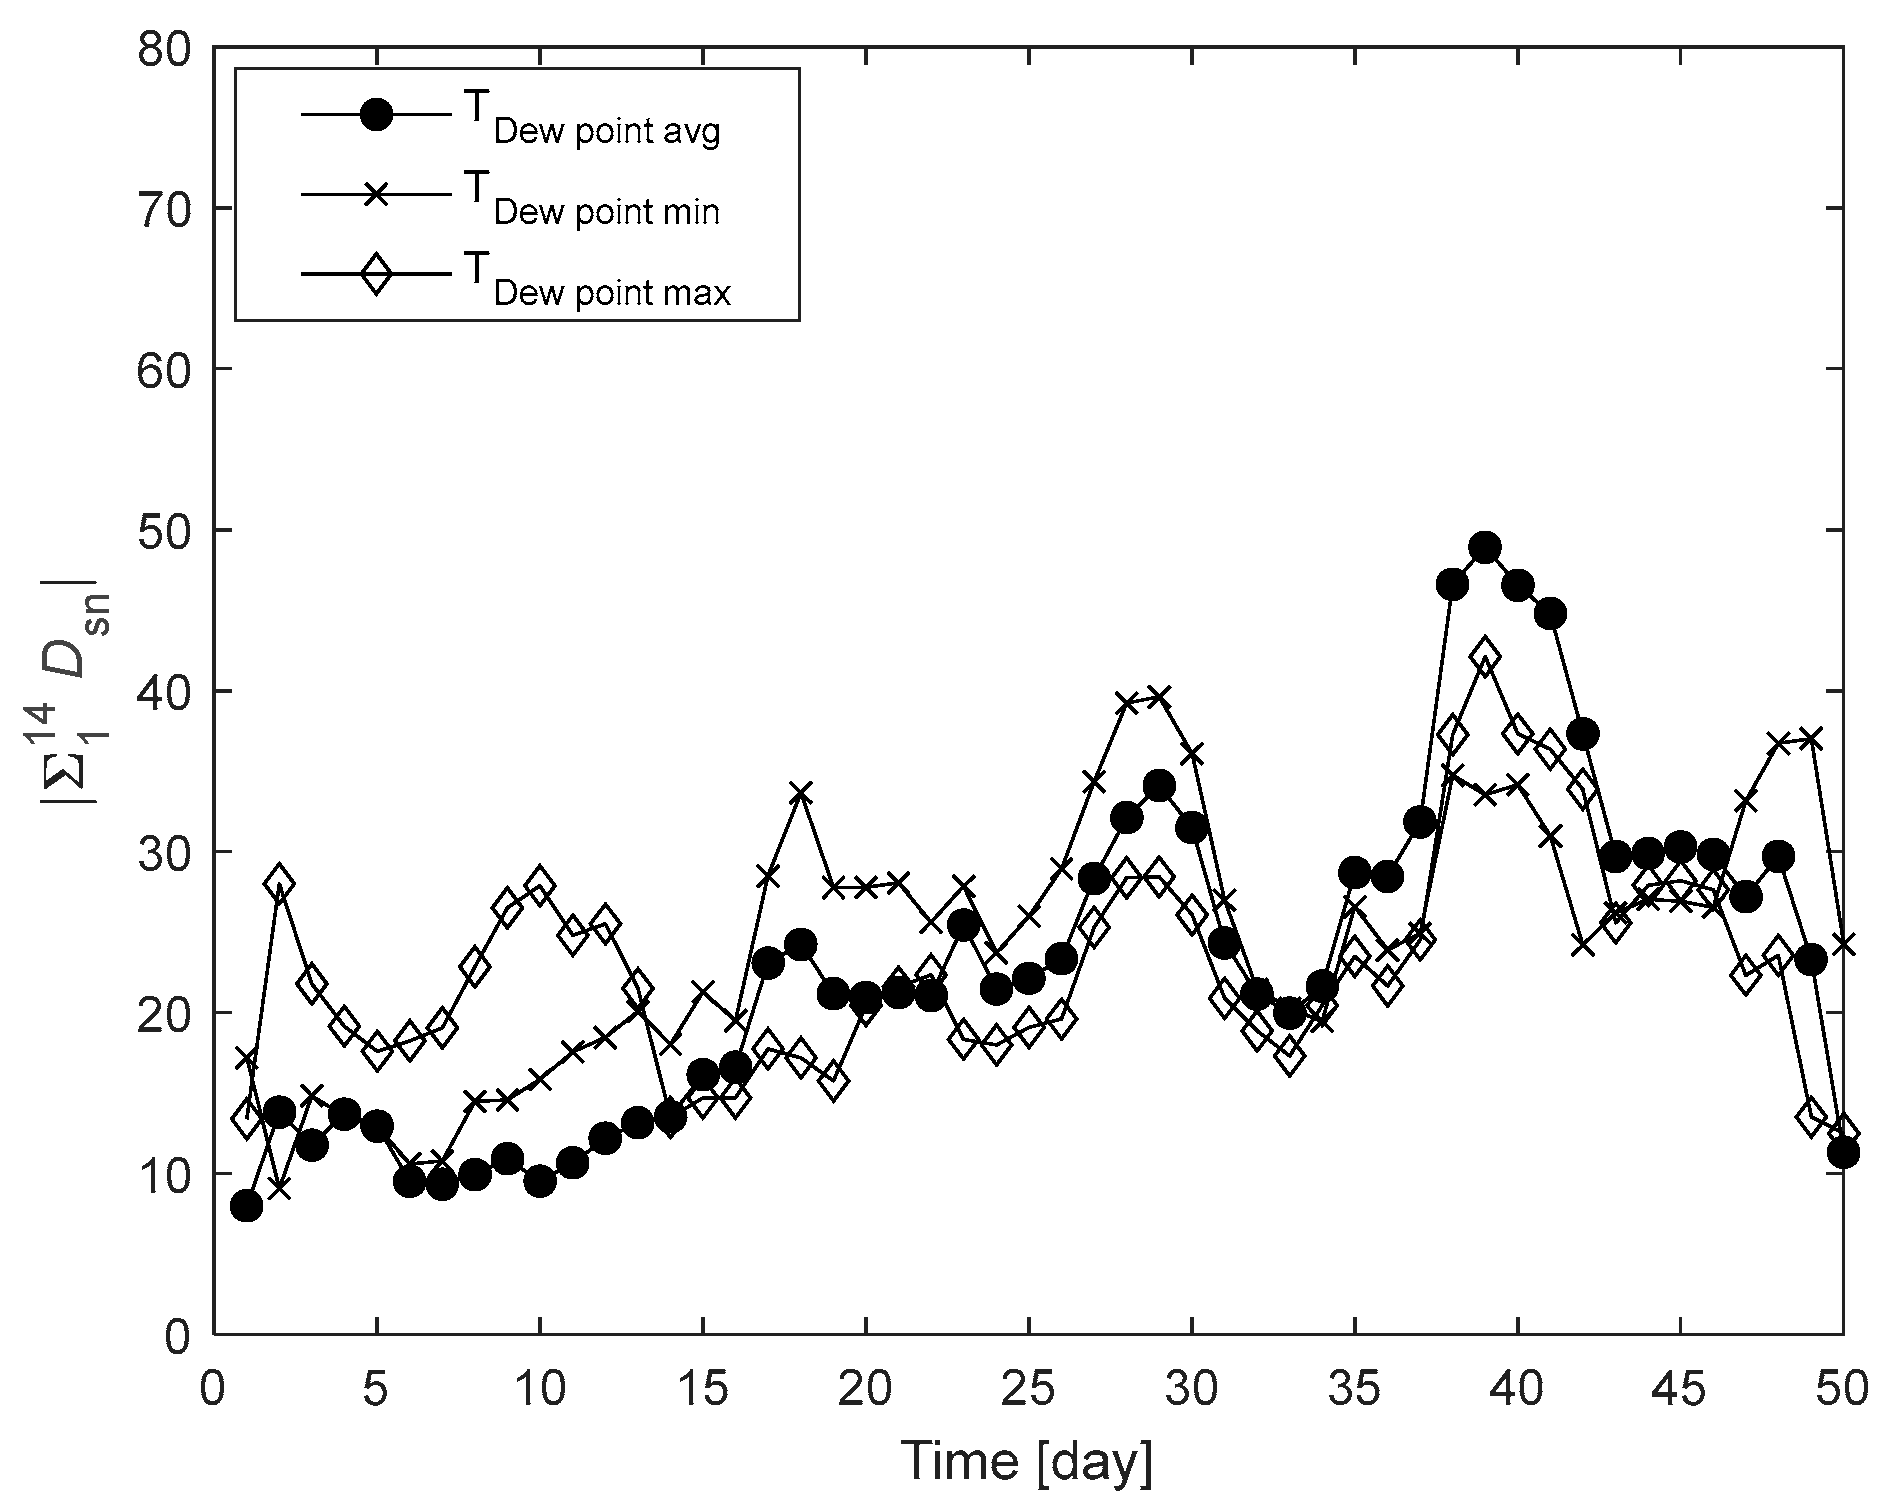
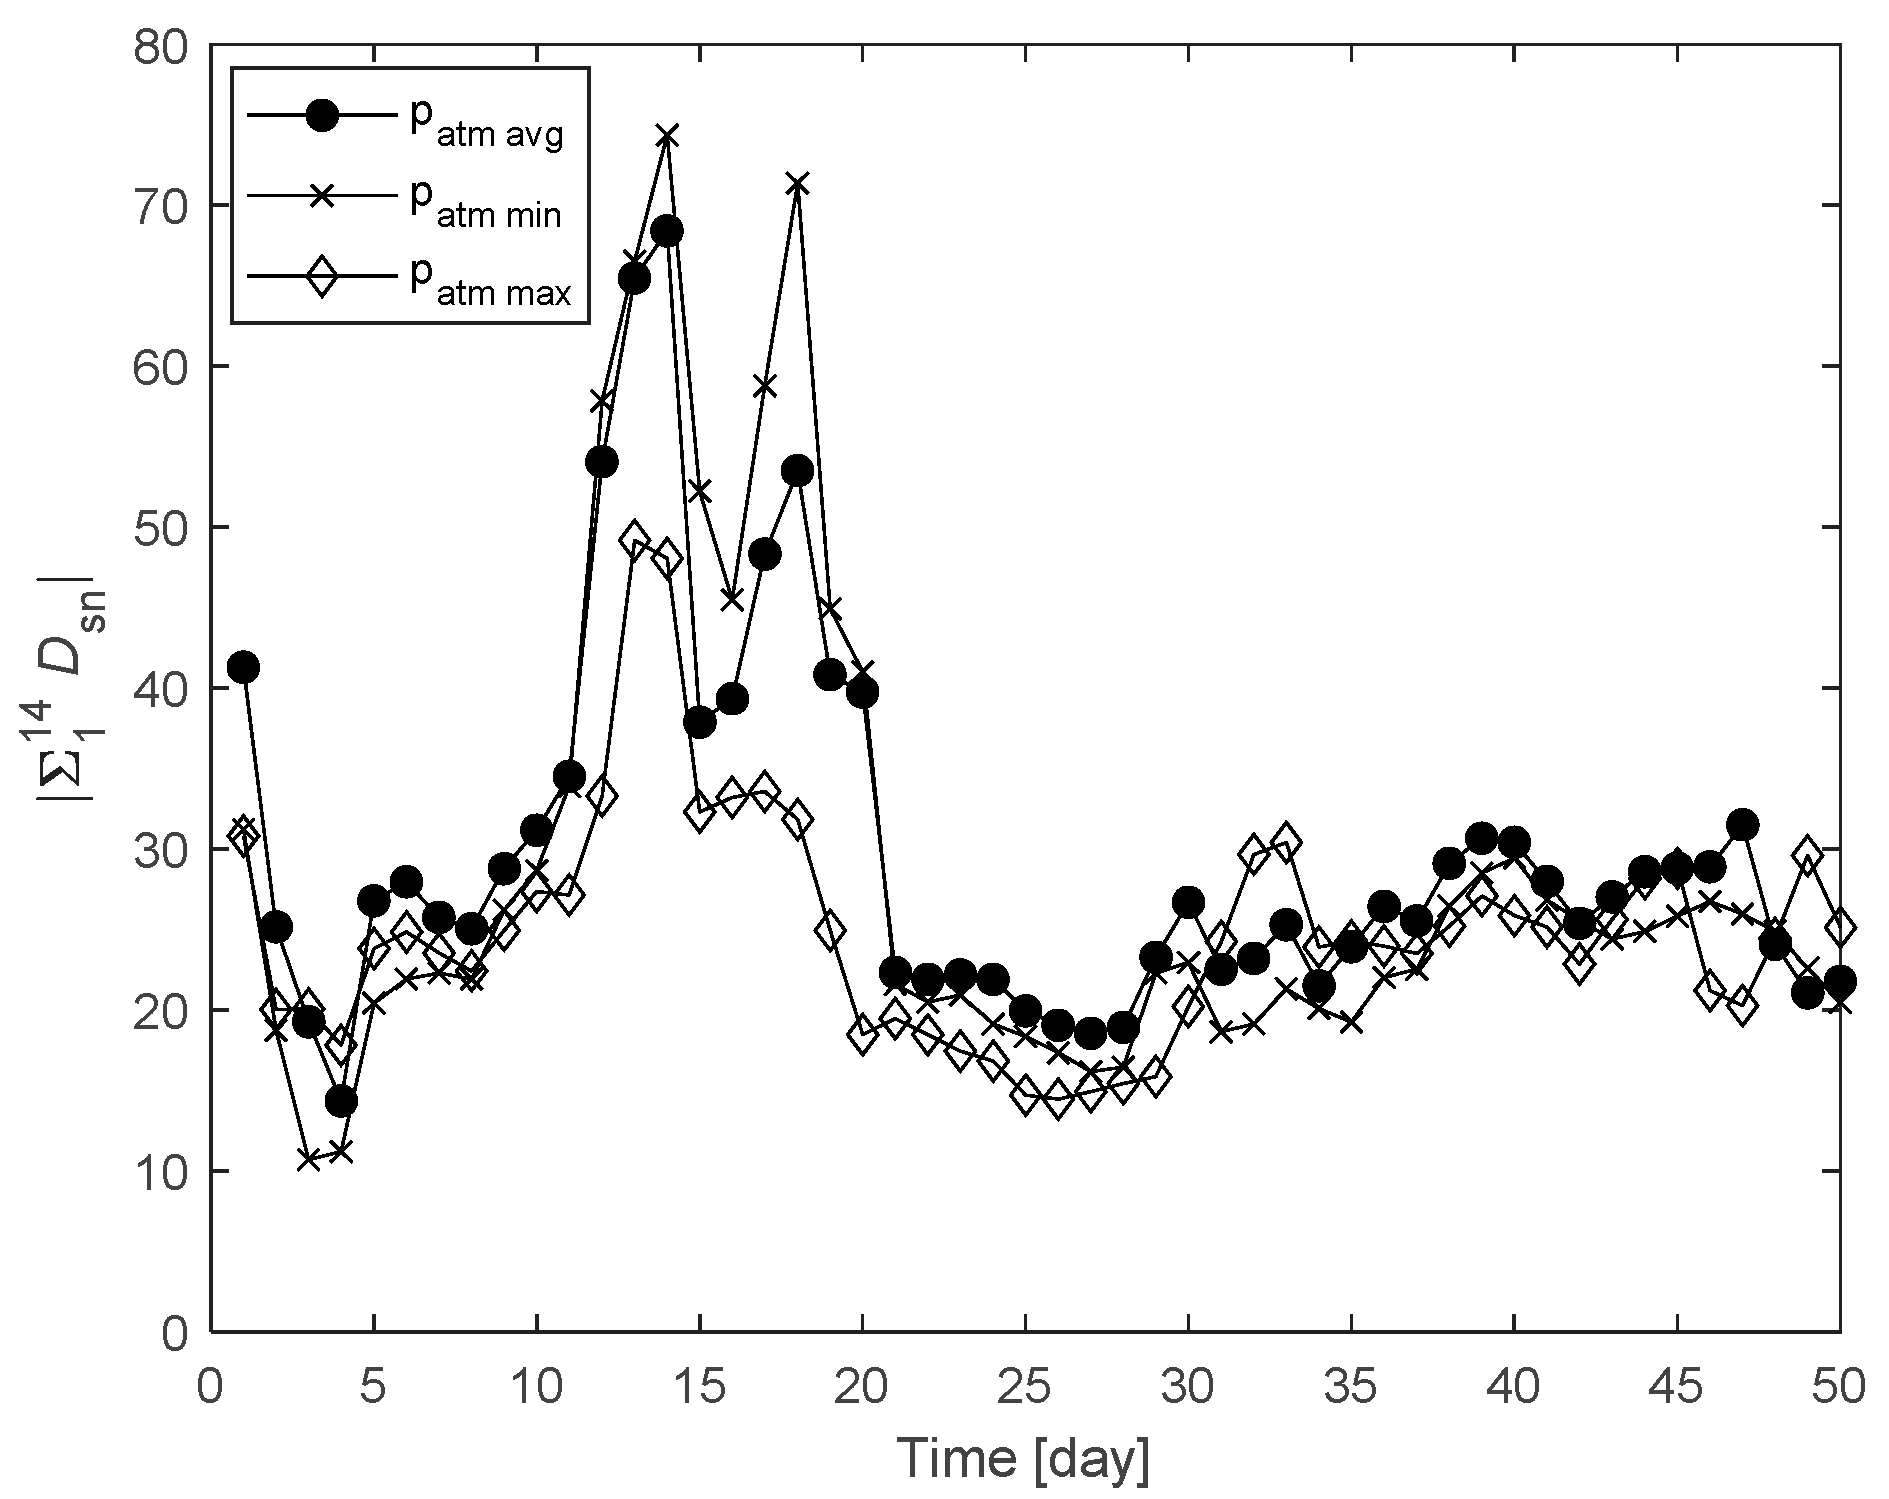
| Variable | Highest Dsn Value | Time of the Best Dsn Value | Related Figure | |
|---|---|---|---|---|
| Daily outdoor temperature | Avg | 52.5 | 40 | 5 |
| Min | 29.3 | 29 | ||
| Max | 43.3 | 40 | ||
| Relative humidity | Avg | 45.9 | 25 | 6 |
| Min | 57 | 22 | ||
| Max | 49.5 | 49 | ||
| Dew point temperature | Avg | 48.9 | 39 | 7 |
| Min | 39.6 | 29 | ||
| Max | 42.1 | 39 | ||
| Atmospheric pressure | Avg | 68.4 | 14 | 8 |
| Min | 74.4 | 14 | ||
| Max | 49.1 | 13 | ||
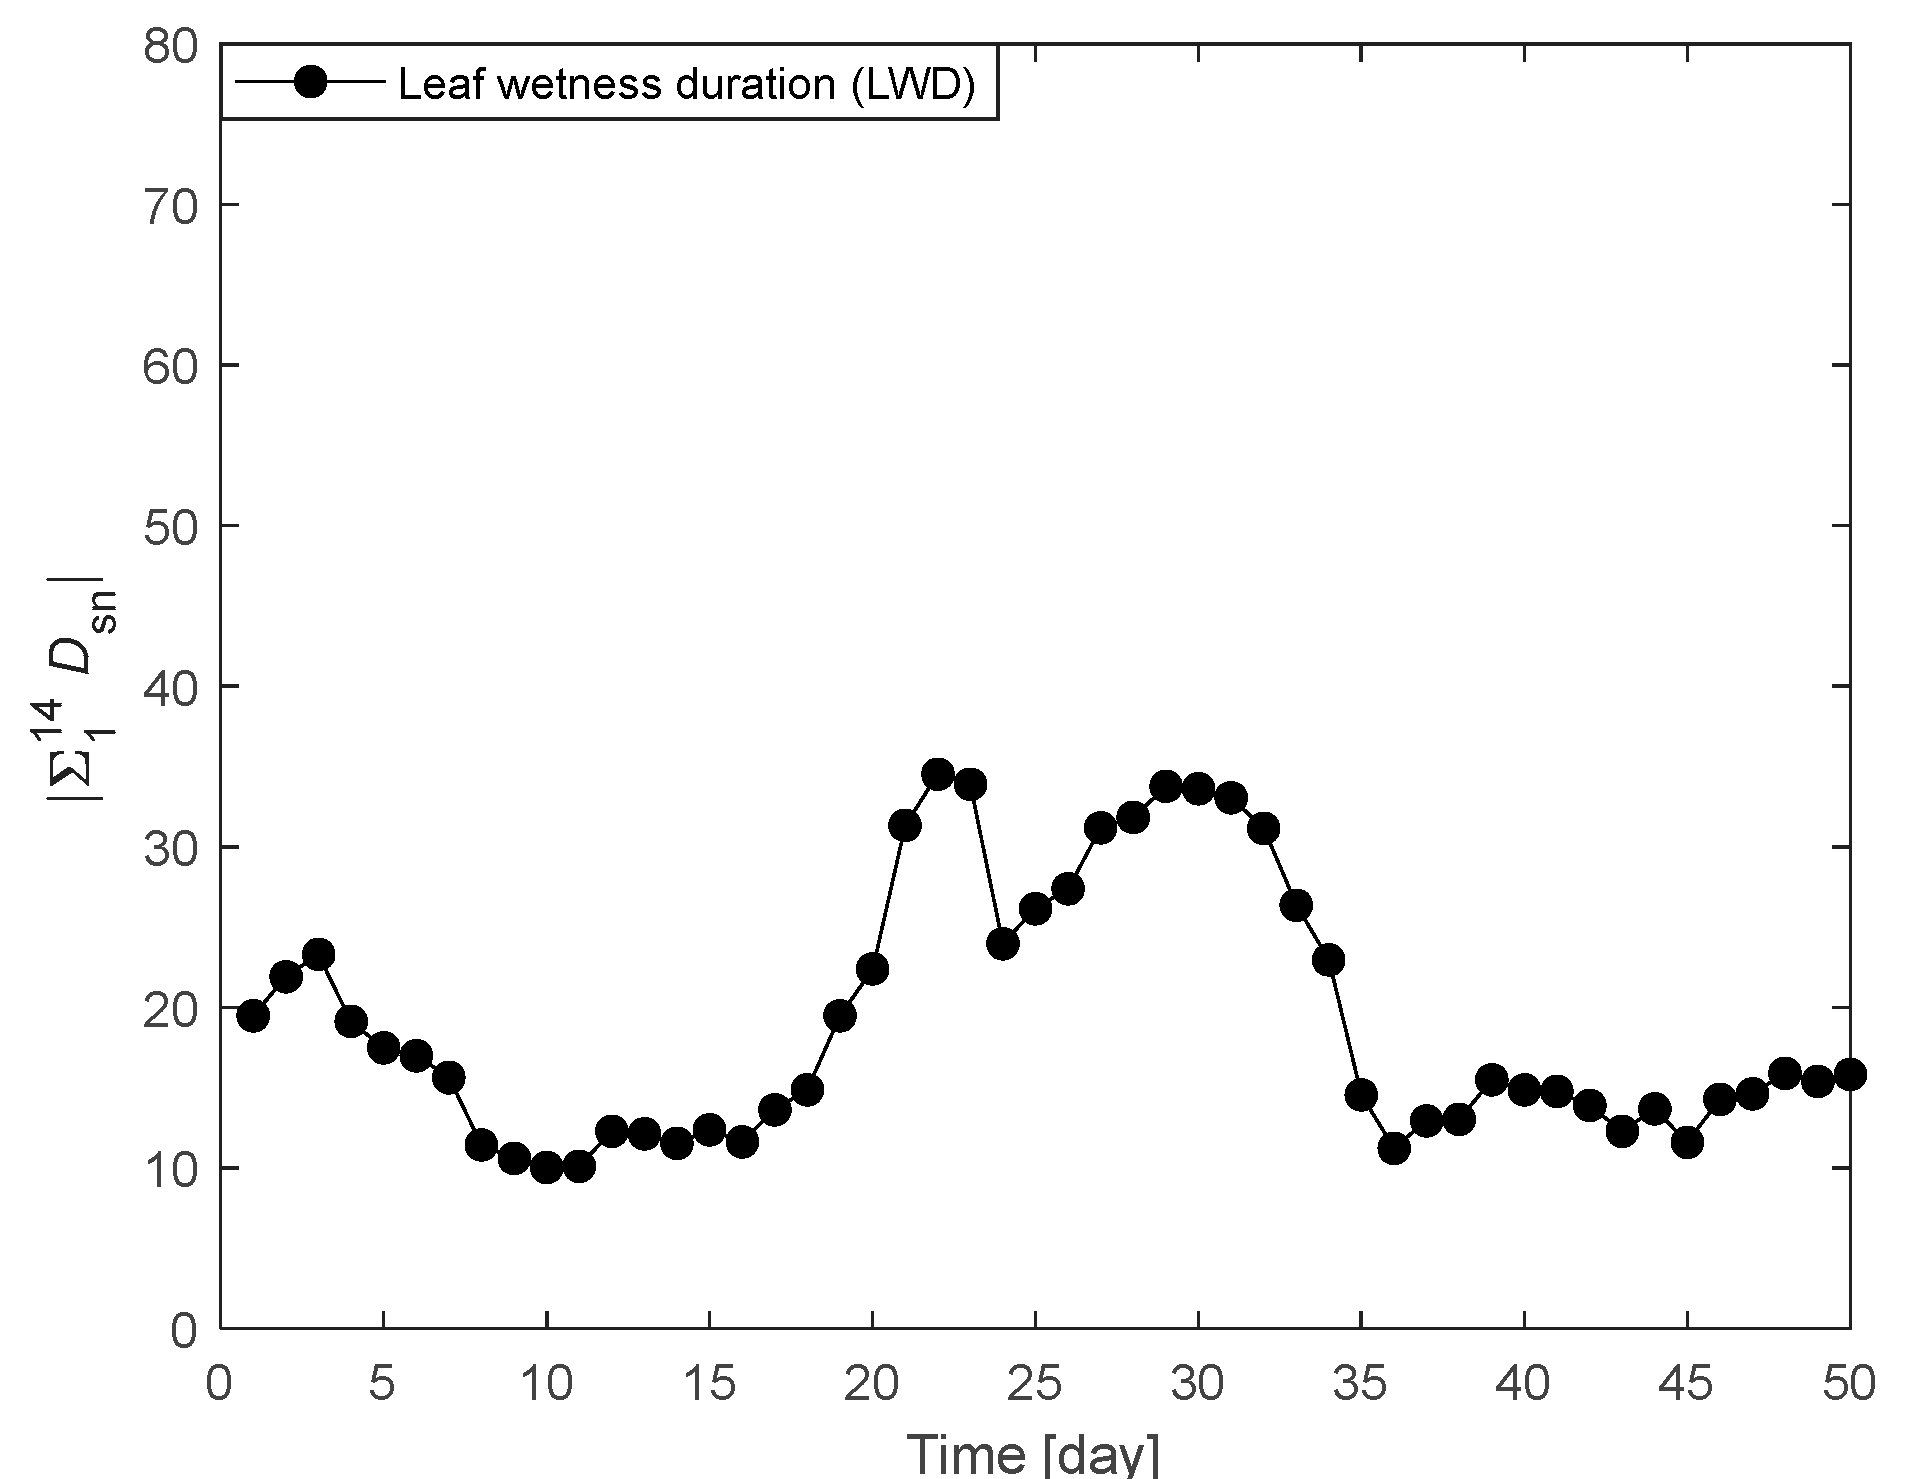
| LWD | 34.5 | 22 | 9 | |
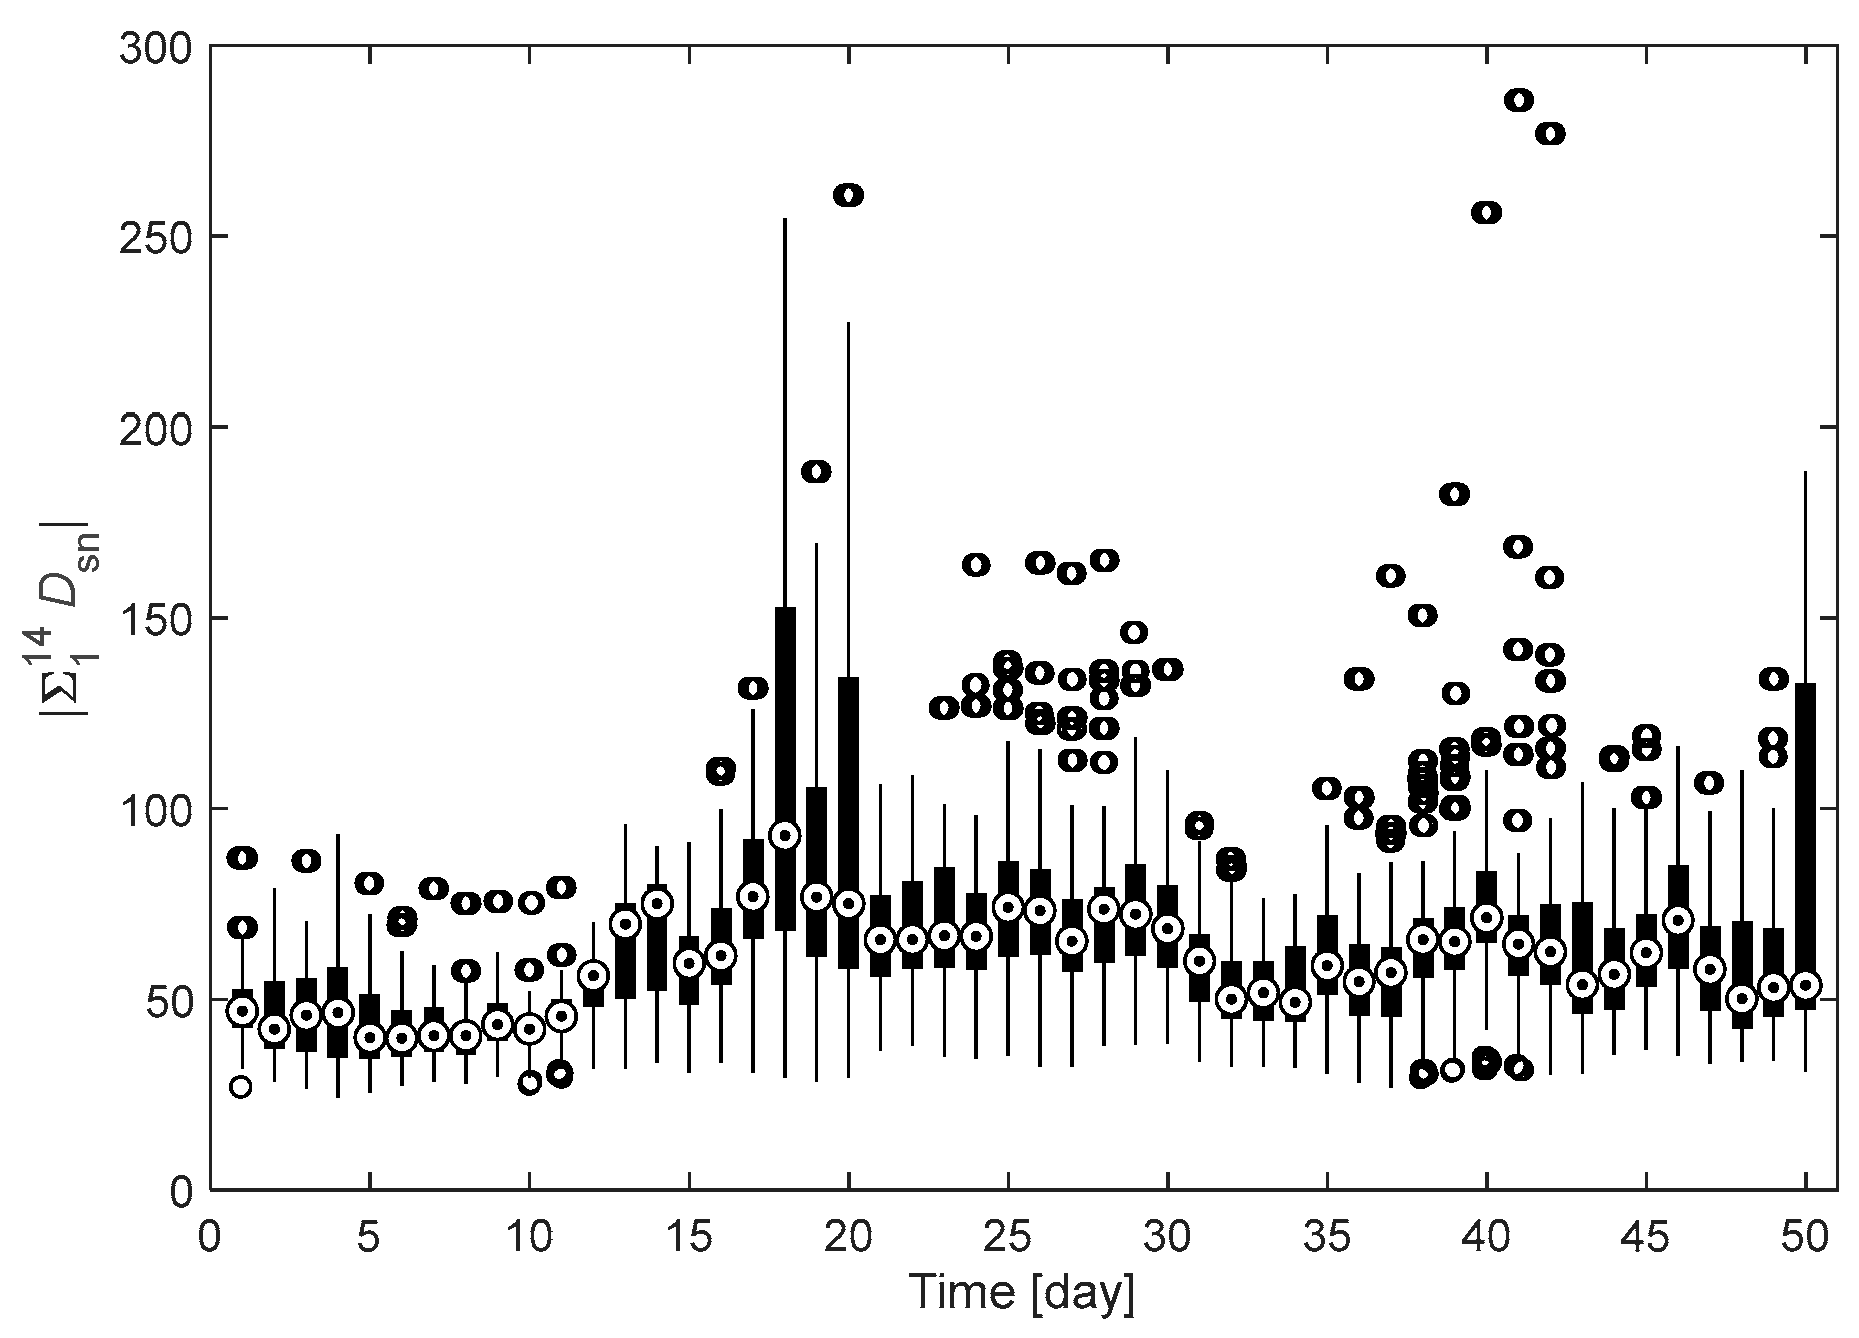
| Feature with the highest Dsn value | 285.8 | 41 | 10 | |
Publisher’s Note: MDPI stays neutral with regard to jurisdictional claims in published maps and institutional affiliations. |
© 2022 by the authors. Licensee MDPI, Basel, Switzerland. This article is an open access article distributed under the terms and conditions of the Creative Commons Attribution (CC BY) license (https://creativecommons.org/licenses/by/4.0/).
Share and Cite
Ruusunen, O.; Jalli, M.; Jauhiainen, L.; Ruusunen, M.; Leiviskä, K. Identification of Optimal Starting Time Instance to Forecast Net Blotch Density in Spring Barley with Meteorological Data in Finland. Agriculture 2022, 12, 1939. https://doi.org/10.3390/agriculture12111939
Ruusunen O, Jalli M, Jauhiainen L, Ruusunen M, Leiviskä K. Identification of Optimal Starting Time Instance to Forecast Net Blotch Density in Spring Barley with Meteorological Data in Finland. Agriculture. 2022; 12(11):1939. https://doi.org/10.3390/agriculture12111939
Chicago/Turabian StyleRuusunen, Outi, Marja Jalli, Lauri Jauhiainen, Mika Ruusunen, and Kauko Leiviskä. 2022. "Identification of Optimal Starting Time Instance to Forecast Net Blotch Density in Spring Barley with Meteorological Data in Finland" Agriculture 12, no. 11: 1939. https://doi.org/10.3390/agriculture12111939