Article

Long-Term Impact of Different Straw Management Practices on Carbon Fractions and Biological Properties under Rice–Wheat System

1
Department of Soil Science, Punjab Agricultural University, Ludhiana 141004, India
2
Department of Agronomy, Punjab Agricultural University, Ludhiana 141004, India
3
Prince Sultan Bin Abdulaziz International Prize for Water Chair, Prince Sultan Institute for Environmental, Water and Desert Research, King Saud University, Riyadh 11451, Saudi Arabia
4
Department of Agricultural Engineering, College of Food and Agriculture Sciences, King Saud University, Riyadh 11451, Saudi Arabia
5
Centre for Carbon, Water and Food, The University of Sydney, Camperdown, NSW 2570, Australia
*
Authors to whom correspondence should be addressed.
Agriculture 2022, 12(10), 1733; https://doi.org/10.3390/agriculture12101733
Submission received: 25 August 2022 / Revised: 28 September 2022 / Accepted: 11 October 2022 / Published: 20 October 2022
(This article belongs to the Section Agricultural Soils)

Abstract

:
Intensive agriculture has led to generation of a vast volume of agri-residue, prompting a reliance on conservation tillage techniques for prudent management. However, to ascertain the long-term impacts of these practices, the interrelation with the carbon fractions and the biological properties of the soil must be identified. Therefore, in a long-term experiment, five different treatments involving the incorporation of paddy straw as mulch or through disc harrow and farmer practice, including the partial burning of rice straw, were evaluated. After the harvesting of the wheat crop, soil samples collected from 3 different depths (0–15, 15–30 and 30–45 cm) were analyzed for various attributes critical to assessing soil health. Crop residue retention in both seasons (T4) improved carbon fractions, soil microflora viable cell counts and enzyme activities. The principal component analysis (PCA) revealed a positive interaction among the organic carbon, bacterial counts and soil enzyme activities. Thus, a positive impact of conservation tillage techniques involving a minimal disturbance was recorded as improvement in the soil properties, build-up of organic carbon, and wheat productivity in rice–wheat cropping systems.

1. Introduction

Rice and wheat are the major cereal crops ensuring world’s food security. India has second rank in the world only after China with an annual production of 101.3 and 175.6 million tons (MT) of wheat and rice, respectively [1]. In India, these crops are grown in the most prevalent and well-adopted rice–wheat (R–W) cropping system covering an areas of approximately 10.1 million ha [2]. Therefore, the sustainability of the R–W cropping system is critical to provide food security to the country. However, the practice of the traditional R–W cropping system for the last forty years has resulted in a decline in the inherent capacity of the soil to provide nutrient(s), the over-exploitation of groundwater leading to depleted water table, a stagnation in the productivity of the system and a decline in the net profits [3,4]. The air pollution caused by the burning of crop residues and the associated health hazards have been responsible for enhancing respiratory system-related disorders in the population of the region.
In Indian northwestern plains, during the onset of maturity, the crop is harvested generally using heavy farm machinery by large to medium farm holders. The combine is the most frequently used machinery by the region’s farmers, leaving behind a significantly sizeable quantity of crop residue in the field. This leftover crop residue can interfere with various field operations and is required to be managed prudently. India is estimated to produce 371 MT of crop residue [5]. The Punjab alone contributes to one-eighth of the total residues generated [6]. The majority of crop residue (70%) is contributed through the cultivation of cereal crops, with paddy alone contributing approximately 34% of the total residue [7]. However, an analysis of the data regarding crop residue management has revealed that a significant portion of the crop residues generated in the R–W cropping system, for example more than 80% of rice residue and 16% of the residue generated from other crop rotations [8], is burnt annually to prepare the field for the succeeding wheat crop [9]. It is due to the short period of about two weeks in the months of October and November, during which the paddy crop is reaped and the wheat crop is sown. The use of a combine for harvesting puts behind an enormous load of rice residues in situ, which in the paucity of proper machinery for recycling, further compounds this problem. The rice straw contains a high silica content, thus it cannot be alternatively utilized as animal feed. Therefore, the farmers opt for an inexpensive and effortless way to dispose of the residue, which is by burning, to ensure the quick vacation of the field for the sowing of the succeeding crop [10,11]. In addition, the high C/N ratio renders the crop residues to undergo a slow decomposition, with the on-farm burning being a helpful resort for the farmers. However, air pollution caused by residue burning is manifested as the occurrence of suspended particulate matter and the production of greenhouse gases (70% C as CO2, 7% as CO, 0.66% as CH4 and 2.09% of nitrogen in the form of N2O into the atmosphere [12]), in addition to the formation of 18% black carbon [13] (Figure 1). The occurrence of the suspended particulate matter contributes to respiratory disorders and a drastic change in the climate conditions in the region. Further, the removal and burning of residue causes a net loss of macronutrients, i.e., 80, 25 and up to 21 percent of N, P and K, respectively, from the soil, which can negatively affect the crop productivity and soil health [14]. The black ash layer left on the soil surface post-residue burning acts as an adsorbent that can lead to the reduction in the effectiveness of the applied herbicides [15].
The residue burning is also not suitable as it leads to an increase in the temperature of the top soil [16]. The high temperature will lead to the killing of several plant beneficial micro-, meso- and macro-biota, thereby adversely affecting the soil food web [16,17]. Most likely, the soil microbiome in terms of the number, diversity and succession of the microbial communities will be negatively influenced, thereby affecting the long-term viability of the R–W cropping system [3,4]. As the long-term sustainability of the traditional R–W cropping system is being endangered, a comparative evaluation of the alternative conservation agricultural techniques such as zero tillage, conservation tillage and alternate uses of agri-residue is required to be investigated before making any recommendations to the growers.
Various options of straw management practices have been carried on. The surface retention of crop residues preserves carbon (C) and can help restore the capacity of soil to supply the plant nutrients. This may lead to the improvement or stabilization of the soil organic carbon (SOC), soil quality and specific soil physical parameters [18,19,20]. The soil carbon content is a critical attribute that is required to be monitored to predict the fertility status of the agricultural land. Among the various tools for the monitoring of soil carbon-based compounds in addition to the soil organic carbon content is soil spectroscopy, which is a useful tool for quantifying different soil properties, e.g., the nutrients, organic carbon, texture and soil moisture [21]. Infrared spectroscopy, particularly the Fourier transform IRS (FT-IRS) performed for the mid IR range (400–4000 cm−1), is well suited for the quantification of soil organic matter because the organic functional groups present in organic matter are well within the spectral range of MIR analysis exhibited as the characteristic absorption bands. Recent findings indicate that the varied incorporation of straw residues may help to determine the quantity and quality of the soil organic matter in the soil [22]. However, the chemical structural components of the soil organic carbon is quite unclear [23].
Soils rich in organic carbon act as a biological index of the soil’s quality or health and provide a habitat to diverse soil microorganisms which have a role in the decomposition of organic residues, biogeochemical transformation of plant nutrients and prevention of soil erosion [24,25]. The retention of crop residue on the soil surface helps in the proliferation of various soil microbes as the residue acts as a food or substrate and in turn will assist in the degradation of the soil organic matter. Furthermore, it will lead to an improvement in the microbial activities, such as nitrogen fixation and phosphorous solubilization thereby, enhancing the nutrient-supplying capacity of the soil [26,27,28]. Therefore, emphasis on the soil biological properties and the carbon sequestration potential in agricultural systems must be provided concerning their effect on different straw management practices. This manuscript aimed to evaluate the effect of different long-term straw management techniques on the yield, soil edaphic and microbiological properties in the rice–wheat cropping system.

2. Material and Methods

2.1. Study Site Description, Crop Management, Soil Sampling, and Basic Properties

The ongoing long-term experiment (initiated in 2009) on rice–wheat crops at the Research Farm, Department of Agronomy, PAU, Ludhiana, Punjab was selected for the proposed study. The experimental site exists in the central plains of the northwestern state of India, Punjab with the geographic coordinates of 30°89′ N latitude and 75°79′ E longitude. The region has a sub-tropical, semi-arid conditions (with cold winters and hot summers). Wheat variety PBW 677 was sown in the field (individual plot size of 4.0 × 2.5 = 10.0 m2) during the first and second week of November in 2017–2018 and 2018–2019, respectively. The fertilizer application doses (basal dose of P and K as single super phosphate (16% P2O5) = 26.2 kg P ha−1 and muriate of potash (60% K2O) = 25 kg K ha−1, respectively) were applied to all treatments. The urea (N-fertilizer) was applied at three different rates of 100, 125, and 150 kg N ha−1 as per the treatments in split dose scheduling manner (one half at sowing followed by two equal splits of top-dressing application 21 days and 45 days after first and second irrigation) to the growing crop. The grassy/ broad-leaf weeds and root-damaging insect pests particularly termites were managed by foliar application of clodinafop (Topik 15 WP at 400 g ha−1), and metsulfuron (Algrip 20 WP at 25 g ha−1) on one-month old crop for the former and seed treatment with chlorpyriphos (20EC @ 4 mL kg seed−1). The other cultivation practices were followed as per recommendations provided to growers of the region by Punjab Agricultural University for rabi crops [12]. Irrigation schedule followed for the entire crop growth period included application at ~one week before sowing: 100 mm, and at critical growth stages of wheat crop (4 additional irrigations: 75 mm). During kharif season one-month old nursery of rice (cv. PR 127) was transplanted (from 7 to 20 June). Fertilizers were applied as per the standard cultivation recommendations (urea equal 3-splits at and 3 and 6 weeks after transplantation, basal dose of K: 25 kg K ha−1 and Zn: 10 kg Zn ha−1). Flood irrigation with an amount of 75 mm depth of each irrigation was applied to the rice crop. Harvesting was carried out during the month of October (15 to 25 October).
The experiment included five treatments of crop residue management practices, which were laid out in RCBD in triplicate (Supplementary Table S1). In the first two treatments, the crop residue management practices were initiated in 2010, i.e., one year after the experiment’s start. In treatments T3 to T5, the straw management practices started after the completion of first crop. In treatment T1 to T3, the rice was transplanted without the wheat straw, the wheat straw was incorporated before the transplanting of the rice in T4 and the farmers’ practice of transplanting the rice after the partial burning of wheat straw was followed (T5). A total of 45 bulk soil samples were collected by auger, randomly, at three depths (0–15, 15–30 and 30–45 cm) from each replicated plot of the selected treatments, after the wheat harvest during April 2020 from the R–W system.
Among the various parameters studied, soil bulk density (Db) was determined for samples obtained by using a metallic core (height: 13 cm, internal diameter: 10 cm) [29]. The soil chemical properties for the air-dried samples were carried out. The soil samples were crushed by using a pestle-mortar, sieved through a 2000 μm sieve, and stored in plastic carrier bags. The soil microbial counts and enzymatic activities were evaluated for the soil samples preserved in the refrigerator. The soil was damped with water until the moisture reached the water holding capacity for enumeration of microbial count and biochemical activity. The damped soil samples were kept in the BOD incubator at 27 ± 2 °C for five days to allow for the equilibration of the microbial activity subsequent to the initial disturbances. The plant samples of wheat straw and grain were collected after maturity and desiccated at 65 °C until a stable weight was obtained, ground using an electric grinder and stored in paper bags for further analysis.
An aggregate analysis of the soil samples was also performed and large soil clods collected from 0 to 15 cm using a spade were dehydrated in the shade and crumbed into small aggregates along a natural cleavage using gentle strokes. The aggregates, which passed through an eighty mm sieve, were taken and passed through a 4 mm sieve. The aggregates collected on the 4 mm sieve were utilized to evaluate the aggregate size distribution using a nest of sieves with an aperture with variable diameters of 2000, 1000, 500, 250 and 100 μm by a wet sieving method using the Yoder apparatus [30]. The brief procedure involved the following details. The soil sample (50 g) retained on the 4 mm sieve was placed on a set of sieves which were adjusted in such a way that the level of water in the drum touched the base of the topmost sieve (2 mm), ensuring a gradual wetting of the aggregates by capillary action for 10 min. The sieves set were allowed to oscillate @ 30 cycles per minute for 30 min. The soil samples remaining in each sieve were obtained and dried at 105 °C until the constant weight was obtained. The aggregates in each set were calculated by the difference of the dry weight of the course of the soil fraction from the first sieve [30].

2.2. Carbon and Its Fractions

The soil organic carbon was estimated through the Walkley and Black method [31]. The total organic carbon (TOC) was evaluated using the wet combustion technique as mentioned by [32]. The different oxidizable carbon fractions were determined by [33] using variable concentrations of the H2SO4 and K2Cr2O7 solution. The oxidizable OC were separated by increasing the concentration of the oxidizing sulfuric acid aqueous mixture (12 N, 18 N and 24 N, respectively). The differential heat which was produced thus caused the oxidation of the SOC of a different oxidizability. This aspect was responsible and thus utilized for the fractionation of the TOC to the fraction, illustrated as:
  • Very labile fraction (Cfrac1) = organic C oxidizable under 12 M of H2SO4.
  • Labile fraction (Cfrac2) = the subtraction of organic C oxidizable under 18 M from that under 12 M of H2SO4.
  • Less labile fraction (Cfrac3) = the subtraction of organic C oxidizable extracted between 24 M and 18 M.
  • Non-Labile fraction (Cfrac4) = remaining organic C after oxidation with 24 M of H2SO4 as compared to the TOC.
The amount of labile carbon (LC) was calculated by the oxidation reaction with the potassium permanganate solution (333 mM of KMnO4) [34]. The soil sample (2 g) was weighed in a tube and KMnO4 (25 mL, 0.33 M) was incorporated in small aliquots using a horizontal stirrer for about 6 h. The contents were then centrifuged at 4000 rpm to obtain the clear supernatant. The supernatant solution (1 mL) was transferred to a volumetric flask (25 mL) and the volume was made up with distilled water. The contents of the volumetric flask after the volume makeup were analyzed by taking the absorbance on a spectrophotometer at λ = 550 nm.
The lability index (LI) and carbon management index (CMI) were evaluated [34] using (Treatment 1) conventional tillage soil with no residue retention as a reference, and the remaining treatments were to be the sample. The labile carbon content was taken from the previously evaluated carbon fractions. The lability index, a sensitive indicator of the soil quality, and C lability alterations can directly influence the soil’s physical, chemical and biological characteristics along with nutrient cycling.
Lability index (LI) = (Lability Sample soil-C)/(Lability Reference soil-C)
Lability of carbon = KMnO4-oxidisable C/non-labile C.
Carbon pool index (CPI) = Sample TOC/Reference TOC Carbon management index (CMI) = CPI × LI × 100.
The biomass carbon of microbes (MBC) was assessed through the chloroform (CHCl3) fumigation method [35]. The shade-dried soil sample (10 g, passed through a 0.5 mm sieve) was fumigated with CHCl3 (50 mL, ethanol free) for 24 h in an air-tight desiccator and was taken for incubation. After removing the fumigant, an extraction with K2SO4 (0.5 M, 40 mL) was carried out for both soil samples (i.e., CHCl3-fumigated and non-fumigated) for 30 min under shaking conditions. The MBC was then calculated as the difference in the soil extractable C with and without fumigation [36].

2.3. Enumeration of Soil Microbial Counts

The aerobic bacteria, actinobacteria, fungi and cellulose degrading microorganisms in the soil were enumerated by performing the standard serial dilution plate assay on diverse defined and differential agar-based media (nutrient agar, potato dextrose agar, Ken Knight’s agar, and CMC agar, respectively). The media were prepared and autoclaved for 20 min at a pressure of 15 psi and a temperature of about 121 °C. A serial dilution was performed by adding 10 g of the representative fresh soil samples in 90 mL of sterile water blank and they were labeled as the dilution (10−1). The mixture was agitated @ 120 rpm for 10 min and allowed to decant for 2 h. From this dilution, 1 mL of aliquot was subsequently transferred to a new water blank (9 mL) to obtain the further dilutions. Finally, the PDA, Ken Knight’s and CMC agar were spread plated with 10−3 dilution while the total aerobic bacterial count was enumerated from 10−5 dilution. The Petri plates were incubated in a BOD incubator for 2 to 6 days at 27 ± 2 °C in an overturned position. The grown microbial colonies emerging on the dilution plates were enumerated and expressed in colony-forming units (CFU) per gram of the dry soil.

2.4. Soil Enzyme Activities

The dehydrogenase enzyme assay was performed which depicted the living microbial cells [37].The soil sample (1 g) was incubated with TTC (2, 3, 5-triphenyltetrazolium chloride) (0.2 mL, 3% w/v) along with the glucose (0.5 mL, 1% w/v) solution for 24 h at 28 °C. After the incubation, the samples were extracted with methanol (10 mL) under mild shaking conditions, followed by filtration through filter paper (Whatman No. 1). The extract was collected in a volumetric flask (50 mL) and the extraction step was repeated until it gained the appearance of a transparent solution. The dehydrogenase activity was measured by monitoring the rate of formation of Triphenylformazan (TPF). The absorbance of the pink to red color was read at a wavelength of 485 nm with methanol as the blank. The standard curve was prepared for TPF (10 to 100 μg). The amount of TPF formed was calculated with reference to the standard curve.
The soil alkaline phosphatase activity, an indicator of the extent of microbial P-solubilization, was also estimated [38]. The soil sample was mixed with toluene (0.2 mL), buffer (4 mL, pH 11) and p-nitrophenyl phosphate solution (1 mL), and the contents were mixed by swirling followed by stoppering and incubation at 37 ± 2 °C for 1 h. Post-incubation, CaCl2 (0.5 M, 1 mL) and NaOH (0.5 M, 4 mL) were added to the soil suspension and the contents were filtered through a Whatman No. 1 filter paper. The absorbance peak for the filtrate was measured at λ = 420 nm for the p-nitrophenol content.
To ascertain the possible impact of the residue-based agronomic interventions on nitrogen-related processes in the soil, the urease activity was determined, ref. [39] which involved the addition of an extracting (KCl-PMA) and coloring agent to develop a red color by heating the contents on a water bath, followed by taking the measurement of the intensity at a 527 nm wavelength.

2.5. Functional Group Characterization of the Soil Samples

The variations in the functional chemical groups occurring in the soil due to the incorporation of rice straw were analyzed through Fourier transform infrared spectroscopy (FT-IRS, Perkin Elmer Spectrum 100 FT-IR/NIR Spectrometer). The known quantity of finely grounded oven dried samples was mixed with KBr (IR spectroscopy grade), homogenized and press-pelleted (9 × 10⁴ N).The thickness of the pellet was 1 mm along with a diameter of 13 mm. Then, the pellets were analyzed to obtain the curves through the interaction with the IR radiations in % transmittance mode for the mid-IR ranging from 4000 to 400 cm−1 [40].

2.6. Statistical Analysis

The analysis of variance (ANOVA) procedure was carried out (SPSS 16.0 software, USA) for obtaining significant variations at p < 0.05 among the effects of the respective treatments. A principle component analysis (PCA) was performed on the data set to identify the similarities and differences between the samples and to assess the relationship between the observed variables.

3. Results and Discussion

3.1. Soil Physical Properties and C Pools

The results indicated that both the incorporation of the residue and tillage significantly affected the bulk density and mean weight diameter (Supplementary Table S2). The bulk density decreased with the addition of the crop residues and conservation tillage, which resulted in an average 5% decrease with respect to the conventional tillage for the upper soil layer. Similar observations were recorded for the lower soil depths. The mean weight diameter trend showed opposite outcomes regarding the bulk density (Figure 2).
The incorporation and retention of crop residue significantly improved the mean weight diameter, with a 33% increase in comparison to traditional tillage and no residue retention. As for the soil organic carbon, total organic carbon and its different fractions, all parameters reported a significant increase with the retention of the crop residue for both crop seasons and zero tillage (Supplementary Table S2). Additionally, similar trends were observed in the lower depths, but such was not the case with the carbon fractions in which the majority of the observations exhibited a non-significant effect of the straw management practices. The mean concentration of the various fractions of SOC were as the recalcitrant fraction (46.3%) > very labile fraction (21%) > less labile fraction (17.8%) > labile fraction (14.9%) for the plough layer (Supplementary Table S2). Compared with the conventional tillage, the KMnO4-C content significantly improved by 23%, 20.9% and 19.7% for zero tillage, with the residue being retained for both seasons at soil depths 0–15, 15–30 and 30–45 cm, respectively. The microbial biomass carbon (MBC) in different soil depths varied from 152.30 to 240.20, 82.57 to 147.23 and 51.73 to 84.23 mg kg−1 for soil depths 0–15, 15–30 and 30–45 cm, respectively (Supplementary Table S2). The carbon management index significantly improved in all treatments, except in ZTW (RB) (99.98), with a maximum improvement in ZTW (+WR) (142.26). On average, the carbon management index varied from 99.98 to 142.26. However, the lability index (LI) was non-significant among the treatment ZTW (+WR), ZTW (+R) and CTW (+R), which were statistically at par with each other, but were significantly higher as compared to the reference CTW (–R) (Table 1).
The purpose of this experiment was to evaluate the suitable tillage management technique concerning the soil health implications and soil depth. Soil organic matter generally acts as a substrate for enzymatic degradation and thus affects the enzyme activities in soils. The reduction in the bulk density in the zero tillage with mulch plots may be ascribed to a higher microbial activity, which produces root exudates and helps in increased soil aggregation [41]. In our study, a higher mean weight diameter in the zero tilled treatments may imply an increase in organic matter, which acts as a cementing agent, along with the improved microbial activity producing polysaccharides which are capable of binding soil particles to aggregates [42]. The subsequent input of the residue in the zero till plots for several years might have been responsible for enhancing the soil organic carbon content. Crop residues provide food for microbial activities to proliferate, which slowly and gradually decompose the residue and ultimately improve the organic matter content of the soil [43]. The non-labile and labile fractions of SOC are more sensitive to different straw management practices than very labile and less labile fractions.
Further, the results showed a higher stabilization and concentration of the non-labile carbon in soil under the R–W cropping system due to a difficulty in degrading the non-labile/recalcitrant carbon fraction. The higher concentration of KMnO4-C in the ZT plots may be ascribed to the higher microbial action because rice straw acts as food for microbes in the form of carbonaceous material, resulting in increased KMnO4-C and a lesser concentration in CT plots due to the enhanced oxidation of the soil organic carbon to CO2 by the destruction of soil aggregates and the improved aeration by intensive tillage [44]. Crop residues retained in ZT soils provide a continuous food source for microbes. The improvement in MBC in ZT over CT might be attributed to the root exudates in rhizosphere which improves the microbial activity and plant growth, thus resulting in the mineralization of organic carbon obtained from crop residues, which ultimately results in an increased MBC. Other factors might be the balanced soil temperature, aggregate stability and the higher SOC content in ZT than CT, leading to an improved MBC. The higher LI in the residue-retained treatments might be attributed to the higher proportion of labile carbon in these treatments. The higher CPI in ZTW (+WR) indicated a more significant build-up of C in the plot [45,46].

3.2. Soil Microbial Viable Cell Counts in Different Residue Management Treatments and Soil Depths

The soil microbial cell count exhibited a significant effect of the long-term adoption of different straw management practices on the microbial communities for all soil depths (Table 1). At a 0–15 cm depth, the aerobic bacterial and fungal count observed a significant improvement by the incorporation and retention of the crop residue along with the conservation tillage practices. Although, there was a significant difference in the microbial count among the treatment, but the count tended to decrease with the increase in the soil depth. This depth-dependent decrease in the fungal count may be due to the reduced availability of adequate oxygen at increased soil depths, which are critical factors affecting the survival of the microbes. Further, the pattern of the actinobacterial count was similar to that described for the other microbial communities at different soil depths, with the highest counts for zero tillage in which the residue was retained for the consecutive crop year. It led to a significant enhancement in the microbial communities with the long-term impact of crop residue management practices, which might be due to a lesser availability of organic carbon as a food reserve for actinobacterial perpetuation and the heating effect of the partial burning of the residue in the upper soil layer.
A higher microfloral biomass is often associated with an increase in the transformation and stabilization of the organic C in the soil. The increase in these properties might be attributed to a lower concentration of soil organic carbon, abundant in ZT soils that helped various microorganisms to proliferate. Moreover, the cellulose and hemicellulose components of the crop residues function as substrate food material for a specific group(s) of heterotrophic microbes, thereby directly providing nutrients [47]. In the present study, the fungal genera flourished in the ZT treatments, because ZT may tend to add crop residue through retention and involve the root exudates as the substrates, which provides an organic matter for the fungi [48]. The subsequent input of the residue for several years in zero till plots tends to retain the moisture and increase water infiltration, protects the soil from wind and water erosion, regulates the soil temperature, sequester carbon and improves the soil’s biodiversity. Improving the soil organic carbon content might have been responsible for enhancing the viable count of the actinobacteria [49,50].

3.3. Soil Enzymatic Assay

Based on the above analysis, the addition of straw using different crop residue management practices affected the enzymatic activity in the soil (Table 2). Compared with traditional tillage with no residue retention treatment, all the other conservation tillage practices promoted the enzymatic activities. The dehydrogenase activity of the zero tillage treatments was higher than the conventional tillage treatments with 5.5% in 0–15 cm and 18.4% in 15–30 cm soil depth, respectively. The pattern of the alkaline phosphatase activity was similar to that which was explained for the dehydrogenase, with the average fluctuation of alkaline phosphatase activity measured at 28.68 µg of PNP formed g−1 soil h−1 for the upper plough layer. Although zero tillage tends to improve enzymatic activity, the improvement rate was much lower with the increasing soil depth. Furthermore, the long-term residue management techniques significantly but slightly improved the urease activity for the upper soil depth. Unlike the other enzyme activities, a non-significant relationship was observed for the different treatments for the lower soil depths in the case of the urease activity. The urease activity fluctuated from 3.62 to 4.68, with an average value of 4.12 μg of urea hydrolyzed g−1 of soil h−1 for the upper plough layer.
The improvement in the cellulase activity under the zero tilled soils was probably due to the lignocellulose nature of the rice straw substrate, which is prone to be degraded by cellulases and result in the conversion of complex polysaccharide to simple reducing sugars. The increased cellulase activity stimulated the disintegration of SOM and, hence, the net increase in the SOC stock [51]. Moreover, the higher dehydrogenase and alkaline phosphatase activities under ZT with residue retention could be attributed to a higher organic matter, which constantly acted as source of energy for the microbial activity. Moreover, the soils managed through zero tillage tend to have a higher moisture availability due to an improved organic matter and a stable soil aggregate [52]. The reason for the increased urease activity corresponding to the zero tillage sowing of wheat with residue retention might be due to the improved soil aggregation and, hence, aeration favoring the microbes to proliferate [53].

3.4. Yield and Uptake of Nitrogen, Phosphorus and Potassium as Affected by Different Tillage Practices

The treatment ZTW (+R) obtained a maximum biological yield of 132.83 q ha−1, while the minimum was 115.43 q ha−1 recorded in CTW (–R). The study revealed that different straw management practices did not significantly influence the harvest index during the wheat season (Table 3). The highest grain yield was recorded in the ZTW (+WR) treatment (57.43 q ha−1). The ZTW treatment (+R) (52.38 q ha−1), where the residue of only the wheat was retained, had a lower value than the best treatment, but the remaining treatments were statistically on par with each other. The highest straw yield was recorded under the treatment ZTW (+WR) (75.4 q ha−1) which was statistically on par with the treatments of ZTW (+R) (74.30 q ha−1), CTW (+R) (71.8 q ha−1) and ZTW (+WR) (72.7 q ha−1). However, the straw yield of ZTW (+WR) was significantly higher than CTW (–R) (65.9 q ha−1). The highest N uptake (99.77 kg ha−1) was observed with the ZTW (+WR) treatment but the ZTW (+R) and CTW (+R) treatments had a lower value of N uptake but were statistically on par with each other (Table 3). CTW (–R) observed the lowest N uptake with a value of 78.85 kg ha−1. The phosphorus uptake by grain under CTW (+R) and ZTW (+WR) was 29.4% and 17.8% higher than CTW (–R). Under ZTW (+R), CTW (+R) and ZTW (+WR), the phosphorus uptake was statistically on par in the grain. The conventionally sown wheat plot CTW (–R) gave the lowest content of potassium by grains and straw at 0.38% and 0.88%, respectively.
The higher biological yield in the straw-retained treatments might be due to a higher nutrient uptake due to the enhanced suite of physical, chemical and biological properties of the soil. The above-depicted results are validated by the research findings of [54] and may be due to improved soil properties by the crop residues, which provides an ample supply of nutrients to the plant roots, stable soil structure and enhanced water holding, resulting in an amplified grain yield. Residue not only enhances the organic carbon content of soil but it also stabilizes the soil structure, leading to a congenial environment proliferate root growth. Moreover, residue may also increase the nutrients available to plants, showing a positive effect on the N uptake and the concentration in grain and straw. [55].

3.5. Functional Group Characterization of the Soil Samples

The data on the FT-IR of the upper soil layer (0–15 cm), as presented in Figure 3, indicates a broad absorption peak spanning over 3785 to 3000 cm−1 in CTW (–R) soil samples due to the O–H stretching vibrations of the intra molecular bonded water molecules and phenolics in the sample [56,57]. A weak band at 3695.31 cm−1 could be attributed to clay O–H stretching, and the band is more prominent in CTW (–R). The bands between 3600 and 4000 cm−1 represent the occurrence of silicate type clay minerals. The peak at 1030 cm−1 corresponded to the Si-O-Si stretching vibration, which is typical of these minerals [56]. However, the presence of peaks at 3695 and 3415 cm−1 is characteristic of 1:1 clay, indicating that the dominant clay in these samples was likely to be kaolinite [58]. All soil treatments exhibited a presence of peaks at 1637.61–1635.44 cm−1, which can be assigned to an aromatic C=C stretch in aromatic-C, which represents lignin, led to the increased organic matter in the straw retained management plots [59].
The data corresponding to the FT-IR of the soil samples, as they were affected by different straw management practices for a 15–30 cm soil depth, are depicted in Figure 3. The absorption ranging from 3930.8 to 3238.12 cm−1 in the bands exhibited the presence of intra molecular bonded O–H stretching, which indicated the presence of hydroxyl groups and phenolics in the samples [56]. These bands are more pronounced in the ZTW (+R) and ZTW (+WR) soils, which have a residue retained on the soil surface. The sharp peak at 2927.17 cm−1 in ZTW (+WR) is the aliphatic C–H anti-symmetric and symmetric stretch bands, observable in sites which can be clearly distinguished in treatment where the straw application represented a high SOM [60]. The bands at 1031.19–1029.63 cm−1 indicated the presence of C–O stretching, which is indicative of the presence of cellulose and hemicellulose in the samples.
The FTIR spectra obtained from the analysis of the soil samples which represented bands ranging from 3619.06 to 3238.12 cm−1 can be attributed to the inner hydroxyl groups in clay lattice sheets. The intensity of the O–H stretching was more prominent in ZTW (+R), in which wheat was sown with a Happy Seeder, along with the residue retention on the surface. The higher hydroxyl groups may represent more cellulose in the soils [56]. The presence of peaks at 3620 cm−1 is characteristic of 1:1 clay, representing kaolinite as the dominant clay in these samples [60]. The spectrum between 2029.14 and 1878.02 cm−1 and 1382.49 and 1380.81 cm−1 indicated carboxyl and O-containing functional groups besides the C–H bending vibrations of the aromatic compounds and alkanes. All the soil treatments exhibited peaks at 1637.91–1618.47 cm−1 and 795.58–794.58 cm−1, which can be assigned to the aromatic C=C stretch representing the lignin because of the increased organic matter [61]. Zero tilled treatments exhibited an enhanced O–H stretching, probably representing the higher carbon due to the residue retention in both seasons characterizing the cellulose in the soil for the upper soil depth [62]. The accumulation of the hydroxyl, phenolics, aromatic and amide groups in the soil after the straw return is represented in the analysis [63]. Various types of peaks represent the presence of alkenes in the soil due to lignin and other aromatics in the ZT plots [64]. Increasing the degree of aromaticity suggests that a long-term straw return stabilized the organic carbon in the soil [65].

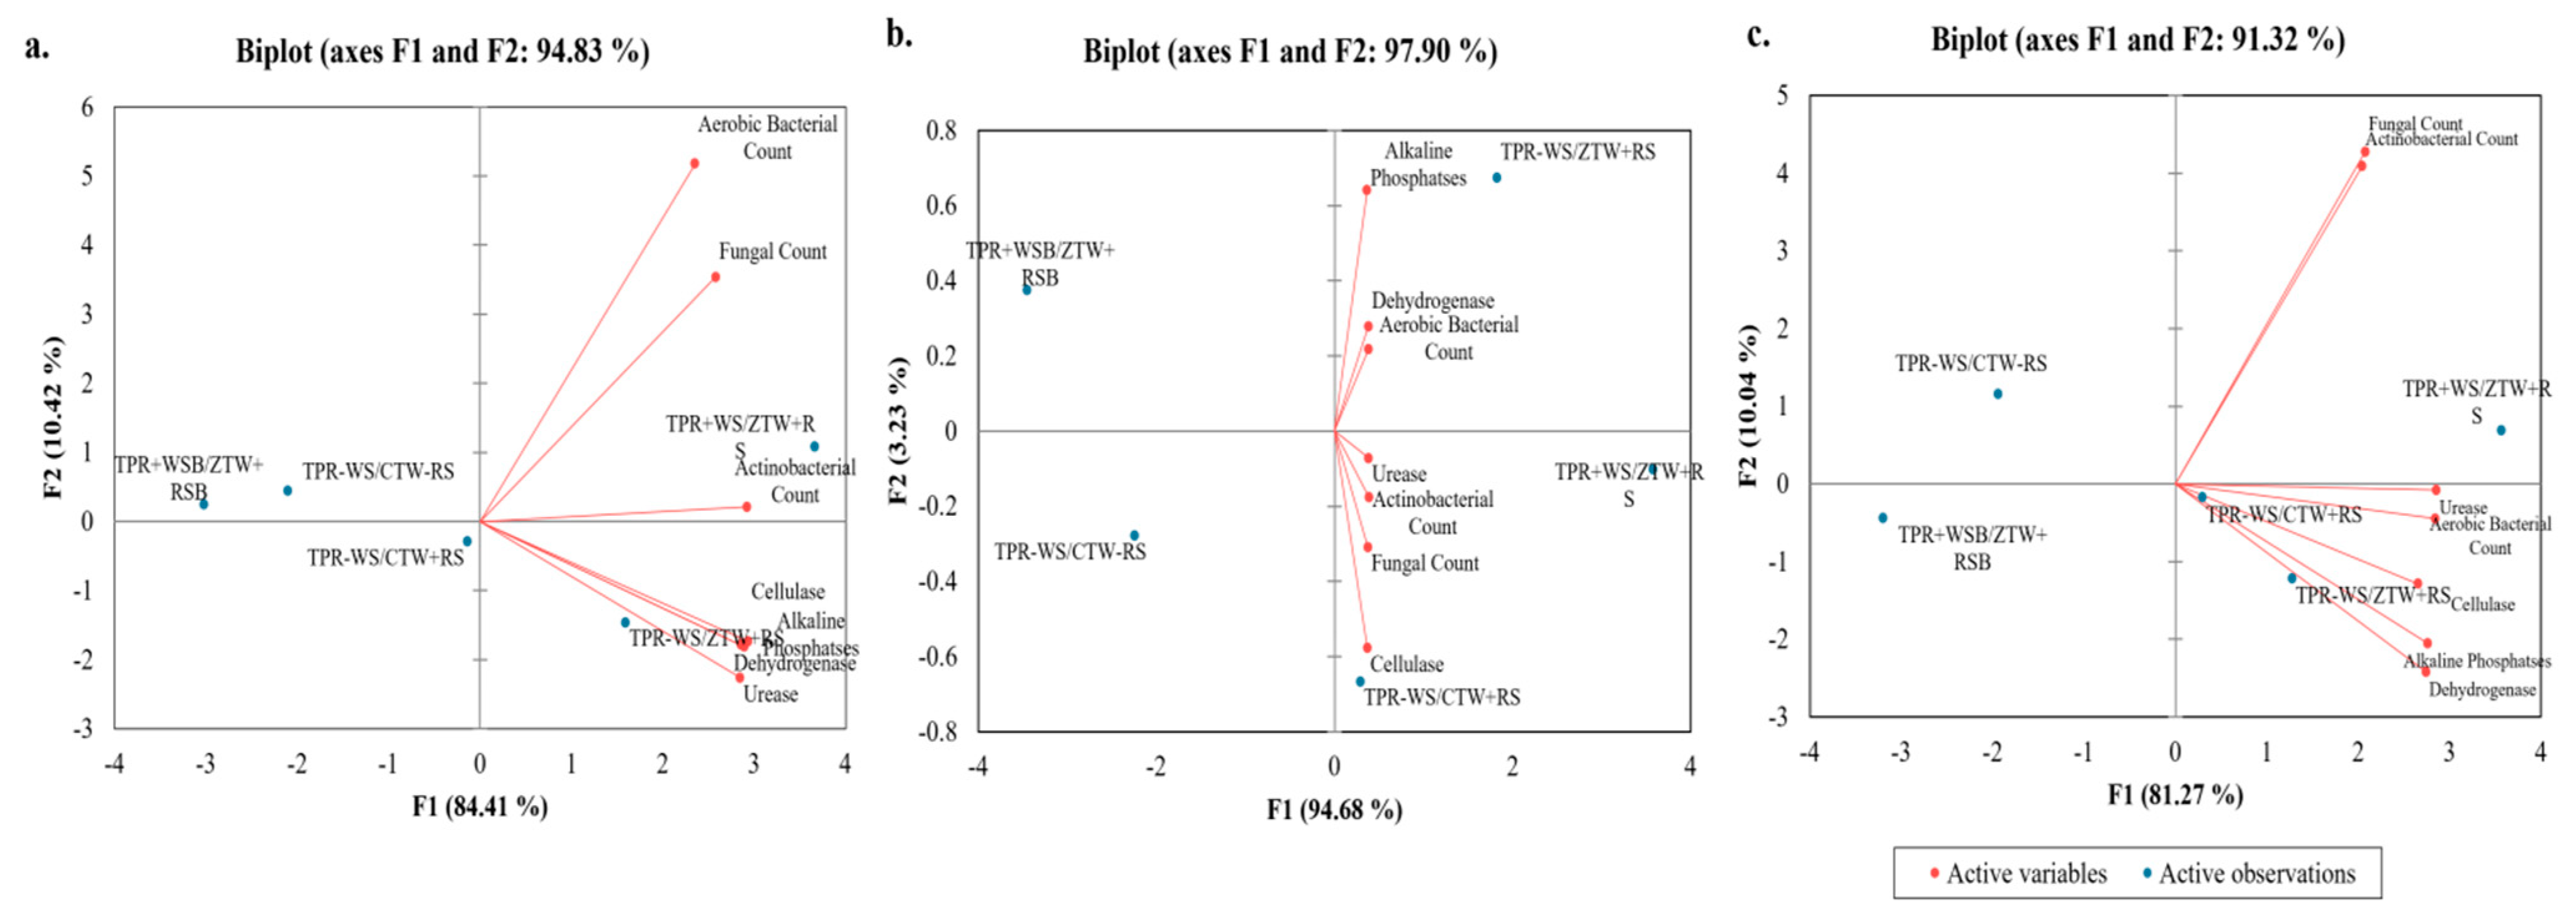
3.6. Principal Component Analysis (PCA) for Microbial Population and Soil Enzyme Activity

The principal components analysis (PCA) of the examined topsoil (0–15 cm) variables revealed a substantial difference in the microbial population and enzyme activity, considering the effects of the different tillage and straw management practices. The PCA identified two primary components (PC1 and PC2) for variability (Figure 4a). Both PCs contributed 94.83% of the total variance, out of which the variability contributed by PC1 was 84.41% and by PC2, another 10.42%. With the variables assessed for the microbial population and enzyme activity, the PCA divided them into two distinct groups, group (1): the bacterial, fungal and actinobacteria count and group (2): the cellulases, alkaline phosphatases, dehydrogenases and urease. Moreover, the PCA also depicted that the sowing of the wheat crop using zero tillage with residue retention for both seasons ZTW (+WR) has more influence on group 1 than the other treatments. On the other hand, ZTW (+R), in which wheat crop was sown using zero tillage but the residue was retained for current season, only had more influence on the properties in group 2.
For the soil depth of 15–30 cm, the first two components together contributed to 97.90% of the total variance, using the PCA for the microbiological properties. Out of which, the first component (PC1) contributed 94.68% to the variability, and second (PC2) exhibited only 3.23% variation (Figure 4b). The PCA clearly distinguished the microbial properties into two groups, group (1): the aerobic bacterial count and group (2): the actinobacteria and fungal count. All the assessed variables showed a positive correlation with PC1. For the enzyme activity, two groups were made by the PCA, group (1): the alkaline phosphatases and dehydrogenases, and group (2): the urease and cellulase. Among the variables, the alkaline phosphatases, dehydrogenases and bacterial count had a significant contribution to PC1, while the urease, actinobacterial count, fungal count and cellulases activity contributed to PC2. This biplot PC clearly separated the ZTW(+R), ZTW(+WR) and CTW(+R) treatments, which had more influence and a positively higher score for the PC1 axis. The biplot showed the position of variables and the long-term tillage and residue management practices enforced to the soil depth of 30–45 cm in wheat in the orthogonal space, defined by two PCs (Figure 4c). The analysis of the principal components (PCs) of the assessed variables in a 30–45 cm soil depth revealed that the first two components contributed 91.32% of the total variability, out of which, 81.27% variability can be explained by PC1, while PC2 contributed 10.04% of the total variability. All the variables were positively correlated; among them, the fungal and actinobacterial count significantly contributed to PC1. While other variables, such the urease activity, bacterial and cellulose degrading microbial count and alkaline phosphatase and dehydrogenase enzyme activities, significantly contributed to the PC2 variability. The soil microbiological properties, as examined by the impact of long-term CT and ZT practices using the principal component analysis, concluded that acid and alkaline phosphatase and soil organic carbon were positively affected by ZT [64]. Similarly, as depicted in the PCA biplots, it is also concluded that zero tillage with a 100% residue retention significantly contributed (>50%) to PC1 for most of the variables [65].

4. Conclusions

The outcome of the current investigation revealed that the long-term adoption of different straw management techniques marked favorable variations in organic carbon and its fractions, microbial and enzymatic properties and subsequently improved the wheat production. The microbial population and enzyme activities were higher at zero tillage, as associated with traditional tillage, because of the accumulation of organic matter, which acts as food for microflora to thrive on. Irrespective of this, adopting residue handling practices significantly increased the organic carbon content and its fractions in the R–W system. Most of the analyzed properties were positively correlated, except for the bulk density. Furthermore, the soil enzymes (cellulase and dehydrogenase) were positively impacted by the formation of all the labile organic carbon fractions. This study identified that long-term residue management techniques play a pivotal role in enhancing the microbial population, enzyme activities, with the co-benefits of an improved carbon sequestration in soil, and the building-up/restoring the overall soil health.

Supplementary Materials

The following supporting information can be downloaded at: https://www.mdpi.com/article/10.3390/agriculture12101733/s1, Table S1: Details of field treatments applied under puddled transplanted rice-wheat cropping system, Table S2: Effect of different straw management practices on soil bulk density (g cm−3), soil organic carbon (SOC), total organic carbon (TOC) and various carbon fractions of soil sampled at three successive depths at harvest of wheat in rice-wheat cropping system.

Author Contributions

Conceptualization, data curation, methodology, formal analysis and writing—original draft, R.K.G., H.H. and A.K.; project administration and supervision, J.S.K., J.K., P.K.S. and A.S.; funding acquisition and writing—review and editing, A.A., A.Z.D. and M.A.M. All authors have read and agreed to the published version of the manuscript.

Funding

This research was financially supported by the Deanship of Scientific Research, King Saud University through Vice Deanship of Scientific Research Chairs; Research Chair of Prince Sultan Bin Abdulaziz International Prize for Water.

Institutional Review Board Statement

Not applicable.

Informed Consent Statement

Not applicable.

Data Availability Statement

The data presented in this study are available on request from the corresponding author.

Acknowledgments

The authors extend their appreciation to the Deanship of Scientific Research, king Saud University for funding through Vice Deanship of Scientific Research Chairs; Research Chair of Prince Sultan Bin Abdulaziz International Prize for Water.

Conflicts of Interest

The authors declare no conflict of interest.

References

  1. FAOSTA. 2018. Available online: Thttp://www.fao.org/faostat/en/#data/QC (accessed on 14 November 2021).
  2. Kumari, M.; Chakraborty, D.; Gathala, M.K.; Pathak, H.; Dwivedi, B.S.; Tomar, R.K.; Garg, R.N.; Singh, R.; Ladha, J.K. Soil aggregation and associated organic carbon fractions as affected by tillage in a rice-wheat rotation in North India. Soil Sci. Soc. Am. J. 2011, 75, 560–567. [Google Scholar] [CrossRef]
  3. Humphreys, E.; Kukal, S.S.; Christen, E.W.; Hira, G.S.; Singh, B.; Yadav, S.; Sharma, R.K. Halt in the groundwater decline in north-west India: Which crop technologies will be winner. Adv. Agron. 2010, 109, 155–217. [Google Scholar]
  4. Yadvinder-Singh; Kukal, S.S.; Jat, M.L.; Sidhu, H.S. Iproving water productivity of wheat-based cropping systems in South Asia for sustained productivity. Adv. Agron. 2014, 127, 157–258. [Google Scholar]
  5. Hayashi, K.; Ono, K.; Kajiura, M.; Sudo, S.; Yonemura, S.; Fushimi, A.; Saitoh, K.; Fujitani, Y.; Tanab, K. Trace gas and particle emissions from open burning of three cereal crop residues: Increase in residue moistness enhances emissions of carbon monoxide methane and particulate organic carbon. Atmos. Environ. 2014, 95, 36–44. [Google Scholar] [CrossRef]
  6. Lohan, S.K.; Ram, T.; Mukesh, S.; Ali, M.; Arya, S. Sustainability of biodiesel production as vehicular fuel in Indian perspective. Renew. Sustain. Energy Rev. 2013, 25, 251–259. [Google Scholar] [CrossRef]
  7. Jain, N.; Bhatia, A.; Pathak, H. Emission of air pollutants from crop residue burning in India. Aerosol. Air Qual. Res. 2014, 14, 422–430. [Google Scholar] [CrossRef] [Green Version]
  8. Shafie, S.M. A review on paddy residue-based power generation: Energy, environment and economic perspective. Renew. Sustain. Energy Rev. 2013, 59, 1089–1100. [Google Scholar] [CrossRef]
  9. Ladha, J.K.; Yadvinder-Singh; Erenstein, O.; Hardy, B. Integrated Crop and Resource Management in the Rice–Wheat System of South Asia; International Rice Research Institute Los Banos: Laguna, Philippines, 2009; p. 395. [Google Scholar]
  10. Van Soest, P.J. Rice straw, the role of silica and treatments to improve quality. Anim. Feed Sci. Technol. 2006, 130, 137–171. [Google Scholar] [CrossRef]
  11. Kaur, A. Crop Residue in Punjab Agriculture-Status and Constraints. J. Krishi Vigyan 2017, 5, 22. [Google Scholar] [CrossRef]
  12. Gupta, P.K.; Sahai, S.; Singh, N.; Dixit, C.K.; Singh, D.P.; Sharma, C.; Tiwari, M.K.; Gupta, R.K.; Garg, S.C. Residue burning in rice–wheat cropping system: Causes and implications. Curr. Sci. 2004, 87, 1713–1717. [Google Scholar]
  13. Ramanathan, V.; Carmichael, G. Global and regional climate changes due to black carbon. Nat. Geosci. 2008, 1, 221–227. [Google Scholar] [CrossRef]
  14. Mandal, K.G.; Misra, A.K.; Kuntal, M.H.; Bandyopadhyay, K.K.; Ghosh, P.K.; Mohanty, M. Rice residue Management options and effects on soil properties and crop productivity. Food Agric. Environ. 2004, 2, 224–231. [Google Scholar]
  15. Sidhu, B.S.; Beri, V. Experience with managing rice residue in intensive rice-wheat cropping system in Punjab. In Conservation Agriculture-Status and Prospects; Abrol, I.P., Gupta, R.K., Malik, R.K., Eds.; Centre for Advancement of Sustainable Agriculture (CASA): New Delhi, India, 2005; pp. 55–63. [Google Scholar]
  16. Raza, M.H.; Abid, M.; Faisal, M.; Yan, T.; Akhtar, S.; Adnan, K.M.M. Environmental and Health Impacts of Crop Residue Burning: Scope of Sustainable Crop Residue Management Practices. Int. J. Environ. Res. Public Health 2022, 19, 4753. [Google Scholar] [CrossRef]
  17. Bhuvaneshwari, S.; Hettiarachchi, H.; Meegoda, J.N. Crop Residue Burning in India: Policy Challenges and Potential Solutions. Int. J. Environ. Res. Public Health 2019, 16, 832. [Google Scholar] [CrossRef] [PubMed]
  18. Yadvinder-Singh; Bijay-Singh; Ladha, J.K.; Khind, C.S.; Khera, T.S.; Bueno, C.S. Effects of residue decomposition on productivity and soil fertility in rice–wheat rotation. Soil Sci. Soc. Am. J. 2004, 68, 854–864. [Google Scholar] [CrossRef]
  19. Zhang, Y.; Zhang, G.Q.; Tang, Z.H.; Chen, X.H.; Yu, Y.S. Burning straw air pollution and respiratory infections in China. Am. J. Infect. Control 2014, 42, 81–87. [Google Scholar] [CrossRef]
  20. Mandal, B.; Majumder, B.; Bandopadhyay, P.K.; Hazra, G.C.; Gangopadhyay, A.; Samantaroy, R.N.; Misra, A.K.; Chowdhuri, J.; Saha, M.N.; Kundu, S. The potential of cropping systems and soil amendments for carbon sequestration in soils under long-term experiments in subtropical India. Glob. Chang. Biol. 2007, 13, 357–369. [Google Scholar] [CrossRef]
  21. Soriano-Disla, J.M.; Janik, L.J.; Viscarra-Rossel, R.A.; Macdonald, L.M.; McLaughlin, M.J. The performance of visible near and mid-infrared reflectance spectroscopy for prediction of soil physical chemical and biological properties. Appl. Spectrosc. Rev. 2014, 49, 139–186. [Google Scholar] [CrossRef]
  22. Kwiatkowska-Malina, J. Qualitative and quantitative soil organic matter estimation for sustainable soil management. J. Soils Sediments 2018, 18, 2801–2812. [Google Scholar] [CrossRef] [Green Version]
  23. He, Y.T.; He, X.H.; Xu, M.G.; Zhang, W.J.; Yang, X.Y.; Huang, S.M. Long-term fertilization increases soil organic carbon and alters its chemical composition in three wheat-maize cropping sites across Central and South China. Soil Tillage Res. 2018, 177, 79–87. [Google Scholar] [CrossRef]
  24. Bera, T.; Sharma, S.; Thind, H.S.; Yadvinder-Singh; Sidhu, H.S.; Jat, M.L. Soil biochemical changes at different wheat growth stages in response to conservation agriculture practices in rice-wheat system of north-western India. Soil Res. 2017, 56, 91–401. [Google Scholar] [CrossRef]
  25. Jat, H.S.; Datta, A.; Sharma, P.C.; Kumar, V.; Yadav, A.K.; Choudhary, M.; Choudhary, V.; Gathala, M.K.; Sharma, D.K.; Jat, M.L.; et al. Assessing soil properties and nutrient availability under conservation agriculture practices in a reclaimed sodic soil in cereal-based systems of North-West India. Arch. Agron. Soil Sci. 2018, 64, 531–645. [Google Scholar] [CrossRef] [PubMed] [Green Version]
  26. Finkenbein, P.; Meschke, K.; Kuka, K.; Klotz, S.; Heilmeier, H. Soil enzyme activities as bioindicators for substrate quality in revegetation of a subtropical coal mining dump. Soil Biol. Biochem. 2013, 56, 87–89. [Google Scholar] [CrossRef]
  27. Bhowmik, A.; Fortuna, A.M.; Cihacek, L.; Bary, A.; Carr, P.M.; Cogger, C.G. Potential carbon sequestration and nitrogen cycling in long term organic management systems. Renew. Agric. Food Syst. 2017, 32, 498–510. [Google Scholar] [CrossRef]
  28. Nandi, N.; Rahman, F.H.; Sinha, N.B.; Hajra, J.N. Compatibility of lignin-degrading and cellulose decomposing fungi during decomposition of rice straw. J. Indian Soc. Soil Sci. 2000, 48, 387–389. [Google Scholar]
  29. Blake, G.R.; Hartge, K.H. Bulk density. In Methods of Soil Analysis, Part 1, Physical and Mineralogical Methods, Monograph 9; Klute, A., Ed.; ASA: Madison, WI, USA, 1986; pp. 363–367. [Google Scholar]
  30. Kemper, W.D.; Rosenau, R.C. Aggregate stability and size distribution. In Methods of Soil Analysis. Part 1, Physical and Mineralogical Methods; Klute, A., Campbell, G.S., Jackson, R.D., Mortland, M.M., Nielson, D.R., Eds.; ASA and SSSA: Madison, WI, USA, 1986; pp. 425–442. [Google Scholar]
  31. Walkley, A.; Black, C.A. An examination of the degtjareff method for determining soil organic matter and a proposed modification of the chromic acid titration method. Soil Sci. 1934, 37, 27–38. [Google Scholar]
  32. Snyder, J.D.; Trofymow, J.A. A rapid accurate wet oxidation diffusion procedure for determining organic and inorganic carbon in plant and soil samples. Commun. Soil Sci. Plant Anal. 1984, 15, 587–597. [Google Scholar] [CrossRef]
  33. Chan, K.Y.; Bowman, A.; Oates, A. Oxidizable organic carbon fractions and soil quality changes in an oxicpaleustalf under different pasture leys. Soil Sci. 2001, 166, 61–67. [Google Scholar] [CrossRef]
  34. Blair, G.J.; Lefroy, R.D.B.; Lisle, L. Soil carbon fractions based their degree of oxidation and the development of a carbon management index for agricultural systems. Aust. J. Agric. Res. 1995, 46, 1459–1466. [Google Scholar] [CrossRef]
  35. Vance, E.D.; Brookes, P.C.; Jenkinson, D.S. An extraction method for measuring soil microbial biomass carbon. Soil Biol. Biochem. 1987, 19, 703–707. [Google Scholar] [CrossRef]
  36. Jenkinson, D.S.; Powlson, D.S. The effects of biocidal treatments on metabolism in soil-V: A method for measuring soil biomass. Soil Biol. Biochem. 1976, 8, 209–213. [Google Scholar] [CrossRef]
  37. Casida, L.E.; Klein, D.A.K.; Santoro, T. Soil dehydrogenase activity. Soil Sci. 1964, 98, 371–376. [Google Scholar] [CrossRef]
  38. Tabatabai, M.A.; Bremner, J.M. Use of p-nitrophenyl phosphate for assay of soil phosphatase activity. Soil Biol. Biochem. 1969, 1, 301–307. [Google Scholar] [CrossRef]
  39. Bremner, J.M.; Douglas, L.A. Inhibition of urease activity in soils. Soil Biol. Biochem. 1971, 3, 297–307. [Google Scholar] [CrossRef] [Green Version]
  40. Zhou, G.X.; Wei, F.; Qiu, X.W.; Xu, X.F.; Zhang, B.; Guo, M. Influence of enhanced ultraviolet-B radiation during rice plant growth on rice straw decomposition with nitrogen deposition. Sci. Rep. 2018, 8, 14512. [Google Scholar] [CrossRef] [Green Version]
  41. Lal, R. No tillage effects on soil properties under different crops in western Nigeria Proceedings. Soil Sci. Soc. J. 1976, 40, 762–768. [Google Scholar] [CrossRef]
  42. Costa, O.Y.A.; Raaijimakers, J.; Mkuramae, E.E. Microbial extracellular polymeric substances: Ecological function and impact on soil aggregation. Front. Microbiol. 2018, 9, 1636. [Google Scholar] [CrossRef] [PubMed] [Green Version]
  43. Sosulski, T.; Korce, M. Effects of different mineral and organic fertilization on the content of nitrogen and carbon in soil organic matter fractions. Ecol. Chem. Eng. A 2011, 18, 601–608. [Google Scholar]
  44. Li, S.; Zhang, S.; Pu, Y.; Li, T.; Xu, X.; Jia, Y.; Gong, G. Dynamics of soil labile organic carbon fractions and C-cycle enzyme activities under straw mulch in Chengdu Plain. Soil Tillage Res. 2016, 155, 289–297. [Google Scholar] [CrossRef]
  45. Parihar, C.M.; Parihar, M.D.; Sapkota, T.B.; Nanwal, R.K.; Singh, A.K.; Jat, S.L.; Nayak, H.S.; Mahala, D.M.; Singh, L.K.; Kakraliya, S.K.; et al. Long-term impact of conservation agriculture and diversified maize rotations carbon pools and stocks mineral nitrogen fractions and nitrous oxide fluxes in Inceptisoils of India. Sci. Total Environ. 2018, 640, 1382–1392. [Google Scholar] [CrossRef]
  46. Yadav, G.S.; Babu, S.; Das, A.; Datta, M.; Mohapatra, K.P.; Singh, R.; Singh, V.K.; Rathode, S.S.; Chakraborty, M. Productivity soil health and carbon management index of Indian Himalayan intensified maize-based cropping systems under live mulch-based conservation tillage practices. Field Crop. Res. 2021, 264, 1080–1090. [Google Scholar] [CrossRef]
  47. Singh, R.K.; Sharma, G.K.; Kumar, P.; Singh, S.K.; Singh, R. Effect of crop residues management on soil properties and crop productivity of rice-wheat system in inceptisols of seemanchal region of Bihar. Br. J. Appl. Sci. Technol. 2019, 37, 1–6. [Google Scholar] [CrossRef] [Green Version]
  48. Bobby, L. Fungi ecosystems and global change. In The Fungi; Academic Press: Cambridge, MA, USA, 2016; pp. 361–400. [Google Scholar]
  49. Ghosh, P.K.; Das, A.; Saha, R.; Kharkrang, E.; Tripathy, A.K.; Mundu, G.C.; Ngachan, S.V. Conservation agriculture towards achieving food security in noth east India. Curr. Sci. 2010, 99, 915–921. [Google Scholar]
  50. Kader, M.A.; Senge, M.; Mojid, M.A.; Ito, K. Recent advances in mulching material and methods for modifying soil environment. Soil Tillage Res. 2017, 168, 155–166. [Google Scholar] [CrossRef]
  51. Xiao, S.; You, H.; You, W.; Liu, J.; Cai, C.; Wu, J.; Ji, Z.; Zhan, S.; Hu, Z.; Zhang, Z. Rhizosphere and bulk soil enzyme activities in a Nothotsugalongibracteata forest in the Tianbaoyan National Nature Reserve Fujian Province. China J. For. Res. 2016, 28, 521–528. [Google Scholar]
  52. Heidari, G.; Mohammadi, K.; Sohrabi, Y. Responses of soil microbial biomass and enzyme activities to tillage and fertilization systems in soybean (Glycine max L.) production. Front. Plant Sci. 2016, 7, 1730. [Google Scholar] [CrossRef] [Green Version]
  53. Bhatt, B.; Chandra, R.; Ram, S.; Pareek, N. Long-term effects of fertilization and manuring on productivity and soil biological properties under rice (Oryza sativa)–wheat (Triticum aestivum) sequence in Mollisols. Arch. Agron. Soil Sci. 2016, 62, 109–122. [Google Scholar] [CrossRef]
  54. Kesarwani, A.; Shukla, R.; Singh, V.P.; Pandey, D.S.; Pramanick, B.; Yadav, S.K.; Rani, M. In-situ rice residue management under rice-wheat cropping system and their influence on wheat productivity. J. Pharmacogn. Phytochem. 2017, 6, 1422–1425. [Google Scholar]
  55. Meena, J.R.; Behera, U.K.; Chakraborty, D.; Sharma, A.R. Tillage and residue management effect on soil properties crop performance and energy relations in green gram (Vigna radiate L.) under maize-based cropping systems. Int. Soil Water Conserv. Res. 2015, 3, 261–272. [Google Scholar] [CrossRef] [Green Version]
  56. Madejova, J. FTIR techniques in clay mineral studies. Vib. Spectrosc. 2003, 31, 1–10. [Google Scholar] [CrossRef]
  57. Parikh, S.J.; Mukome, F.N.; Zhang, X. ATR-FTIR spectroscopic evidence for biomolecular phosphorus and carboxyl groups facilitating bacterial adhesion of iron oxides. Colloids Surf. B. Bioinferences 2014, 119, 38–46. [Google Scholar] [CrossRef] [PubMed] [Green Version]
  58. Joussein, E.; Petit, S.; Churchman, J.; Theng, B.; Righi, D.; Delvaux, B. Halloysite clay minerals: A review. Clay Miner. 2005, 40, 383–426. [Google Scholar] [CrossRef]
  59. Cocozza, C.; D’Orazio, V.; Miano, T.M.; Shotyk, W. Characterization of solid and aqueous phases of a peat bog profile using molecular fluorescence spectroscopy ESR and FT- IR and comparison with physical properties. Org. Geochem. 2003, 34, 49–60. [Google Scholar] [CrossRef]
  60. Legodi, M.A.; de Wall, D.; Potgieter, J.H.; Potgieter, S.S. Rapid determination of CaCO3 in mixtures utilising FT-IR spectroscopy. Miner. Eng. 2001, 14, 1107–1111. [Google Scholar] [CrossRef]
  61. Poirier, N.; Sohi, S.P.; Gaunt, J.L.; Mahieu, N.; Randall, E.W.; Powlson, D.S.; Evershed, R.P. The chemical composition of measurable soil organic matter pools. Org. Geochem. 2005, 36, 1174–1189. [Google Scholar] [CrossRef]
  62. Niemeyer, J.; Chen, Y.; Bollag, J.M. Characterization of humic acids composts and peat by diffuse reflectance Fourier-Transform infrared spectroscopy. Soil Sci. Soc. Am. J. 1992, 56, 135–140. [Google Scholar] [CrossRef]
  63. Tivet, F.; Sa, J.C.M.; Lal, R.; Milori, D.M.B.P.; Briedis, C.; Letourmy, P.; Pinheiro, L.A.; Borszowski, P.R.; Hartman, D.C. Assessing humification and organic ompoundsds by laser-induced fluorescence and FTIR spectroscopies under conventional and no-till management Brazilian Oxisoils. Geoderma 2013, 207–208, 71–81. [Google Scholar] [CrossRef]
  64. Mathew, R.P.; Feng, Y.; Githinji, L.; Ramble, A.; Kipling, S. Impact of no-tillage and conventional tillage systems on soil microbial communities. Appl. Environ. Soil Sci. 2012, 54, 8620. [Google Scholar] [CrossRef] [Green Version]
  65. Sharma, S.; Saikia, R.; Thind, H.S.; Yadvinder-Singh; Jat, M.L. Tillage, green manure and residue management accelerate soil carbon pools and hydrolytic enzymatic activities for conservation agriculture based rice-wheat systems. Commun. Soil Sci. Plant Anal. 2021, 52, 470–486. [Google Scholar] [CrossRef]
Figure 1. Alterations in the air quality indices of five consecutive years indicating the rise in the particulate matter content that coincides with the episodes of agro-residue burning in the north-western plains of India. The rectangle represents the incidences of burning of the rice straw residue by the farmers in the region.
Agriculture 12 01733 g001
Figure 2. Alterations in the air quality indices of five consecutive years indicate the rise in the particulate matter content. Bars with same alphabets do not differ significantly (p ≤ 0.05) difference by Duncan’s multiple range test (DMRT).
Agriculture 12 01733 g002
Figure 3. FT-IR spectra of soil samples collected from different straw management practices at various soil depths, (a) 0–15 cm, (b) 15–30 cm and (c) 30–45 cm.
Agriculture 12 01733 g003
Figure 4. Principal component analysis (PCA) for microbiological properties of the soil samples collected from different depths. (a) 0–15 cm, (b) 15–30 cm and (c) 30–45 cm.
Agriculture 12 01733 g004
Table 1. Distribution of MBC (mg kg−1), permanganate oxidizable carbon (mg kg−1), lability index and carbon management index as affected by different straw management practices under the rice–wheat cropping system.
TreatmentsMBC (mg kg −1)KMnO4 Oxidizable C (mg kg−1)KMnO4 Oxidizable C Mg ha−1
(LC)
Non-Labile C Mg ha−1
(NLC)
Carbon Pool Index
(CPI)
Lability of C
(LC/NLC)
Lability Index
(LI)
CMI (CPI × LI × 100)
Soil DepthsSoil Depths
0–1515–3030–450–1515–3030–45
CTW (–R)153.1d82.6c51.7c1208d987b7972.50c18.08c 0.138ab
ZTW (+R)201.9b142.6a84.2a1504b1231a9682.99ab20.66ab1.26b0.145a1.045a131.75b
CTW (+R)184.1c103.3b71.5b1386c1123ab8852.79b19.83abc1.17c0.141a1.023a120.06c
ZTW (+WR)240.2a147.2a81.9a1596a1248a9923.17a21.99a1.37a0.144a1.041a142.26a
TW (RB)152.3d90.3bc54.8c1189d992b8252.44c18.46bc1.05d0.132b0.956b99.98d
Figures in a column followed by the same alphabets do not differ significantly at p ≤ 0.05 as analyzed through Duncan’s multiple range test (DMRT).
Table 2. Distribution of aerobic bacterial, fungal, actinobacterial and cellulose degrading microbial counts and soil enzyme activities for various soil depths as affected by different straw management practices under rice–wheat cropping system.
TreatmentsBacterial Count (10−7)Fungal Count (10−3)Actinobacterial Count (10−4)Cellulose Degrading Microorganisms (10−4)
Soil Depths (cm)
0–1515–3030–450–1515–3030–450–1515–3030–450–1515–3030–45
CTW (–R)0.39e0.14d0.02d22.7d10.3d3.5c36.7d17.7cd3.3c27.9d14.3d3.8d
ZTW (+R)1.53b0.86b0.27a44.7b26.7ab7.9a103.7b39.3b16.7a49.7b29.8b8.4a
CTW (+R)1.06c0.64c0.17c34.3c23.7bc7.4b86.3c31.0c11.9b40.8c24.7c7.5b
ZTW (+WR)1.72a1.18a0.31a54.3a32.1a8.9a111.7a58.7a18.3a54.1a34.8a8.9a
ZTW (RB)0.25d0.18d0.05d20.7d18.3c3.5c23.3e19.3d4.7c22.2e18.4d4.9c
Dehydrogenase Activity
(μg TPF g−1 soil day−1)
Alkaline Phosphatase Activity
(µg PNP formed g−1 soil h−1)
Urease Activity
(μg urea hydrolyzed g−1 of soil h−1)
CTW (–R)4.34e3.39c1.58b22.0c18.6c5.6b3.67b2.821.88
ZTW (+R)6.41b5.43a3.37a31.0b26.1ab13.7a4.40a3.442.28
CTW (+R)5.19c4.61b2.58a28.6bc20.7bc10.3ab4.21a3.332.13
ZTW (+WR)6.78a5.75a3.59a35.5a27.1a15.6a4.68a3.752.46
ZTW (RB)4.76d3.43c1.66b23.1bc19.6c6.2b3.62b2.861.99
Figures in a column followed by the same alphabets do not differ significantly at p ≤ 0.05 as analyzed through Duncan’s multiple range test (DMRT).
Table 3. Influence of different straw management practices on the yield (q ha−1) along with its components for wheat crop in rice–wheat cropping system.
TreatmentsGrain Yield
(q ha−1)
Straw Yield
(q ha−1)
Biological Yield
(q ha−1)
Harvest Index (%)N Content
(%)
N Uptake
(kg ha−1)
P Content
(%)
P Uptake
(kg ha−1)
K Content
(%)
K Uptake
(kg ha−1)
GrainStrawGrainStrawGrainsStrawGrainsStrawGrainsStrawGrainsStraw
CTW (–R)48.5c65.9b114.4c0.431.59b0.281c77.3c18.3c0.250.11112.1c7.1c0.380.88c18.4d57.9c
ZTW (+R)52.9b74.3ab127.2b0.421.70a0.35ab89.8b25.7ab0.280.15114.9b11.2ab0.410.99b21.5b73.2ab
C TW (+R)52.7b71.8ab125.4b0.421.69a0.33abc89.0b23.6b0.280.13514.7b9.6b0.400.96b20.9bc69.2b
Z TW (+WR)57.4a75.4a132.8a0.431.74a0.37a99.8a27.7a0.300.16017.4a12.1a0.421.06a24.1a79.8a
ZTW (RB)51.8bc72.7ab124.5b0.421.63b0.30bc84.3bc21.9b0.260.12413.4bc9.0bc0.380.91c19.5c65.9b
Figures in a column followed by the same alphabets do not differ significantly at p ≤ 0.05 as analyzed through Duncan’s multiple range test (DMRT).
Publisher’s Note: MDPI stays neutral with regard to jurisdictional claims in published maps and institutional affiliations.

