
A Grain Yield Sensor for Yield Mapping with Local Rice Combine Harvester
by
 , ,
, ,
Chaiyan Sirikun
1, 
Grianggai Samseemoung
1,*,
Peeyush Soni
2,
Jaturong Langkapin
1 and
Jakkree Srinonchat
1 1
Agricultural Engineering Department, Faculty of Engineering, Rajamangala University of Technology Thanyaburi (RMUTT), Klong 6, Thanyaburi, Pathumthani 12110, Thailand
2
Agricultural & Food Engineering Department, Indian Institute of Technology Kharagpur, Kharagpur 721302, India
*
Author to whom correspondence should be addressed.
Agriculture 2021, 11(9), 897; https://doi.org/10.3390/agriculture11090897
Submission received: 15 August 2021
/
Revised: 11 September 2021
/
Accepted: 14 September 2021
/
Published: 18 September 2021
(This article belongs to the Special Issue Applications of Electric, Electronics, and Computer Science to Agricultural Machines)
Abstract
:Rice grain yield was estimated from a locally made Thai combine harvester using a specially developed sensing and monitoring system. The yield monitoring and sensing system, mounted on the rice combine harvester, collected and logged grain mass flow rate and moisture content, as well as pertinent information related to field, position and navigation. The developed system comprised a yield meter, GNSS receiver and a computer installed with customized software, which, when assembled on a local rice combine, mapped real-time rice yield along with grain moisture content. The performance of the developed system was evaluated at three neighboring (identically managed) rice fields. ArcGIS® software was used to create grain yield map with geographical information of the fields. The average grain yield values recorded were 3.63, 3.84 and 3.60 t ha−1, and grain moisture contents (w.b.) were 22.42%, 23.50% and 24.71% from the three fields, respectively. Overall average grain yield was 3.84 t ha−1 (CV = 63.68%) with 578.10 and 7761.58 kg ha−1 as the minimum and maximum values, respectively. The coefficients of variation in grain yield of the three fields were 57.44%, 63.68% and 60.41%, respectively. The system performance was evaluated at four different cutter bar heights (0.18, 0.25, 0.35 and 0.40 m) during the test. As expected, the tallest cutter bar height (0.40 m) offered the least error of 12.50% in yield estimation. The results confirmed that the developed grain yield sensor could be successfully used with the local rice combine harvester; hence, offers and ‘up-gradation’ potential in Thai agricultural mechanization.
1. Introduction
Previous researchers [1,2,3,4,5,6,7,8,9,10] have successfully employed GIS application mapping for crop/weed and grain yield recognition and evaluation, and have demonstrated its potential for small holders. In Thailand, rice is cultivated on nearly 9 million ha of land with a productivity average of 2.8 t ha−1 (8.9 million ha and 2.831 t ha−1 in 2019) as per the national statistics [11]. The rice combine harvesters are popular among contractors and are also used by the groups of progressive farmers. The average annual usage of a rice combine harvester is 237.92 ha year−1 [11]. The rate of hiring is 164.42 USD ha−1 and the involved revenue average is 13,119 USD year−1 [11]. The obvious popularity of combine harvesters over manual harvesting amongst the rice farmers in Thailand is due to better time and economic productivity claimed by the former. On average, rice combine harvesting requires only 1.69 h against 283.06 h in manual harvesting a hectare of farm; whereas, it costs 104.78 USD ha−1 as compared to 199.08 USD ha−1 for the manual harvesting method. Thai farmers are increasingly convinced that the use of combine harvesters reduces precious time, cost of production and also lowers the grain losses [12]. Similarly, both the farmers and the custom service providers are becoming increasingly interested in quantifying (mapping) the site-specific grain yield. However, the machine hiring rates are increased when a commercially available grain meter is used, and it is believed to affect the economic attractiveness of the hired machine [13,14]. National statistics suggest a considerable increase in custom hiring rates of rice combines in Thailand, mounting to 164.42 USD ha−1 recently (2019), whereas, it was 108.51 USD ha−1 in 2015, 94.13 USD ha−1 in 2010, 76.05 USD ha−1 in 2005, and 61.65 USD ha−1 in 2000 [11]. On the other hand, the custom service providers are also under pressure to justify the increasing costs by charging only what they have actually harvested from a given field.
Timely estimation of crop yields has always been of interest from scientific as well as management viewpoints. A variety of techniques have been tried and tested; including those that are based on (a) field surveys, (b) remote sensing and (c) crop modelling. Each of these techniques has its own limitations; these commonly include their high cost, poor accuracy under uncertain environments, and requirement of higher technical know-how in order to operate it. The capabilities of an on-ground yield monitoring system can be enhanced with a low-altitude remote sensing (LARS) platforms using drone-mounted camera. This combined system measures the mass flow of granular material through a grain harvester, and plots on geospatial maps for smart management of farms [8,15]. The mass flow measurement typically occurs in the clean grain elevator on a combine. As the mass flow measurements are recorded, geographic coordinates are simultaneously acquired from a global navigation satellite system (GNSS) receiver. Once the data are downloaded from the yield monitoring system, the farmer can generate a yield map that illustrates the spatial variability of the crop yield across the farm. Yield map is an extremely popular tool for management zone determination. Yield monitoring is useful because it allows the farmer to quickly generate a very dense data set detailing corresponding in-field variability, while the operating costs are relatively low and non-recurring [1,3]. Methods of yield estimation using remote-sensing tools usually provide timely and accurate information during the crop growth period; yet, they often need detailed data at frequent time intervals, as well as assumptions on proportion of absorbed photosynthetic radiation, radiation use efficiency and harvest index—which further limit their application over large areas [16]. Whereas, some studies used dedicated yield monitoring systems for head-feeding combines [15] and conducted field evaluation [17].
Other studies used load cell for monitoring grain yield at a harvester [18]. Grain weight was determined by yield sensor in an auxiliary tank located inside the main tank and showed grain flow rate information over the monitor near operator’s seat. However, these systems require considerable skill for controlling the harvester, and consumes excessive non-productive time in clearing the auxiliary tank that eventually limits the harvester’s field performance. Furthermore, it lacks creation of yield maps during harvesting on a real-time basis. In some studies, the grain moisture was also determined to precisely calibrate the yield sensor’s output with its corresponding moisture content [19,20]. In earlier models of yield meters studied, the grains flow rate was estimated by using a small load cell similar to that used on head-feeding combine harvesters to measure the impact force of grain stream as it hits the sensor, and converting this into an electrical signal.
The commercially available fully automated harvesting machines not only require sound technical understanding but are also expensive to adopt by Thai rice farmers. The widely used LARSs (e.g., cameras on a drone) for yield monitoring greatly depend on the surface reflectance of a field, and therefore inherit major limitations to practical use. Convinced by the growing demand of grain yield mapping along with its corresponding moisture content, and the investment constraint of acquiring commercially available yield meters, this research focused on developing a locally adaptive grain yield metering system for Thai combine harvesters. The developed yield meter continuously monitored field data and created a yield map during real-time operation. A compatible software for a precision grain yield sensor is also developed in this research. The developed grain yield meter system is compatible with any local rice combine harvester (RCH). It was assembled on a local harvester and tested for its in-field performance.
2. Materials and Methods
2.1. Experimental Setup and Field Preparation
Experiments were conducted in three different fields of 0.3, 0.4 and 0.5 ha area (14.16° N, 101.49° E). In this research a customized yield meter was developed; it consisted of various sensors such as grain yield flow sensor (Model: Sparkfun FSR406, Pressure Range: 1.5 psi to 150 psi, Force Range: 1N to 100N, Sparkfun Electronics, Niwot, CO, USA), humidity sensor (Sparkfun HIH-4030, analog output, voltage supply: 4–5.5 VDC, Sparkfun Electronics, Niwot, CO, USA), and global navigation satellite system receivers (Model: LS20031, 5 Hz—66 channel, LOCOSYS Technology, Xizhi, New Taipei, Taiwan). The calibration setup for the developed yield meter was controlled by a microcontroller (Model: NI myRIO-1900, Board Xilinx FPGA and dual-core ARM Cortex-A9 processor, 10 analog inputs, 12 bits, 6 analog outputs, 12 bits, National Instruments, Austin, TX, USA) by varying forward speed and reel index, and by measuring corresponding grain flow rate (Figure 1). Actual grain flow through the harvester was also recorded. A locally made self-propelled RCH was used. The calibrated yield meter was installed on the RCH. Grain flow rates were evaluated for variety of underlying factors. Details of the experimental setup are presented in Table 1.
2.2. Rice Grain Yield Mass Meter
Grain flow rate was recorded by the grain yield flow sensor (impact type) assembled at elevator (Figure 1). The impact force measuring plate was mounted on a vertical assembly bracket that was fixed to the elevator body. Analog signals received from the yield flow sensor were filtered, conditioned and converted into digital signals. The data were transferred to the bus nodes (FPGA type: Xilinx Z-7010, Xilinx, San Jose, CA, USA). The microcontroller initialized the system through the bus at start-up phase and read data packets on the bus along with the GNSS signals via a serial port. Data were displayed in real time on the monitor as well as stored in a memory card for off-line use. The material of impact force plate selected was based on the Hall principle.
The yield meter was first calibrated in laboratory (controlled) conditions. GNSS receiver altitude (with respect to ground), width of combine and its offset position were determined for the existing harvester. The RCH was operated in a test field with a left-hand turning loop at the specified engine speed. The speed of operation was calculated by timing a known distance travelled between two specified points. Discharge of grains from RCH over a specified area was collected in a sack. Furthermore, grain yield was also determined from 1 m × 2.5 m frames in adjacent rows.
2.3. Data Acquisition Module Design
National Instruments’ NI® CompactRIO® (Austin, TX, USA) platform was used for designing this customized data acquisition module. The board contains a proprietary chip (SoC) technology from Xilinx® (San Jose, CA, USA) consisting of ARM Cortex®-A9 (Cambridge, England) processor and a field-programmable gate array (FPGA)—programmable logic cells, and powered by the NI® LabVIEW® (Austin, TX, USA) environment. NI® myRIO® (Austin, TX, USA) was selected as the CPU for data acquisition module of the rice grain yield flow meter. The module mainly contains a power and A/D converter, signal acquisition circuit, and LabVIEW® RT® (Austin, TX, USA) bus communication circuit. Figure 2 outlines the data acquisition module structure. Firstly, yield sensor signal, elevator sensor signal and GNSS signal were fed into NI® myRIO® (Austin, TX, USA) board, and then each sensor signal was converted into digital signal. Subsequently, the collected data were sent to the terminal output monitor system by FPGA bus communication software for post-processing and display. The developed data acquisition module was encapsulated in waterproof and dustproof housing to enhance the robustness and reliability of the system.
2.4. Rice Grain Yield Flow Sensor Software Design
After the software functional requirement analysis, grain yield monitoring system software was designed based on the Stream File® and VS® 2010. The created software included a data display module, FPGA data processing module, data storage module, and General Packet Radio Service (GPRS) wireless transmission module. The developed software had the function of revealing sensor detecting state, facilitating sensor output calibration, displaying output data in real time and indicating information on harvest storage. The overall structure of created software function is shown in Figure 3.
2.5. GNSS Receiver
A GNSS receiver (SparkFun model: LS20031 5 Hz—66 channel, Niwot, CO, USA) collected signals from various satellites accessible on the go to determine the RCH position, and this information was subsequently used to show the harvester movement. This receiver was mounted on the harvester cabin.
In order for the harvester to follow the planned route, two factors were controlled: (a) RCH’s way-point position and (b) heading angle of the RCH. Hence, the control encompassed two loops following the articulating process. The first loop controlled the harvester’s way-point position, where the distance error was calculated by using Equation (1). The second loop controlled the heading angle of the RCH, for which the error was calculated by using Equation (2) [21].
where xref and yref are the reference positions of the RCH’s movement route on x- and y-axes, respectively; xact, yact and θact are the actual position of the harvester on x-axis, y-axis and actual heading angle, respectively. The distance and heading errors were used as input for the program. The output signal was expressed as velocity of the driving wheels and the RCH’s heading angle, which subsequently was the input signal for kinematic model.
2.6. Field Moisture Sensor
Yield and moisture data were needed simultaneously to obtain an accurate yield estimated. A conductive-shell type sensor (SparkFun Humidity Sensor, HIH-4030, Analog output, Voltage supply: 4–5.5 VDC, Niwot, CO, USA) was mounted on the rice grain elevator. As yield rises to the elevator, a small portion flows to the top of the sensor and moved. This sensor estimated the moisture based on the dielectric properties of the harvested rice. Seeds with different moisture contents affect the difference of capacity between two metal surfaces. The sensor was calibrated with the moisture content for the given rice variety.
2.7. Data Junction Box
A data recording unit was installed in the junction box that compiled the data from the rice grain meter, moisture sensor and GNSS. It also collated the information on cutting width and forward speed of the combine. Cutting width is the constant value for the chosen RCH model. Plantation information, crop type, reel speed and field-specific correction factor were keyed in in the junction box. The assembly was securely housed inside an all-weather container.
2.8. Field Computer
A notebook computer was assembled at the operator’s cabin in RCH and it received output data from different sensors for displaying and logging for later use. The field computer also supported various interfaces including the GNSS receiver interface, the interactive control interface and the graphical user interface. External data storage devices were plugged into it. This field computer facilitated key functions such as integration and calibration of various sensors, real-time computation and notification of forward speed and moisture content, and it also updated the rice grains yield per hectare while the harvester was in operation at different fields.
2.9. Geostatistical Analysis and Mapping
For geostatistical analysis, the inverse distance weighted (IDW) interpolation algorithm was used to determine cell values using a linearly weighted combination of a set of sample points. The weight was a function of inverse distance. The surface being interpolated should be that of a locationally dependent variable.
Field images were acquired by a drone platform along with the GPS output simultaneously. The plot-based images taken from the drone camera, obtained manually by surveying, were combined following the method proposed in [7]. The excess areas beyond the ground margins were also masked and trimmed, and altitude corrections were performed for the images before they were mapped. The true ground coordinates used for the reference points were used to combine all of images into a matrix, and a combined image was constructed. The final land image was then used for further analysis by converting it into GIS map layers using the ArcGIS software.
2.10. Field Test of the Developed Yield Meter
The RCH, equipped with the developed yield meter, was taken to a farm for harvesting rice crop. For the initial setup, the width of the cutter bar was adjusted to 1.85 m. In a field test, the system was fine-tuned until each module/sensor performed as intended. The specifically created software was installed on the field computer, which displayed actual rice flow rate (t ha−1) along with grain moisture information (%wet basis) on a real-time basis. Yield maps were generated and the data of grain yield were saved into the memory of a hard disk drive. Performance of the created software and the corresponding hardware was assessed by computing difference between actual yield (obtained manually by surveying) and the measured yield from the yield meter at different patches of the farm. The grain flow rate at different locations of the field was mapped using ArcGIS®. Forward speed (m s−1), reel speed (m s−1) and yield sensor output were monitored at 6.7 kg m−2 average specific rice density, 1500 rpm engine speed, 25% average moisture content, and 15-degree angle of yield auger. An average cutter bar height (m) and yield sensor output (kg s−1), at 1.16 m rice crop height with 25% average moisture content, were also determined.
Administration of various processes by the developed software is summarized with a flowchart, as shown in Figure 4. Impact sensor of the yield meter sensed the impact pulses per second and the software used a pre-calibrated model to interpret corresponding grain flow rate. Speed sensor reported the RCH’s forward motion, which was displayed on a monitor. During field tests, all hardware and software performed as expected.
3. Results and Discussion
The developed system included a grain flow rate meter, moisture sensor, GNSS receiver and computer, which was controlled using a specifically created software. The system was assembled on a local RCH for determination of real-time grain flow rate related to moisture content. Major components of the developed system were evaluated during the field test. The operator could monitor the grain yield in real time. The system also offers the option to store and map the variability along with geo-spatial attributes of the field.
The developed monitoring system recorded the working rate (ha h−1), specific rice yield (kg m−2), forward speed (m s−1), yield (t ha−1), overall land coverage (ha), total weight of storage tank (t), forward linear distance travelled (m), reel speed (m s−1) and operating speed (m s−1). For calibration, the RCH was positioned on leveled ground. Empty weight of the grain elevator was noted and used for setting up tare value. The RCH was operated at different engine speeds. Error value was calculated between derived weight and reference weight by the grain flow rate measurement, as well as the instantaneous yield, which were used for deducing calibration factors. During laboratory trials, the estimated yield (kg s−1) and angle of yield auger (degree) variations with different grain flows (kg s−1) were also determined as presented in Table 2.
3.1. Performance of the Developed Yield Meter
The deviation between the reference mass flow rate and the derived mass flow rate from yield meter is regressed against the derived flow rate (Figure 5 and Figure 6). The obtained model (R2 = 0.878) showed logarithmically increasing error beyond/before a certain flow rate. Therefore, a dynamic correction factor was used in the software, corresponding to the sensor output. The error is due to the total weight correction at relatively low flow rates. In contrast, the maximum flow at 100% is a continuous indicator of rice grain weight.
Cumulative rice grains fed (known as input) were compared with grain flow rate meter output under the test rig. The grain flow rates from the grain hopper were set to the known average values of 0.4 kg s−1, 0.6 kg s−1, 0.8 kg s−1 and 1.0 kg s−1. The weighing hopper was averaged for 60 s to determine the grain flow rate. Grain rates evaluated were 0.333 kg s−1, 0.489 kg s−1, 0.655 kg s−1 and 0.759 kg s−1. Dynamic correction factor was used, and reliability of the yield meter was assessed at different yield values. The grain flow rate measurement inaccuracies by the grain flow rate meter were noted as 18.78%, 19.83%, 20.12% and 25.58% for each input flow rate, respectively. The result of grain flow rates of 0.4 kg s−1, 0.6 kg s−1, 0.8 kg s−1 and 1.0 kg s−1 were estimated as 20.16 (kg/s) s−1, 29.88 (kg/s) s−1, 39.12 (kg/s) s−1 and 49.92.16 (kg/s) s−1, respectively.
3.2. Effect of Grain Flow Rate and Yield Auger’s Inclination on Performance of Yield Meter
Performance of the yield meter was assessed by varying grain flow rate at different inclinations of the yield auger. The grain flow rate from the grain hopper was varied by setting flow rates from 0.4 to 1.0 kg s−1, at 0.2 kg s−1 intervals. The actual input flow rates, however, were determined at the outlet itself to account for propagating error due to sensor uncertainty. The corresponding yield flow rate values were recorded from the yield meter’s output. Error in the yield measurement was calculated for each combination of known input and the yield meter’s output. It can be clearly shown that the yield meter performed consistently at different auger inclinations. However, the error increased with increasing flow rates (Figure 7).
3.3. Effect of Machine Setting on Performance of Yield Meter
Performance of the yield meter was evaluated at different machine setting conditions in the field. Grain loss (%) values obtained for different known grain moisture content feed (expressed as % wet basis), at two engine speeds (1500 and 1800 rpm). For this test, field plots of 6.7 kg m−2 crop density were used. As shown in Figure 8, significantly greater grain loss corresponds to high engine speed. Furthermore, 25% (w.b.) moisture content resulted in comparatively lower grain loss. Therefore, the RCH was operated at 1500 rpm engine speed, 25% (w.b.) moisture content and approximate reel index value of 1.2 for further field trails to assess the developed yield meter performance.
Similarly, the effect of the cutter bar height (varied between 0.18–0.4 m) on the yield meter performance was evaluated in field. The RCH was operated at 1500 rpm engine speed and 1.2 reel index to harvest average 1.16 m tall rice plants having about 25% (w.b.) average moisture content. The results of percent error from the comparison between actual grain flow rate and yield sensor meter output are presented in Table 3, at different cutter bar heights. Cutter bar height of 0.40 m corresponds to a relatively smaller percent error of 12.50% in yield meter performance.
3.4. Yield Range and Moisture Content Mapping
Rice grain yield variability along with moisture content information for three rice farms were processed in GIS application. Rice grain yield (t ha−1) and moisture content (w.b.) for the three farms (0.3 ha, 0.4 ha and 0.5 ha crop coverage) were measured by using the developed grain yield meter mounted on the RCH. In-field variability is summarized in Table 4 and mapped in Figure 9. Interestingly, it can be observed that even for the smallest field of 0.3 ha, the variability was 1.9 t ha−1. For yield-based custom charges, the tariff negotiation between the service provider and the farmer would have been on the basis of simple average (based on few data points on the field); however, with the use of precision grain yield meter, now a weighted average yield value could be used, making it more closely represent the field variability. Generally, when the moisture of the cereal decreases, the combine work efficiency increases, however, the rate of grain loss in the header rises too [22].
3.5. Rice Grain Flow Rate with Moisture Content in Plantation 1
Figure 9 maps the rice grain yield and the moisture content variability within a 0.3 ha field. Field no.1 (14.06543° N, 100.63830° E) with 0.3 ha was harvested by RCH equipped with a grain flow rate meter. About 7% (0.022 ha) produced in the range of 1–2 t ha−1 (grain flow rate 1.89 t ha−1 and 22.43% average moisture content). About 10% (0.031 ha) area was in the range of 2–3 t ha−1 (grain flow rate 2.78 t ha−1 and 22.47% average moisture content). In the category of over 6 t ha−1, there was 83.3% of the field, which produced the maximum yield with an average grain flow rate range of 6.36 t ha−1 and 22.35% moisture content. The simple average grain flow rate range in plantation no.1 was 3.68 t ha−1, whereas its weighted average grain flow rate was 5.70 ± 1.92 t ha−1.
3.6. Rice Grain Flow Rate with Moisture Content in Plantation 2
Rice grain flow rate and moisture content variability within area 0.4 ha are displayed in Figure 10. Field no.2 (14.07038° N, 100.64344° E) was harvested by the same RCH with grain flow rate meter. Below 1000 kg ha−1 grain flow rate range about 6% (0.024 ha) area yielded 578.10 kg ha−1 at 22.95% average moisture content. About 10% (0.04 ha) area was in the range of 1000–2000 kg ha−1 with 1809.36 kg ha−1 average grain flow rate and 22.41% moisture content. About 18% (0.072 ha) area produced 5742.15 kg ha−1 at 24.21% moisture content. For the category of over 6000 kg ha−1, there was 66.5% of the field, which produced the maximum yield with an average grain flow rate range of 7761.6 kg ha−1 and 22.35% moisture content. The simple average grain flow rate range in plantation no.2 was 3972.8 kg ha−1, whereas its weighted average grain flow rate was 6392.4 ± 2902 kg ha−1.
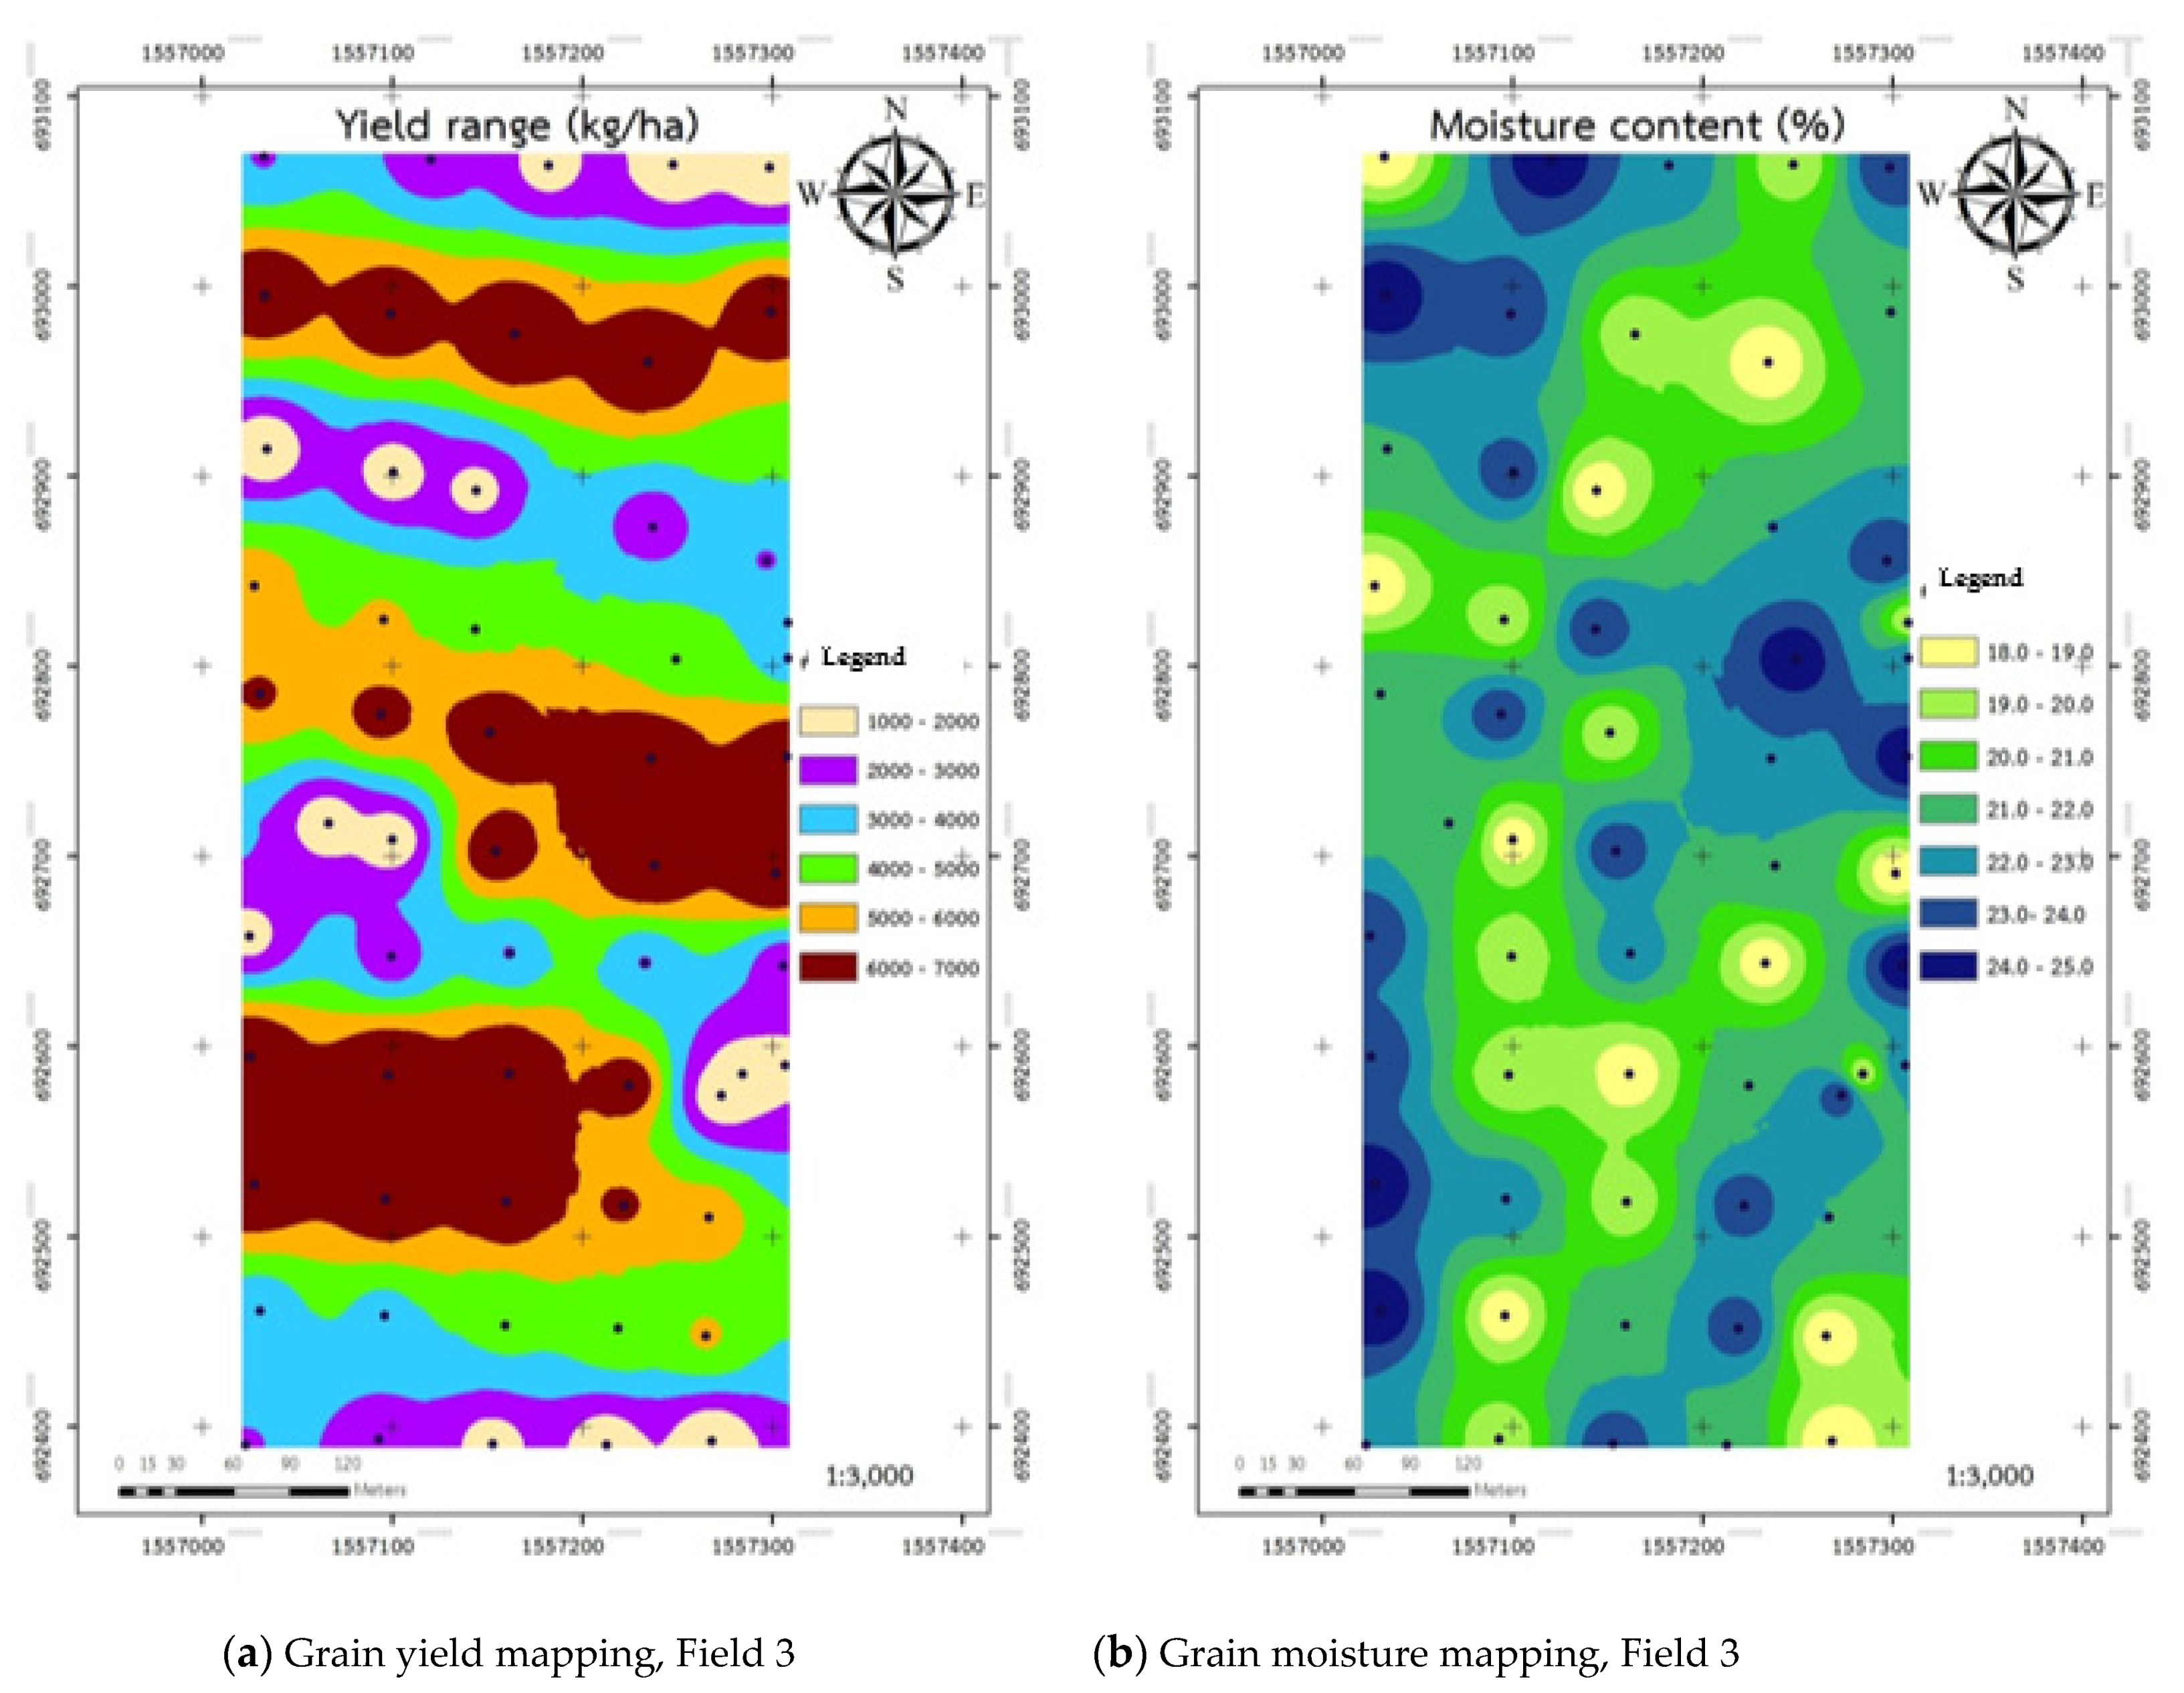
3.7. Rice Grain Flow Rate with Moisture Content in Plantation 3
Rice grain flow rate and moisture content variability within area 0.5 ha (Field no.3 14.07573° N, 100.65124° E) are displayed in Figure 11. Below 1000 kg ha−1 grain flow rate of about 5% (0.025 ha) area yielded 591.1 kg ha−1 at 24.58% average moisture content. About 25% (0.125 ha) area was in the range of having above 6000 kg ha−1 productivity with 6752.60 kg ha−1 average grain flow rate and 25.36% moisture content. About 70% (0.36 ha) area produced 7163.2 kg ha−1 at 24.21% moisture content. The simple average grain flow rate range in plantation no.3 was 4835.6 kg ha−1, whereas its weighted average grain flow rate was 6740.4 ± 3006 kg ha−1.
Among various factors causing this variability, the key factors could be rice germination, variations in harvester speed, cutter bar height and reel index, especially during setting up the machine, land slope and the size of field. Furthermore, previous researchers have also conformed the final yield data from combine harvester using the corresponding satellite images from a vegetation season, and have concluded that the former can be used to predict yield and to assess site-specific zone productivity [22,23].
4. Conclusions
The commercially available fully automated harvesting machines not only require sound technical understanding but are also expensive to adopt for Thai rice farmers. The widely used LARSs (e.g., cameras on drone) for yield monitoring largely depend on the surface reflectance of a field, and therefore inherit major limitations. The grain yield sensor for RCH was developed and tested for precise operation of the real-time yield meter. The developed system, comprising a grain flow rate meter, moisture sensor, GNSS receiver and computer along with the created software, was assembled on a local RCH for determination of real-time grain flow rate related to moisture content. All the components of the developed system performed as intended during the field test. The operator could monitor the grain yield in real time. The system also offers storing and mapping the variability along with geo-spatial attributes of the field. The developed grain yield meter system is compatible with any local RCH. It was assembled on a local harvester and tested for its in-field performance. In-field variability was notably high when recorded with the developed grain flow meter, which demonstrated the worth of this system over the conventional average yield computation. The field variability increased as expected, with the field size tested. Grain yield flow measurement technique could be used to increase the precision of harvesting operation and input management in subsequent cropping cycles.
Major limitations of this system include dependency on the operator’s response time in adjusting and maneuvering the controls to fine-tune the combine’s operation in response to the real-time yield prediction. The system could, however, be improved by adding automatic feedback control of vital combine operating parameters, e.g., reel speed, forward speed, cutter bar height, etc.
Author Contributions
Conceptualization, C.S., G.S. and P.S.; methodology, G.S.; software, G.S. and J.L.; formal analysis, G.S.; data curation, C.S., G.S., J.L. and J.S.; writing—original draft preparation, G.S.; writing—review and editing, G.S. and P.S. All authors have read and agreed to the published version of the manuscript.
Funding
This research was funded by RMUTT Annual Government Statement of Expenditure 2018.
Institutional Review Board Statement
Not applicable.
Informed Consent Statement
Informed consent was obtained from all subjects involved in the study.
Data Availability Statement
Rajamangala University of Technology Thanyaburi.
Acknowledgments
The research team acknowledges the RMUTT Annual Government Statement of Expenditure-2018 for providing research funds, equipment and personnel. However, the results presented herein not necessarily always reflect the opinion/view of the Rajamangala University of Technology Thanyaburi and/or the Thai Government).
Conflicts of Interest
The authors declare no conflict of interest.
References
- Campos, I.; González-Gómez, L.; Villodre, J.; Calera, M.; Campoy, J.; Jiménez, N.; Plaza, C.; Sánchez-Prieto, S.; Calera, A. Mapping within-field variability in wheat yield and biomass using remote sensing vegetation indices. Precis. Agric. 2019, 20, 214–236. [Google Scholar] [CrossRef]
- Esau, T.; Zaman, Q.; Groulx, D.; Farooque, A.; Schumann, A.; Chang, Y. Machine vision smart sprayer for spot-application of agrochemical in wild blueberry fields. Precis. Agric. 2018, 19, 770–788. [Google Scholar] [CrossRef]
- Grisso, R.D.; Jasa, P.J.; Schroeder, M.A.; Wilcox, J.C. Yield monitor accuracy: Successful farming magazine case study. Appl. Eng. Agric. 2002, 18, 147–151. [Google Scholar] [CrossRef]
- Koirala, A.; Walsh, K.B.; Wang, Z.; McCarthy, C. Deep learning for real-time fruit detection and orchard fruit load estimation: Benchmarking of ‘MangoYOLO’. Precis. Agric. 2019, 20, 1107–1135. [Google Scholar] [CrossRef]
- Moral, F.J.; Serrano, J.M. Using low-cost geophysical survey to map soil properties and delineate management zones on grazed permanent pastures. Precis. Agric. 2019, 20, 1000–1014. [Google Scholar] [CrossRef]
- Memic, E.; Graeff, S.; Claupein, W.; Batchelor, W.D. GIS-based spatial nitrogen management model for maize: Short- and long-term marginal net return maximizing nitrogen application rates. Precis. Agric. 2019, 20, 295–312. [Google Scholar] [CrossRef]
- Samseemoung, G.; Jayasuriya, H.P.W.; Soni, P. Oil palm pest infestation monitoring and evaluation by helicopter-mounted, low altitude remote sensing platform. J. Appl. Remote Sens. 2011, 5, 053540. [Google Scholar] [CrossRef]
- Samseemoung, G.; Soni, P.; Jayasuriya, H.P.W.; Salokhe, V.M. Application of low altitude remote sensing (LARS) platform for monitoring crop growth and weed infestation in a soybean plantation. Precis. Agric. 2012, 13, 611–627. [Google Scholar] [CrossRef]
- Samseemoung, G.; Soni, P.; Sirikun, C. Monitoring and Precision Spraying for Orchid Plantation with Wireless WebCAMs. Agriculture 2017, 7, 87. [Google Scholar] [CrossRef] [Green Version]
- Samseemoung, G.; Soni, P.; Suwan, P. Development of a Variable Rate Chemical Sprayer for Monitoring Diseases and Pests Infestation in Coconut Plantations. Agriculture 2017, 7, 89. [Google Scholar] [CrossRef] [Green Version]
- Office of Agricultural Economics: Ministry of Agriculture and Cooperatives. Agricultural Economic Basic Information 2018. Available online: http://www.oae.go.th (accessed on 9 November 2018).
- Office of Agricultural Economics: Ministry of Agriculture and Cooperatives. Agricultural Economic Basic Information 2015. Available online: http://www.oae.go.th (accessed on 9 March 2015).
- Baio, F.H.R.; Neves, D.C.; Souza, H.B.; Leal, A.J.F.; Leite, R.C.; Molin, J.P.; Silva, S.P. Variable rate spraying application on cotton using an electronic flow controller. Precis. Agric. 2018, 19, 912–928. [Google Scholar] [CrossRef]
- Gonzalez-de-Santos, P.; Ribeiro, A.; Fernandez-Quintanilla, C.; Lopez-Granados, F.; Brandstoetter, M.; Tomic, S.; Pedrazzi, S.; Peruzzi, A.; Pajares, G.; Kaplanis, G.; et al. Fleets of robots for environmentally-safe pest control in agriculture. Precis. Agric. 2017, 18, 574–614. [Google Scholar] [CrossRef]
- Chosa, T.; Shibata, Y.; Omine, M.; Toriyama, K.; Araki, K. A Study on Yield Monitoring System for Head-Feeding Combines (Part3). J. Jpn. Soc. Agric. Mach. 2004, 66, 137–144. [Google Scholar] [CrossRef]
- Zhao, Y.; Potgieter, A.B.; Zhang, M.; Wu, B.; Hammer, G.L. Predicting Wheat Yield at the Field Scale by Combining High-Resolution Sentinel-2 Satellite Imagery and Crop Modelling. Remote Sens. 2020, 12, 1024. [Google Scholar] [CrossRef] [Green Version]
- Sharma, K.; Singh, M.; Singh, B.; Sharma, A.; Mishra, P.K. Sugarcane yield mapping based on vehicle tracking. J. Agric. Eng. 2019, 49, 1–8. [Google Scholar]
- Momin, M.A.; Grift, T.E.; Valente, D.S.; Hansen, A.C. Sugarcane yield mapping based on vehicle tracking. Precis. Agric. 2019, 20, 896–910. [Google Scholar] [CrossRef]
- Sharpe, S.M.; Schumann, A.W.; Yu, J.; Boyd, N.S. Vegetation detection and discrimination within vegetable plasticulture row-middles using a convolutional neural network. Precis. Agric. 2019, 21, 264–277. [Google Scholar] [CrossRef]
- Martinez-Guanter, J.; Agüera, P.; Agüera, J.; Pérez-Ruiz, M. Spray and economics assessment of a UAV-based ultra-low-volume application in olive and citrus orchards. Precis. Agric. 2019, 21, 226–243. [Google Scholar] [CrossRef]
- Kayacan, E.; Ramon, H.; Saeys, W. Robust Trajectory Tracking Error Model-Based Predictive Control for Unmanned Ground Vehicles. IEEE/ASME Trans. Mechatron. 2012, 21, 806–814. [Google Scholar] [CrossRef]
- Astanakulov, K.; Shovazov, K.; Borotov, A.; Turdibekov, A.; Ibrokhimov, S. Wheat harvesting by combine with GPS receiver and grain sensor. E3S Web Conf. 2021, 227, 07001. [Google Scholar] [CrossRef]
- Jelínek, Z.; Starý, K.; Kumhálová, J. Assessment of production zones modelling accuracy based on satellite imaging and yield measurement of selected agriculture plot. Agron. Res. 2019, 17, 447–455. [Google Scholar] [CrossRef]
Figure 1.
Yield meter components.
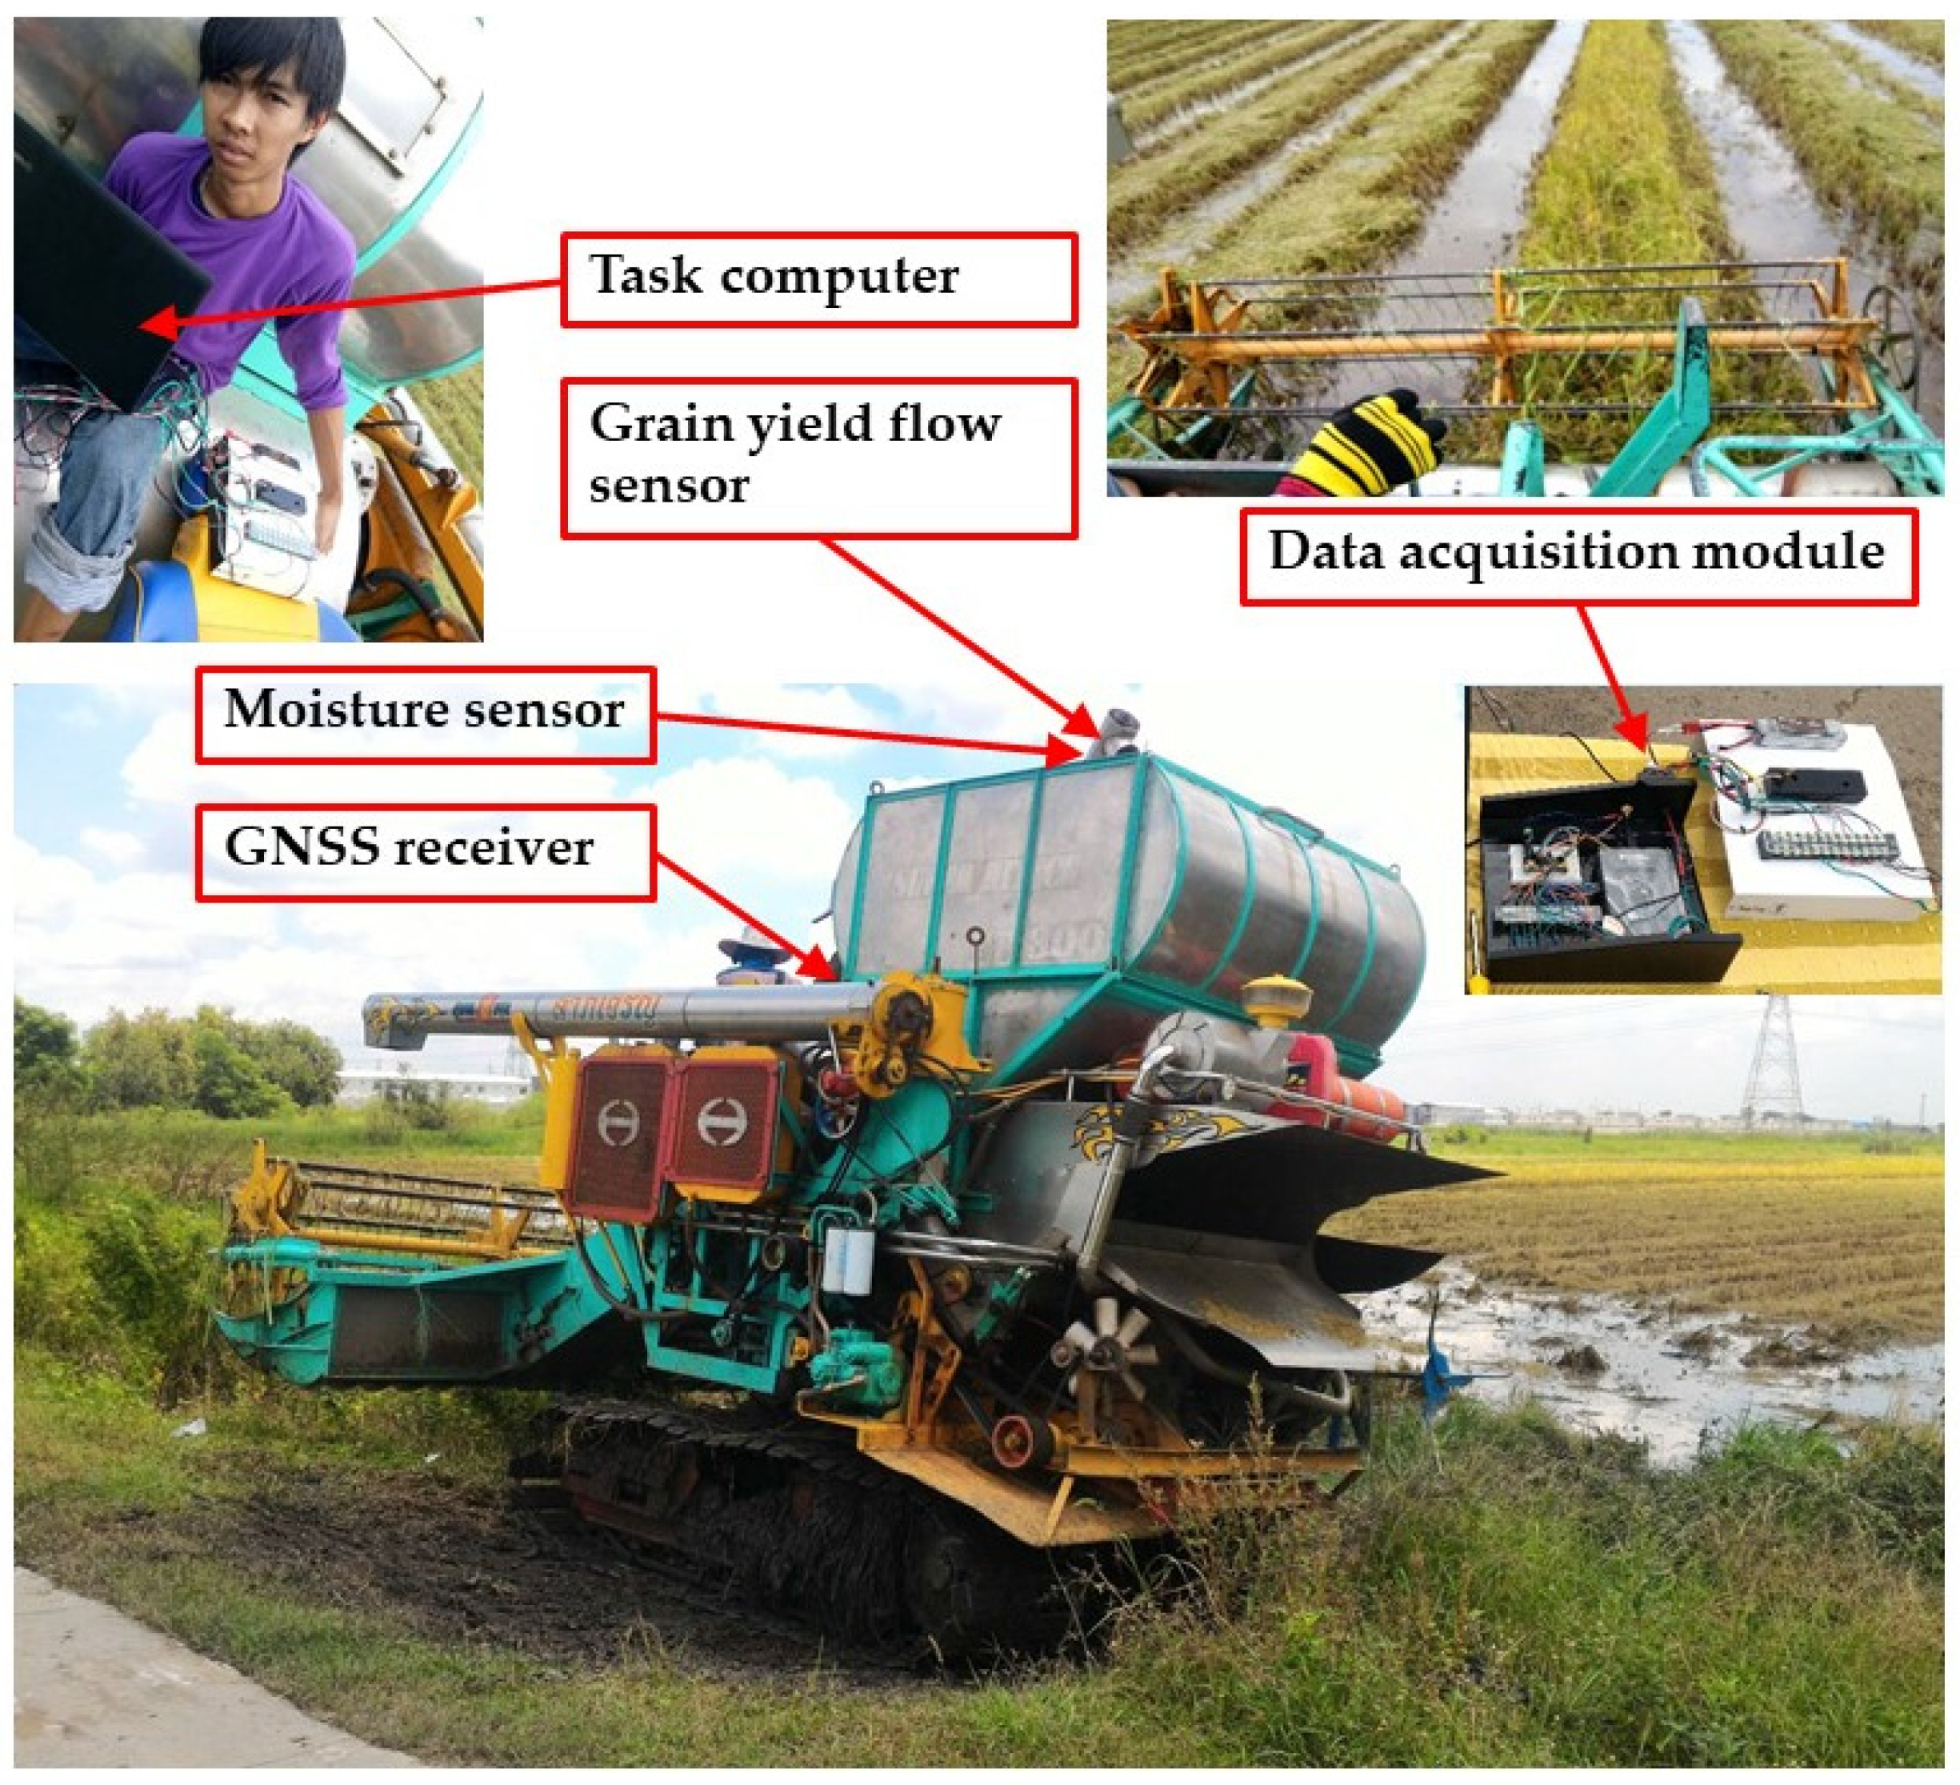
Figure 2.
Data acquisition module.
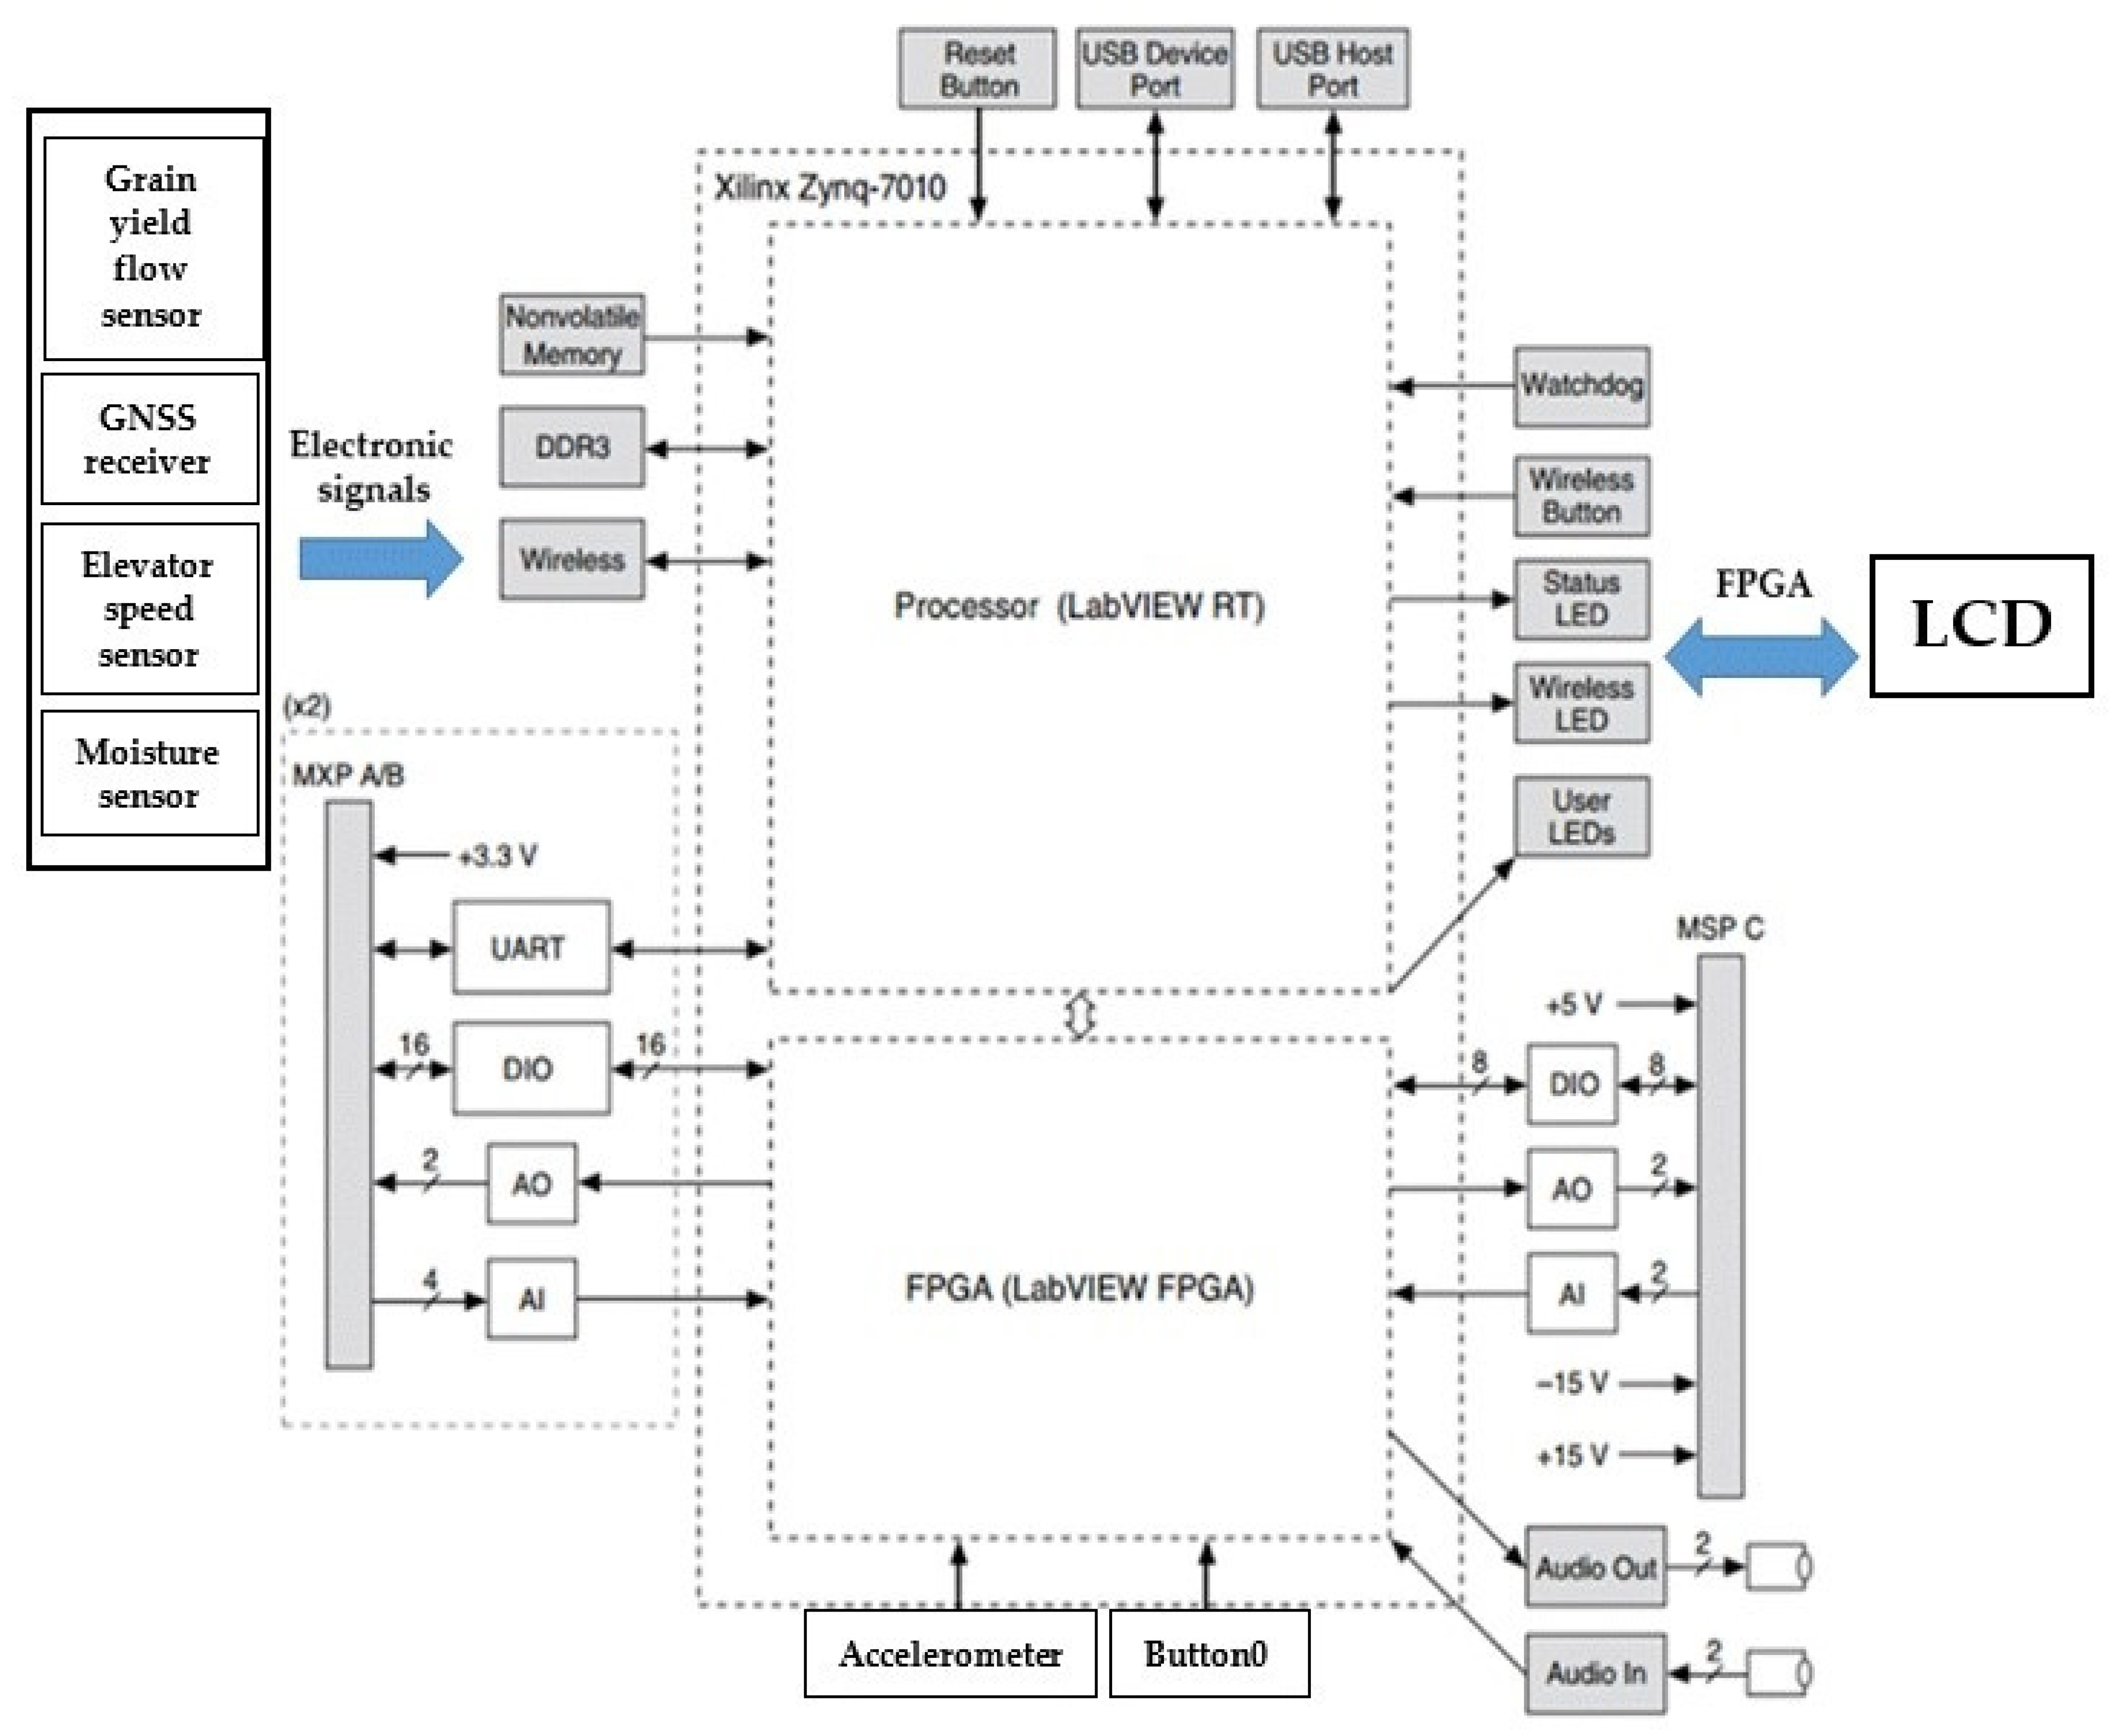
Figure 3.
Yield monitoring display developed in Microsoft® Visual Basic®.
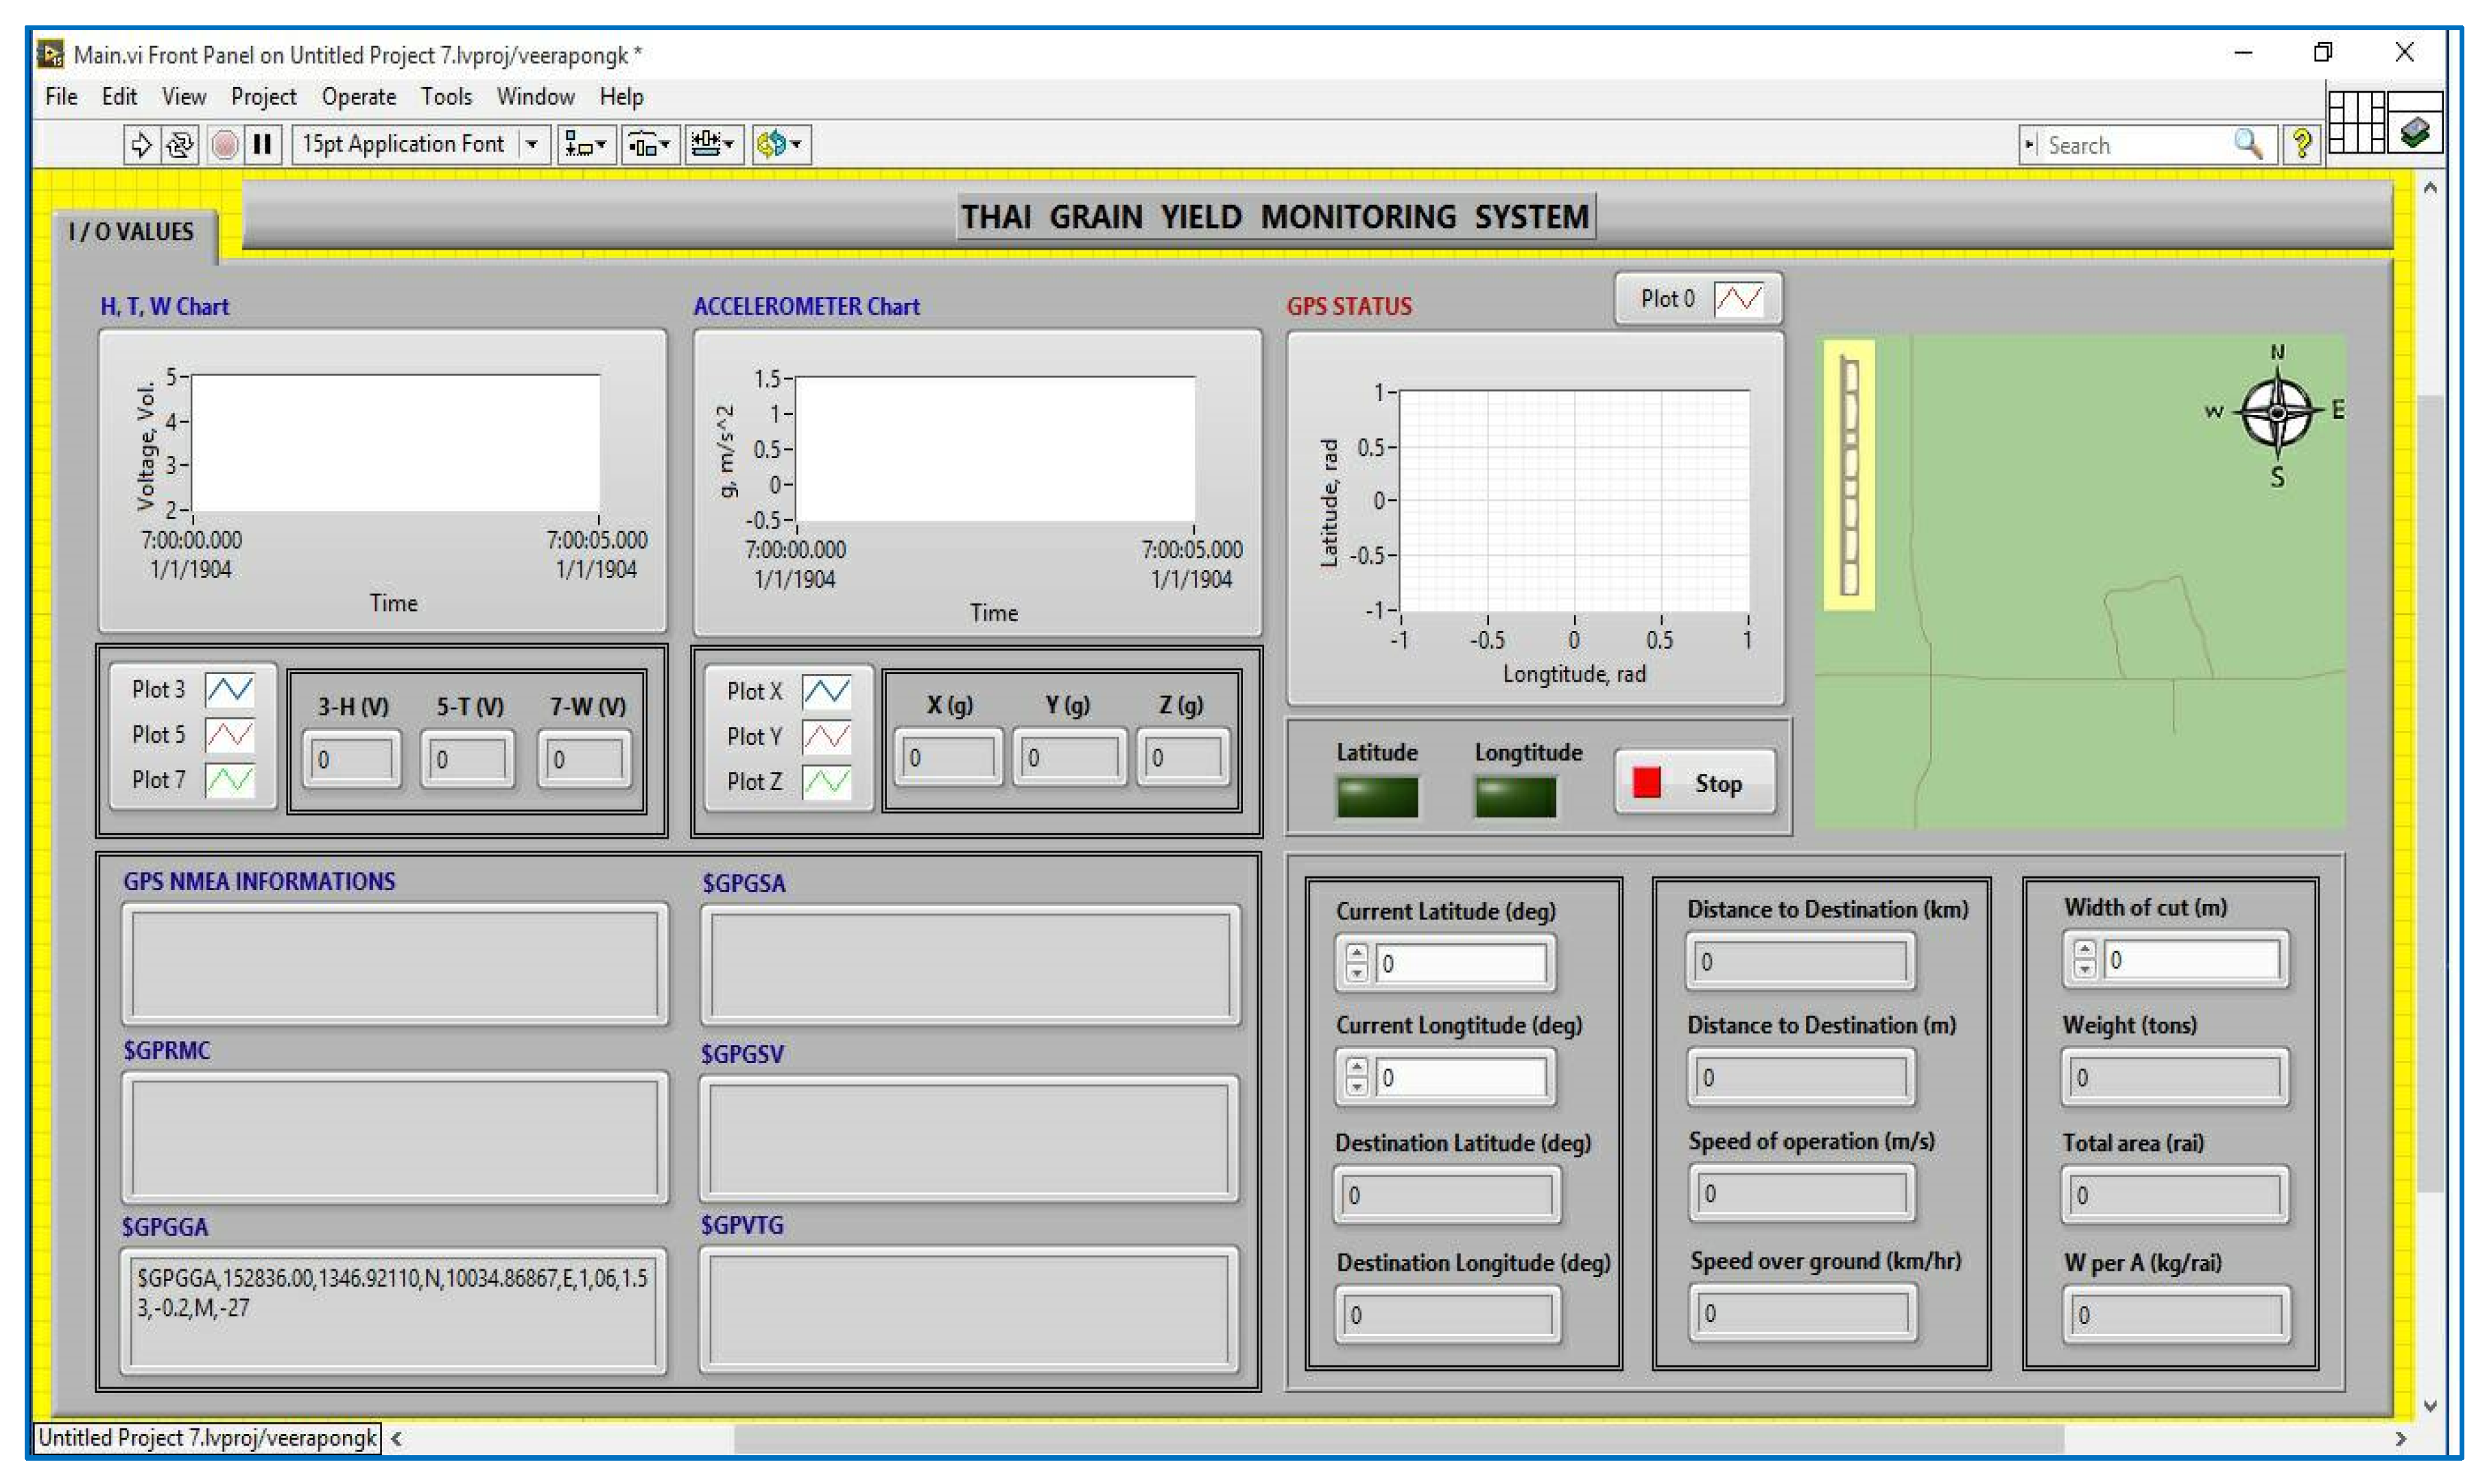
Figure 4.
Schematic of the created software.
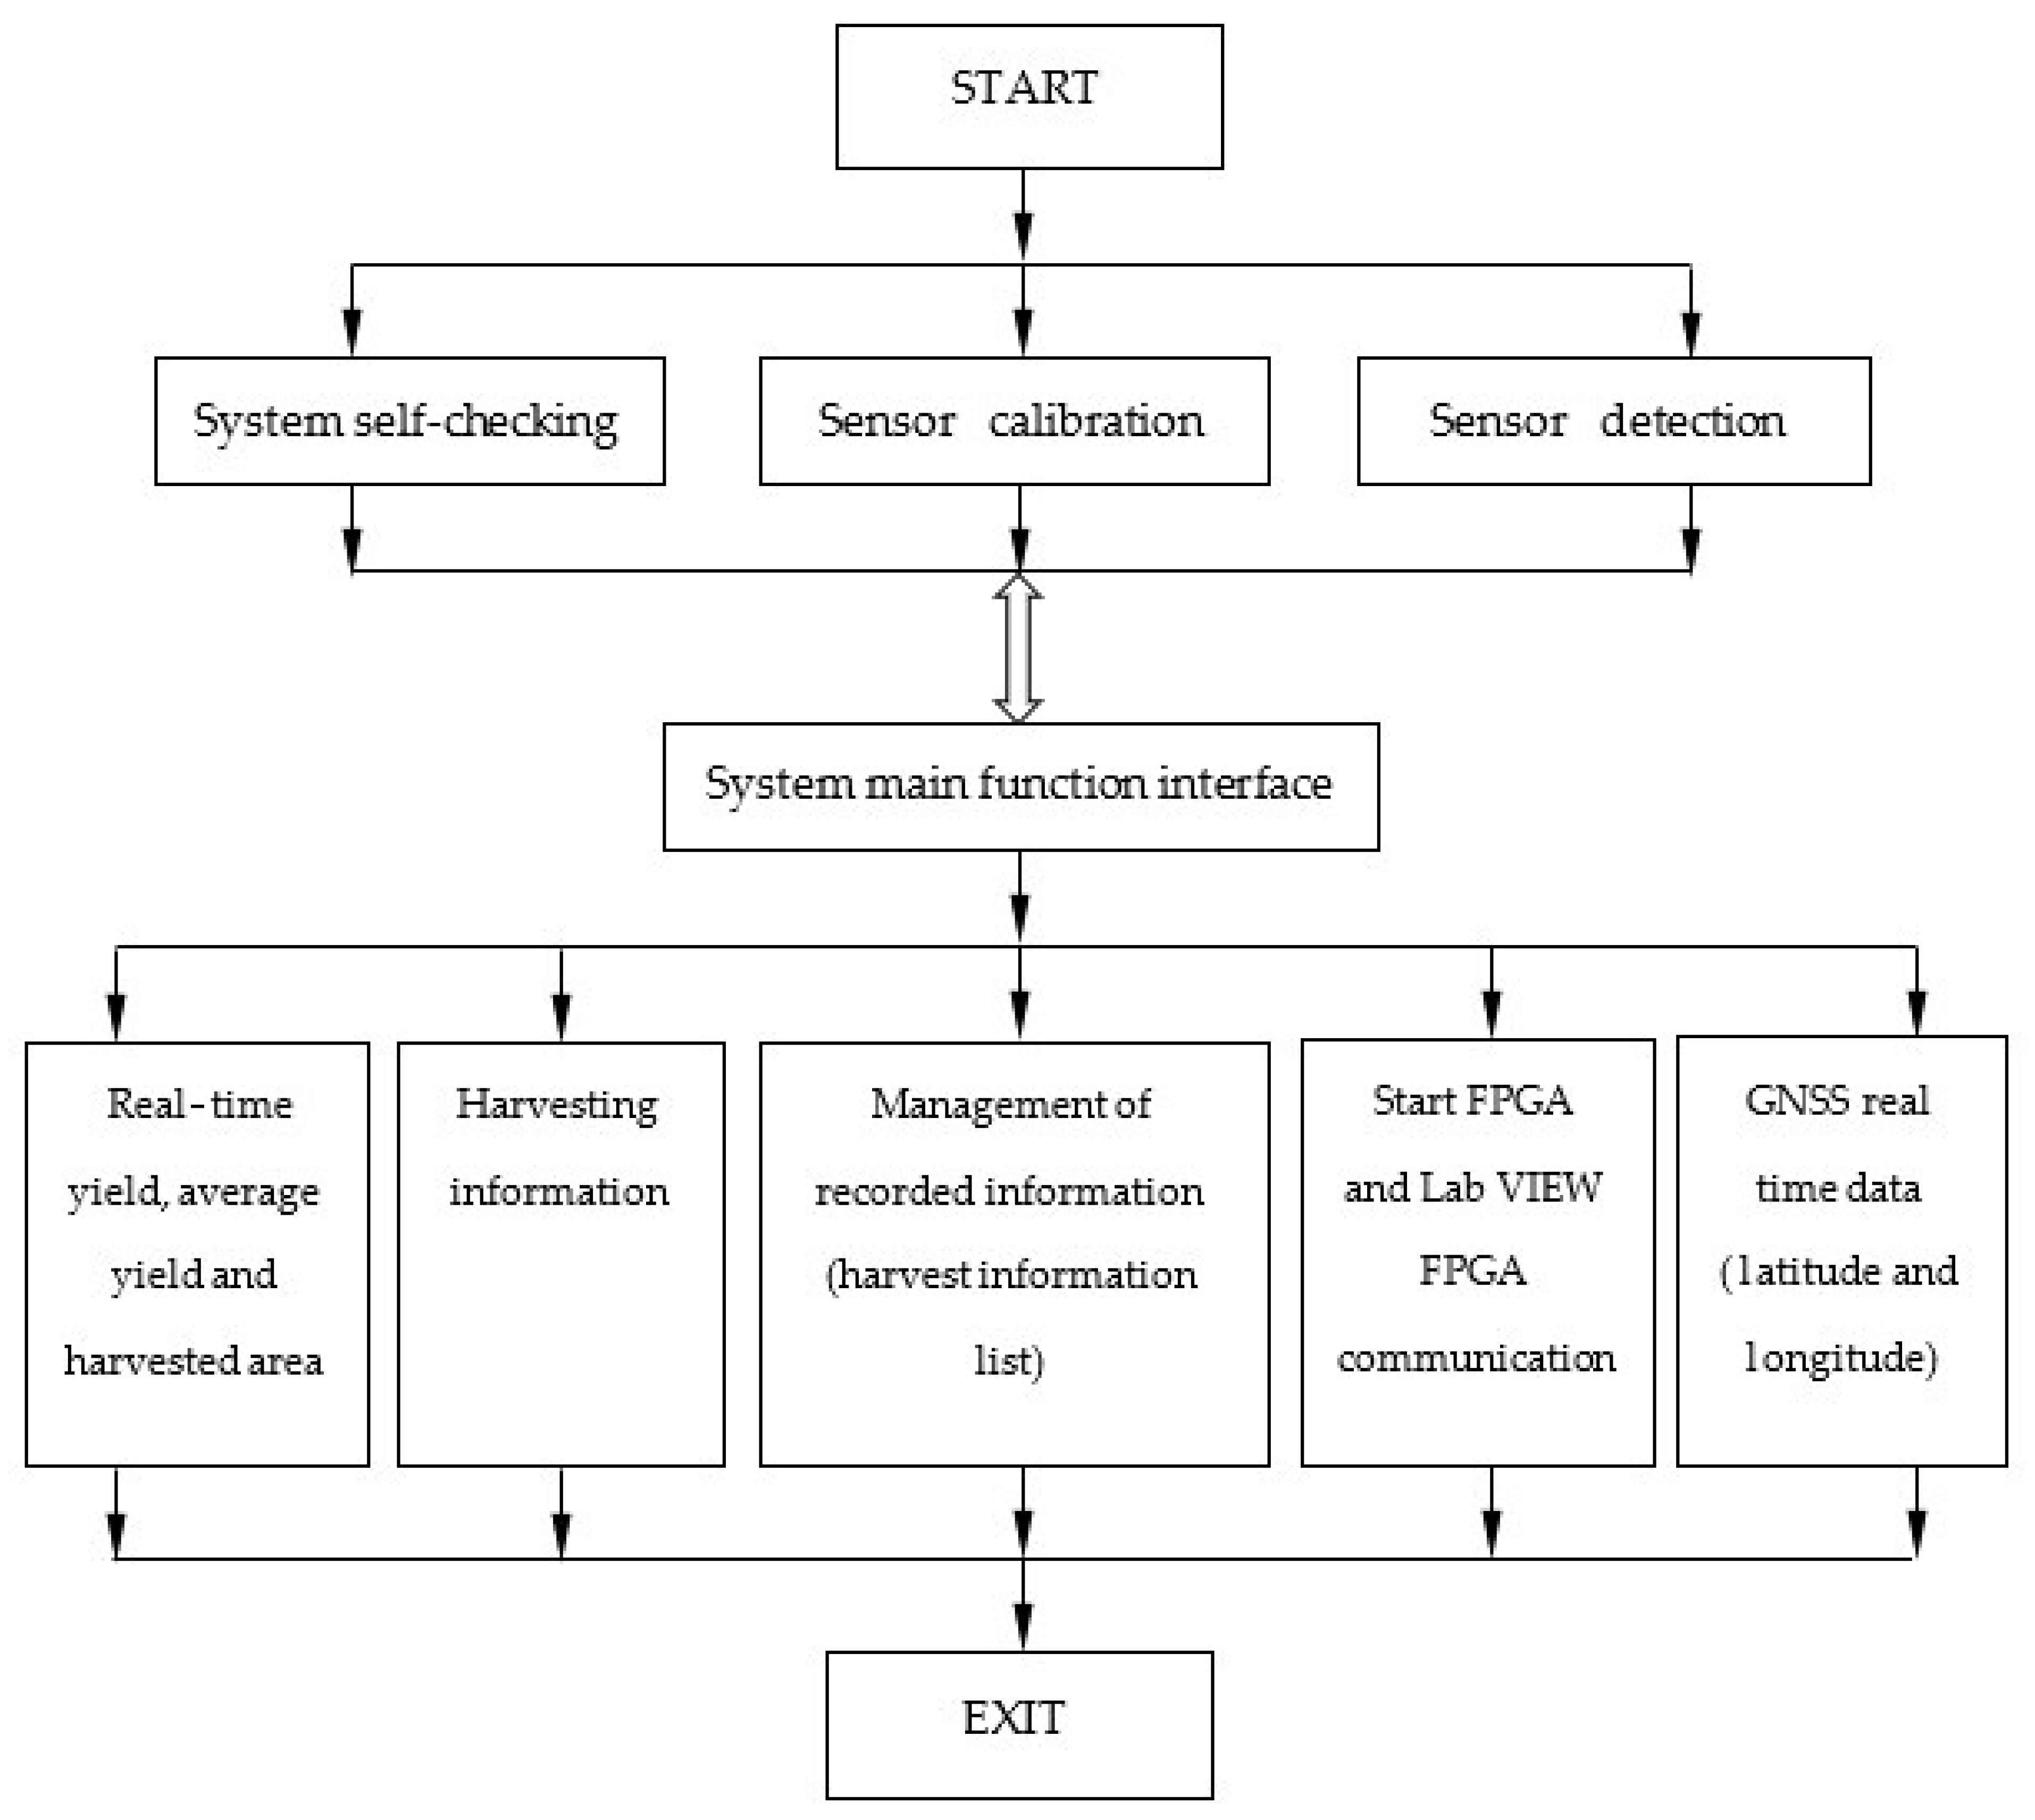
Figure 5.
Measured and actual grain flow rates.
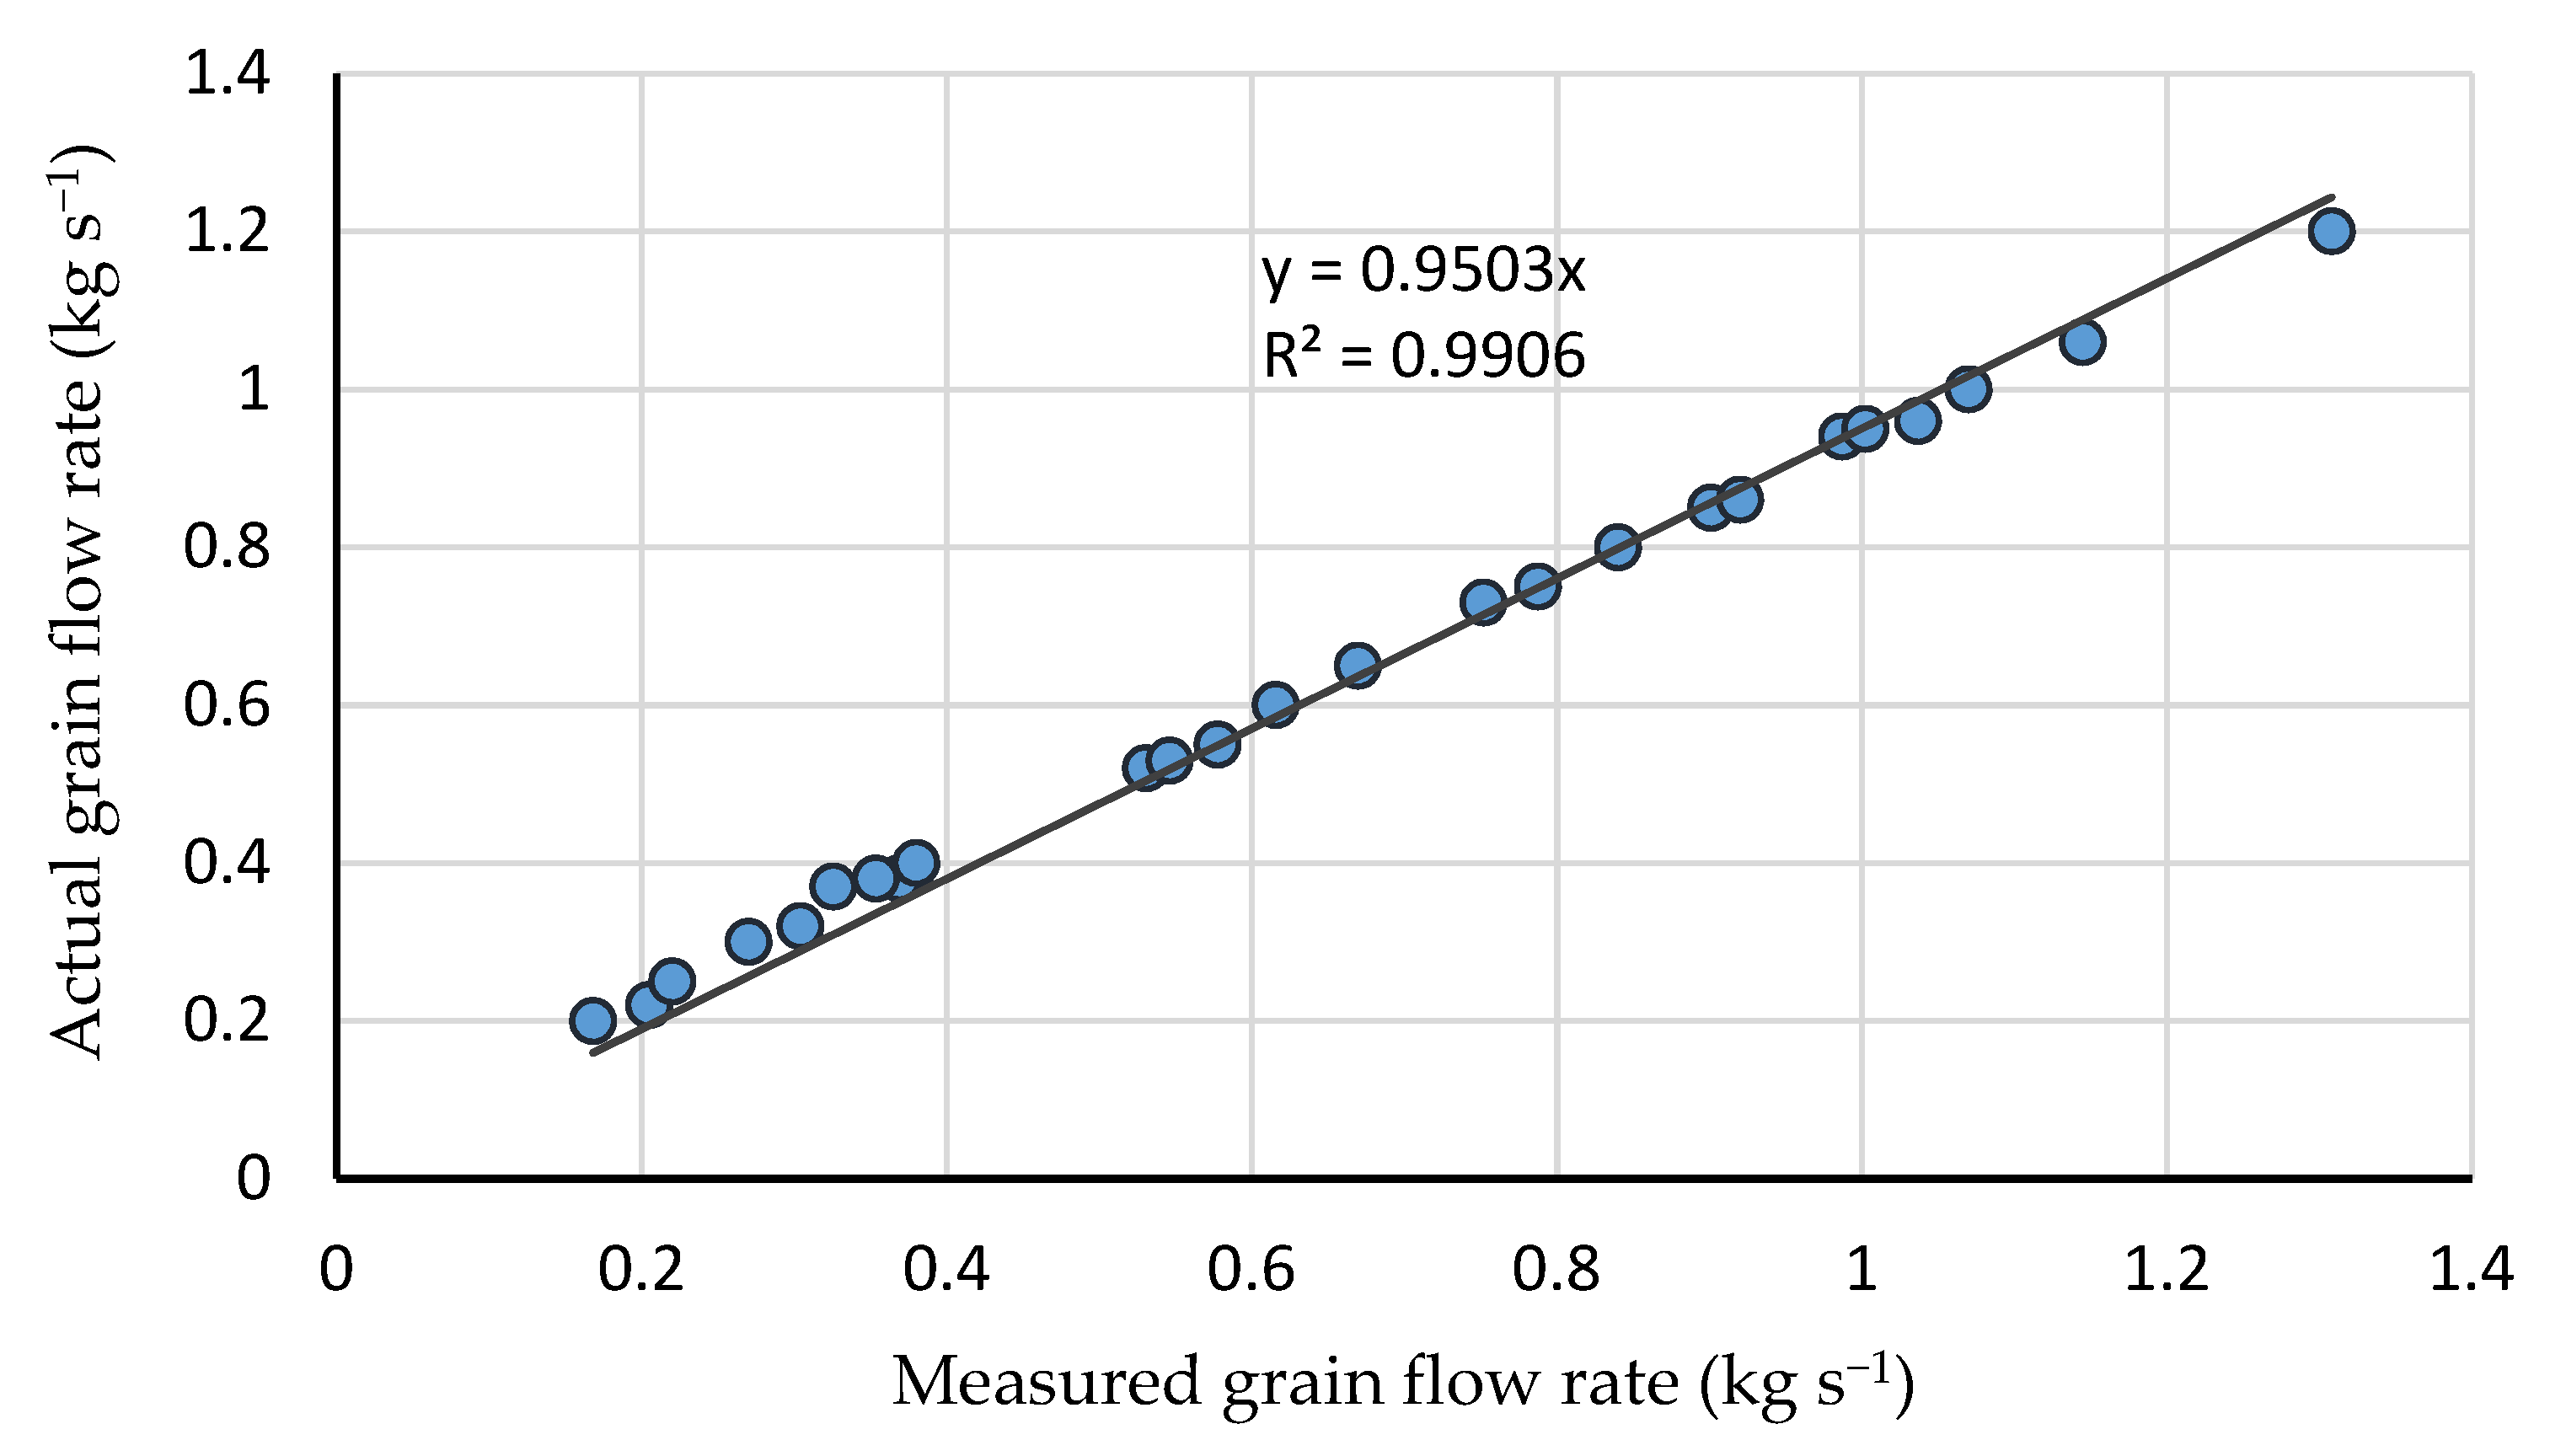
Figure 6.
Errors between actual cumulative weights and yield meter cumulative weights.
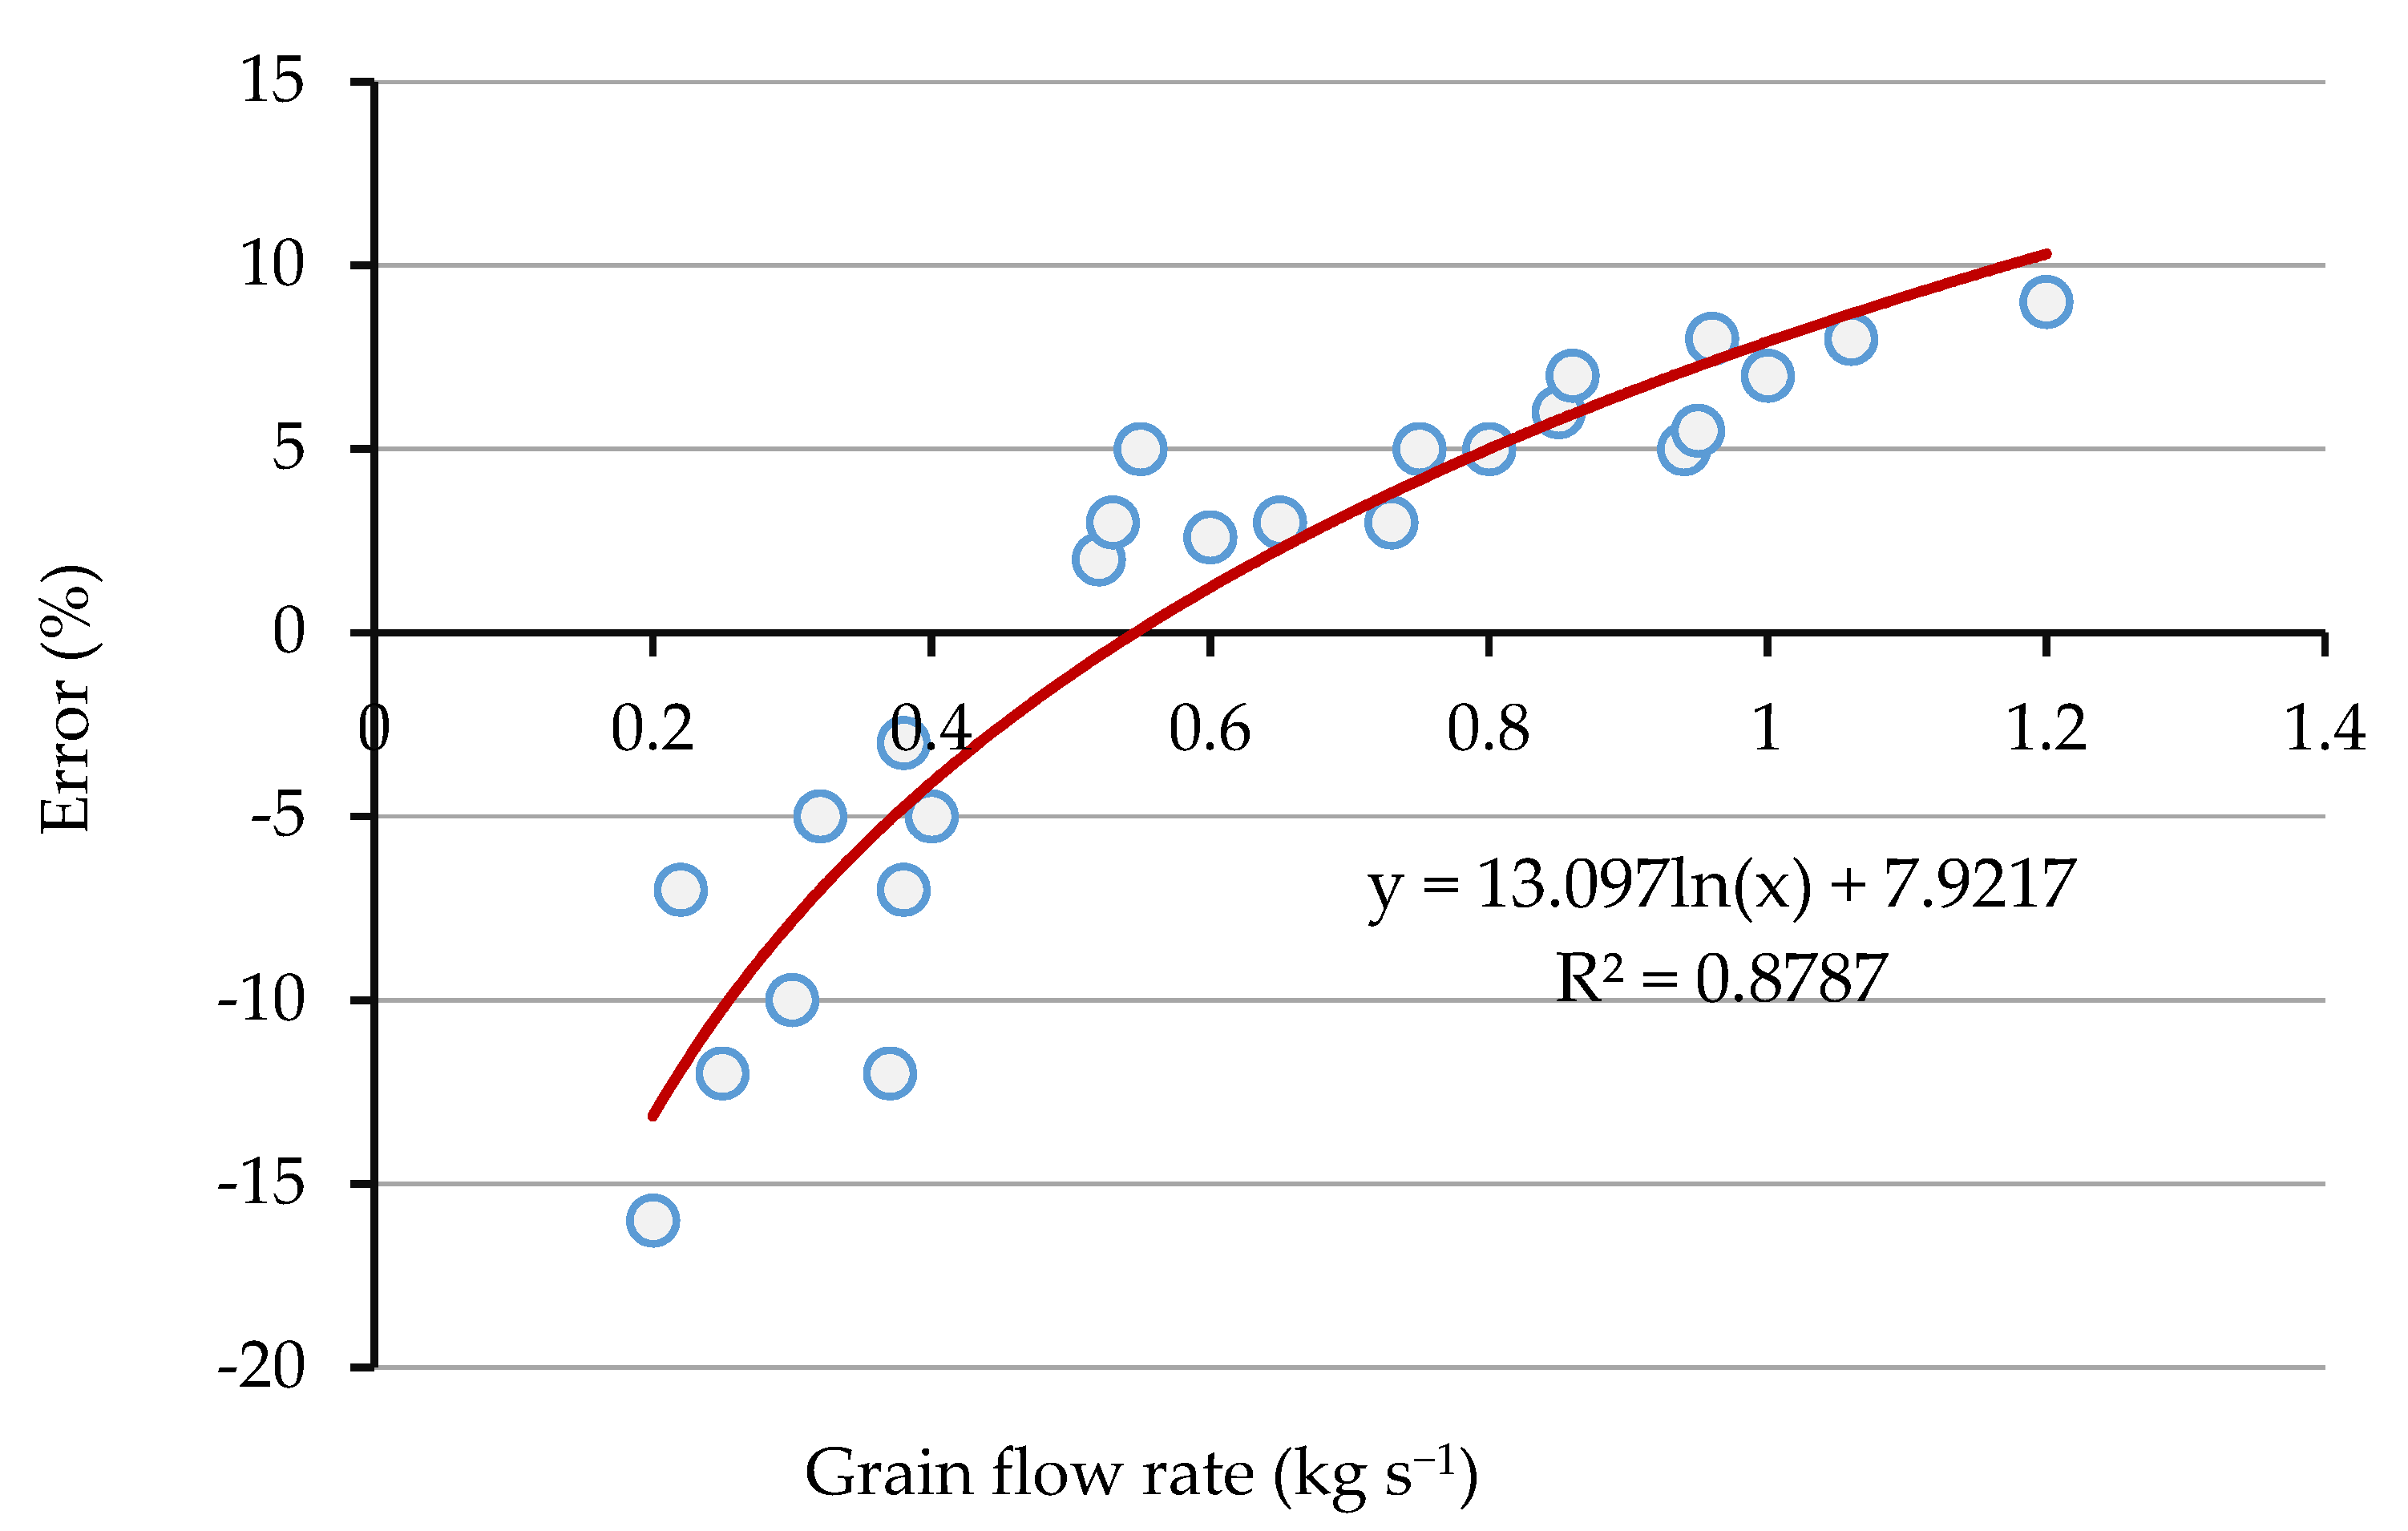
Figure 7.
Yield meter’s response to grain flow rate and yield auger inclination. Error bars represent ± standard deviation, n = 3).
Figure 7.
Yield meter’s response to grain flow rate and yield auger inclination. Error bars represent ± standard deviation, n = 3).

Figure 8.
Effect of grain moisture content on grain loss. Error bars represent ± standard deviation, n = 3. Means followed by the same letter and font are not significantly different at p < 0.05 according to Duncan’s Multiple Range Test.
Figure 8.
Effect of grain moisture content on grain loss. Error bars represent ± standard deviation, n = 3. Means followed by the same letter and font are not significantly different at p < 0.05 according to Duncan’s Multiple Range Test.
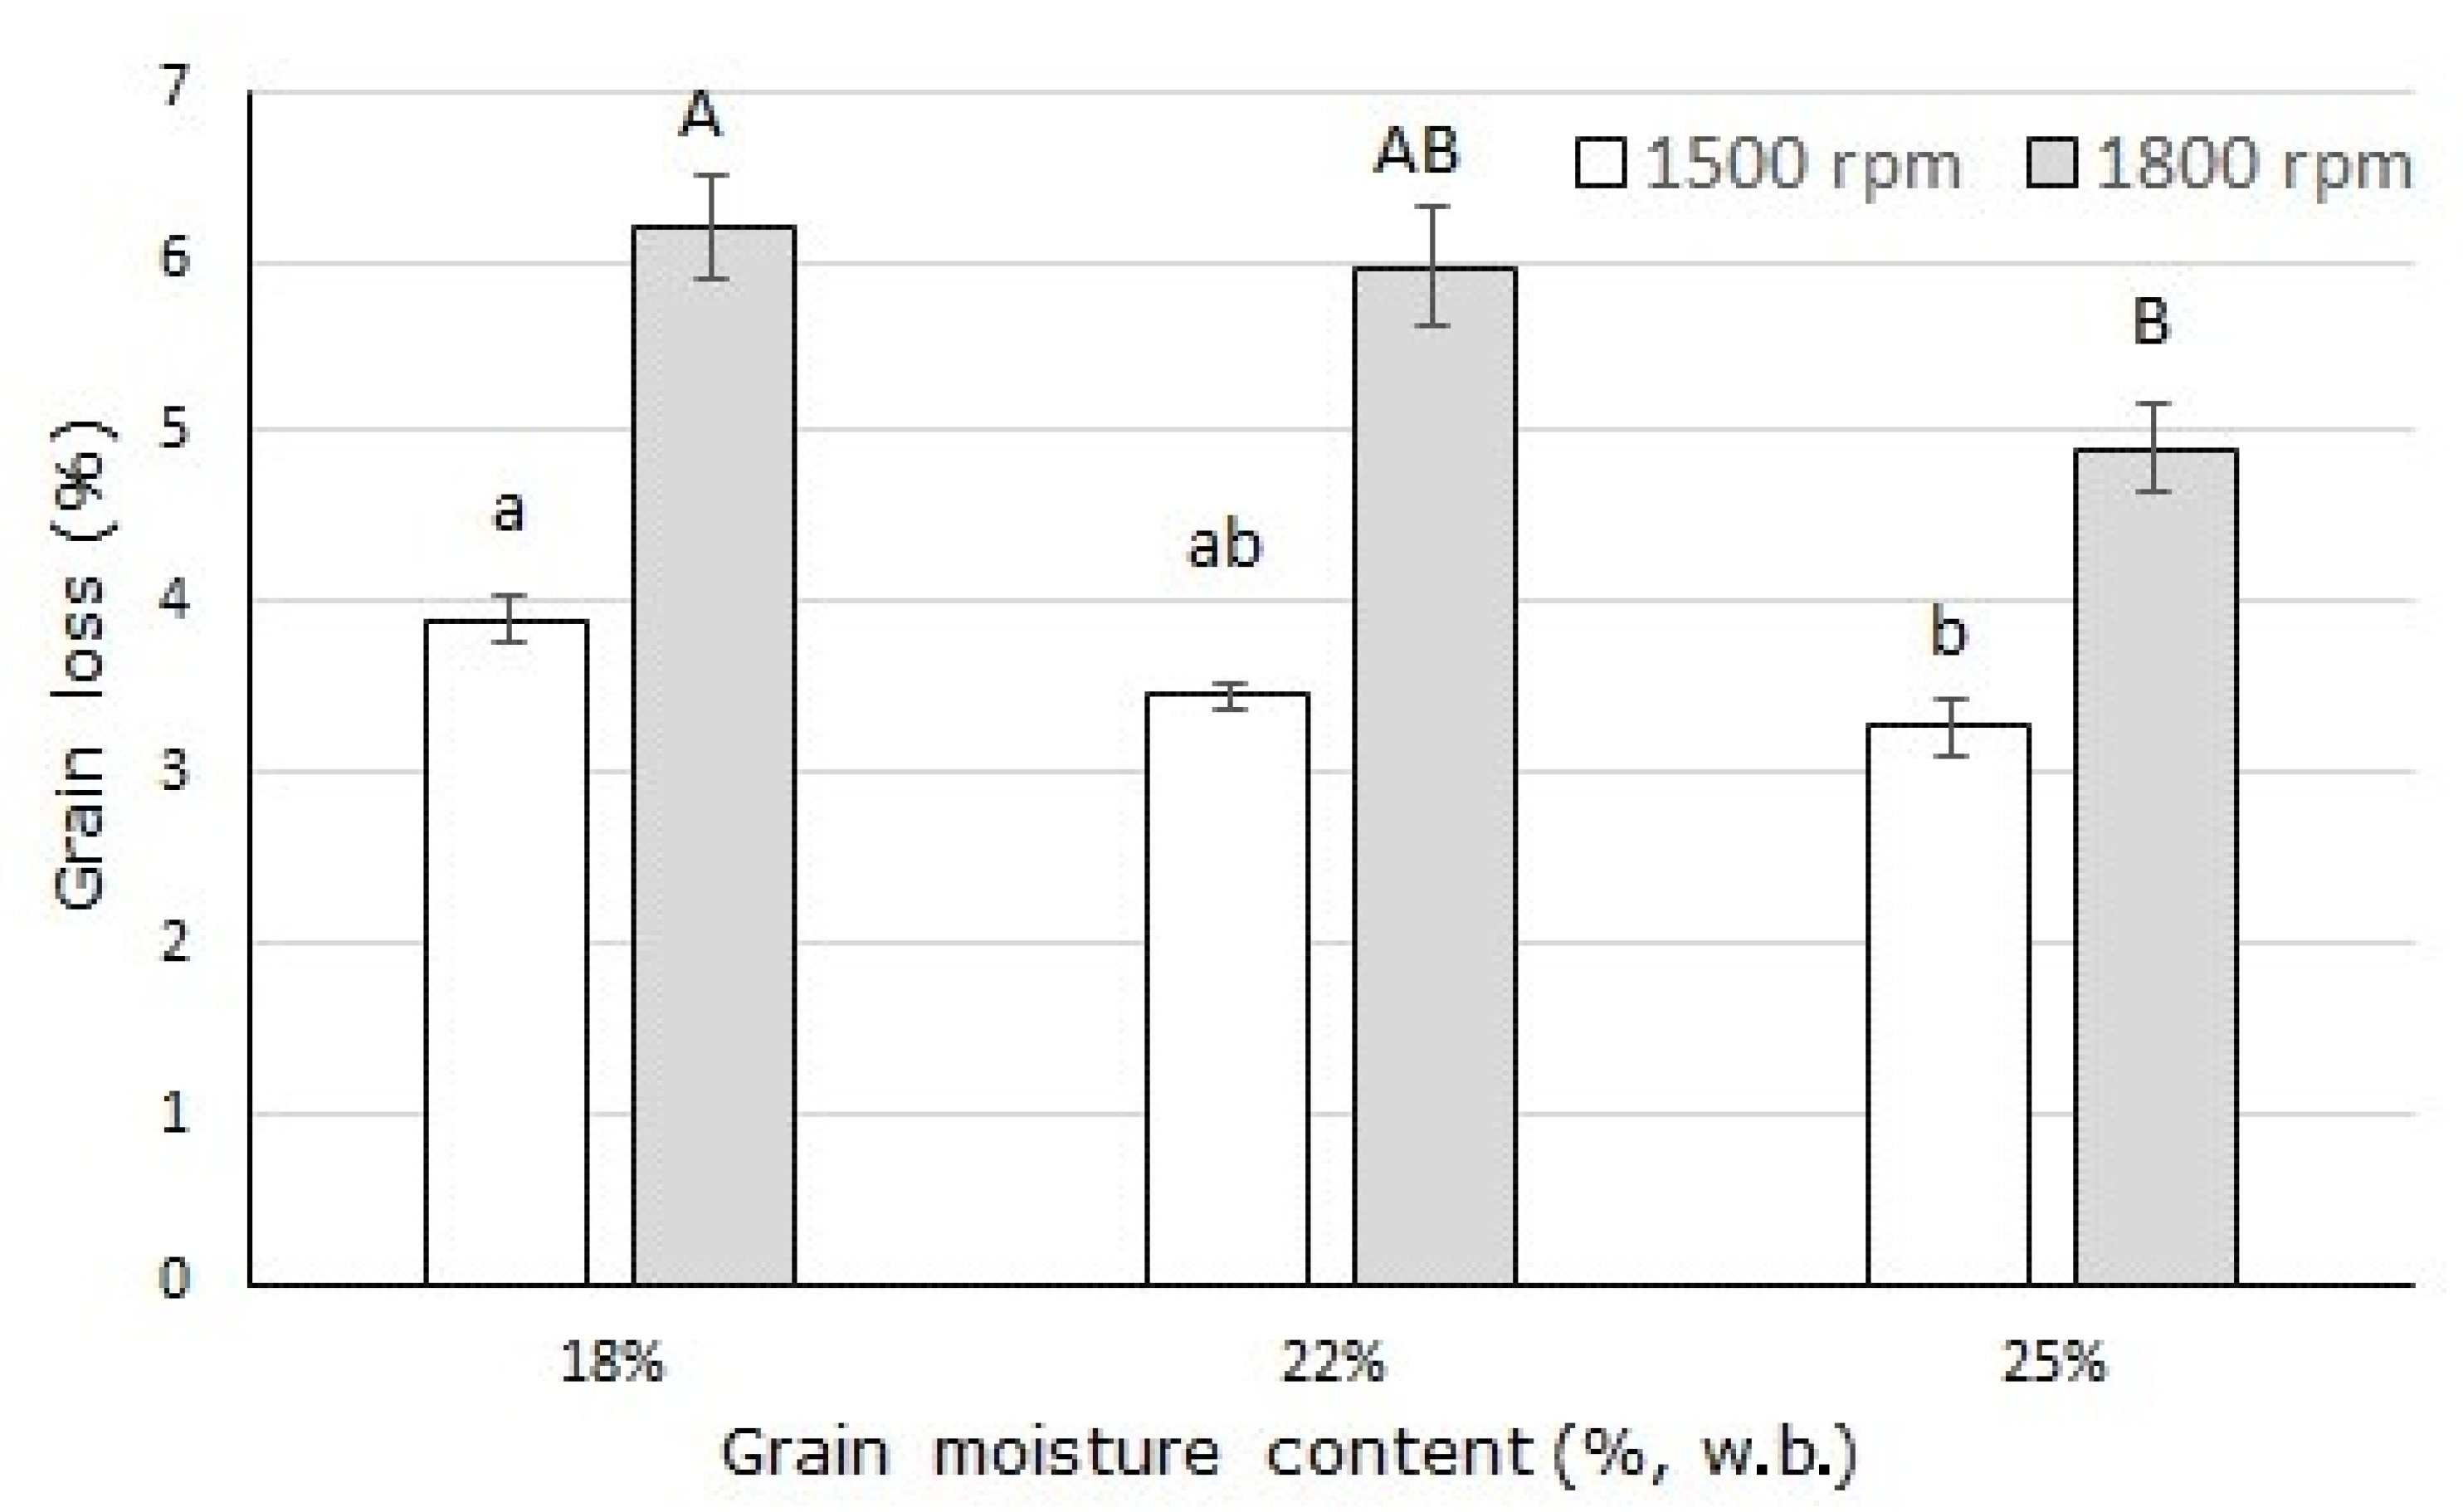
Figure 9.
Yield and moisture content variation of plantation of 0.3 ha.

Figure 10.
Yield and moisture content variation of plantation of 0.4 ha.
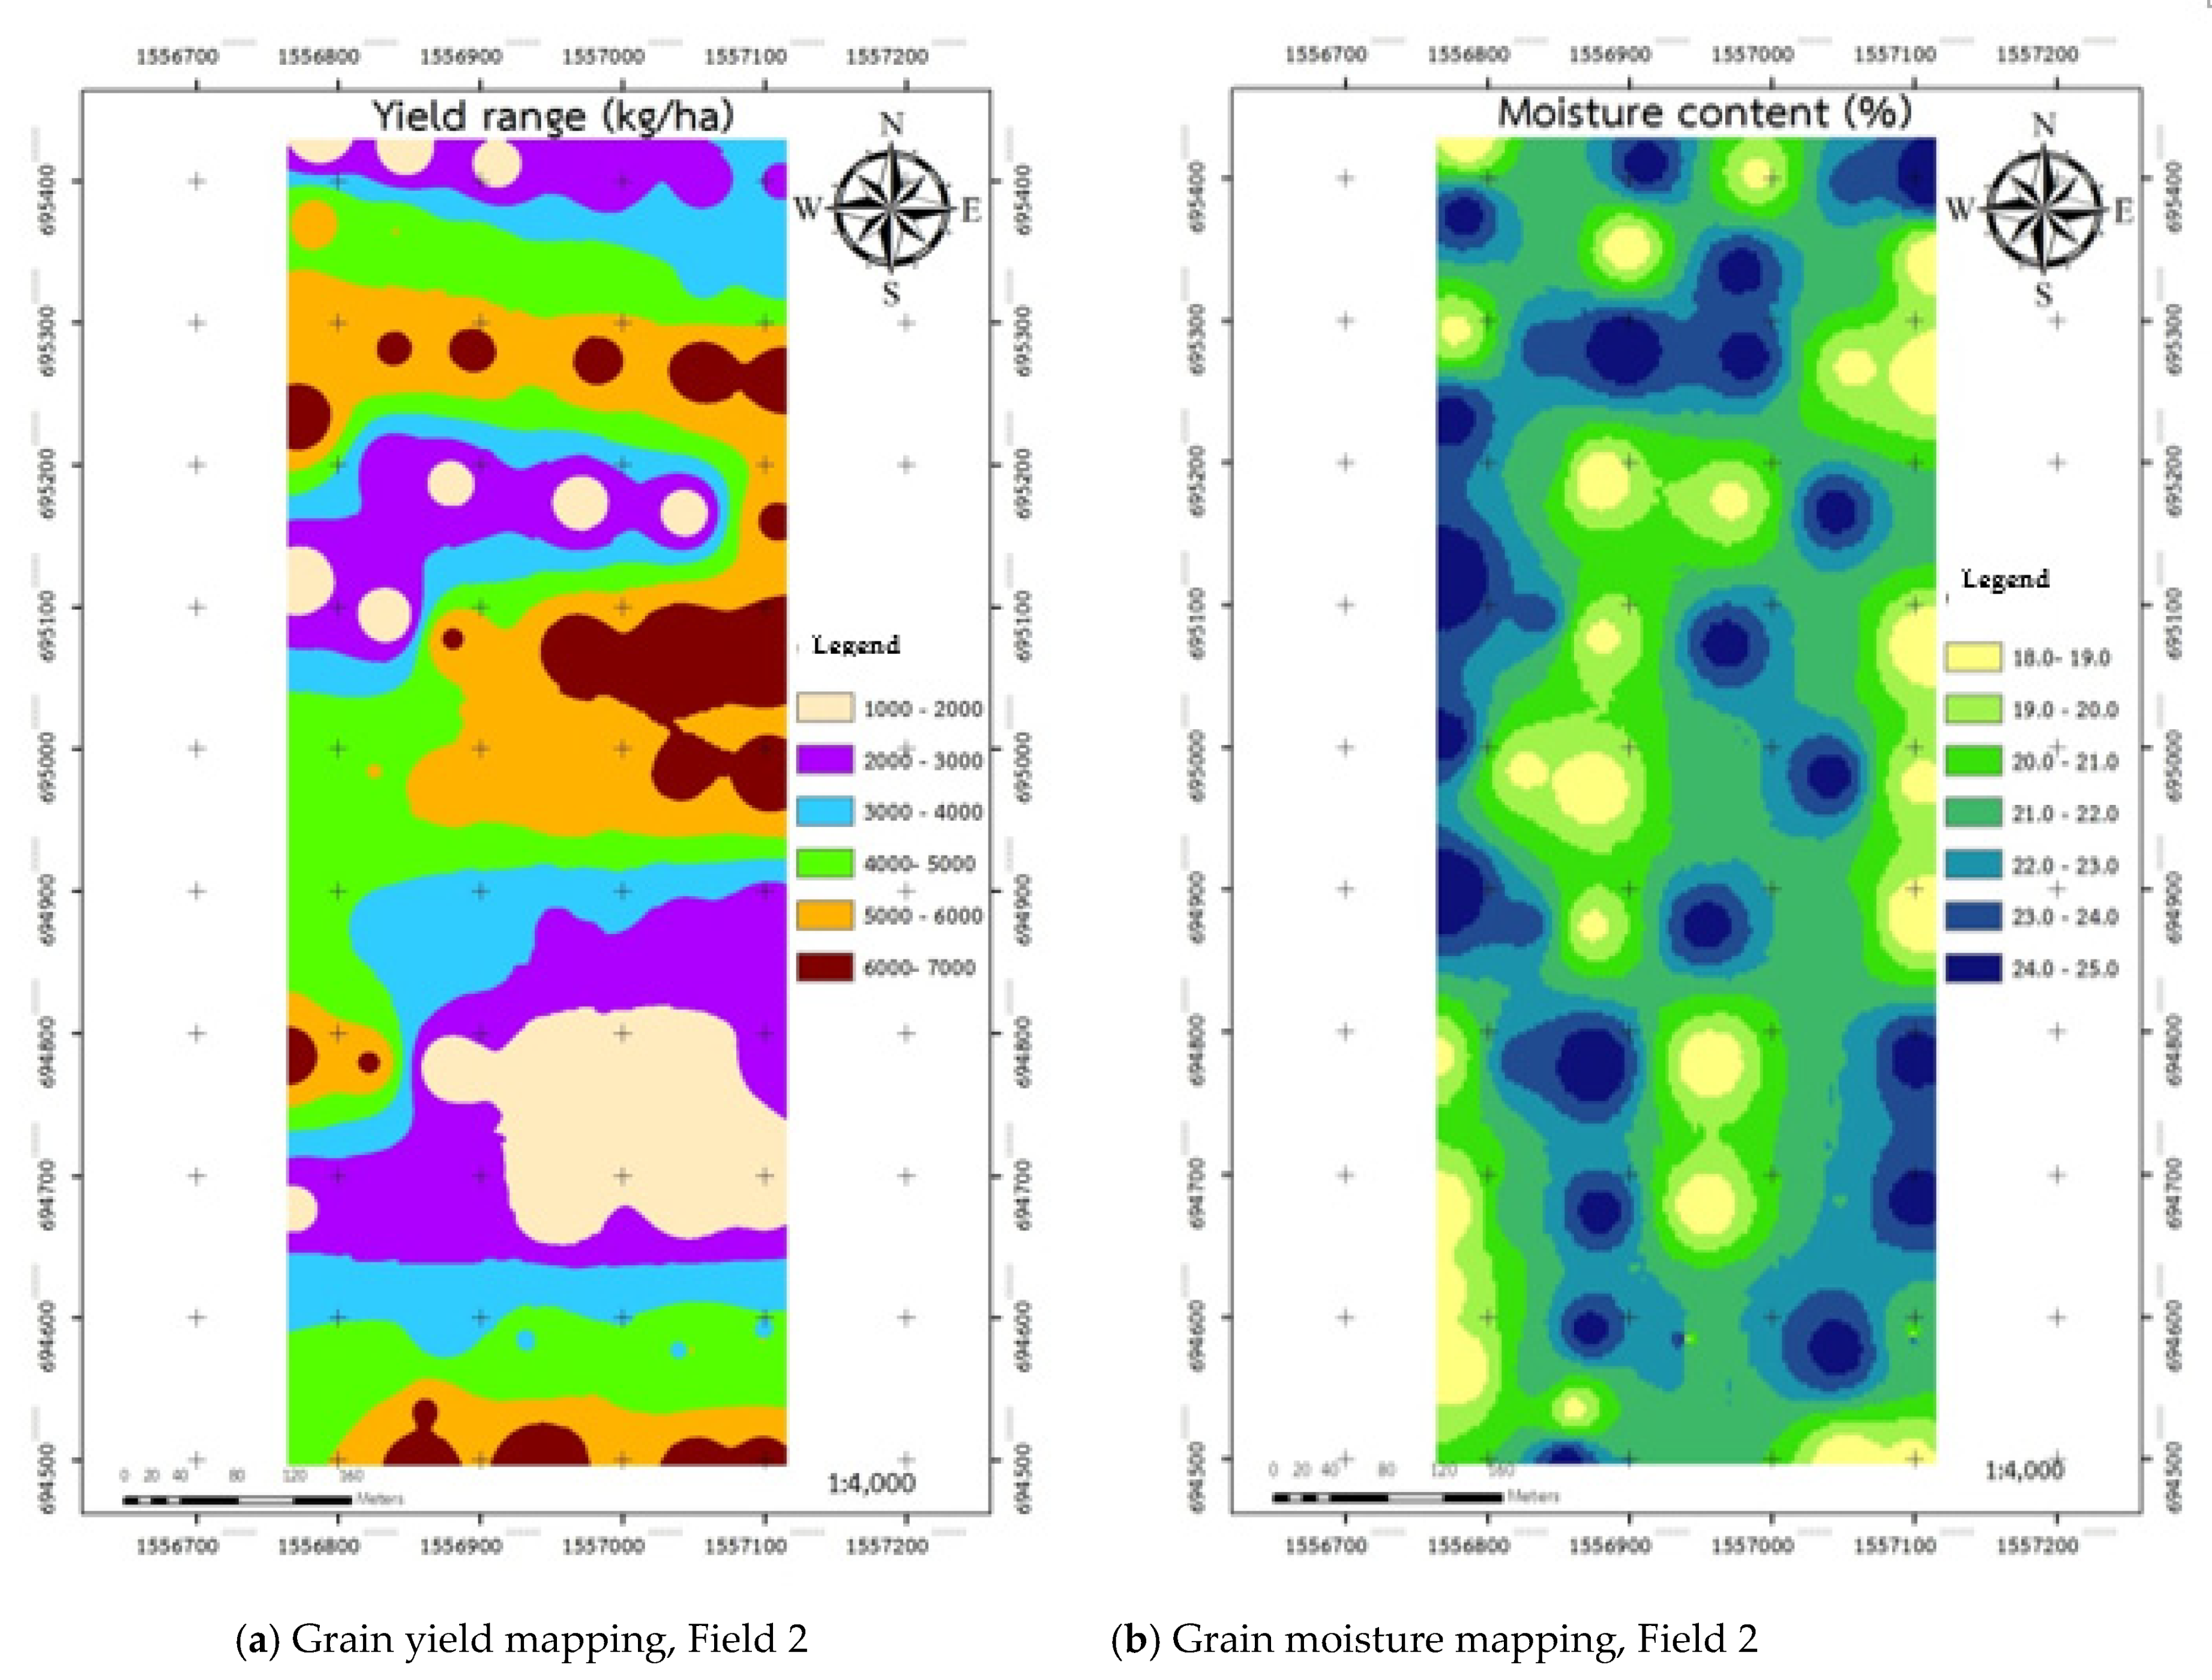
Figure 11.
Yield and moisture content variation of plantation of 0.5 ha.

Table 1.
Details of experimental setup and vital field measurements.
| Feature | Value |
|---|---|
| Thai rice combine harvester | |
| Engine type 1/: | Diesel engine (Nissan RD 28–100 hp) |
| Dimensions (length × breadth × height) 1/: | 4.8 m × 2.1 m × 2.5 m |
| Area under tracked layers 1/: | 2.4 m2 |
| Track size 1/: | 300 × 110 mm2 |
| Total weight without grains 1/: | 2.8 tons |
| Soil compaction under tracked wheel: | 18 kPa |
| Width of cut 1/: | 1.85 m |
| Front auger dimension 1/: | φ 0.33 m × 1.85 m |
| Amount of cut 1/: | 25 pieces |
| Dimension of threshing unit 1/: | 3 feet |
| Spacing of spike tooth pattern for axial flow rice combine harvester 1/: | 1 cm |
| Area of paddy separator 1/: | 0.99 m2 |
| Paddy field details | |
| Rice plant height: | 116 cm |
| Rice straw height: | 18.7 cm |
| Rice plant inclination from vertical: | 5° |
| Total rice yield: | 5 t ha−1 |
| Grain moisture content, %w.b.: | 23% |
| System details | |
| Header loss: | 10.56 kg ha−1 |
| Grain loss at straw spreader: | 11.43 kg ha−1 |
| Total grain loss: | 22 kg ha−1 |
| Forward speed: | 3.4 km h−1 |
| Field efficiency: | 88% |
| Fuel consumption rate: | 18.62 l ha−1 |
| Percent of clean grain: | 95% |
| Custom hiring rate with driver: | 93.75 USD ha−1 |
1/ As claimed by the respective manufacturer.
Table 2.
Effect of yield weight (kg s−1) and angle of yield auger (degree) variability on average grain flow (kg s−1).
Table 2.
Effect of yield weight (kg s−1) and angle of yield auger (degree) variability on average grain flow (kg s−1).
| Job No. | Yield Auger Assembly | Total Weights (kg) | |||
|---|---|---|---|---|---|
| Average Grain Flow Setting (kg/s) | Angle of Yield Auger (°) | Actual (kg/s) | Yield Sensor Meter (kg/s) | Error (%) | |
| 1 | 0.4 | 15 30 45 | 0.40 0.40 0.41 | 0.333 0.332 0.329 | 16.8 16.9 17.7 |
| 2 | 0.6 | 15 30 45 | 0.60 0.61 0.61 | 0.487 0.486 0.483 | 18.8 19.0 19.5 |
| 3 | 0.8 | 15 30 45 | 0.81 0.81 0.82 | 0.641 0.638 0.635 | 19.8 20.2 20.6 |
| 4 | 1.0 | 15 30 45 | 1.02 1.02 1.03 | 0.789 0.762 0.749 | 21.1 23.8 25.1 |
Table 3.
Effect of average cutter bar height on yield meter performance.
| Job No. | Average Cutter Bar Height from Ground (m) | Grain Flow Rate (kg s−1) | Error (%) | |
|---|---|---|---|---|
| Actual | Yield Meter Output | |||
| 1 | 0.18 | 0.45 | 0.387 a | 14.00 |
| 2 | 0.25 | 0.52 | 0.411 b | 20.96 |
| 3 | 0.35 | 0.63 | 0.512 c | 18.08 |
| 4 | 0.40 | 0.84 | 0.735 d | 12.50 |
Note: At rice height of 1.16 m and average moisture content of 25% (w.b.). Means in a column followed by the same letter are not significantly different at p < 0.05 according to Duncan’s Multiple Range Test.
Table 4.
Rice grain yield range (kg ha−1) and variability for different fields: 0.3 ha, 0.4 ha and 0.5 ha.
Table 4.
Rice grain yield range (kg ha−1) and variability for different fields: 0.3 ha, 0.4 ha and 0.5 ha.
| 0.3 ha | 0.4 ha | 0.5 ha | ||||
|---|---|---|---|---|---|---|
| Area | kg/ha | Area | kg/ha | Area | kg/ha | |
| 0.022 | 1897.6 | 0.024 | 578.1 | 0.025 | 591.1 | |
| 0.031 | 2783.2 | 0.04 | 1809.4 | 0.125 | 6752.6 | |
| 0.265 | 6358.9 | 0.072 | 5742.1 | 0.36 | 7163.2 | |
| 0.27 | 7761.6 | |||||
| Total field area (ha) | 0.318 | 0.406 | 0. 51 | |||
| Average yield (weighted) | 5701.7 | 6392.4 | 6740.4 | |||
| Yield variability within field (SD) | 1928.5 | 2902.2 | 3006.0 | |||
| Average yield (simple) | 3679.9 | 3972.8 | 4835.6 | |||
Publisher’s Note: MDPI stays neutral with regard to jurisdictional claims in published maps and institutional affiliations. |
© 2021 by the authors. Licensee MDPI, Basel, Switzerland. This article is an open access article distributed under the terms and conditions of the Creative Commons Attribution (CC BY) license (https://creativecommons.org/licenses/by/4.0/).
Share and Cite
MDPI and ACS Style
Sirikun, C.; Samseemoung, G.; Soni, P.; Langkapin, J.; Srinonchat, J. A Grain Yield Sensor for Yield Mapping with Local Rice Combine Harvester. Agriculture 2021, 11, 897. https://doi.org/10.3390/agriculture11090897
AMA Style
Sirikun C, Samseemoung G, Soni P, Langkapin J, Srinonchat J. A Grain Yield Sensor for Yield Mapping with Local Rice Combine Harvester. Agriculture. 2021; 11(9):897. https://doi.org/10.3390/agriculture11090897
Chicago/Turabian StyleSirikun, Chaiyan, Grianggai Samseemoung, Peeyush Soni, Jaturong Langkapin, and Jakkree Srinonchat. 2021. "A Grain Yield Sensor for Yield Mapping with Local Rice Combine Harvester" Agriculture 11, no. 9: 897. https://doi.org/10.3390/agriculture11090897
Note that from the first issue of 2016, this journal uses article numbers instead of page numbers. See further details here.