Article

Trends in Maize Grain Yields across Five Maturity Groups in a Long-Term Experiment with Changing Genotypes

1
Bc Institute for Breeding and Production of Field Crops, Rugvica, Dugoselska 7, 10370 Dugo Selo, Croatia
2
Croatian Meteorological and Hydrological Service, Ravnice 48, 10000 Zagreb, Croatia
3
Faculty of Agriculture, University of Zagreb, Svetošimunska Cesta 25, 10000 Zagreb, Croatia
4
Centre of Excellence for Biodiversity and Molecular Plant Breeding (CroP-BioDiv), Svetošimunska Cesta 25, 10000 Zagreb, Croatia
5
Agricultural Institute Osijek, Južno Predgrađe 17, 31000 Osijek, Croatia
*
Author to whom correspondence should be addressed.
Agriculture 2021, 11(9), 887; https://doi.org/10.3390/agriculture11090887
Submission received: 6 July 2021 / Revised: 4 September 2021 / Accepted: 13 September 2021 / Published: 15 September 2021
(This article belongs to the Section Crop Production)

Abstract

:
Combining experimental studies on grain yield variability with crop model simulations in maize could assist in choosing the optimum maturity group for a certain location, counteracting the effect of climate change. However, studies considering specificities in Southeast Europe are lacking. The objectives were to put various environmental covariates including stress degree days (SDD) into FAO maturity settings to determine the impact of climate change on maize growing in Southeast Europe and to compare trends for grain yields over twenty years of maize experimental and simulation data grouped in five FAO maturity groups (FAO 200–FAO 600). Pre-registration yield trials of maize planted in one location in Croatia grown from 1996 to 2015 were used to determine “potential yield”. Correlation coefficients between 12 climate covariates and grain yield (GY) across the maturity groups revealed the tightest negative associations between SDD and GY that were weakened by later-maturity groups. Similar trends in GY were obtained by both experimental and simulation data, highlighting FAO 600 as a nearly no yield-reducing FAO group over the two decades. Our results indicate that choosing early maize hybrids in Southeast Europe does not seem to be an optimum option in the future, since these hybrids are more sensitive to omnipresent heat stress than late hybrids.

1. Introduction

Planting date and hybrid relative maturity are two decisive factors which set the grain yield potential of maize in a certain environment [1]. In the context of climate change, these factors are becoming more important. The changing climate considerably impacts maize production [2,3,4,5,6,7], causing various abiotic stresses. Along with changing management practices, climate change has had an effect on maize cropping systems in Southeast Europe—the European Corn Belt (parts of Bulgaria, Croatia, Hungary, Romania, and Serbia)—allowing earlier planting and/or growing early-maturity hybrids. These strategies of avoidance are commonly applied in maize where stress can be circumvented by earlier planting dates or planting earlier hybrids to avoid assumed adverse weather conditions, mostly during flowering. However, the global trends in temperature and precipitation indicate that extreme weather events may occur at any time throughout the growing season [1,5,8], including cold spring and late spring frost, thus sometimes making early planting dates not meaningful. This is particularly important for Southeast Europe where maize dent hybrids which are not chilling tolerant are mostly planted.
Nevertheless, in North and West Europe, earliness of varieties is considered as a key adaptation feature [9] resulting in an earlier harvest and a decrease in drying costs. The same trend and reasoning are currently present in Southeast Europe, where farmers reluctantly grow full-season genotypes. However, the late-maturity hybrids can take more of the available heat units, which could be imperative when maize plants experience more heat events and an increase in evaporative demand due to climate change [5].
Crop heat units (CHU) [10], together with growing degree days (GDD) [11] and other various thermal units, are used for rating hybrid maize maturity in North America [12]. On the other hand, the uniform method for maturity rating based on moisture content at harvest recommended by the Food and Agriculture Organization of the United Nations (FAO) [13] is still officially used in Europe [14,15]. Recently, the term “duration of maize life cycle” [16] has been widely used in studies on projections relying on process-based and statistical models to more accurately define the concept of maize maturity phenologically.
In our previous study [17], accumulation rates of “stress degree days (SDD)” [18] during the maize growing season from 1 April to 30 September at two remote sites in Croatia in the last five decades became much higher and more erratic (Supplementary Figure S1), though equivalent in every year. These results are consistent with conclusions on the potential impacts of climate change on global maize production [3,4,6,7,19]. Lobell et al. (2013) [20] demonstrated that extreme heat as a stressor had a more critical role for maize production than drought in the US, corroborating previous statistical studies of rainfed maize yields showing a strong negative yield response to accumulation of extreme temperatures (>30 °C) and a relatively weak response to seasonal rainfall. The predominant effect of extreme degree days is associated with increased vapor pressure deficit (VPD) as a function of temperature and relative humidity, which substantially contributes to water stress. Recently, VPD was used in genetic studies in maize by Millet et al. (2016) [21] and Galić et al. (2019) [22]. Largely, combining experimental studies on genetic and environmental variability with crop model simulations in maize could assist in choosing the optimum maturity group for an environment, counteracting the effect of climate change [16]. However, no study exists which could take into consideration the agronomic and climatic specificities of Southeast Europe.
The objectives of this study were to put various environmental covariates including SDD and VPD into FAO maturity settings to determine the impact of climate change on maize growing in Southeast Europe and to compare trends for grain yields over twenty years of maize experimental and simulated data grouped in five FAO maturity groups (FAO 200–FAO 600).

2. Materials and Methods

Pre-registration yield trials were used to determine “potential yield” based on the best available maize genotypes regularly updated to match breeding progress. Therefore, the number of entries (cultivar candidates) in field trials varied considerably over the years and maturity groups (Supplementary Table S1). Each trial was set as a randomized complete block design in four replicates. The adjacent yield trials of five different maturity groups (FAO 200, 300, 400, 500, 600) were set each year in breeding station Rugvica (N 45.688; E 16.309) near Zagreb, Croatia from 1996 to 2015 on a hydroameliorated vertic amphigley soil. The plough layer (topsoil with a depth of 0.2–0.3 m) has a silty clay loam texture, and the subsoil a silty clay texture, containing 50–55% clay particles. Characteristic of the soil is a high level of groundwater, fluctuating from 0.6 m to 2.42 m below the soil surface. Maize crop was grown in maize–winter wheat crop rotation under high-input production system. The total fertilization rates in one vegetation season ranged from 200 to 250 kg N ha−1, 100 to 150 kg P2O5 ha−1, and 120 to 180 kg K2O ha−1 Plant densities were set according to local recommendations for high-yield production: 81,000 plants/ha (FAO 200), 71,000 plants/ha (FAO 300), 64,000 plants/ha (FAO 400 and 500), and 57,000 plants/ha (FAO 600). Maize germplasm of FAO 200–600 maturity groups is normally cultivated in this region and none is regarded as non-adapted or exotic genetic material. All trials were planted regularly at the end of April, as the established optimum local planting dates. Usual local crop management practice for high-yielding maize was applied according to the local rain-fed regime, taking into account the soil characteristics and the previous cropping. All trials were harvested at the optimum harvest time during September or October depending on the individual maturity groups. Trials were usually harvested when grain moisture content of check hybrids in the trials was approximately 25%. At our location, approximate time of harvest was: the 3rd week of September for FAO 200 trials, the 4th week of September for FAO 300 trials, the 1st week of October for FAO 400 trials, the 2nd week of October for FAO 500 trials, and the 3rd week of October for FAO 600 trials. Grain yield was adjusted to 14% moisture content (in t/ha).
The impact of heat stress on grain yield was estimated:
(a)
Using stress degree days (SDD) calculated as
1 .     SDD 30 = t = 1 N D D t  
3 .     D D t = { 0 ,   w h e n   T a < 30 T a 30 ,   w h e n   T a   30 }
where t represents the daily time step, N is the total number of days in each growing period, DD is degree days, and Ta is air temperature, see also [18,23];
(b)
Using vapor pressure deficit (VPD) calculated as weighted VPD (VPDw) [24], whereby
V P D w = 0.75 × ( V P m a x V P m i n )
where the vapor pressures VPmax and VPmin are medians calculated from measurements of the respective daily maximum and minimum temperatures
VPmax or VPmin = 0.6107 × exp(17.269 × T/(237.3 + T)).
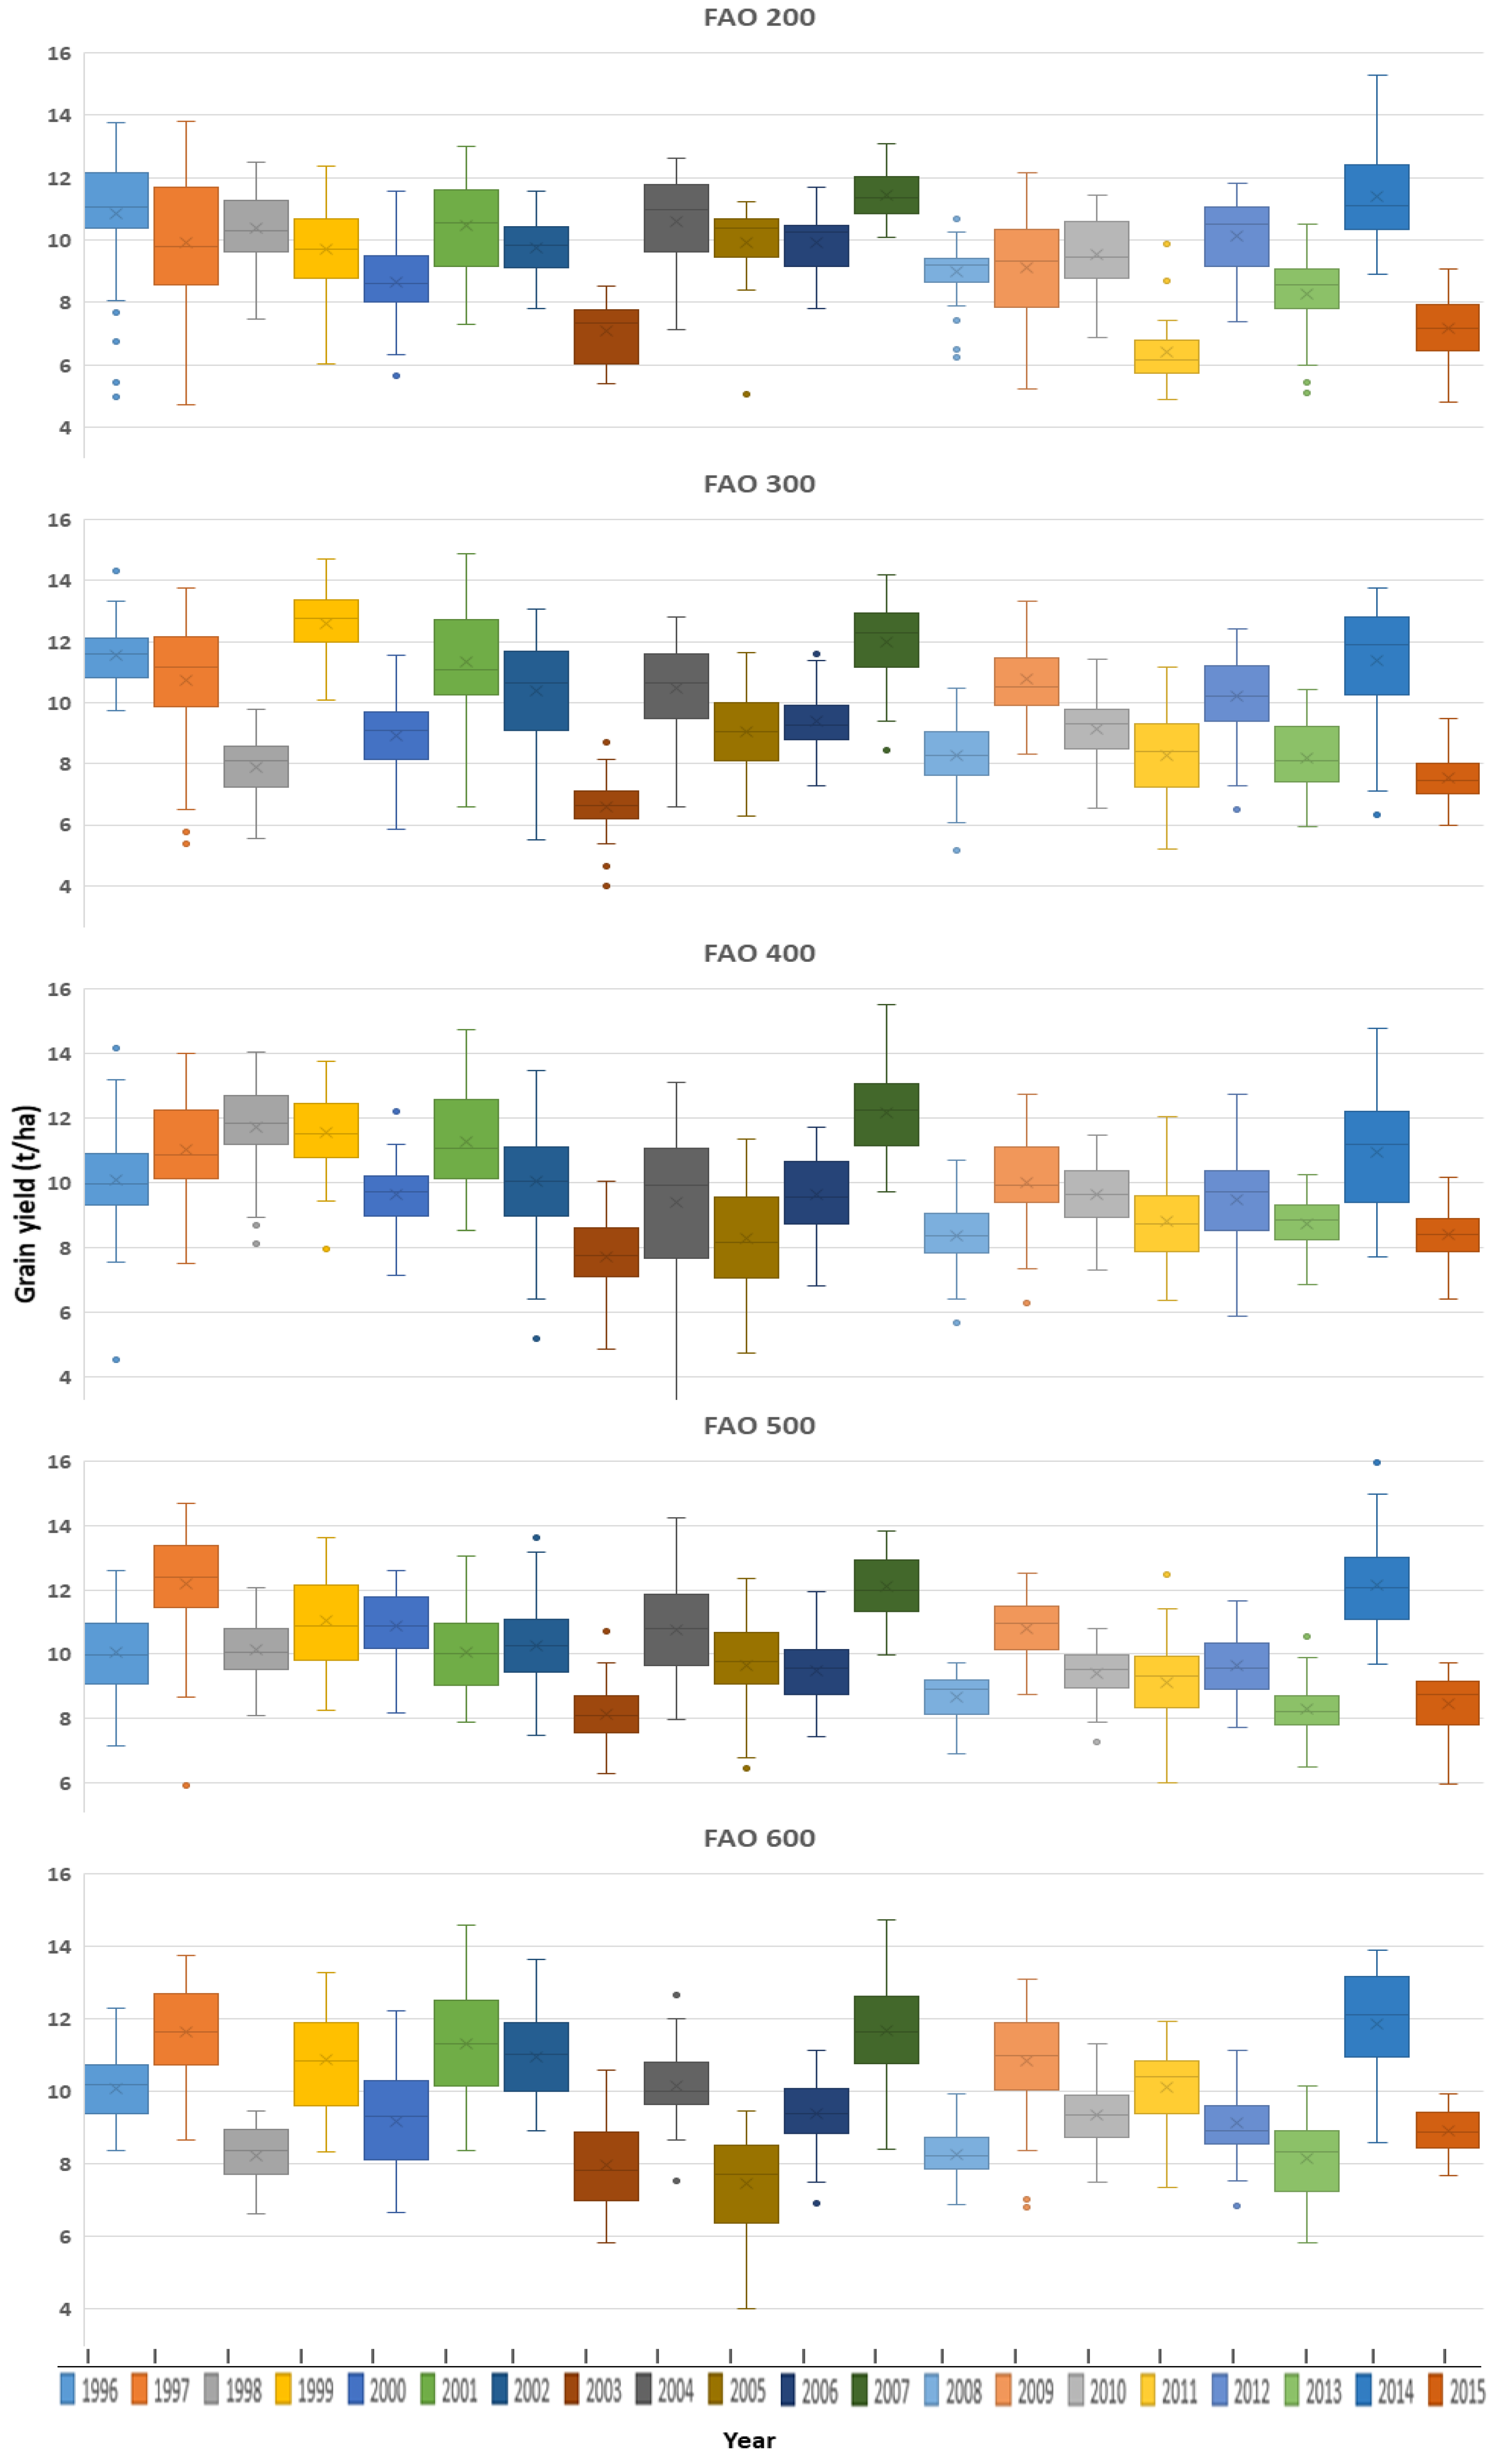
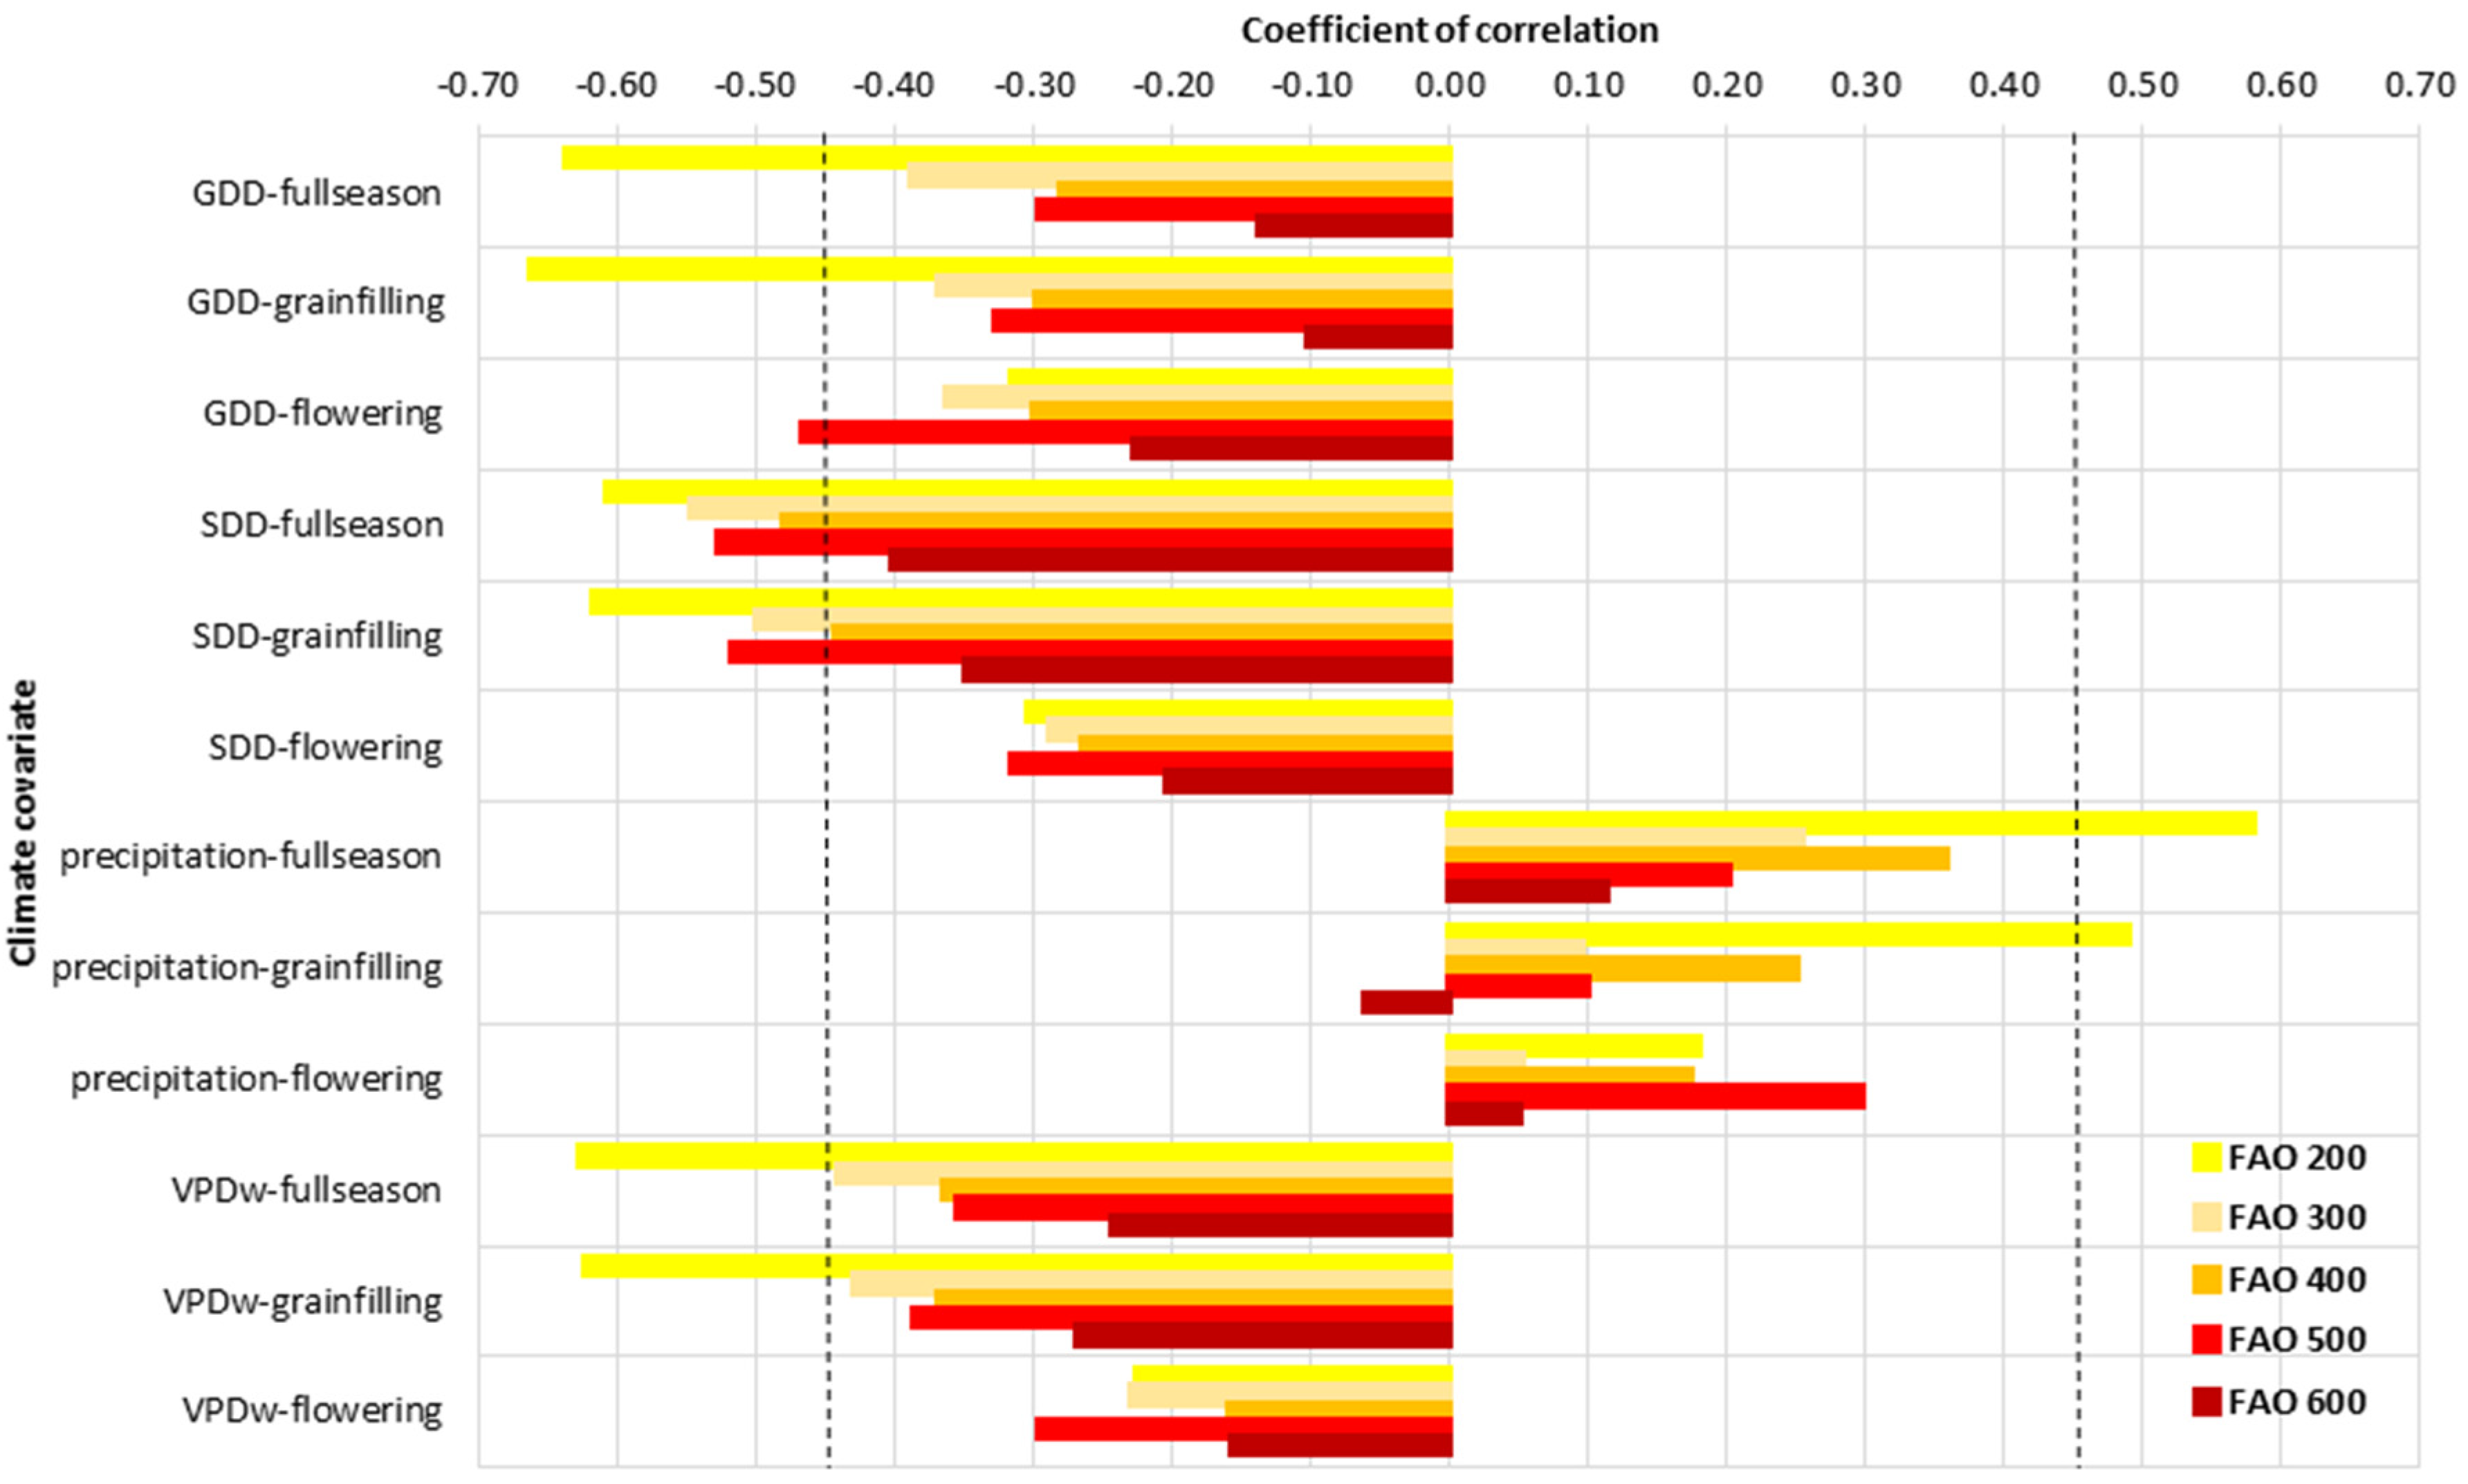
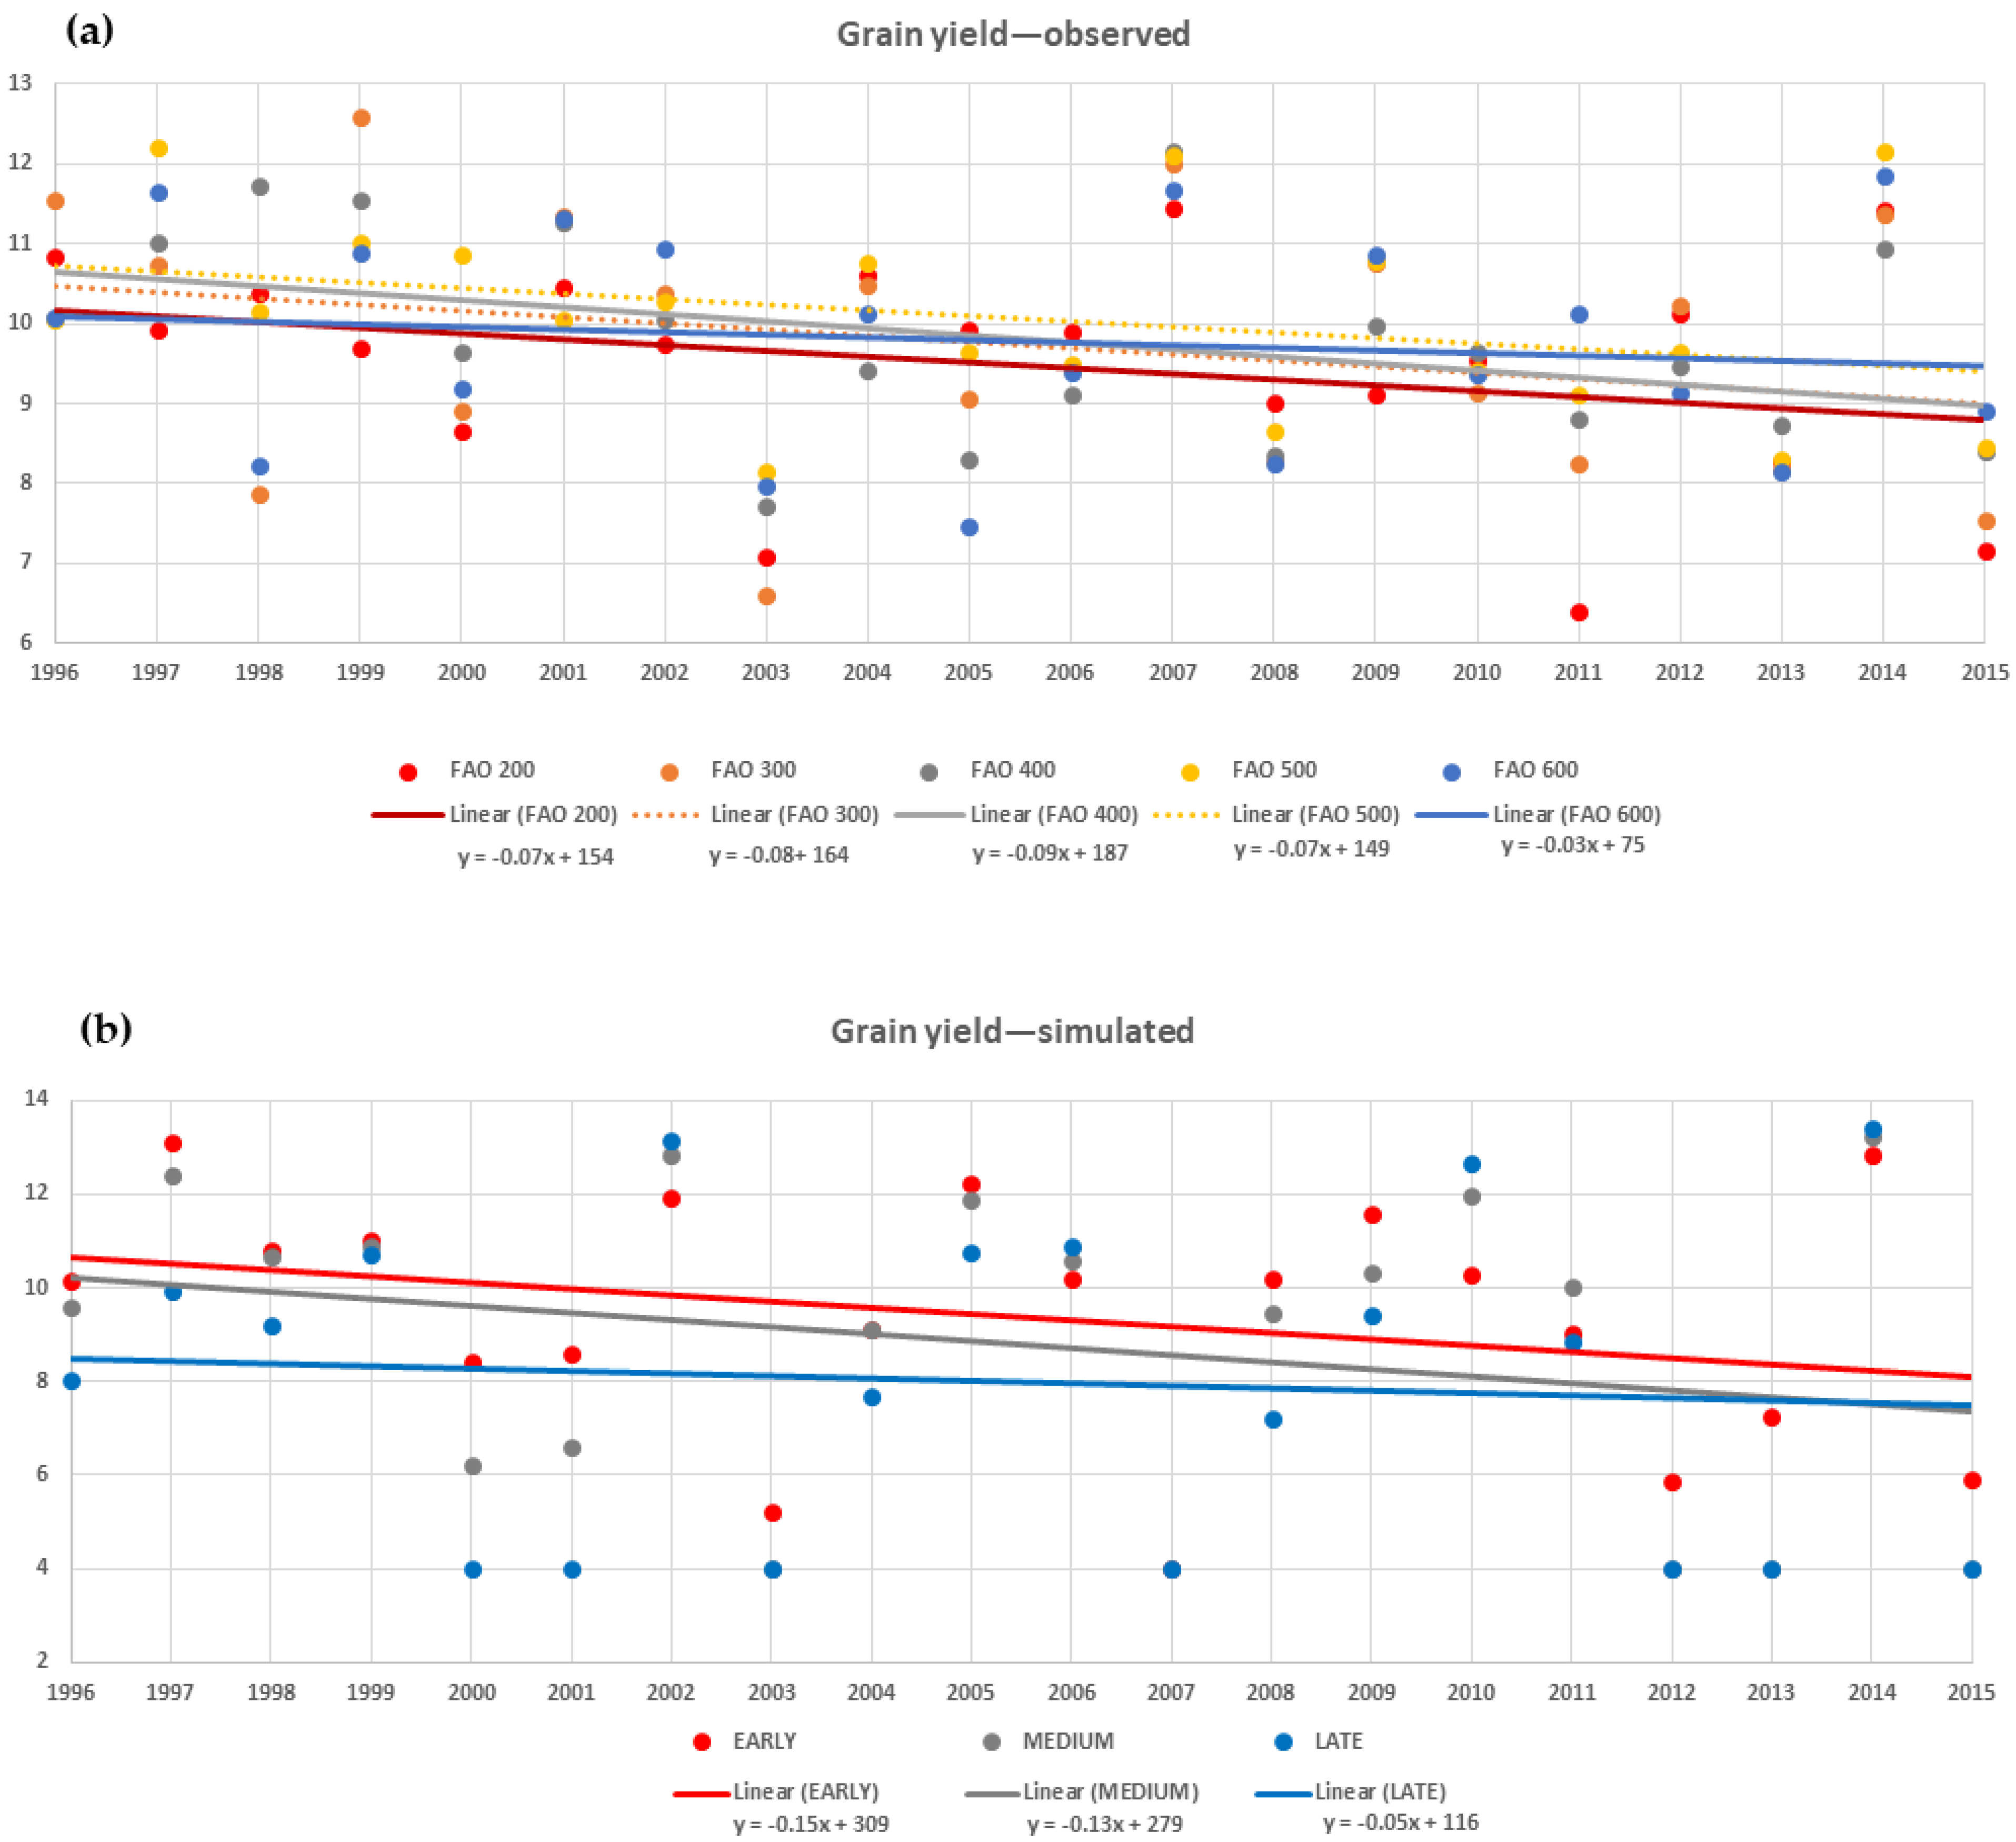
Meteorological values were obtained from the AGRI4CAST database [25] using data for grid No. 79,129 (the grid central point: N 45.68793; E 16.30936) for the period from April 15 to October 1 of each year (Supplementary Figure S2). Meteorological data for SDD calculation were obtained from the Croatian Meteorological and Hydrological Service.
Pearson correlation coefficients were used to analyze relations between environmental parameters (GDD, SDD, precipitation, VPDw during flowering, grain-filling, and full season) and grain yield within five maturity groups. Due to the consistently tightest correlations being between SDD values during full season and grain yield, the data were fitted with a simple linear regression model using average annual yield values within the maturity groups. Grain yield trends from 1996 to 2015 for the maturity groups were estimated using a simple linear regression model for observed and crop-growth simulated data separately. The simulations were performed in APSIM [26] for the same 20-year period with no management constraints, selecting default early, medium, and late maize hybrid options. An uncalibrated model of APSIM evaluations was used, assuming unchanged (invariant) genotypes with a planting density of 80,000 plants/ha (early), 70,000 plants/ha (medium), and 60,000 plants/ha (late hybrid).

3. Results

Average, minimum, and maximum yield varied considerably by year in all maturity groups (Figure 1). Yield values across the maturity groups were not necessarily equivalent for a particular year, indicating maturity group × year interaction. Nevertheless, the highest yields in all maturity groups were consistently reached in 2007 and 2014. Analogously, the lowest yields were detected in 2003 across all maturity groups. Individually, the minimum mean yield of 6.40 t/ha was in 2011 for FAO 200, while the maximum mean yield of 12.60 t/ha was noted in 1999 for the FAO 300 maturity group. Minimum mean yield for all 20 years was obtained for FAO 200 (9.49 t/ha) and the maximum mean yield for FAO 500 (10.06 t/ha) (Supplementary Table S1).
The correlation coefficients between the parameters and grain yield were similar for all three thermal parameters across the five maturity groups, with the tightest negative associations for FAO 200 (Figure 2). Specifically, significant negative correlation coefficients for SDD during the full season were estimated in genotypes of all FAO groups except FAO 600, whereas no significant correlations were detected between grain yield and precipitation at flowering across all maturity groups. Equivalent results for SDD were obtained in regression analysis (Table 1), indicating no significant regression coefficient for genotypes FAO 600.
The same is true for the coefficient of determination between VPDw and grain yield across the maturity groups in the regression analysis (Supplementary Figure S3). During the 20-year period, weighted median VPD values varied considerably from 1.03 kPa in 2014 to 1.70 kPa in 2003, indicating general matching of grain yield and VPD. The relationship between grain yield and VPDw gradually weakened across the maturity groups. The values of the R2 statistic were the highest in FAO 200 (R2 = 0.53), decreasing to R2 = 0.06 in the FAO 600 maturity group.
The year 2014 was one of the best years according to both observed and simulated data (Figure 3). Generally, the simulation followed the observed results well, with the lowest (or next to the lowest) yields across all FAO groups in 2003, which was the worst year according to SDD accumulation in all 20 (55) years. The only year that was not well predicted was 2007. Regression analysis revealed negative observed yield trends for FAO 200–500, and stagnation for FAO 600 over the years. Almost the same trends were obtained by the simulation, highlighting FAO 600 as a nearly no yield-reducing FAO group over the two decades.

4. Discussion

Determining stress in maize by SDD is well-established concept and has been used for decades, appearing also in recent studies [23,27]. Using the SDD units in our previous study [17], severe weather conditions during the maize growing season were detected (Supplementary Figure S1). SDD values for Osijek (250 km away on the East) were included to show similar amplitudes of SDD values in a particular year for the two remote sites, suggesting possible generalization of the severe weather pattern for the whole European Corn Belt. SDD values were tightly correlated with comparable parameters of GDD (r = 0.816) and VPDw (r = 0.849). Interestingly, the correlation between GDD and VPDw values was tightest, with r = 0.909, in the experimental site for the period from 1996 to 2015. Thus, all three thermal parameters produce similar results, as shown in Figure 2 by comparing associations between yield and the parameters across different maturity groups.
Non-significant correlations between grain yield and precipitation in our study (except for FAO 200) corroborate the findings of Lobell et al. (2013) [20] and other studies in the US about the weak response of grain yield to seasonal rainfall. The only exception is grain yield in 2007. According to SDD units, 2007 is one of the ten years with the largest sums of SDD, and probably one of the top three years with the worst impact on seed production at our location, expecting a similar impact on pre-registration trials, which was also reflected in our simulation (Figure 3). However, it was on average one of the best-yielding years. It seems that high precipitation of 101.6 mm in August had a positive effect on recovery during grain filling and eventually on grain yield.
The negative impact of extreme heat on maize grain yields due to climate change has been reported in studies from different parts of the world: the United States [6,20], China [28], Brazil [29], and Africa [4]. Severe weather, primarily heat, had a stronger effect on earlier-maturity groups, as indicated in our results across five maturity groups. Similar results were presented in comparable official plant variety trials (VCU) in Croatia, where a greater component of variance for year was noted in earlier maize maturity groups [30]. Generally, grain yield declined during the twenty years of our experiment in all FAO groups; however, the decrease was the smallest in FAO 600.
Nevertheless, it was demonstrated that maize yields may increase in spite of climate change if farmers continuously adapt maize cycle duration (maturity) and planting dates to local environmental conditions [31,32]. In France, it was concluded that whatever the planting date, higher temperatures in the future will be favorable for late maize varieties in the northern part of the country [33]. Similar results were presented for Northern China [34] where middle-maturing varieties could be replaced with late-maturing ones in Liaoning Province. Comparable shifting to late-maturing hybrids is expected in Southeast Europe according to series of APSIM simulations, especially when water regime (irrigation) is appropriately changed [16]. Parent et al., 2018, concluded that genetic variability for adapting crop cycle duration exists and is available across Europe. Indeed, a study from Serbia demonstrated that there was genetic progress for grain yield in different varieties of the FAO 600 maturity group registered from 1978 to 2011, representing different breeding periods [35].
In our research, earlier-maturity groups were planted as usual at higher densities than later-maturity groups. Though newer hybrids have better tolerance to stresses, increased plant population density can be detrimental under drought conditions [36,37]. In our study, in 3 out of 20 years there was only approximately 300 mm of precipitation from April to September (data not shown). For locations with a similar amount of precipitation (planting to physiological maturity) in semiarid Western Nebraska, dryland maize growers are advised to use a population of 3 plants/m2 as a base recommendation [36].
Djaman et al. (2020) [38] studied the relationship between relative maturity and grain yield of maize hybrids in Northwest New Mexico for the 2003–2019 period. The results show a non-significant increase in grain yield in early-season hybrids and non-significant decrease in grain yield with relative maturity in full-season hybrids. The study of Baum et al. (2019) [1] showed that early-season and full-season maize hybrids produced similar yields regardless of their planting date if they reached physiological maturity before harvesting. The highest mean/average yield during the 20 years covered by our study was recorded for the FAO 500 maturity group (10.06 t/ha), but the difference between the FAO 300 and FAO 500 maturity groups was only 0.3 t/ha (Supplementary Table S1). In such situations, moisture content at harvest would be even more important. The research conducted in Ohio showed that ultra-early hybrids had lower drying costs and higher test weights than the commonly grown (later) maturity hybrids, and for some of them the partial return per acre did not differ from the commonly grown maturities [39]. The impact of high grain moisture at harvest on the profit reduction, when choosing between planting short- (earlier) and full-season hybrids, due to increased drying cost was also stressed in a study from Iowa, USA [1].
Marton et al. (2003) [40] showed that in late September in Hungary, the difference between the grain moisture content of the earliest (FAO 200) and latest (FAO 500) hybrids was 8.9%, and a similar situation also can be expected in Croatia at the beginning of harvest. This may probably explain why the majority of Croatian farmers grow approximately 70% of the FAO maturity groups 300 and 400 (Agricultural Institute Osijek, Croatia and Bc Institute, Croatia—unpublished data), despite the expectation that in favorable years the FAO 500 and 600 maturity groups will yield more.
According to the results of the present study, planting predominantly early maize hybrids in the European Corn Belt does not seem to be an optimum option in the future, since these hybrids are more sensitive to omnipresent heat stress than late hybrids. However, it was previously demonstrated in VCU trials in Croatia that the location × year interaction significantly contributed to the total variance in maize grain yield [30], which could not be captured in the present study. Thus, our next step will be to analyze robust multilocational official long-term VCU data across several maize maturity groups to disentangle the effects of climate change from those of genetic progress and of all other agronomic factors changed over time.

5. Conclusions

Heat stress degree days (SDD) during the grain-filling and full season were more tightly associated with grain yield than other climate covariates across five FAO maturity groups in maize. Both experimental and simulation data demonstrate that grain yield in Southeast Europe is more affected in early maize hybrids than late ones, apparently due to omnipresent heat stress.

Supplementary Materials

The following are available online at https://www.mdpi.com/article/10.3390/agriculture11090887/s1, Figure S1: Stress degree days for Zagreb and Osijek (Croatia) during the period of 1961 to 2016, Figure S2: Long-term average climate data (1979–2019) for Rugvica near Zagreb, Croatia (N 45.688; E 16.309), Table S1: An overview of the field trials grown in Rugvica, Croatia (N 45.688; E 16.309) in the period 1996–2015 with number of entries (NoE), the total mean for grain yield (t/ha), and respective standard error (SE), Figure S3: Relationship between grain yield and weighted vapor pressure deficit (VPDw) across five maturity groups (FAO 200–FAO 600) in the experiment during the period of 1996 to 2015.

Author Contributions

Conceptualization, I.B., D.K., Z.K., M.J., and D.Š.; methodology, I.B., J.G., H.Š., and D.Š.; formal analysis, H.Š., J.G., and D.Š.; investigation, I.B., Z.K., and M.J.; resources, Z.K.; data curation, D.K. and D.S.; writing—original draft preparation, I.B. and D.Š.; writing—review and editing, I.B., M.J., J.G., H.Š., D.S., and D.Š. All authors have read and agreed to the published version of the manuscript.

Funding

This research was funded by the program of development of new maize varieties at the Bc Institute and by the EU project “Biodiversity and Molecular Plant Breeding”, grant number KK.01.1.1.01.0005, of the Centre of Excellence for Biodiversity and Molecular Plant Breeding (CroP-BioDiv), Zagreb, Croatia.

Data Availability Statement

1. Publicly available weather datasets were analyzed in this study. These data can be found here: https://meteo.hr/index_en.php (accessed on 6 May 2021) and https://agri4cast.jrc.ec.europa.eu/DataPortal/Index.aspx (accessed on 5 April 2021). 2. The detailed grain yield data presented in this study are available on request from the corresponding author.

Conflicts of Interest

The authors declare no conflict of interest.

References

  1. Baum, M.E.; Archontoulis, S.V.; Licht, M.A. Planting date, hybrid maturity, and weather effects on maize yield and crop stage. Agron. J. 2019, 111, 303–313. [Google Scholar] [CrossRef] [Green Version]
  2. Pachauri, R.K.; Allen, M.R.; Barros, V.R.; Broome, J.; Cramer, W.; Christ, R.; Church, J.A.; Clarke, L.; Dahe, Q.; Dasgupta, P.; et al. Climate Change 2014: Synthesis Report. Contribution of Working Groups I, II and III to the Fifth Assessment Report of the Intergovernmental Panel on Climate Change; IPCC: Geneva, Switzerland, 2014; p. 151. [Google Scholar]
  3. Lobell, D.B.; Field, C.B. Global scale climate-crop yield relationships and the impacts of recent warming. Environ. Res. Lett. 2007, 2, 014002. [Google Scholar] [CrossRef]
  4. Lobell, D.B.; Banziger, M.; Magorokosho, C.; Vivek, B. Nonlinear heat effects on African maize as evidenced by historical yield trials. Nat. Clim. Chang. 2011, 1, 42–45. [Google Scholar] [CrossRef]
  5. Lobell, D.B.; Roberts, M.J.; Schlenker, W.; Braun, N.; Little, B.B.; Rejesus, R.M.; Hammer, G.L. Greater sensitivity to drought accompanies maize yield increase in the U.S. Midwest. Science 2014, 344, 516–519. [Google Scholar] [CrossRef] [PubMed]
  6. Schlenker, W.; Roberts, M.J. Nonlinear temperature effects indicate severe damages to U.S. crop yields under climate change. Proc. Natl. Acad. Sci. USA 2009, 106, 15594–15598. [Google Scholar] [CrossRef] [Green Version]
  7. Ray, D.K.; West, P.C.; Clark, M.; Gerber, J.S.; Prishchepov, A.V.; Chatterjee, S. Climate change has likely already affected global food production. PLoS ONE 2019, 14, e0217148. [Google Scholar] [CrossRef] [PubMed]
  8. Lee, E.A.; Deen, W.; Hooyer, M.E.; Chambers, A.; Parkin, G.; Gordon, R.; Singh, A.K. Involvement of year-to-year variation in thermal time, solar radiation and soil available moisture in genotype-by-environment effects in maize. Crop Sci. 2016, 56, 2180–2192. [Google Scholar] [CrossRef]
  9. Signor, C.E.L.; Dousse, S.; Lorgeou, J.; Denis, J.B.; Bonhomme, R.; Carolo, P.; Charcosset, A. Interpretation of genotype× environment interactions for early maize hybrids over 12 years. Crop Sci. 2001, 41, 663–669. [Google Scholar] [CrossRef]
  10. Brown, D.M.; Bootsma, A. Crop Heat Units for Corn and Other Warm-Season Crops in Ontario; Ontario Ministry of Agriculture and Food: Toronto, ON, Canada, 1993. [Google Scholar]
  11. Wang, J.Y. A critique of the heat unit approach to plant response studies. Ecology 1960, 41, 785–790. [Google Scholar] [CrossRef]
  12. Dwyer, L.M.; Stewart, D.W.; Carrigan, L.; Ma, B.L.; Neave, P.; Balchin, D. Guidelines for comparisons among different maize maturity rating systems. Agron. J. 1999, 91, 946–949. [Google Scholar] [CrossRef]
  13. Jugenheimer, R.W. Corn Improvement, Seed Production and Uses, A Wiley-Interscience Publication; University of Illinois, John Wiley & Sons: New York, NY, USA, 1978. [Google Scholar]
  14. EC (European Community). Council Directive 2002/53/EC of 13 June 2002 on the common catalogue of varieties of agricultural plant species. Off. J. Eur. Commun. 2002, 45, L193. [Google Scholar]
  15. EC (European Commission). Common catalogue of varieties of agricultural plant species—Supplement 2020/1. Off. J. Eur. Commun. 2020, 63, C71. [Google Scholar]
  16. Parent, B.; Leclere, M.; Lacube, S.; Semenov, M.A.; Welcker, C.; Martre, P.; Tardieu, F. Maize yields over Europe may increase in spite of climate change, with an appropriate use of the genetic variability of flowering time. Proc. Natl. Acad. Sci. USA 2018, 115, 10642–10647. [Google Scholar] [CrossRef] [Green Version]
  17. Buhiniček, I.; Kaučić, D.; Kozić, Z.; Vragolović, A.; Gunjača, J.; Šarčević, H.; Jukić, M.; Stepinac, D. Stress heat units and grain yields of maize testcrosses during 20 years of breeding. In Proceedings of the Book of Abstracts of 52nd Croatian & 12th International Symposium on Agriculture, Dubrovnik, Croatia, 12–17 February 2017; p. 76. [Google Scholar]
  18. Idso, S.B.; Jackson, R.D.; Pinter, P.J., Jr.; Reginato, R.J.; Hatfield, J.L. Normalizing the stress-degree-day parameter for environmental variability. Agric. Meteorol. 1981, 24, 45–55. [Google Scholar] [CrossRef]
  19. Jones, P.G.; Thornton, P.K. The potential impacts of climate change on maize production in Africa and Latin America in 2055. Glob. Environ. Chang. 2003, 13, 51–59. [Google Scholar] [CrossRef]
  20. Lobell, D.B.; Hammer, G.L.; McLean, G.; Messina, C.; Roberts, M.J.; Schlenker, W. The critical role of extreme heat for maize production in the United States. Nat. Clim. Chang. 2013, 3, 497–501. [Google Scholar] [CrossRef]
  21. Millet, E.J.; Welcker, C.; Kruijer, W.; Negro, S.; Coupel-Ledru, A.; Nicolas, S.D.; Laborde, J.; Bauland, C.; Praud, S.; Ranc, N.; et al. Genome-wide analysis of yield in Europe: Allelic effects vary with drought and heat scenarios. Plant Physiol. 2016, 172, 749–764. [Google Scholar] [CrossRef]
  22. Galić, V.; Franić, M.; Jambrović, A.; Ledenčan, T.; Brkić, A.; Zdunić, Z.; Šimić, D. Genetic correlations between photosynthetic and yield performance in maize are different under two heat scenarios during flowering. Front. Plant Sci. 2019, 10, 566. [Google Scholar] [CrossRef] [PubMed]
  23. Zhu, P.; Zhuang, Q.; Archontoulis, S.V.; Bernacchi, C.; Müller, C. Dissecting the nonlinear response of maize yield to high temperature stress with model-data integration. Glob. Chang. Biol. 2019, 25, 2470–2484. [Google Scholar] [CrossRef] [PubMed]
  24. Tanner, C.B.; Sinclair, T.R. Efficient water use in crop production: Research or research? In Limitations to Efficient Water Use in Crop Production; Taylor, H.M., Jordan, W.R., Sinclair, T.R., Eds.; ASA CSSA and SSSA: Madison, WI, USA, 1983; pp. 1–27. [Google Scholar]
  25. AGRI4CAST Resources Portal. Available online: https://agri4cast.jrc.ec.europa.eu/DataPortal/Index.aspx (accessed on 2 May 2021).
  26. Holzworth, D.P.; Huth, N.I.; Devoil, P.G.; Zurcher, E.; Herrmann, N.; McLean, G.; Chenu, K.; van Oosterom, E.J.; Snow, V.; Murphy, C.; et al. APSIM–evolution towards a new generation of agricultural systems simulation. Environ. Model. Softw. 2014, 62, 327–350. [Google Scholar] [CrossRef]
  27. Costa-Filho, E.; Chávez, J.L.; Comas, L. Determining maize water stress through a remote sensing-based surface energy balance approach. Irrig. Sci. 2020, 38, 1–18. [Google Scholar] [CrossRef]
  28. Tao, F.; Yokozawa, M.; Liu, J.; Zhang, Z. Climate-crop yield relationships at provincial scales in China and the impacts of recent climate trends. Clim. Res. 2008, 38, 83–94. [Google Scholar] [CrossRef]
  29. Sakurai, G.; Iizumi, T.; Yokozawa, M. Varying temporal and spatial effects of climate on maize and soybean affect yield prediction. Clim. Res. 2011, 49, 143–154. [Google Scholar] [CrossRef] [Green Version]
  30. Zorić, M.; Gunjača, J.; Šimić, D. Genotypic and environmental variability of yield from seven different crops in Croatian official variety trials and comparison with on-farm trends. J. Agric. Sci. 2017, 155, 804–811. [Google Scholar] [CrossRef] [Green Version]
  31. Butler, E.E.; Huybers, P. Adaptation of US maize to temperature variations. Nat. Clim. Chang. 2013, 3, 68–72. [Google Scholar] [CrossRef]
  32. Moore, F.C.; Lobell, D.B. Adaptation potential of European agriculture in response to climate change. Nat. Clim. Chang. 2014, 4, 610–614. [Google Scholar] [CrossRef]
  33. Caubel, J.; de Cortazar-Atauri, I.G.; Vivant, A.C.; Launay, M.; de Noblet-Ducoudré, N. Assessing future meteorological stresses for grain maize in France. Agric. Syst. 2018, 159, 237–247. [Google Scholar] [CrossRef]
  34. Liu, Z.; Yang, X.; Chen, F.; Wang, E. The effects of past climate change on the northern limits of maize planting in Northeast China. Clim. Chang. 2013, 117, 891–902. [Google Scholar] [CrossRef]
  35. Mitrović, B.; Stojaković, M.; Zorić, M.; Stanisavljević, D.; Bekavac, G.; Nastasić, A.; Mladenov, V. Genetic gains in grain yield, morphological traits and yield stability of middle-late maize hybrids released in Serbia between 1978 and 2011. Euphytica 2016, 211, 321–330. [Google Scholar] [CrossRef]
  36. Lyon, D.J.; Hammer, G.L.; McLean, G.B.; Blumenthal, J.M. Simulation supplements field studies to determine no-till dryland corn population recommendations for semiarid western Nebraska. Agron. J. 2003, 95, 884–891. [Google Scholar] [CrossRef] [Green Version]
  37. Tokatlidis, I.S. Adapting maize crop to climate change. Agron. Sustain. Dev. 2013, 33, 63–79. [Google Scholar] [CrossRef] [Green Version]
  38. Djaman, K.; Owen, C.; West Margaret, M.; Allen, S.; Koudahe, K.; Darapuneni, M.; O’Neill, M. Relationship between relative maturity and grain yield of maize (Zea mays L.) hybrids in northwest New Mexico for the 2003–2019 period. Agriculture 2020, 10, 290. [Google Scholar] [CrossRef]
  39. Lindsey, A.J.; Minyo, R.; Geyer, A.B.; Thomison, P.R. Comparing the agronomic performance of short-season and commonly grown corn hybrid maturities in Ohio. Crop Forage Turfgrass Manag. 2020, 6, e20019. [Google Scholar] [CrossRef] [Green Version]
  40. Marton, L.C.; Árendás, T.; Bónis, P. Grain Moisture of Maize Hybrids in Different Maturity Groups at Various Harvesting Dates. Acta Agrar. Debreceniensis 2003, 24–25. [Google Scholar] [CrossRef] [PubMed]
Figure 1. Boxplots of maize grain yield in the pre-registration experiment across five maturity groups (FAO 200–FAO 600) during the period of 1996 to 2015.
Agriculture 11 00887 g001
Figure 2. Correlation coefficients between 12 climate covariates and maize grain yield for five maturity groups (FAO 200–FAO 600) in the experiment during the period of 1996 to 2015. The dashed vertical lines denote significance level at p < 0.05.
Agriculture 11 00887 g002
Figure 3. Grain yield trend during the period of 1996 to 2015 in Rugvica near Zagreb, Croatia in maize hybrids differing in maturity groups according to: (a) observed data in the experiment (FAO 200–FAO 600) and (b) APSIM simulated data (early–medium–late).
Agriculture 11 00887 g003
Table 1. Coefficients of regression of maize grain yield (t/ha) on SDD full-season values. SE, t, and p are the standard error, the t statistic, and p value of the fitted parameter.
FAO GroupTermEstimateSEtp
200Intercept10.6320.43424.483<0.001
Slope−0.0350.011−3.2470.004
300Intercept10.9650.54320.178<0.001
Slope−0.0370.013−2.7810.012
400Intercept10.6510.44124.166<0.001
Slope−0.0250.011−2.3250.032
500Intercept10.9520.41526.415<0.001
Slope−0.0270.010−2.6380.017
600Intercept10.5300.49521.259<0.001
Slope−0.0230.012−1.8610.079
Publisher’s Note: MDPI stays neutral with regard to jurisdictional claims in published maps and institutional affiliations.

