Article

Organic Food Needs More Land and Direct Energy to Be Produced Compared to Food from Conventional Farming: Empirical Evidence from the Czech Republic

by
Radka Redlichová
,
Gabriela Chmelíková
*,
Ivana Blažková
,
Eliška Svobodová
and
Inez Naaki Vanderpuje
Department of Regional and Business Economics, Faculty of Regional Development and International Studies, Mendel University in Brno, 613 00 Brno, Czech Republic
*
Author to whom correspondence should be addressed.
Agriculture 2021, 11(9), 813; https://doi.org/10.3390/agriculture11090813
Submission received: 18 July 2021 / Revised: 15 August 2021 / Accepted: 24 August 2021 / Published: 27 August 2021
(This article belongs to the Special Issue Agriculture and Food Systems – Global and Local Comparisons)

Abstract

:
This study investigated direct energy consumption and land performance under two different methods of farming—organic and conventional. The aim of our study was to examine the performance of farmers in the Czech Republic and identify the differences between organic and conventional farming regarding food safety and direct energy consumption. Based on the data from the Farm Accountancy Data Network of the EU, we measured the performance of both organic and conventional farmers in terms of product per unit of land and direct energy consumption per unit of product regarding the natural condition of the farm localization. Our findings show that organic farms produce lower output with less direct energy per unit of land; however, they need more direct energy for one unit of production. We found that a product from organic agriculture consumes 1.7-fold greater direct energy than a conventional product. The worse the natural conditions for farming, the broader the difference between organic and conventional regimes regarding their performance and energy consumption. Our conclusions may help shape agricultural policy in the Czech Republic, where organic farming is receiving systematic political support, leading to an increase in the proportion of organically farmed arable land.

1. Introduction

Developed countries have recently shown significant interest in the quality of food, which has become an object of societal communication and a factor in people’s lifestyles. It is generally believed that food from organic agriculture is healthier than conventionally produced food [1,2,3]. Organic food, and thus organic farming, are gaining increasing popularity not only due to the perceived effects of organic food on human health, but also due to the general concerns about the negative impacts of conventional agriculture on the environment [4,5,6]. As stated by Seufert and Ramankutty [7] and Mercati [8], organic farming is perceived to be better for the environment, climate protection, and animal welfare, particularly in developed countries such as those of Europe. Based on these beliefs, governments in developed countries are subsidizing organic farming, thus resulting in its expansion. Sartaj et al. [9] claims that organic farming should become an important strategy in common agricultural practices. However, there remain some unanswered questions: is organic farming an appropriate means to feed the population? Does it cause less harm to the environment in comparison to conventional agriculture? Regarding the academic literature, opinions on organic farming in the context of global sustainable development vary widely. For example, organic farming is seen as having significant potential to feed the population in an environmentally friendly way [10,11]. In contrast, some authors have noted the production inefficiency of organic farming [12,13].
The current agro-industrial systems are characterized by a high level of intensity in the use of natural resources, especially soil and natural conditions associated with soil habitats [14]. The intensification of agricultural production is based mainly on technological innovations, high-yielding crop varieties, and the use of synthetic fertilizers and pesticides, in addition to scientific and technological advances in mechanization and automation of production processes. This has led to labor substitution, increases in technical productivity, and the reduction in employment in agriculture, and has made a significant contribution to agricultural productivity growth and food security [15]. Simultaneously, the issue of energy consumption has also raised [16], because energy consumption is an important part of sustainable development in agriculture [17]. In addition, energy is considered a major factor in economic development and wealth creation [18]. Thus, its importance has been extensively analyzed from various perspectives (e.g., [16,19,20]). Economic growth is associated with growth in production and consumption, which leads to an increase in the demand for energy [16]. In addition, the current trend of the growing population and insufficient food security in some parts of the world (current estimates published by FAO [21] show that nearly 690 million people are still hungry or undernourished, especially in Africa and Asia) will inevitably lead to an increase in agricultural production [22,23]. This places emphasis on the input-intensive agricultural production systems that are generally considered to cause environmental problems [24,25]. Implementing agricultural systems and technologies that increase production while reducing the negative effects on the environment has become a key challenge in addressing this issue [4,26].
The growth in the population and consumption lead to an increase in the demand for food. Godfray et al. [27] claim that increased demand for food will intensify the competition for land, which will affect our ability to produce food. Moreover, plant-based products are replacing unrenewable energy resources, resulting in growing demand for land. Therefore, there is an urgent requirement to reduce the impact of the food system on land use and energy consumption, and to address the question of whether organic farming is the key to solving these problems. In addressing this question, it is necessary to assess the yield effects of individual types of farming. The comparison of land yields in conventional and organic farming therefore remains the key issue. Solving this dichotomy has prompted several empirical studies that compare the yield effects in organically and conventionally means of farming (inter alia: [11,28] or [29]). The first mentioned study by Badgley et al. [11] produced surprising results. The authors compared yields of organic and conventional farming separately for developed and developing countries. They found that, in the developing world, the average yield was higher in organic farms than in their non-organic counterparts. The situation in developed countries was the opposite. Based on these findings the authors claimed: “Model estimates indicate that organic methods could produce enough food on a global per capita basis to sustain the current human population, and potentially an even larger population, without increasing the agricultural land base” [11] (p. 86). This provocative statement called for further empirical investigation, which revealed the opposite results. Connor [28] carried out a critical analysis of Badgley’s study and pointed to some inaccuracies in the original research. He concluded that organic farming production would not be sufficient to feed the global population. Another critical response was presented by Goulding et al. [29], who examined the productivity of wheat, as a major crop and food source, in conventional and organic agriculture. They arrived at opposing conclusions to those of Badgley et al. [11] and stated that organic systems cannot produce enough food to sustain the population. A considerable body of research has focused on the criticism of these findings. Seufert et al. [26] showed that under certain conditions (specific crop types, management practices), organic yields can almost match those of conventional systems, and thus support optimistic predictions of the productivity of organic agriculture. Ponisio et al. [30] contributed to the debate about the yield gap between organic and conventional production with an analysis of a bigger meta-dataset than that used in previous studies. They concluded with similar results as those of Seufert et al. [26], and recommended improving organic management systems because, under specific conditions, organic agriculture can eliminate the yield gap. A recent study by Muller et al. [31] claimed that none of the discussed agricultural strategies should be implemented in full. They recommended combining the partial implementation of both systems with simultaneous lowering of food wastage and reduction of consumption of animal products.
Similarly, regarding the quality of food, it is widely believed that organic farming represents a lower environmental burden in comparison with conventional agriculture. This idea provides political support for subsidizing organic farmers. However, the evidence on energy use in organic and conventional agriculture is ambiguous. Clark and Tilman [32] and Tuomisto et al. [33] show that organic systems use less energy per unit of output, and Gomiero et al. [34] claim that organic farmers use less energy per unit of land. However, Redlichová et al. [14] claim the opposite regarding the consumption of energy per unit of output. Tuomisto et al. [33] systematically analyzed empirical studies that compared organic and conventional systems of farming and their environmental impacts. He noted that not all studies reach the same conclusions, particularly in the case of energy use per production unit. However, he found that organic agriculture exhibits a better influence on the environment per unit of land. Gomiero et al. [34] claimed that data for organic farming indicates lower fossil energy consumption both per unit of land and per product unit. Nevertheless, Redlichová et al. [14] showed, based on data from Czech farmers, that consumption of direct energy per unit of product is higher in organic farming systems than in their conventional counterparts.
Organic agriculture in the Czech Republic is being given a systematic political support, which has led to an increasing proportion of arable land that is being farmed organically—15% of agricultural land in 2019 [35]. The above-mentioned studies revealed ambiguous results in the comparison of yield effects in organic and conventional means of farming. Hence concerns have arisen about food self-sufficiency (FSS) in the Czech Republic. Food self-sufficiency is defined as the ability of a region to meet its food requirements [36]. In general, a population is dependent on natural resources and available foods to meet its daily food demand; thus, a region can increase the stability of its food system by establishing its own food self-sufficiency. The level of FSS in the Czech Republic is 80%, and, in Central Europe, only Slovakia has reached a lower level, of 71%. The growing global demand for food and other plant products has increased the competition for land, which, however, is used to generate different outputs under different agricultural systems. It is, therefore, necessary to assess the yield effects of individual types of farming and offer insights for agriculture policy in the Czech Republic.
In this study, we aimed to fulfill this research gap by examining the performance of farmers in the Czech Republic and to highlight differences between organic and conventional farming concerning land use and direct energy consumption. We distinguished between direct and indirect energy (direct energy comprises consumed fuels, electricity, energy consumed for heating, and other direct energy; indirect energy is used to produce all other inputs, e.g., fertilizers, machinery processes, or labor). Similar to the studies of Moghaddasi and Pour (2016) [37] and Zhang et al. (2019) [19], in our analysis we focused on the direct energy consumed in agriculture.
Our goal was to compare the consumption of two main factors of production—land and direct energy—under different regimes of farming. The choice of these two factors of production was motivated by their limited availability. Land, and fossil fuels used to produce direct energy inputs, are limited and unrenewable factors of agricultural production. Based on the above discussion, we empirically investigated our overarching research question regarding the extent to which the choice of farming regime is linked to different levels of land performance and use of direct energy.
Although the empirical findings regarding the land and direct energy use under different ways of farming are ambiguous, our starting point was the assumption that organic farming requires more land and direct energy to produce the same product. To research this conjecture, we develop two hypotheses:
Hypothesis 1 (H1).
Production per unit of land is higher in conventional farming than in organic farming.
Hypothesis 2 (H2).
Direct energy consumption per unit of product is lower in conventional farming than in organic farming.
To investigate our hypotheses, we constructed a dataset by drawing on the Farm Accountancy Data Network, which enabled us to investigate these hypotheses under different natural conditions and for different production orientations. In our analysis we aimed to identify differences in land use and direct energy consumption with respect to natural constraints of farming because these qualities are essential in the agricultural policymaking process in the Czech Republic.

2. Materials and Methods

2.1. Data

The main data source for the analysis was the FADN CZ database–Farm Accountancy Data Network of the Czech Republic [38], which is a part of FADN EU database. This is a unique information system providing data on the economic situation of agricultural enterprises. An important principle of the FADN system is a harmonized method of selecting survey companies, i.e., bookkeeping principles are the same in all EU countries, which guarantees the representativeness and validity of the survey in each EU country. Therefore, the data on production and economic results used in our analysis are based on the standard methodology of indicators applied in the FADN EU [39].
Our sample consisted of a dataset spanning 19 years. The number of farmers in 2001 was 1281, farming on 883,440 hectares (of these, 42 farms were organic, covering 18,769 hectares). In 2019, there were 1382 farms on 825,747 hectares (of which, 257 organic farms and 62,395 hectares). The sample does not include enterprises that simultaneously applied both organic and conventional regimes during the observed period, or switched to organic farming during the given period. Within the FADN database, three categories of areas are defined that correspond to the classification of enterprises in terms of management in areas with natural or other special constraints. The categories are as follows: ANC (Areas with Natural Constraints) and non-ANC, where ANC is further divided into mountain ANC and other ANC. For our study, we used areas marked as ANC (Areas with Natural Constraints) and non-ANC. The ANC were originally referred to as less-favored areas (LFAs) and the predominant portion of their cultivated land lies in mountain, specific, and other areas. Regarding the non-ANC, the predominant portion of cultivated land lies outside the ANC.
The number of enterprises in particular years and the acreage of agricultural land are presented in Table 1; these data also take into account the natural conditions of agricultural activity.

2.2. Methods

The empirical analysis aimed to capture and identify differences in the economic viability and the direct energy use of agricultural enterprises in the Czech Republic from the viewpoint of agricultural regimes, i.e., organic and conventional farming. To evaluate the intensity of agricultural production in both agricultural systems, we used productivity indicators, which are often used for these analyses [40]. Moreover, productivity growth is considered to be one of the basic factors influencing the competitiveness of enterprises [41,42]. Thus, the empirical approach was based on the comparison of the level of productivity of organic and conventional agriculture, using a general productivity indicator expressed as the ratio of the total outputs and the production inputs, as used by Latruffe et al. [43]. More specifically, the study focused on the productivity of the land (as used by Slavickiené and Savickiené [44] and Ryan et al. [45]), and the comparison of farms operating in different natural conditions.
According to Klima et al. [46], soil quality is among the factors affecting agricultural production and is one of the determining factors for the classification of the Areas with Natural Constraints (ANC), formerly referred to as less-favored areas (LFA). For this reason, many authors analyze the economic differences in companies within and outside ANC. Lososová et al. [47] showed that farms within ANC obtained lower yields, lower intensity, and lower profitability than farms in non-ANC in 2000–2015. Hlavsa et al. [40] found that costs per unit of production are higher within ANC then outside.
The classification scheme of the FADN database [38] was used for the classification of the agricultural companies according to the production specialization. The share of standard production (used by FADN) of individual branches of plant and animal production compared to the total value of the company standard production is decisive for the inclusion of enterprises in individual categories of production specialization. Due to the availability of the data and their explanatory power about the land productivity and direct energy consumption, the following categories of production specialization were used:
  • Cereals and oilseeds growing (FADN category 15);
  • Fruit growing (FADN category 36);
  • Milk production (FADN category 45);
  • Cattle breeding (FADN categories 46,47,48).
We began by comparing the yields of organic and conventional agricultural production (in a manner similar to that of, e.g., [11]) and we estimated the yield ratio (organic/conventional) concerning the natural conditions in which the farms operate (i.e., in ANC and non-ANC). Our performance indicator of agricultural production (AP) consists of sales from both crop and animal production, which are defined as follows [39]:
Crop production = Sales + Farm Use + Farmhouse Consumption + (Closing Valuation-Opening Valuation);
Animal production = Livestock Production + Change in Livestock Value + Animal Products; Livestock Production = Sales + Household Consumption–Purchases; Animal Products = Sales + Household Consumption + Farm Use + (Closing Valuation-Opening Valuation).
For comparability of the productivity of land, data on agricultural production were recalculated in the form of relative indicators per 1 ha of agricultural land, whereas the total agricultural land was defined according to the FADN methodology as total utilized agricultural area of holding [39]. Total production (TP) consists of the value of sales from agricultural production and other (non-agriculture) production.
As noted, our second partial goal was to lend further empirical support to the evidence on direct energy use in organic and conventional agriculture. This was fulfilled by the comparison of direct energy consumption in both systems of farming in the Czech Republic, thus providing insight into the environmental burden caused by farming in the two agricultural regimes. In terms of energy inputs, it is possible to distinguish between direct and indirect energy for the calculation of the energy balance and efficiency [48] Direct energy represents consumed fuels, electricity, energy consumed for heating, and other direct energy. Indirect energy is used to produce all other inputs, i.e., energy incorporated in the various means of production such as fertilizers, machinery processes, or labor [17]. Similar to Moghaddasi and Pour (2016) [37] and Zhang et al. (2019) [19], we focused on the direct energy consumed in agriculture in our analysis. Energy is among the most important commercial commodities with the biggest share in global trade [37], has a significant role in economic growth [49], and represents a factor of production with limited availability.
To evaluate the differences in the need for direct energy between the two farming regimes, we used an indicator, energy consumption (EC), measured by the energy consumption of farming and animal husbandry. Energy intensity was measured as the direct energy consumption per hectare, as previously used by Gomiero et al. [34], and per one unit of total product, as previously used by Clark and Tilman [32] and Tuomisto et al. [33]. In addition, in this analysis, we undertook a comparison between ANC and non-ANC.
We operationalize our variables according to the following formulas:
(AP): Agricultural production = Output crops and crop production + Output livestock and livestock products.
(TP): Total production = Agricultural production + Other output.
(EC): Energy consumption = costs of motor fuels and lubricants + costs of electricity + heating fuels.
An index was used to express the comparative differences between organic and conventional agricultural farms (i.e., organic/conventional). We calculate the particular index as the ratio of the variable for organic farming and the variable for conventional farming. The results are presented in Table 2 and Table 3 (the source data are presented in Table A1 and Table A2 in the Appendix), where the individual indexes were calculated as follows:
  • Index AP/ha = (organic AP/ha)/(conventional AP/ha)
  • Index EC/ha = (organic EC/ha)/(conventional EC/ha)
  • Index EC/AP = (organic EC/AP)/(conventional EC/AP)
The analysis was performed for the period 2001 to 2019. In addition to enabling an assessment of the current state, this long time period also enabled analysis of the development trend. Moreover, a long time series generally contributes to increasing the robustness of the results.

3. Results

Table 2 shows the overall results of the performance and direct energy consumption comparison between the organic and conventional means of farming with regard to the natural conditions (ANC and non-ANC). In summary, the results show that organic farms produce lower output with less direct energy per unit of land; however, they need more direct energy for one unit of production. The results show that, the worse the natural conditions for farming, the broader the difference between organic and conventional regimes with regard to their performance and direct energy consumption.

3.1. Agricultural Production

We began with the evaluation of the differences in the output of both systems. Figure 1 shows the agricultural production per hectare in the Czech Republic for conventional and organic farming, which provides an insight into the performance of the sector in terms of these two forms of farming. Regarding conventional farming, there is a visible increase during the observed period; the value of agriculture production per hectare reached 1765 EUR in 2019, which represents an increase of almost 50% compared to 2001. As seen in Figure 1, the agricultural production per hectare in organic farming is about 30% of the value of conventional farming. Regarding the output of organic farming, similarly to its conventional counterpart, the agricultural production per hectare increased during the observed period. However, the data are more volatile and the increase is less distinct.
Taking into account the different production orientations of farms (see Table 3), the lowest ratio of organic and conventional output per hectare is in the case of fruit growing. The yields per hectare of organic farms are 30–40% of those of conventional farms. The production per hectare of cattle breeding of organic farmers is around 35% of that of conventional farmers. More favorable comparisons are in cereals, oilseeds, and milk production, where the production per hectare in organic farming is, on average 53% (max. 62%) of that in conventional farming.
In addition to the farming system, the production possibilities of farms are significantly related to natural conditions. The overall results of organic and conventional farms are therefore affected by the proportion of farms operating in the ANC (Areas with Natural Constraints) or non-ANC. Given that approximately 90% of organic farms in the sample are located in the ANC, the overall results presented in Figure 1 are similar to the results for farms operating only in the ANC, as seen in Figure 2. The ratio of production per hectare in organic and conventional farming also remains the same, around 30%. The distribution of conventional farms between the ANC and the non-ANC is more balanced in the sample, because slightly less than 50% are located in the ANC. These shares correspond to the overall location of organic and conventional farms in the Czech Republic [14]. As seen from a comparison of Figure 1 and Figure 2, the production per hectare of conventional farms in ANC (see Figure 2) is approximately 10% lower than the average of ANC and non-ANC together (see Figure 1).
As can be expected, agricultural production per hectare in non-ANC (see Figure 3) is higher compared to yields per hectare in ANC (see Figure 2). In terms of organic farming, these yields per hectare are, on average, 1.7-fold higher in non-ANC compared to ANC. Conventional farmers in non-ANC achieve 1.25-fold higher yields per hectare than those farming in ANC. Yields per hectare in organic agriculture reach about 40% of yields in conventional agriculture in non-ANC, i.e., more than in ANC.

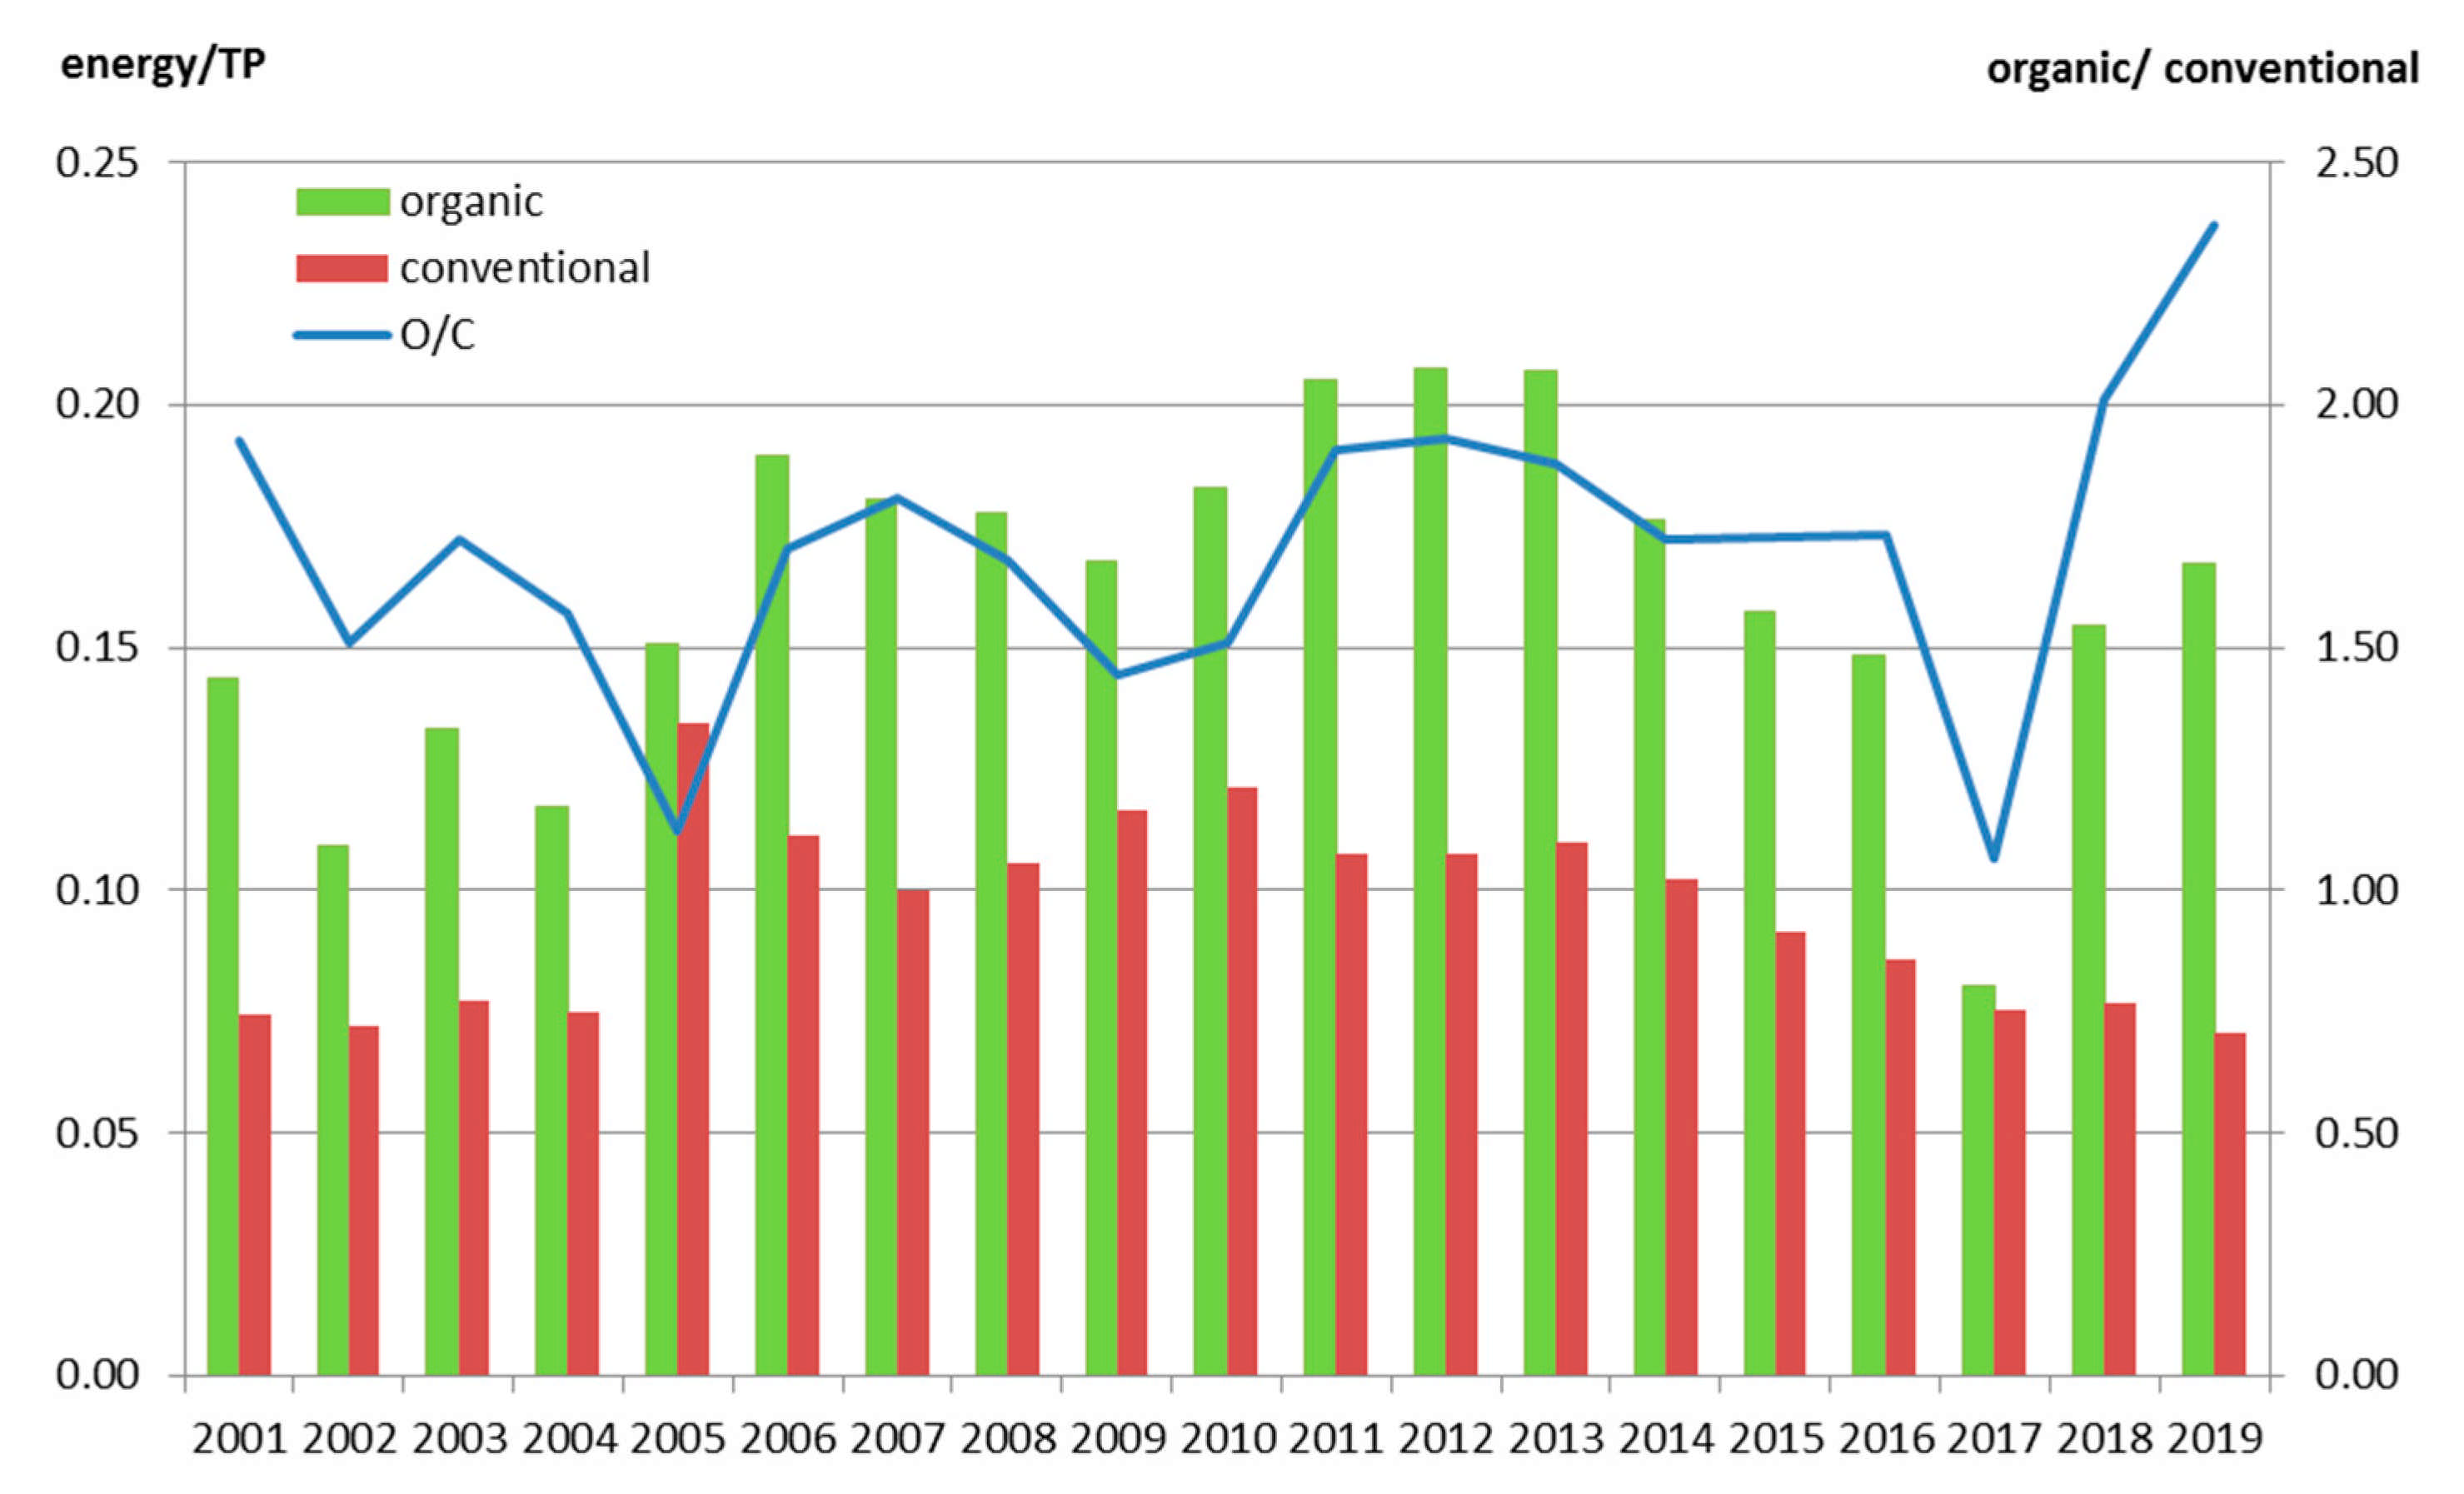
3.2. Energy Consumption

Focusing on the direct energy consumption per hectare without differentiation of natural conditions (see Figure 4) shows that organic farms in our sample use approximately half of the direct energy of conventional farms, whereas the trend appears to be growing in both farming systems in the long run. For example, in the organic system of farming the direct energy consumption per hectare was EUR 37.62 per hectare in 2001 and increased to EUR 90.84 per hectare in 2019. Conventional farmers used direct energy with a value of EUR 108.30 in 2001, which increased to EUR 178.20 in 2019.
Lower direct energy per hectare was also consumed by organic farming in the cases of fruit growing, cattle breeding, and milk production (see Table 3). The average indexes EC/ha are 49%, 59%, and 62% respectively. To produce cereals and oilseeds, organic farms need, on average, 97% of the direct energy per hectare of their conventional counterparts; however, this ratio is quite volatile, ranging from 38% in 2001 to 146% in 2016. The years with higher direct energy consumption in organic farms (compared to conventional farms) also showed lower differences in production per hectare (e.g., in 2001, organic production per hectare reached 31% of conventional production per hectare, whereas in 2016 the ratio was 70%). This type of production is therefore the most demanding in terms of energy consumption per hectare in organic farming in comparison to conventional farming (within the analyzed product groups).
When comparing the direct energy consumption per hectare in ANC and non-ANC, the direct energy consumption per hectare in favorable conditions (non-ANC) is higher (see Figure 5 and Figure 6). The higher differentiation between ANC and non-ANC occurred in the case of organic farmers. In ANC, organic farming used around 60% of direct energy per hectare compared to conventional farming, whereas in non-ANC it used around 50%.
Figure 7 shows energy consumption per unit of production for organic and conventional farming. Organic farms used, on average, just over EUR 0.16 per EUR 1 of production, whereas in the conventional system of farming this ratio was slightly less than 0.1 (on average). As a result, an organic agricultural product has 1.7-fold higher energy consumption than the conventional product.
Regarding production differentiation (see Table 3), organic farms focused on cereals and oilseeds had the highest direct energy consumption per unit of production compared to conventional farms (197% on average), with substantial volatility during the period under observation (ranging from 79% to 348%). The most balanced situation was in milk production, where the direct energy for one unit of organic production was around 115% of conventional production throughout the period under observation. Simultaneously, this type of production consumed a similar amount of direct energy per unit of production in both types of farming, i.e., organic and conventional.
The situation in ANC (see Figure 8) is very similar to the situation without a distinction between the natural conditions (see Figure 7). In the case of organic farming, the energy consumption was almost identical because a majority of these farms are located on ANC. On average, the ratio of direct energy consumed per EUR 1 of production in organic and conventional farming was 1.68.
Only a small proportion of organic enterprises farm in non-ANC conditions; therefore, the impact on the overall situation is only marginal. The organic farmers operating in these areas consume, on average, 1.48-fold greater energy per EUR 1 of production than their conventional counterparts (See Figure 9).

4. Discussion

Our findings confirm that organic farms achieve lower production per hectare (approximately one-third) than conventional farms, which is in line with the previous findings from Europe; for example, Mader et al. [50] document that yields of organically grown production are lower by 30% to 50%, on average, than yields of conventional production. This finding corresponds to the fact that, in organic farming, the primary goal is not the quantity of production, but conserving and enhancing the biodiversity of the landscape (e.g., [5,51]). As Stein-Bachinger et al. [52] (p. 1) conclude in their detailed review, “organic farming can play an effective role in acting against the loss of biodiversity”. However, the results differ for different production groups, as previously confirmed by, e.g., Goulding et al. [29] and Mader et al. [50]. Within the evaluated production groups, milk production appears to be the most effective for organic farming.
Because the production possibilities of farms are significantly related to natural conditions, we also looked at the differences in terms of farm location, i.e., whether farms are located in ANC or non-ANC. It is not surprising that production per hectare in non-ANC is higher than in ANC. This finding was more obvious for organic farms and may, therefore, indicate a stronger influence of natural conditions on organic farms, keeping in mind that the impact of the production structure probably differs between organic and conventional systems. Nevertheless, even conventional farms use the land in less favorable conditions for agricultural production. This is motivated by the focus of the European model of agriculture on the comprehensive provision of agricultural services [40,53], which relates not only to food production but also the maintenance of the cultural landscape, environment, and biodiversity as defined by the Cork Declaration [54]. The care of the landscape is one of the reasons for the existence of subsidies for ANC areas, which should compensate for lower yields, i.e., the impact of worse natural conditions on agricultural production [46]. Based on data from Poland, Klima et al. [46] also demonstrate a decrease in revenues in the less-favored areas of 12.7%, on average.
The key feature of organic farming is its lower input of chemicals, which should lead to a lower environmental burden on the land [52]. This reduction could be partially compensated by higher labor input; however, it is not possible to completely avoid the use of non-labor inputs. Our findings confirm lower direct energy consumption per hectare in organic farms compared to conventional farms, both generally and in the case of separate production groups, such as fruit growing, cattle breeding, and milk production. In contrast, cereal production consumes a similar amount of direct energy per hectare in organic and conventional agriculture, and, in some years the direct energy consumption in organic farms was even higher than that in conventional farms. Furthermore, it was found that, in the case of organic farming, larger differences could be observed in consumption per hectare between farms in ANC and non-ANC. The reason for this could be the production orientation. The prevailing type of land used by conventional farmers is arable land, in the case of both ANC and non-ANC (90% and 70%, respectively). Organic farmers in non-ANC are also most focused on arable land; however, in ANC the major form of production is permanent pastures, which is not energy consuming.
Regarding the energy consumption per unit of production, on average, organic farming consumes more direct energy than conventional farming to produce the same amount of production. This is also valid for individual production groups, with the highest energy consumption required in the case of cereals and oilseeds.
In summary, the above-mentioned indicators and contexts show that organic farming produces less output per hectare, and consumes less direct energy per hectare, than conventional farming; however, its direct energy consumption per one EUR of production is 1.7-fold higher. In addition, for example, an organic apple is more expensive than a conventional apple [55,56,57,58]. From this it can be deduced that, if the energy consumption is higher per unit of production in organic farming, then one organically produced apple has even higher energy consumption due to its higher price. Therefore, taking into account higher prices of organic products, the results for one piece of organic production are even less favorable in terms of direct energy consumption.

5. Conclusions

The objective of this study was to examine the performance of farmers in the Czech Republic and to highlight differences between organic and conventional farming concerning land use and direct energy consumption. We compared the consumption of two main factors of production—land and energy—under different regimes of farming and natural conditions. The findings show that, regardless of natural conditions, conventional farms perform better in terms of agricultural production per hectare, which is most evident in cattle breeding. Regarding energy consumption, organic systems of farming in the Czech Republic have lower consumption of direct energy per unit of land. However, certain differences are evident depending on the production groups, e.g., in the case of cereals and oilseeds growing, the energy consumption per hectare is essentially comparable between organic and conventional agriculture. For other monitored product groups (i.e., fruit growing, milk production, and cattle breeding), it was previously found that more direct energy per hectare is consumed in organic farming. Furthermore, we evaluated not only the energy consumption per unit of the land, but also that per unit of output, because the main goal of agriculture is to ensure enough food for society. Because organic systems have lower land-use efficiency than conventional systems, one can assume that energy-use efficiency per unit of output will be strongly influenced by the method of farming. We found that direct energy consumption per unit of product in the Czech Republic is 1.7-fold higher in organic farming than in conventional system; in the case of cereals and oilseeds growing, energy consumption is twice as high. Although these results may seem surprising, they are consistent with a number of previously published studies on this topic. It should be noted that our findings are based only on the data for direct energy consumption and may change significantly if the total energy input was included in the calculation.
The findings of our analysis support both Hypotheses 1 and 2. The first Hypothesis (H1), i.e., that production per unit of land is higher in conventional farming than in organic farming, was supported by the finding that, during the entire observation period (with the exception of one year of nine), under all natural conditions conventional agriculture significantly outperformed organic farming. Our second Hypothesis (H2), i.e., that direct energy consumption per unit of product is lower in conventional farming than in organic farming, was supported by the finding that, during the entire observation period, in both natural areas the energy consumption per unit of product was higher in organic farming compared to conventional farming.
Although organic farming is considered to be a means to support the sustainable development of society, some limitations of this type of farming should be taken into account. A number of previous studies have documented a variety of environmental benefits of organic farming, i.e., its non-productive functions. However, significant limitations in this farming system need to be taken into account when assessing the differences between organic and conventional farming. The first of these is the yield gap between organic and conventional systems, which leads to lower economic yields that are then compensated via subsidies to organic farmers. Given that organic farming therefore depends on external financial resources, often from public sources, there is a need to seek long-term sustainability, not only from the environmental point of view, but also from the economic perspective. From a global economic perspective, therefore, the consequences of lower productivity should be taken into account. At the same time, the problem of higher input demands, particularly fossil fuels, which are needed to produce one unit of food, should be considered when implementing organic farming.
The limits of organic farming are also related to the demand for organic products, particularly concerning the price level. A higher price for organically produced food can act as a disincentive to potential consumers, although there is a wide range of consumers who prefer this type of product and are willing to pay a higher price. This is particularly visible in developed countries, and is linked to economic growth and the growth of the income and living standards of the population. In addition, there is a lack of scientific evidence regarding the positive impact of organic products on human health compared to conventional products. Such evidence would provide important encouragement for economic policy to support this type of production in the long term.
Therefore, we consider it crucial that agricultural policy does not focus its support on organic farming as such, but that it focuses on improving the conventional agricultural systems by using organic farming techniques. This would make it possible to reduce the environmental impact of intensive agriculture, while also fostering an economic sustainability in the long term. Therefore, we want to encourage other scholars to further explore the potential of organic farming to better balance the inputs used and the yields obtained, which would make it possible to ensure sufficient food for the population.
Finally, we are aware of the limitations of our study, particularly involving the range of factors that would have to be taken into account to thoroughly evaluate the environmental impacts of agriculture. For a comprehensive assessment, it would be appropriate to examine the effect on several factors, such as soil, water, air, animal and soil varieties, plants, people, and the food itself, because agriculture involves numerous environmental issues related to biodiversity, climate change, irrigation issues, genetic engineering, soil degradation, or pollution [59]. This requires further research, but goes beyond the current study, and therefore remains open to further investigation. Another limitation of our study is the narrower definition of the energy intensity of agricultural production when evaluating the differences between organic and conventional agriculture, which, however, was the goal of our research. The examination of indirect energy, in addition to the expression of the overall energy balance for organic and conventional farming, remains a challenge for ongoing research leading to comprehensive conclusions on this issue.

Author Contributions

R.R. and G.C. conceived and coordinated the overall baseline study; R.R., G.C., I.B. and E.S. designed the study; G.C. and I.B. reviewed the existing studies; R.R. and E.S. managed the data collection; R.R. and E.S. designed and performed the analysis; R.R., G.C., I.B., E.S. and I.N.V. wrote the original draft preparation and critically reviewed the manuscript. All authors have read and agreed to the published version of the manuscript.

Funding

This research received no external funding.

Institutional Review Board Statement

Not applicable.

Data Availability Statement

Data used in this article can be found in the Farm Accountancy Data Network CZ–FADN CZ (https://www.fadn.cz/fadnweb/index_e.html).

Acknowledgments

The authors thank the anonymous referees for their contributions in the development of this article. We further thank Karel Vinohradský for his comments on this article. This work was supported by the Internal Grant Agency of Faculty of Regional Development and International Studies, Mendel University in Brno, under grant number 010/2021.

Conflicts of Interest

The authors declare no conflict of interest.

Appendix A

Table A1. Performance (AP) and direct energy consumption (EC) in organic farming.
OrganicAP/haEC/haEC/AP
ANCNon-ANCTotalANCNon-ANCTotalANCNon-ANCTotal
2001213.85x215.8637.42x37.620.14x0.14
2002293.681419.75312.9835.46171.0337.790.110.110.11
2003260.74533.03262.1338.6294.2638.900.130.180.13
2004319.22587.58442.1750.5286.9658.550.130.130.12
2005268.47587.58321.3452.3986.9658.160.160.130.15
2006309.78204.76307.2067.4639.5866.780.190.180.19
2007324.06453.47326.3366.8582.7467.130.180.170.18
2008329.001258.71426.9073.79199.9987.080.190.150.18
2009387.71709.42427.4776.90114.9781.520.170.150.17
2010406.18657.04424.0887.90140.3890.990.180.200.18
2011364.04543.36379.3292.0596.2992.510.210.160.21
2012374.03463.26385.0897.0389.6196.980.210.170.21
2013430.50463.26433.30103.8989.61102.660.210.170.21
2014531.83580.02536.19109.49107.99109.360.180.150.18
2015497.18454.02491.3597.8168.1293.800.170.100.16
2016490.05681.89504.0991.6090.5091.520.150.110.15
2017505.09840.70540.8699.4686.0599.580.160.010.08
2018509.73542.74511.6194.1680.9293.410.160.130.15
2019468.44518.15446.0797.4477.5190.840.170.110.17
Table A2. Performance (AP) and direct energy consumption (EC) in conventional farming.
ConventionalAP/haEC/haEC/AP
ANCNon-ANCTotalANCNon-ANCTotalANCNon-ANCTotal
20011196.901484.351294.74102.23120.31108.380.080.070.07
20021195.061494.141291.2993.29106.9697.690.070.070.07
20031039.591452.251192.5491.79108.2697.890.080.070.08
20041173.691533.311371.70104.04117.98111.720.080.070.07
20051088.841386.511277.62117.7077.2991.410.100.180.13
20061331.971357.221358.12129.30150.49120.840.090.160.11
20071240.921456.631399.09139.31150.18147.280.110.100.10
20081198.131212.441441.24152.05150.43164.230.120.110.11
2009966.931467.061144.74133.83187.58145.820.130.120.12
20101090.311467.061319.62156.04187.58175.250.130.120.12
20111271.201867.961587.66168.02204.38186.350.120.100.11
20121382.841828.511647.92185.92204.03196.010.120.100.11
20131402.981828.511636.27185.28204.03195.570.120.100.11
20141576.361850.861730.92195.27203.48199.890.110.100.10
20151479.861857.101691.15164.72181.09173.920.100.090.09
20161444.451901.881705.32156.55173.09165.980.090.080.09
20171584.771780.461695.36156.97166.97162.620.090.070.08
20181704.291870.371786.30168.39178.22173.240.090.070.08
20191797.082091.961943.69178.80177.59178.200.080.060.07

References

  1. Rizzo, G.; Borrello, M.; Guccione, G.D.; Schifani, G.; Cembalo, L. Organic Food Consumption: The Relevance of the Health Attribute. Sustainability 2020, 12, 595. [Google Scholar] [CrossRef] [Green Version]
  2. Rana, J.; Paul, J. Health motive and the purchase of organic food: A meta-analytic review. Int. J. Consum. Stud. 2020, 44, 162–171. [Google Scholar] [CrossRef]
  3. Wojciechowska-Solis, J.; Barska, A. Exploring the Preferences of Consumers’ Organic Products in Aspects of Sustainable Consumption: The Case of the Polish Consumer. Agriculture 2021, 11, 138. [Google Scholar] [CrossRef]
  4. Meemken, E.M.; Qaim, M. Organic agriculture, food security, and the environment. Annu. Rev. Resour. Econ. 2018, 10, 39–63. [Google Scholar] [CrossRef] [Green Version]
  5. Gomiero, T.; Pimentel, D.; Paoletti, M.G. Environmental impact of different agricultural management practices: Conventional vs. organic agriculture. Crit. Rev. Plant Sci. 2011, 30, 95–124. [Google Scholar] [CrossRef]
  6. Foley, J.A.; Ramankutty, N.; Brauman, K.A.; Cassidy, E.S.; Gerber, J.S.; Johnston, M.; Mueller, N.D.; O’Connell, C.; Ray, D.K.; West, P.C.; et al. Solutions for a cultivated planet. Nature 2011, 478, 337–342. [Google Scholar] [CrossRef] [PubMed] [Green Version]
  7. Seufert, V.; Ramankutty, N. Many shades of gray—The context-dependent performance of organic agriculture. Sci. Adv. 2017, 3, e1602638. [Google Scholar] [CrossRef] [Green Version]
  8. Mercati, V. Organic agriculture as a paradigm of sustainability: Italian food and its progression in the global market. Agric. Agric. Sci. Procedia 2016, 8, 798–802. [Google Scholar] [CrossRef] [Green Version]
  9. Sartaj, A.W.; Chand, S.; Najar, G.R.; Teli, M.A. Organic farming: As a climate change adaptation and mitigation strategy. Curr. Agric. Res. J. 2013, 1, 45. [Google Scholar]
  10. Reganold, J.P.; Wachter, J.M. Organic agriculture in the twenty-first century. Nat. Plants 2016, 2, 1–8. [Google Scholar] [CrossRef]
  11. Badgley, C.; Moghtader, J.; Quintero, E.; Zakem, E.; Chappell, M.J.; Aviles-Vazquez, K.; Samulon, A.; Perfecto, I. Organic agriculture and the global food supply. Renew. Agric. Food Syst. 2007, 22, 86–108. [Google Scholar] [CrossRef]
  12. Lotter, D. Facing food insecurity in Africa: Why, after 30 years of work in organic agriculture, I am promoting the use of synthetic fertilizers and herbicides in small-scale staple crop production. Agric. Hum. Values 2015, 32, 111–118. [Google Scholar] [CrossRef]
  13. Trewavas, A. Urban myths of organic farming. Nature 2001, 410, 409–410. [Google Scholar] [CrossRef]
  14. Redlichová, R.; Bečvářová, V.; Vinohradský, K. Vývoj Ekologického Zemědělství v ČR v Ekonomických Souvislostech, 1st ed.; Mendel University in Brno: Brno, Czech Republic, 2014; 92p, ISBN 978-80-7509-173-4. [Google Scholar]
  15. Qaim, M. Globalisation of agrifood systems and sustainable nutrition. Proc. Nutr. Soc. 2017, 76, 12–21. [Google Scholar] [CrossRef]
  16. Karkacier, O.; Goktolga, Z.G.; Cicek, A. A regression analysis of the effect of energy use in agriculture. Energy Policy 2006, 34, 3796–3800. [Google Scholar] [CrossRef]
  17. Moradi, M.; Nematollahi, M.A.; Khaneghah, A.M.; Pishgar-Komleh, S.H.; Rajabi, M.R. Comparison of energy consumption of wheat production in conservation and conventional agriculture using DEA. Environ. Sci. Pollut. Res. 2018, 25, 35200–35209. [Google Scholar] [CrossRef]
  18. Bashir, F. Energy Consumption and Agriculture Sector in Middle Income Developing Countries: A Panel Data Analysis. Pak. J. Soc. Sci. 2015, 35, 479–496. [Google Scholar]
  19. Zhang, L.; Pang, J.; Chen, X.; Lu, Z. Carbon emissions, energy consumption and economic growth: Evidence from the agricultural sector of China’s main grain-producing areas. Sci. Total Environ. 2019, 665, 1017–1025. [Google Scholar] [CrossRef] [PubMed]
  20. Todde, G.; Caria, M.; Gambella, F.; Pazzona, A. Energy and carbon impact of precision livestock farming technologies implementation in the milk chain: From dairy farm to cheese factory. Agriculture 2017, 7, 79. [Google Scholar] [CrossRef] [Green Version]
  21. FAO. The State of Food Security and Nutrition around the World in 2020. Available online: http://www.fao.org/3/ca9692en/online/ca9692en.html#chapter-1_1 (accessed on 30 April 2021).
  22. Hertel, T.W. The challenges of sustainably feeding a growing planet. Food Secur. 2015, 7, 185–198. [Google Scholar] [CrossRef]
  23. Kearney, J. Food consumption trends and drivers. Philos. Trans. R. Soc. B Biol. Sci. 2010, 365, 2793–2807. [Google Scholar] [CrossRef]
  24. Amundson, R.; Berhe, A.A.; Hopmans, J.W.; Olson, C.; Sztein, A.E.; Sparks, D.L. Soil science. Soil and human security in the 21st century. Science 2015, 348, 1261071. [Google Scholar] [CrossRef] [PubMed] [Green Version]
  25. Tuck, S.L.; Winqvist, C.; Mota, F.; Ahnström, J.; Turnbull, L.A.; Bengtsson, J. Land-use intensity and the effects of organic farming on biodiversity: A hierarchical meta-analysis. J. Appl. Ecol. 2014, 51, 746–755. [Google Scholar] [CrossRef]
  26. Seufert, V.; Ramankutty, N.; Foley, J.A. Comparing the yields of organic and conventional agriculture. Nature 2012, 485, 229–232. [Google Scholar] [CrossRef] [PubMed]
  27. Godfray, H.C.J.; Beddington, J.R.; Crute, I.R.; Haddad, L.; Lawrence, D.; Muir, J.F.; Pretty, J.; Robinson, S.; Thomas, S.M.; Toulmin, C. Food security: The challenge of feeding 9 billion people. Science 2010, 327, 812–818. [Google Scholar] [CrossRef] [Green Version]
  28. Connor, D.J. Organic agriculture cannot feed the world. Field Crop. Res. 2008, 106, 187. [Google Scholar] [CrossRef]
  29. Goulding, K.W.; Trewavas, A.J.; Giller, K.E. Can organic farming feed the world? A contribution to the debate on the ability of organic farming systems to provide sustainable supplies of food. In Proceedings-International Fertiliser Society; International Fertiliser Society: York, UK, 2009; Volume 663, pp. 1–27. ISSN 1466-1314. [Google Scholar]
  30. Ponisio, L.C.; M’Gonigle, L.K.; Mace, K.C.; Palomino, J.; De Valpine, P.; Kremen, C. Diversification practices reduce organic to conventional yield gap. Proc. R. Soc. B Biol. Sci. 2015, 282, 20141396. [Google Scholar] [CrossRef] [PubMed] [Green Version]
  31. Muller, A.; Schader, C.; El-Hage Scialabba, N.; Brüggemann, J.; Isensee, A.; Erb, K.H.; Smith, P.; Klocke, P.; Leiber, F.; Stolze, M.; et al. Strategies for feeding the world more sustainably with organic agriculture. Nat. Commun. 2017, 8, 1290. [Google Scholar] [CrossRef] [Green Version]
  32. Clark, M.; Tilman, D. Comparative analysis of environmental impacts of agricultural production systems, agricultural input efficiency, and food choice. Environ. Res. Lett. 2017, 12, 064016. [Google Scholar] [CrossRef]
  33. Tuomisto, H.L.; Hodge, I.D.; Riordan, P.; Macdonald, D.W. Does organic farming reduce environmental impacts?—A meta-analysis of European research. J. Environ. Manag. 2012, 112, 309–320. [Google Scholar] [CrossRef]
  34. Gomiero, T.; Paoletti, M.G.; Pimentel, D. Energy and environmental issues in organic and conventional agriculture. Crit. Rev. Plant Sci. 2008, 27, 239–254. [Google Scholar] [CrossRef]
  35. Ministry of Agriculture of the Czech Republic. Akční plán ČR pro Rozvoj Ekologického Zemědělství v Letech 2021–2027. Available online: https://pro-bio.cz/wp-content/uploads/2021/05/Akcni_plan_CR_pro_rozvoj_EZ_v_letech_2021_2027.pdf (accessed on 15 June 2021).
  36. Clapp, J. Food self-sufficiency: Making sense of it, and when it makes sense. Food Policy 2017, 66, 88–96. [Google Scholar] [CrossRef] [Green Version]
  37. Moghaddasi, R.; Pour, A.A. Energy consumption and total factor productivity growth in Iranian agriculture. Energy Rep. 2016, 2, 218–220. [Google Scholar] [CrossRef] [Green Version]
  38. Institute of Agricultural Economics and Information. Database FADN CZ. Available online: https://www.fadn.cz/fadnweb/index_e.html (accessed on 24 February 2021).
  39. European Commission—FADN. Definitions of Variables Used in FADN Standard Results. Available online: https://circabc.europa.eu/ui/group/880bbb5b-abc9-4c4c-9259-5c58867c27f5/library/162fb4de-22c9-489a-a0f6-8cd9f75de730 (accessed on 8 February 2021).
  40. Hlavsa, T.; Špicka, J.; Stolbova, M.; Hlouskova, Z. Statistical analysis of economic viability of farms operating in Czech areas facing natural constraints. Agric. Econ. 2020, 66, 193–202. [Google Scholar] [CrossRef]
  41. Dvouletý, O.; Blažková, I. Determinants of competitiveness of the Czech SMEs: Findings from the global competitiveness project. Compet. Rev. 2021, 31, 361–378. [Google Scholar] [CrossRef]
  42. Zdráhal, I.; Chmelíková, G.; Běčvářová, V. Ziskovost cukrovarnictví v Evropské unii. Listy Cukrov. Řepařské Odb. Časopis Obor Cukrovka-Cukr-Líh 2020, 136, 30–35. [Google Scholar]
  43. Latruffe, L.; Diazabakana, A.; Bockstaller, C.; Desjeux, Y.; Finn, J. Measurement of sustainability in agriculture: A review of indicators. Stud. Agric. Econ. 2016, 118, 123–130. [Google Scholar] [CrossRef]
  44. Slavickienė, A.; Savickienė, J. The Evaluation of Small and Medium Farms’ Economic Viability in the New EU Countries. Econ. Bus. J. 2014, 8, 843–855. [Google Scholar]
  45. Ryan, M.; Hennessy, T.; Buckley, C.; Dillon, E.J.; Donnellan, T.; Hanrahan, K.; Moran, B. Developing farm-level sustainability indicators for Ireland using the Teagasc National Farm Survey. Ir. J. Agric. Food Res. 2016, 55, 112–125. [Google Scholar] [CrossRef] [Green Version]
  46. Klima, K.; Kliszcz, A.; Puła, J.; Lepiarczyk, A. Yield and profitability of crop production in mountain less favoured areas. Agronomy 2020, 10, 700. [Google Scholar] [CrossRef]
  47. Lososová, J.; Zdenek, R.; Kopta, D. Development of the main production and economic indicators of Czech farms. Custos Agronegocio Line 2017, 13, 88–109. [Google Scholar]
  48. Ozkan, B.; Akcaoz, H.; Fert, C. Energy input–output analysis in Turkish agriculture. Renew. Energy 2004, 29, 39–51. [Google Scholar] [CrossRef]
  49. Gozgor, G.; Lau, C.K.M.; Lu, Z. Energy consumption and economic growth: New evidence from the OECD countries. Energy 2018, 153, 27–34. [Google Scholar] [CrossRef] [Green Version]
  50. Mader, P.; Fliebach, A.; Dubois, D.; Gunst, L.; Fried, P.; Niggli, U. Soil fertility and biodiversity in organic farming. Science 2002, 296, 1694–1697. [Google Scholar] [CrossRef] [Green Version]
  51. Carnol, M.; Chartin, C.; Krüger, I.; van Wesemael, B. Indicators of soil functioning in conventional, conservation and organic agriculture. In Proceedings of the EGU General Assembly Conference Abstracts, Online, 19–30 April 2021. EGU21-9489. [Google Scholar]
  52. Stein-Bachinger, K.; Gottwald, F.; Haub, A.; Schmidt, E. To what extent does organic farming promote species richness and abundance in temperate climates? A review. Org. Agric. 2021, 11, 1–12. [Google Scholar] [CrossRef] [Green Version]
  53. Štolbová, M.; Hlavsa, T.; Lekešová, M. Methods of calculating the handicaps of less favoured natural conditions. Agric. Econ. 2010, 56, 215–223. [Google Scholar] [CrossRef] [Green Version]
  54. Cork Declaration. The Cork Declaration—A Living Countryside. In Proceedings of the European Conference on Rural Development, Cork, Ireland, 7–9 November 1996; Available online: http://www.aughty.org/pdf/cork_declar.pdf (accessed on 6 March 2021).
  55. FAO. Why is Organic Food More Expensive than Conventional Food? Available online: http://www.fao.org/organicag/oa-faq/oa-faq5/en/ (accessed on 25 March 2021).
  56. Pilelienė, L.; Tamulienė, V. Consumer attitudes and behavior towards organic products: Evidence from the Lithuanian market. J. Entrep. Manag. Innov. 2021, 17, 269–299. [Google Scholar]
  57. Luiza-Maria, D. Economic and Social Effects of Organic Food Production and Consumption. In Annals of’Constantin Brancusi’University of Targu-Jiu. Economy Series; University of Targu-Jiu: Targu Jiu, Romania, 2021; Volume 1, pp. 156–162. [Google Scholar]
  58. Sirieix, L.; Kledal, P.R.; Sulitang, T. Organic food consumers’ trade-offs between local or imported, conventional or organic products: A qualitative study in Shanghai. Int. J. Consum. Stud. 2011, 35, 670–678. [Google Scholar] [CrossRef] [Green Version]
  59. Tilman, D.; Balzer, C.; Hill, J.; Befort, B.L. Global food demand and the sustainable intensification of agriculture. Proc. Natl. Acad. Sci. USA 2011, 108, 20260–20264. [Google Scholar] [CrossRef] [Green Version]
Figure 1. Agriculture production per hectare. (Source: [38], authors’ elaboration).
Agriculture 11 00813 g001
Figure 2. Agriculture production per hectare in ANC (Areas with Natural Constraints). (Source: [38], authors’ elaboration).
Agriculture 11 00813 g002
Figure 3. Agriculture production per one hectare in non-ANC (non-Areas with Natural Constraints). (Source: [38], authors’ elaboration).
Agriculture 11 00813 g003
Figure 4. Energy consumption one hectare. (Source: [38], authors’ elaboration).
Agriculture 11 00813 g004
Figure 5. Energy consumption per one hectare in ANC. (Source: [38], authors’ elaboration).
Agriculture 11 00813 g005
Figure 6. Energy consumption per hectare in non-ANC. (Source: [38], authors’ elaboration).
Agriculture 11 00813 g006
Figure 7. Energy consumption per unit of total product (TP). (Source: [38], authors’ elaboration). Note: Both energy consumption and total production are expressed in EUR.
Agriculture 11 00813 g007
Figure 8. Energy consumption per one unit of total product (TP) in ANC. (Source: [38], authors’ elaboration). Note: Both energy consumption and total production are expressed in EUR.
Agriculture 11 00813 g008
Figure 9. Energy consumption per one of total product (TP) in non-ANC. (Source: [38], authors’ elaboration). Note: Both energy consumption and total production are expressed in EUR.
Agriculture 11 00813 g009
Table 1. Number of organic (OF) and conventional farms (CF) in the research sample and their acreage of agricultural land with division into ANC (Areas with Natural Constraints) and non-ANC.
ANCNon-ANC
OFCFOFCF
No.haNo.haNo.haNo.ha
20014018,680695570,366289544294,305
20027024,827773605,7814433631287,397
20037423,113789577,7534118700340,454
20047424,775668413,081125898897506,144
20057730,275524324,267922271017603,623
20067529,426462266,25267401098650,936
20077629,418432237,40475271068652,708
20088427,627451266,0901732521090624,770
20098931,416416241,3733442992156626,141
201012539,165471337,221165647999530,697
201122366,267503354,829382896857452,035
201220058,813461334,792324104740404,595
201319553,545449321,100395016732391,132
201418748,430439315,891504824700409,951
201520251,204461331,542437995701424,046
201621056,253471335,512434442699445,300
201722062,266473354,373575856676460,500
201824064,343569402,854383881607392,994
201921854,984538383,815394007587379,537
Note: OF—Organic Farm, CF—Conventional Farm. Source: [38], authors’ elaboration.
Table 2. Performance (AP) and direct energy consumption (EC) in organic vs. conventional farming.
Index AP/haIndex EC/haIndex EC/AP
ANCNon-ANCTotalANCNon-ANCTotalANCNon-ANCTotal
20010.18x0.170.37x0.351.89x1.93
20020.250.950.240.381.600.391.461.561.51
20030.250.370.220.420.870.401.602.511.72
20040.270.380.320.490.740.521.611.901.57
20050.250.420.250.451.130.641.620.731.12
20060.230.150.230.520.260.552.051.131.71
20070.260.310.230.480.550.461.701.711.81
20080.271.040.300.491.330.531.601.331.68
20090.400.480.370.570.610.561.371.271.44
20100.370.450.320.560.750.521.411.681.51
20110.290.290.240.550.470.501.731.621.91
20120.270.250.230.520.440.491.761.651.93
20130.310.250.260.560.440.521.731.651.88
20140.340.310.310.560.530.551.621.561.72
20150.340.240.290.590.380.541.691.161.73
20160.340.360.300.590.520.551.621.351.73
20170.320.470.320.630.520.611.830.161.07
20180.300.290.290.560.450.541.751.872.01
20190.260.250.230.540.440.512.051.782.37
Source: [38], authors’ elaboration.
Table 3. Performance (AP) and direct energy consumption (EC) in different types of production orientation of farms in organic and conventional systems.
Index AP/haIndex EC/haIndex EC/AP
CerealsFruits and VegetableMilk ProductionCattle BreedingCerealsFruits and VegetableMilk ProductionCattle BreedingCerealsFruits and VegetableMilk ProductionCattle Breeding
20010.31N/AN/A0.170.38N/AN/A0.411.32N/AN/A1.95
20020.42N/A0.590.410.32N/A0.560.520.79N/A1.021.10
2003N/AN/A0.680.32N/AN/A0.590.48N/AN/A0.891.39
2004N/AN/A0.660.27N/AN/A0.670.48N/AN/A0.951.58
2005N/AN/A0.670.34N/AN/A0.740.53N/AN/A1.101.49
2006N/AN/A0.640.32N/AN/A0.540.49N/AN/A0.671.42
2007N/AN/A0.510.31N/AN/A0.480.57N/AN/A0.981.74
20080.43N/A0.580.261.15N/A0.720.482.89N/A1.132.39
2009N/AN/A0.590.42N/AN/A0.690.58N/AN/A1.211.27
2010N/AN/A0.820.40N/AN/A0.890.62N/AN/A1.121.33
20110.510.290.490.371.000.210.730.612.030.741.481.50
2012N/A0.310.620.40N/A0.590.870.62N/A1.881.341.40
20130.210.220.620.350.740.470.870.593.482.111.341.57
20140.470.220.600.560.800.280.790.751.821.311.341.43
20150.870.320.630.411.390.360.800.671.670.831.211.50
20160.700.330.710.541.460.420.800.742.251.091.201.20
20170.650.400.570.581.030.390.700.761.391.021.221.30
20180.690.330.600.531.370.380.730.712.201.031.211.36
20190.590.460.580.481.030.340.680.661.840.741.221.24
Source: [38], authors’ elaboration.
Publisher’s Note: MDPI stays neutral with regard to jurisdictional claims in published maps and institutional affiliations.

