Article

Concentrations of Phenolic Acids, Flavonoids and Carotenoids and the Antioxidant Activity of the Grain, Flour and Bran of Triticum polonicum as Compared with Three Cultivated Wheat Species

by
Elżbieta Suchowilska
1,
Teresa Bieńkowska
1,
Kinga Stuper-Szablewska
2 and
Marian Wiwart
1,*
1
Department of Plant Breeding and Seed Production, University of Warmia and Mazury in Olsztyn, pl. Łódzki 3, 10-724 Olsztyn, Poland
2
Faculty of Wood Technology, Department of Chemistry, Poznan University of Life Sciences, 60-624 Poznan, Poland
*
Author to whom correspondence should be addressed.
Agriculture 2020, 10(12), 591; https://doi.org/10.3390/agriculture10120591
Submission received: 18 October 2020 / Revised: 19 November 2020 / Accepted: 27 November 2020 / Published: 29 November 2020
(This article belongs to the Section Crop Production)

Abstract

:
The experiment was performed on 66 breeding lines of Triticum polonicum, four T. durum cultivars, four T. aestivum cultivars, and one T. turanicum cultivar (Kamut® wheat). Wheat grain, bran, and flour were analyzed to determine the concentrations of carotenoids, free and bound phenolic acids, and flavonoids, as well as antioxidant activity in the ABTS+ assay. The total concentrations of lutein, zeaxanthin, and β-carotene in grain and milling fractions were determined at 3.17, 2.49, and 3.16 mg kg−1 in T. polonicum (in grain, flour, and bran, respectively), and at 4.84, 3.56, and 4.30 mg kg−1 in T. durum, respectively. Polish wheat grain was characterized by high concentrations of p-coumaric acid and syringic acid (9.4 and 41.0 mg kg−1, respectively) and a low content of 4-hydroxybenzoic acid (65.2 mg kg−1). Kamut® wheat (T. turanicum) which is closely related to T. polonicum was particularly abundant in 4-hydroxybenzoic, chlorogenic, ferulic, gallic, and t-cinnamic acids. The studied Triticum species did not differ considerably in the concentrations of the eight analyzed flavonoids, and significant differences were noted only in rutin levels. The grain and milling fractions of Kamut® wheat were characterized by very high concentrations of quercetin, naringenin, and vitexin, but significant differences were observed only in vitexin content. Quercetin concentration in Kamut® wheat grain (104.8 mg kg−1) was more than five times higher than in bread wheat (19.6 mg kg−1) and more than twice higher than in Polish wheat (44.1 mg kg−1). Antioxidant activity was highest in bran, followed by grain and flour (4684, 1591, and 813 μM TE g−1, respectively). The grain and flour of the analyzed Triticum species did not differ significantly in terms of antioxidant activity.

1. Introduction

Cereal grain is a rich source of energy, proteins, and important micronutrients in animal and human diets [1]. The nutritional quality of flour has a significant impact on human health and well-being. According to Dykes and Rooney [2], wheat grain is abundant in phytochemicals that deliver health benefits. It contains substantial quantities of antioxidants, including phenolic acids (PAs), flavonoids, anthocyanins, carotenoids, tocols, lignans, and phytosterols/phytostanols [3]. Most bioactive compounds are unevenly distributed in the kernel: bran, endosperm, and germ have different antioxidant capacities, and bran has the highest antioxidant potential [4]. Many modern breeding programs for genetic improvement focus on yields and higher pathogen and pest resistance rather than nutritional and functional characteristics. Therefore, research studies that explore the phytochemical profile of wheat varieties and the content of antioxidants such as polyphenols, flavonoids, carotenoids, or tocopherols offer new insights for the genetic improvement of the genus Triticum [5,6]. The results obtained by different authors show that some wild and ancient wheats are more abundant in phytochemicals than modern bread wheat varieties [3,7,8]. However, further research is needed to better understand the potential of the wheat gene pool, in particular in tetraploid wheat species such as Triticum polonicum L., Triticum durum Desf., and Triticum dicoccon (Schrank) Schübl. Phenolic compounds derived from the phenylpropanoid pathway belong to two groups: flavonoid phenylpropanoids, including flavones, flavonols, flavanones, flavanols, anthocyanins, and chalcones, as well as non-flavonoid phenylpropanoids such as stilbenes, lignans, and PAs [9]. Ferulic acid is a major PA in cereals [10]. Phenolics are concentrated mainly in the outer layer of kernels [11], and they are considered the major contributors to the total antioxidant capacity of cereal grain [12]. Studies comparing the composition of phenolic compounds in cereals have revealed significant differences between species, varieties, and grain fractions [11,13,14]. Ferulic acid is the predominant free PA in cereal grain, followed by p-coumaric acid and vanillic acid [13]. Cereal grain also contains very small amounts of caffeic, p-hydroxybenzoic, and sinapic acids (0.5–1.5 μg g−1) [15]. Ferulic acid is the predominant cell-wall-bound PA which accounts for up to 90% of total phenolic compounds in cereal grain [16]. Flavonoids are the second largest group of phenolics in cereal grain, and they are found in the pericarp and the germ [2,17].
The content of phenolic compounds is affected by genotype and genotype × environment interactions. Mpofu et al. [18] demonstrated that environmental factors exerted a much stronger effect on the content of phenolic compounds than genotype, and that genotype × environment interactions had a much smaller influence on all of the evaluated parameters than both main factors. Fernandez-Orozco et al. [19] also found that environmental factors were more important determinants of phenolic levels, in particular free and conjugated PA fractions than genotypic variation. The results of Shewry et al. [20] corroborated previous reports and demonstrated that heritable variation in the content of bioactive components can be exploited by breeders to develop new cultivars with enhanced health benefits.
Lipophilic secondary metabolites with antioxidant properties include tocols (commonly referred to as tocopherols) and carotenoids. Carotenoids consist of carotenes, mostly α-carotene and β-carotene, as well as xanthophylls, mostly lutein and zeaxanthin. Carotenoid concentrations differ significantly between cereal species and/or varieties, and in small-grain cereals, carotenoids are accumulated mainly in germ. Lutein is the major xanthophyll and ZEA is the minor xanthophyll component in wheat, barley, and oat grain [14]. Cereals also contain tocols, including tocopherols and tocotrienols. Tocopherols are accumulated mainly in the germ fraction, while tocotrienols are present in pericarp and endosperm fractions [21]. Tocotrienols are the main tocols in small-grain cereals, and their concentrations vary across species and/or varieties [21]. In wheat grain, most antioxidant compounds are concentrated in the bran and germ fractions which are generally removed during milling [22]. Wheat grain antioxidants deliver health benefits by reducing the incidence of age-related chronic diseases, including heart diseases and some types of cancer [23].
The popularity of tetraploid wheat species, including durum wheat, emmer, and Polish wheat, has increased in recent years. Free-threshing T. durum (macaroni or hard wheat) is the most economically important species of tetraploid wheat which is widely cultivated for the production of pasta and cereal goods [24]. Triticum polonicum (Polish wheat) is cultivated in the Mediterranean region, in western Ukraine, warm regions of Asia, as well as Algeria and Ethiopia [25]. Our previous studies demonstrated that Polish wheat constitutes a promising source material in breeding for qualitative traits and resistance. Polish wheat grain is a rich source of essential micronutrients [26], and the obtained flour be used in the production of bread [27]. Triticum polonicum has a high potential for breeding cultivars with satisfactory resistance to Fusarium head blight [28]. However, the profile and content of bioactive compounds, including PAs, flavonoids, and carotenoids, in the grain of T. polonicum have not been studied to date. Therefore, it remains unknown whether and to what extent the composition of Polish wheat differs from that of durum and bread wheat. The growing popularity of cereal-based functional foods has prompted research into the content of bioactive compounds, in particular antioxidants, in whole grain, bran, and flour.
The aim of this study was to determine the concentrations of PAs (free and bound), flavonoids, and carotenoids in the grain, flour, and bran of T. polonicum in relation to durum wheat, bread wheat, and Kamut® wheat (T. turanicum).

2. Materials and Methods

The experiment was performed on 75 breeding lines and cultivars of four Triticum species: T. polonicum (66 lines derived from the accessions received from the Leibniz Institute of Plant Genetics and Crop Plant Research in Gatersleben, Germany, the National Plant Germplasm System in the USA, and the National Center for Plant Genetic Resources in Poland), T. aestivum (four cultivars: Torka, Zebra, Kontesa, and Parabola), T. durum (four cultivars: Duroflavus, Duromax, Floradur, and Malvadur), and T. turanicum (Kamut® wheat) (Table 1). Grain was obtained from a field experiment conducted in the Agricultural Experiment Station in Bałcyny near Ostróda, Poland (53°36′ N, 19°51′ E) on optimal soils for wheat cultivation. NPK fertilizer was applied before sowing at a rate of 60/25/80 kg ha−1. Seeds were not dressed, and fungicides and insecticides were not applied during the growing season. Weeds were controlled with the Chwastox Extra herbicide (active ingredient MCPA, 26%) (CIECH Sarzyna, Poland) based on the recommendations for spring wheat. Grain for all analyses was harvested in the over-ripe stage (BBCH 92) [29]. Type 750 flour and bran were obtained by grinding grain samples in a Brabender Quadrumat Senior laboratory mill (Brabender, Germany).

2.1. Determination of Carotenoids

Carotenoids were isolated and quantified in the Acquity UPLC system (Waters, Milford, MA, USA) samples by saponification [30]. Carotenoid extracts in the amount of 0.4 mg were obtained from 10 g specimens of ground kernels that were tittered with a mixture of acetone and petroleum ether (1:1). Plant tissue was separated, and acetone and hydrophilic fractions were removed from the extract by washing with deionized water. The ether extract was obtained with a mixture of carotenoid pigments. The prepared extract was concentrated in a vacuum evaporator at 35 °C until an oily residue was obtained. The residue was dissolved in 2 mL of methanol (Merck) and subjected to chromatographic analysis. Lutein, ZEA, and β-C were determined in the Acquity UPLC system (Waters, USA) with a Waters Acquity PDA detector (Waters, USA). Chromatographic separation was performed on an Acquity UPLC® BEH C18 column (100 mm × 2.1 mm, particle size 1.7 μm) (Waters, Ireland). Elution was carried out with A - MeOH solvent, B-water, and tert-butyl methyl ether (TBME). The elution gradient was applied at a flow rate of 0.4 mL min−1. The column and the samples were thermostatted, with the column temperature at 30 °C, and the test temperature was 10 °C. During the analysis, the solutions were degassed in a Waters device. The injection volume was 10 μL. The separated compounds were registered at a wavelength λ = 445 nm. Compounds were identified based on spectra in the range of 200 to 600 nm, and retention times were compared with the standards.

2.2. ABTS· Assay

ABTS+ radicals were generated from ABTS salt by reacting 3 mM of K2S2O8 with 8 mM ABTS salt in distilled deionized water for 16 h at room temperature in dark. The ABTS solution was diluted with a phosphate buffer solution (pH 7.4) containing 150 mM NaCl (PBS) to obtain an initial absorbance of 1.5 at 730 nm. Fresh ABTS solution was prepared for each analysis. Reaction kinetics were determined over a 2 h period with readings every 15 min. The reactions were complete in 30 min. The samples and the standards (100 µmol) were reacted with the ABTS solution (2900 µmol) for 30 min. Trolox was used as the standard. The analyses were carried out in a Thermo Multiskan EX Microplate Photometer (Corston, UK). The results were expressed in ABTS (µmol TROLOX g−1) of sample DM.

2.3. Determination of Phenolics

Phenolics were determined in samples of 0.20 g. The samples were placed in sealed 17 mL culture test tubes where alkaline hydrolysis, followed by acid hydrolysis were run. Alkaline hydrolysis was performed by adding 1 mL of distilled water and 4 mL of 2M aqueous sodium hydroxide to the test tubes. Tightly sealed test tubes were heated in a water bath at 95 °C for 30 min. The test tubes were cooled (approx. 20 min) and neutralized with 2 mL 6M aqueous hydrochloric acid solution (pH = 2). The samples were then cooled in ice water. Phenolic acids were extracted from the inorganic phase using diethyl ether (2 × 2 mL). The obtained ether extracts were continuously transferred to 8 mL vials. Acid hydrolysis was performed by adding 3 mL of 6M aqueous hydrochloric acid solution to the aqueous phase. Tightly sealed test tubes were heated in a water bath at 95 °C for 30 min. The samples were cooled in ice water and extracted with diethyl ether (2 × 2 mL). The produced ether extracts were continuously transferred to 8 mL vials and evaporated to dryness in a stream of nitrogen. The samples were dissolved in 1 mL MeOH before analysis in the Acquity H class UPLC system equipped with a Waters Acquity PDA detector (Waters, USA). Chromatographic separation was performed on an Acquity UPLC® BEH C18 column (100 mm × 2.1 mm, particle size 1.7 μm) (Waters, Ireland). The mobile phase had the following composition during gradient elution: (A) acetonitrile with 0.1% formic acid, (B) 0.1% aqueous formic acid solution (pH = 2). The concentration of phenolic compounds was determined using an internal standard at λ = 320 nm and 280 nm. Phenolics were identified based on comparing the retention time of the analyzed peak with the retention time of the standard. A specific amount of the standard was added to the analyzed samples, and the analysis was repeated analyses. The detection threshold was 1 μg g−1. The assayed compounds had the following retention times: Km—6.11 min, GA—8.85 min, VA—9.71 min, LU—11.89 min, PrCA—12.23 min, VN—14.19 min, AP—16.43 min, CA—18.09 min, HBA—19.46 min, CGA—21.56 min, CA—26.19 min, SyA—28.05 min, NA—31.22 min, VI—35.41 min, RU—38.11 min, QU—39.58 min, pCA—40.20 min, FA—46.20 min, SiA—48.00 min, CIA—52.40 min.

2.4. Free Phenolic Acids (FPAs)

The content of PAs was determined in 50 g samples that were ground in a laboratory mill (WŻ-1, Poland). Phenolic acids were extracted with 80% MeOH. Samples of 10 g were flooded with 100 mL of MeOH and placed in an ultrasound bath for 30 min. The precipitates were collected into distillation flasks, and the extraction process was repeated three times. The combined extracts were evaporated to dryness in a vacuum evaporator. Phenolics were transferred quantitatively to a vial with MeOH and were dried in a stream of nitrogen. Deionized water (0.5 mL) and the Folin-Ciocalteu reagent (Fluka) (0.125 mL) were added to 0.125 mL of the extract, and the mixture was supplemented with 1.25 mL of 7% aqueous Na2CO3 solution and 1 mL of deionized water after 6 min. After 90 min, absorbance was read at a wavelength of 760 nm in relation to water (Helios spectrophotometer, Thermo Electron Corporation). The results were expressed in mg of GA per kg of sample DM.

2.5. Statistical Analysis

The results were processed by analysis of variance (ANOVA) with the Student-Newman-Keuls (SNK) multiple range tests to determine the significance of differences between means, as well as principal component analysis (PCA) and cluster analysis. Statistical analyses were performed in Statistica 13 software [31].

3. Results

The flour obtained from the four analyzed Triticum species differed in extraction rate which was determined at a minimum of 70% in all lines and cultivars (Table 2). The flour extraction rate was significantly highest in T. durum (76.7%) and lowest in T. aestivum (73.5%). The average flour extraction rate was similar in the studied T. polonicum lines (75.6%) and Kamut® wheat (74.9%). The reverse was noted in bran yield which was determined at 19.3% on average in Polish wheat lines.

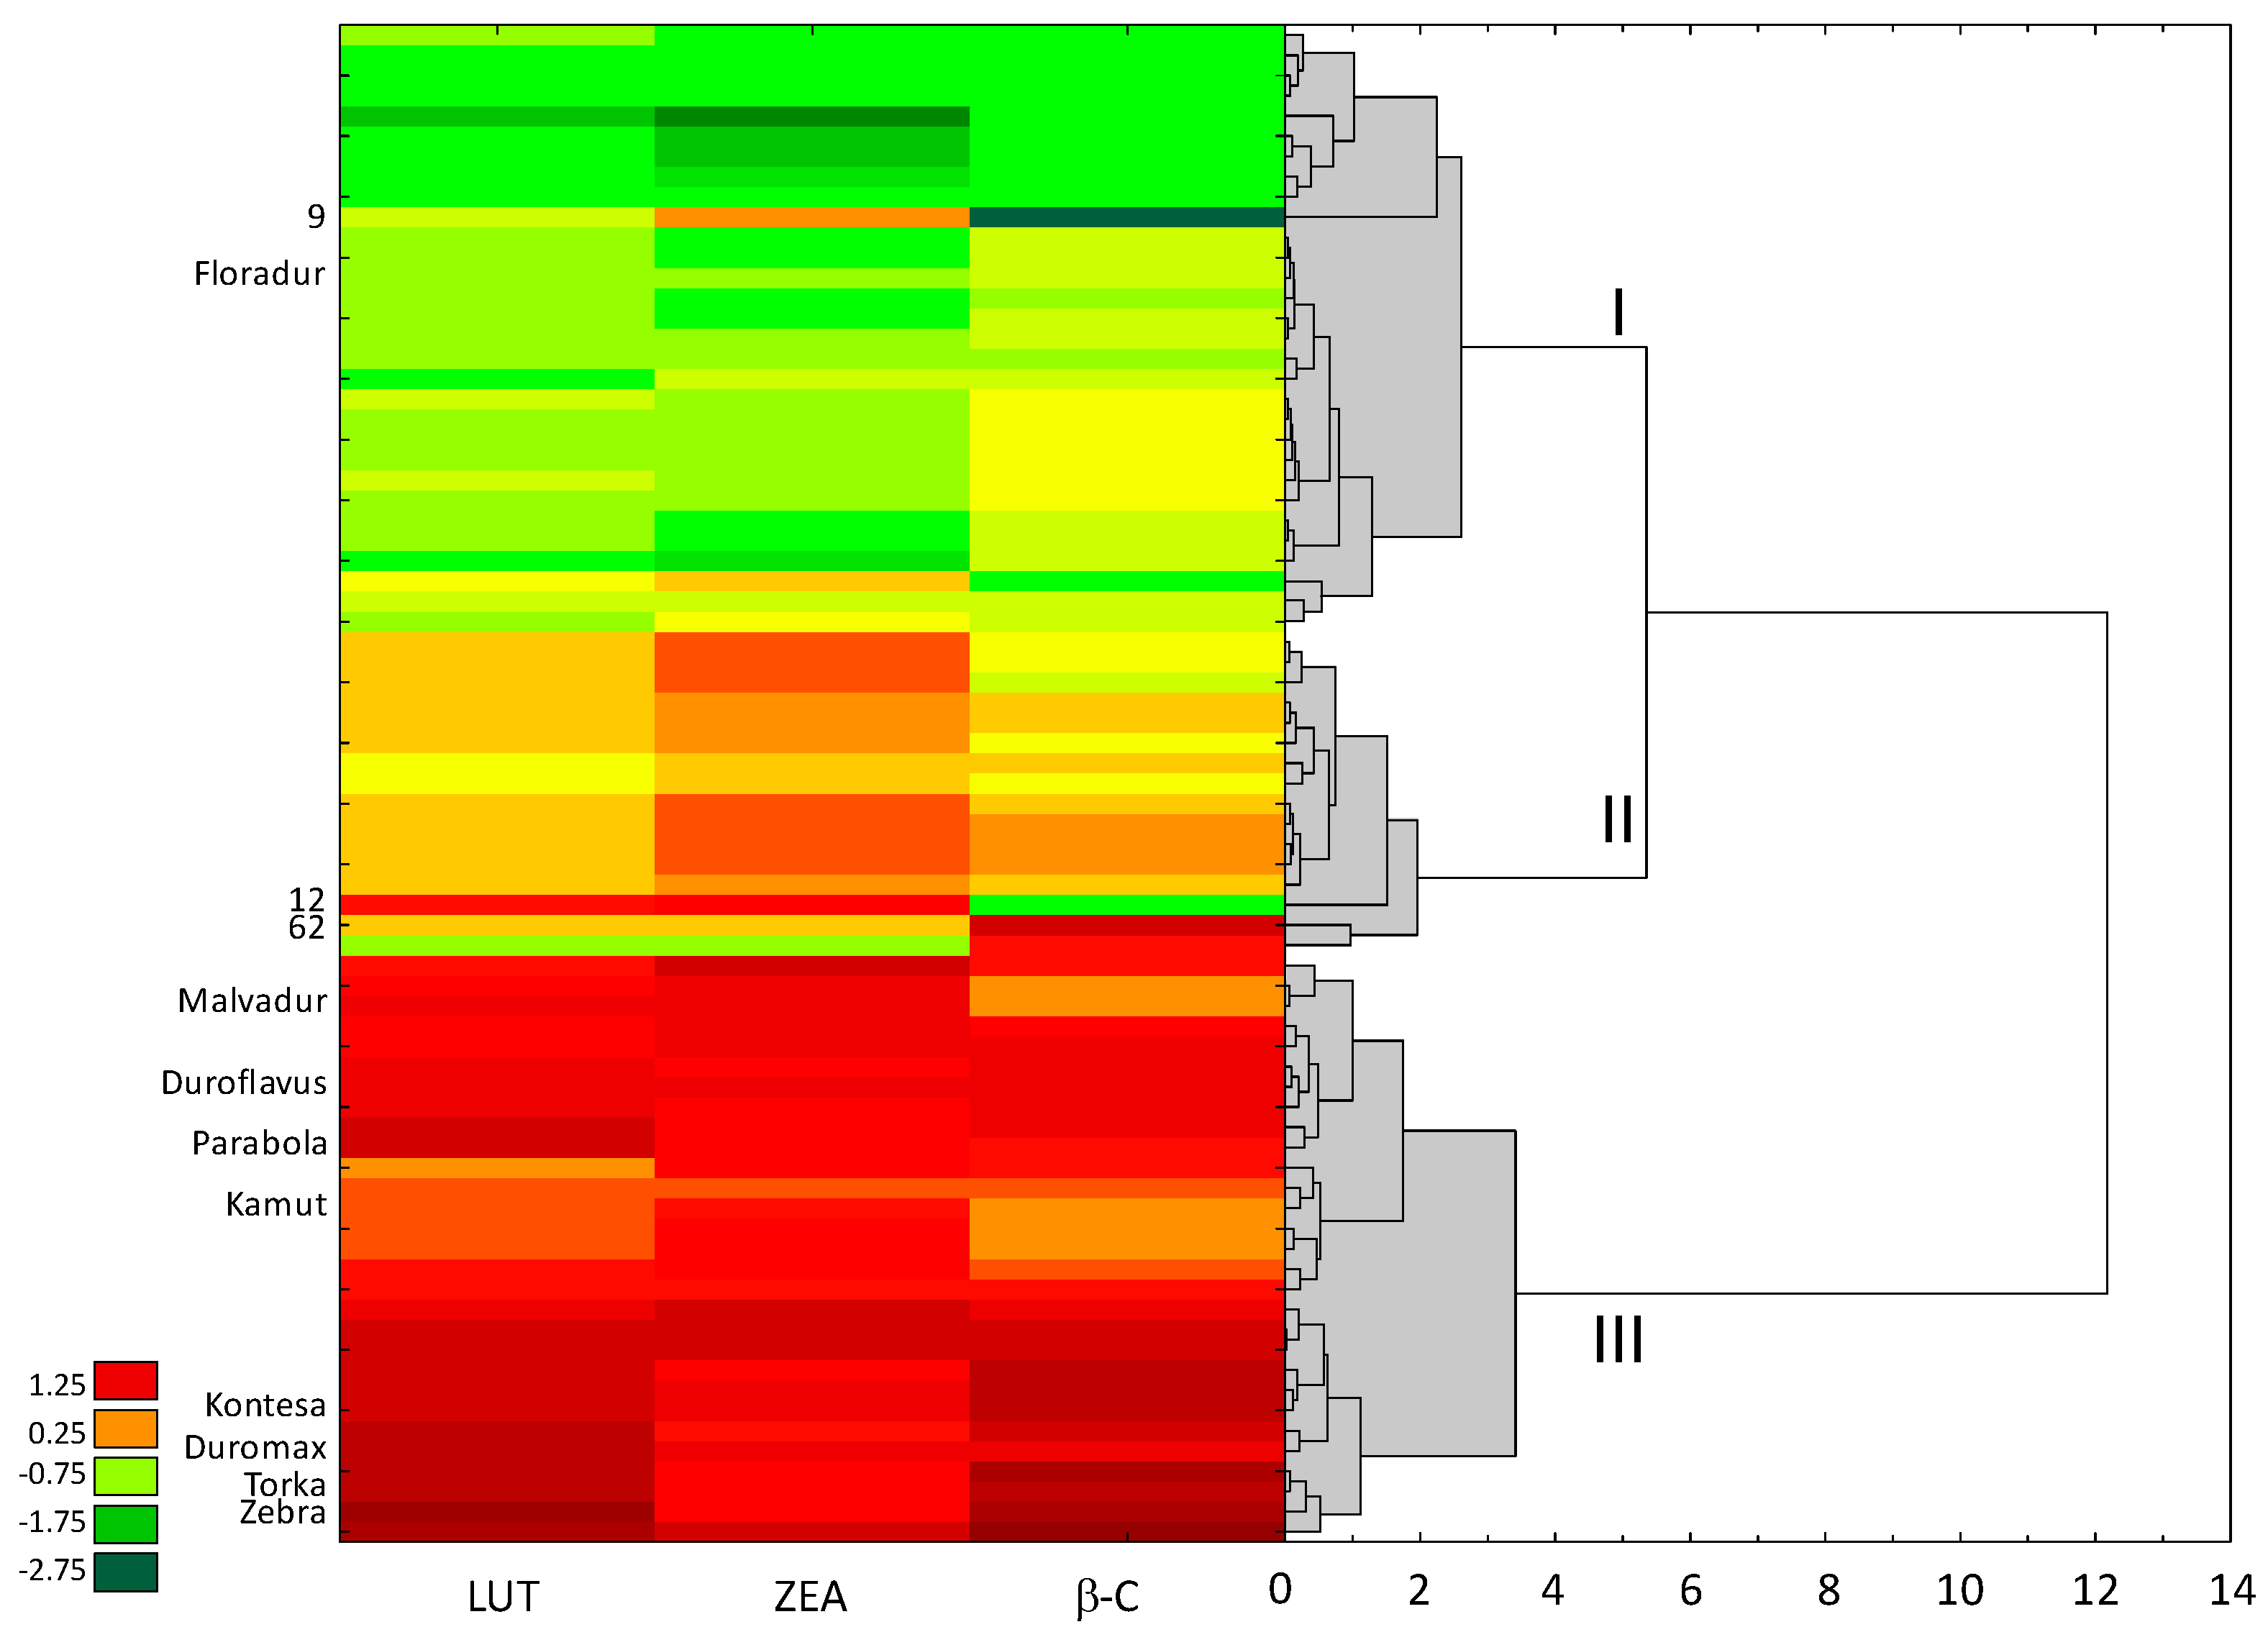
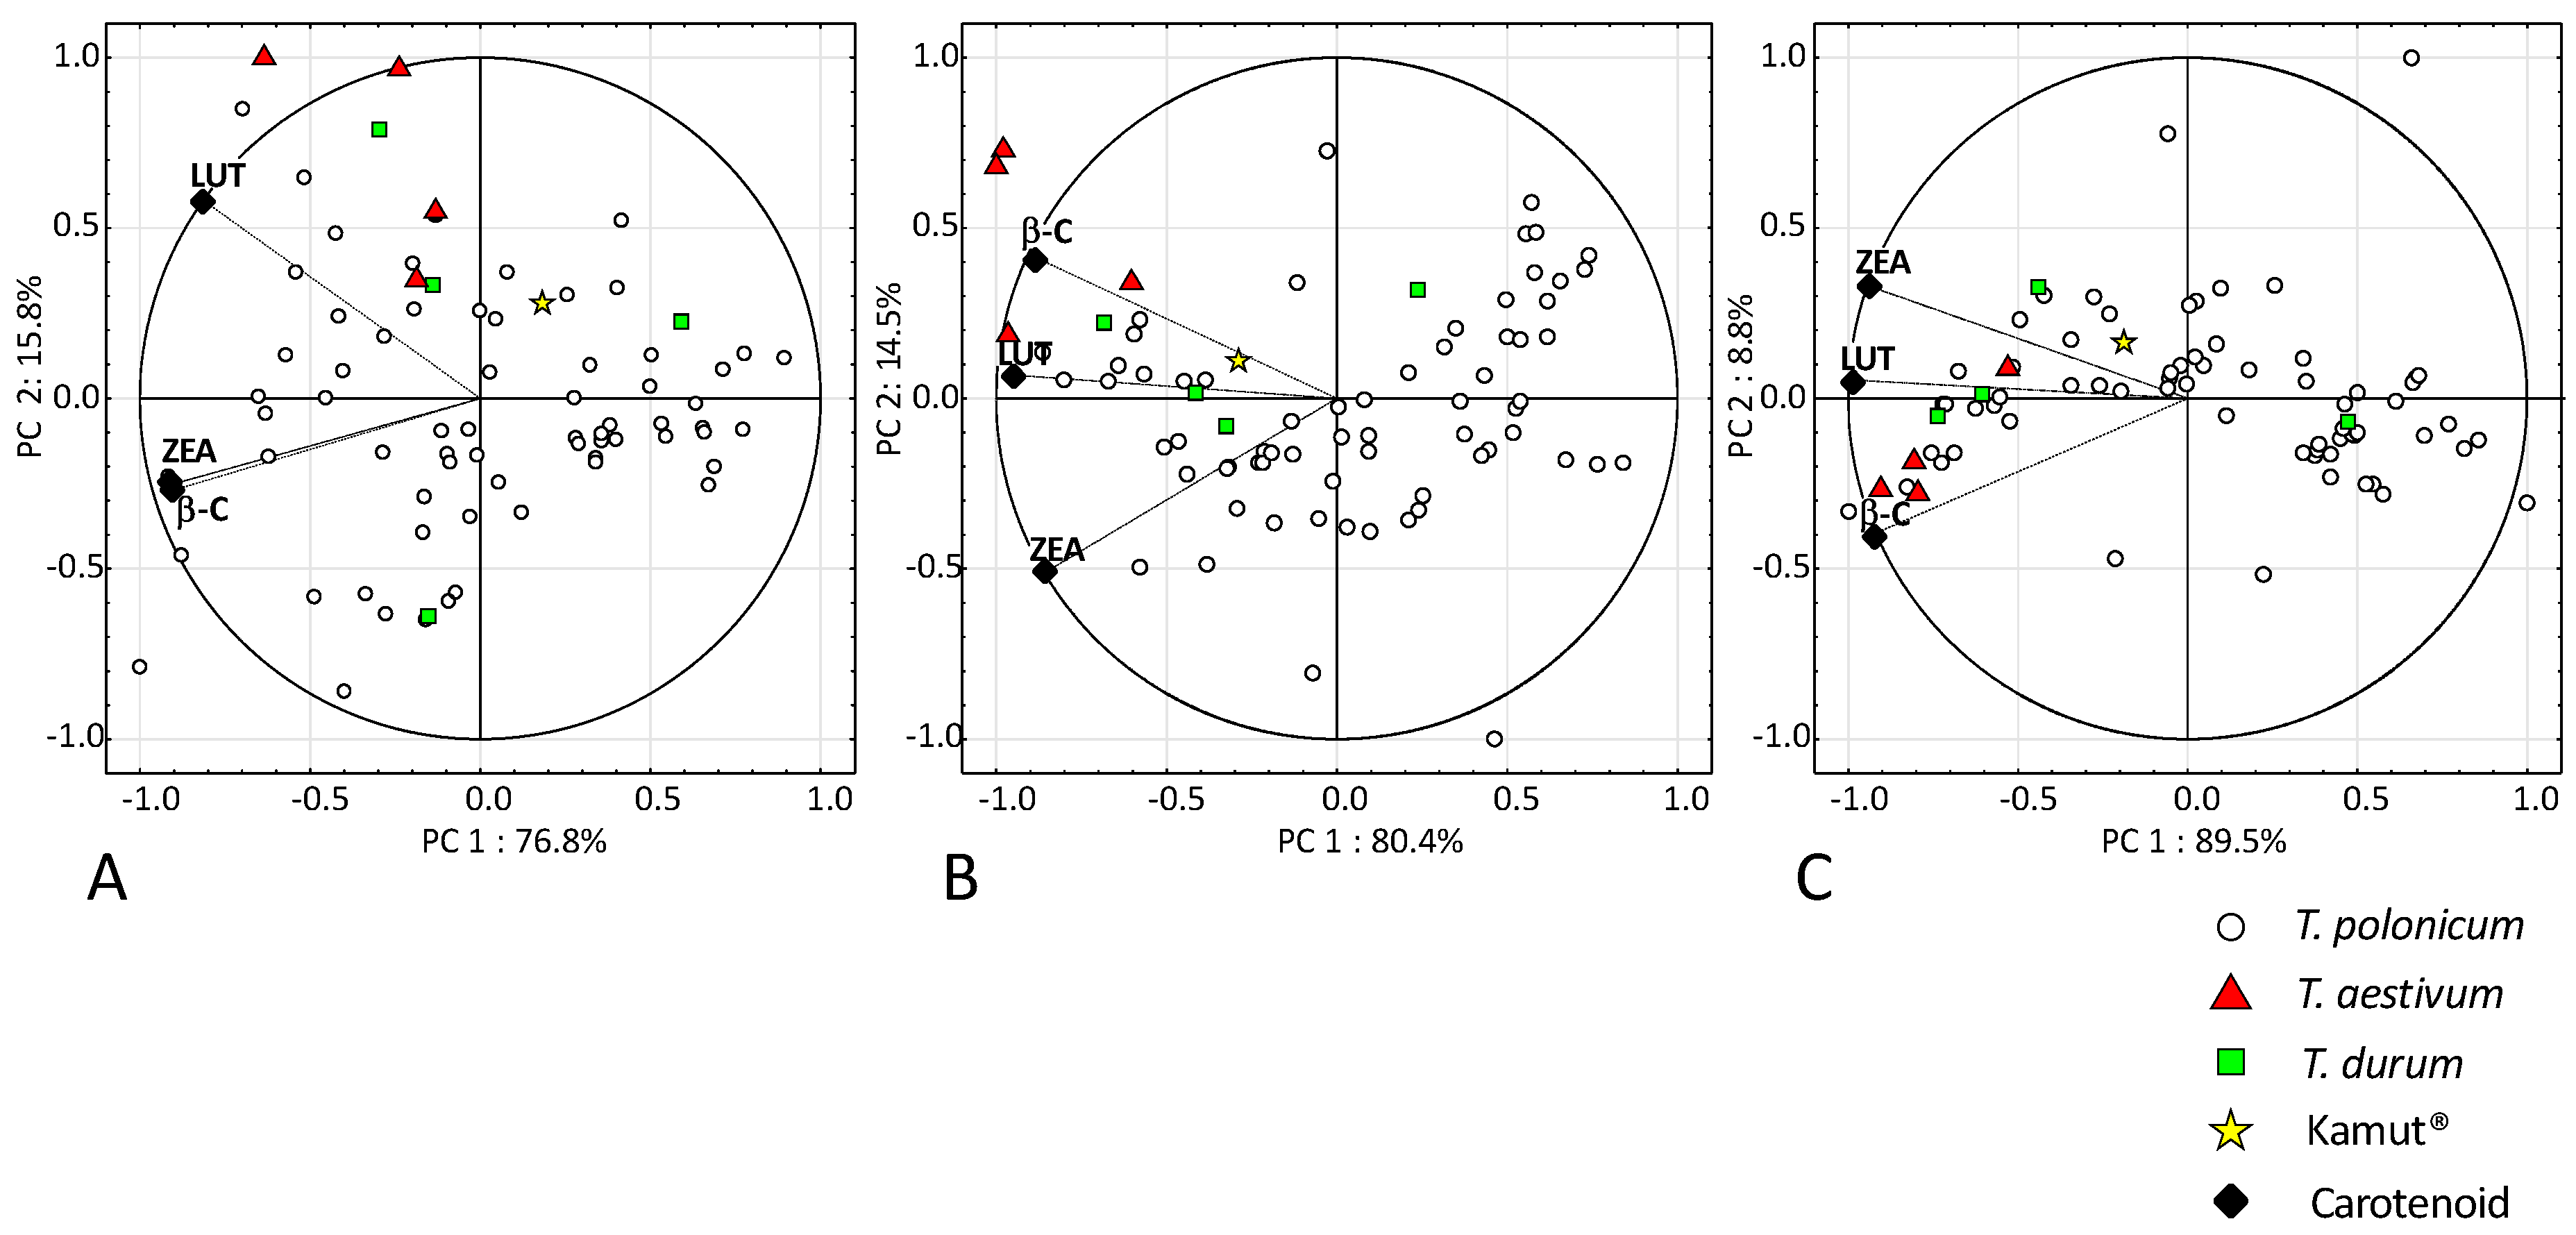
3.1. Antioxidant Activity (ABTS+) and Carotenoid Content

The antioxidant activity of the grain, flour, and bran of four Triticum species is presented in Figure 1. The analyzed wheat species did not differ significantly in average antioxidant activity, whereas significant differences were noted in the antioxidant activity of grain, flour, and bran (Figure 1). The antioxidant activity of flour and bran was significantly lowest in bread wheat, whereas Polish wheat, durum wheat, and Kamut® wheat did not differ significantly in this respect. It should be stressed that no significant differences in the antioxidant activity of grain were found between the examined species. A comparison of grain and both milling fractions revealed the highest antioxidant activity in bran, followed by grain and flour (4684, 1591, and 813 μM TE g−1, respectively) (Figure 1). The highest values were noted in Kamut® wheat at 874, 1542, and 5239 μM TE g−1 for flour, whole grain, and bran, respectively. However, these results were only somewhat higher than the mean values in Polish wheat and durum wheat, and the differences between the three species were not significant. The grain, flour, and bran of bread wheat were characterized by significantly the lowest antioxidant activity (12.67, 6.24, and 38.79 μM TE g −1, respectively).
The concentrations of LUT, ZEA, and β-C in the grain, flour, and bran of the evaluated wheat lines and cultivars are presented in Table 2 and Figure 2. The average content of LUT and ZEA was significantly highest in flour and grain, whereas the concentration of β-C was significantly highest in bran (nearly 9 times higher than in flour). The grain and both milling fractions of durum wheat were particularly abundant in carotenoids. The carotenoid content of durum wheat bran and whole grain was 36% and 53% higher, respectively, than in Polish wheat. The grain, flour, and bran of T. polonicum were least abundant in carotenoids relative to the remaining species, but significant differences were observed only between T. polonicum and T. durum. However, the grain of T. polonicum lines 3, 5, and 4 (Table 1) contained more LUT, ZEA, and β-C than durum wheat where the concentrations of these metabolites reached 1.92, 0.89, and 2.04 mg kg−1, respectively. Interestingly, LUT concentration was 36% higher in the flour than in the whole grain of T. polonicum, whereas in the remaining wheat species, the relevant difference ranged from 13% (bread wheat) to 24% (durum wheat and Kamut® wheat). The content of the three analyzed carotenoids in the grain, flour, and bran of Kamut® wheat approximated the mean values for Polish wheat.
The concentrations of LUT, ZEA, and β-C in the grain of all wheat lines and cultivars were examined by cluster analysis, and the results are presented in Figure 2. The heat map and the dendrogram supported the identification of three clusters. The objects in the first cluster were characterized by low ZEA content and average concentrations of LUT and β-C. The first cluster was composed of 29 T. polonicum lines and one durum wheat cultivar (cv. Floradur). In this group, special attention was paid to breeding line 9 (Table 1) which was characterized by an extremely low concentration of β-C (0.17 mg kg−1) and a relatively high, above-average content of ZEA (0.66 mg kg−1). The second cluster contained objects with higher concentrations of ZEA than those in the first cluster, and it was composed of only 16 Polish wheat lines. Two of these lines differed from the remaining ones in terms of the carotenoid profile: the grain of breeding line 61 was characterized by average concentrations of LUT and ZEA, and a relatively high content of β-C (1.96 mg kg−1), whereas the grain of breeding line 12 was relatively abundant in LUT and ZEA, but it was relatively deficient in β-C (0.85 mg kg−1). The third cluster was composed of lines and cultivars with the highest concentrations of all three carotenoids, including four cultivars of bread wheat, three cultivars of durum wheat, Kamut® wheat, and 21 lines of Polish wheat.
The results of the principal component analysis investigating the concentrations of three carotenoids in the flour, bran, and grain of all wheat lines and cultivars are presented in Figure 3. The circles in the biplots have a radius of 1 which represents the maximum absolute value of Pearson’s correlation coefficient between the variable (carotenoid) and the principal component. Vectors denote the direction and strength of correlations. The variables located near the circle are characterized by the highest discriminatory power. Discriminatory power decreases with distance from the circle. The results of PCA indicate that the grain of most Polish wheat lines contained less carotenoids than bread wheat, durum wheat, and Kamut® wheat. The cultivars of these wheat species, excluding cv. Floradur, were separated by small distances, and they formed a distinctive group of objects relative to the remaining lines and cultivars. The PCA of carotenoid levels in bran produced similar results, but bread wheat cultivars were clearly discriminated against. Such discrimination was not observed for flour. Two elite cultivars of bread wheat were characterized by very high levels of β-C relative to the remaining wheat lines and cultivars. Considerable differences in the carotenoid content of grain and both milling fractions were observed between Polish wheat accessions.

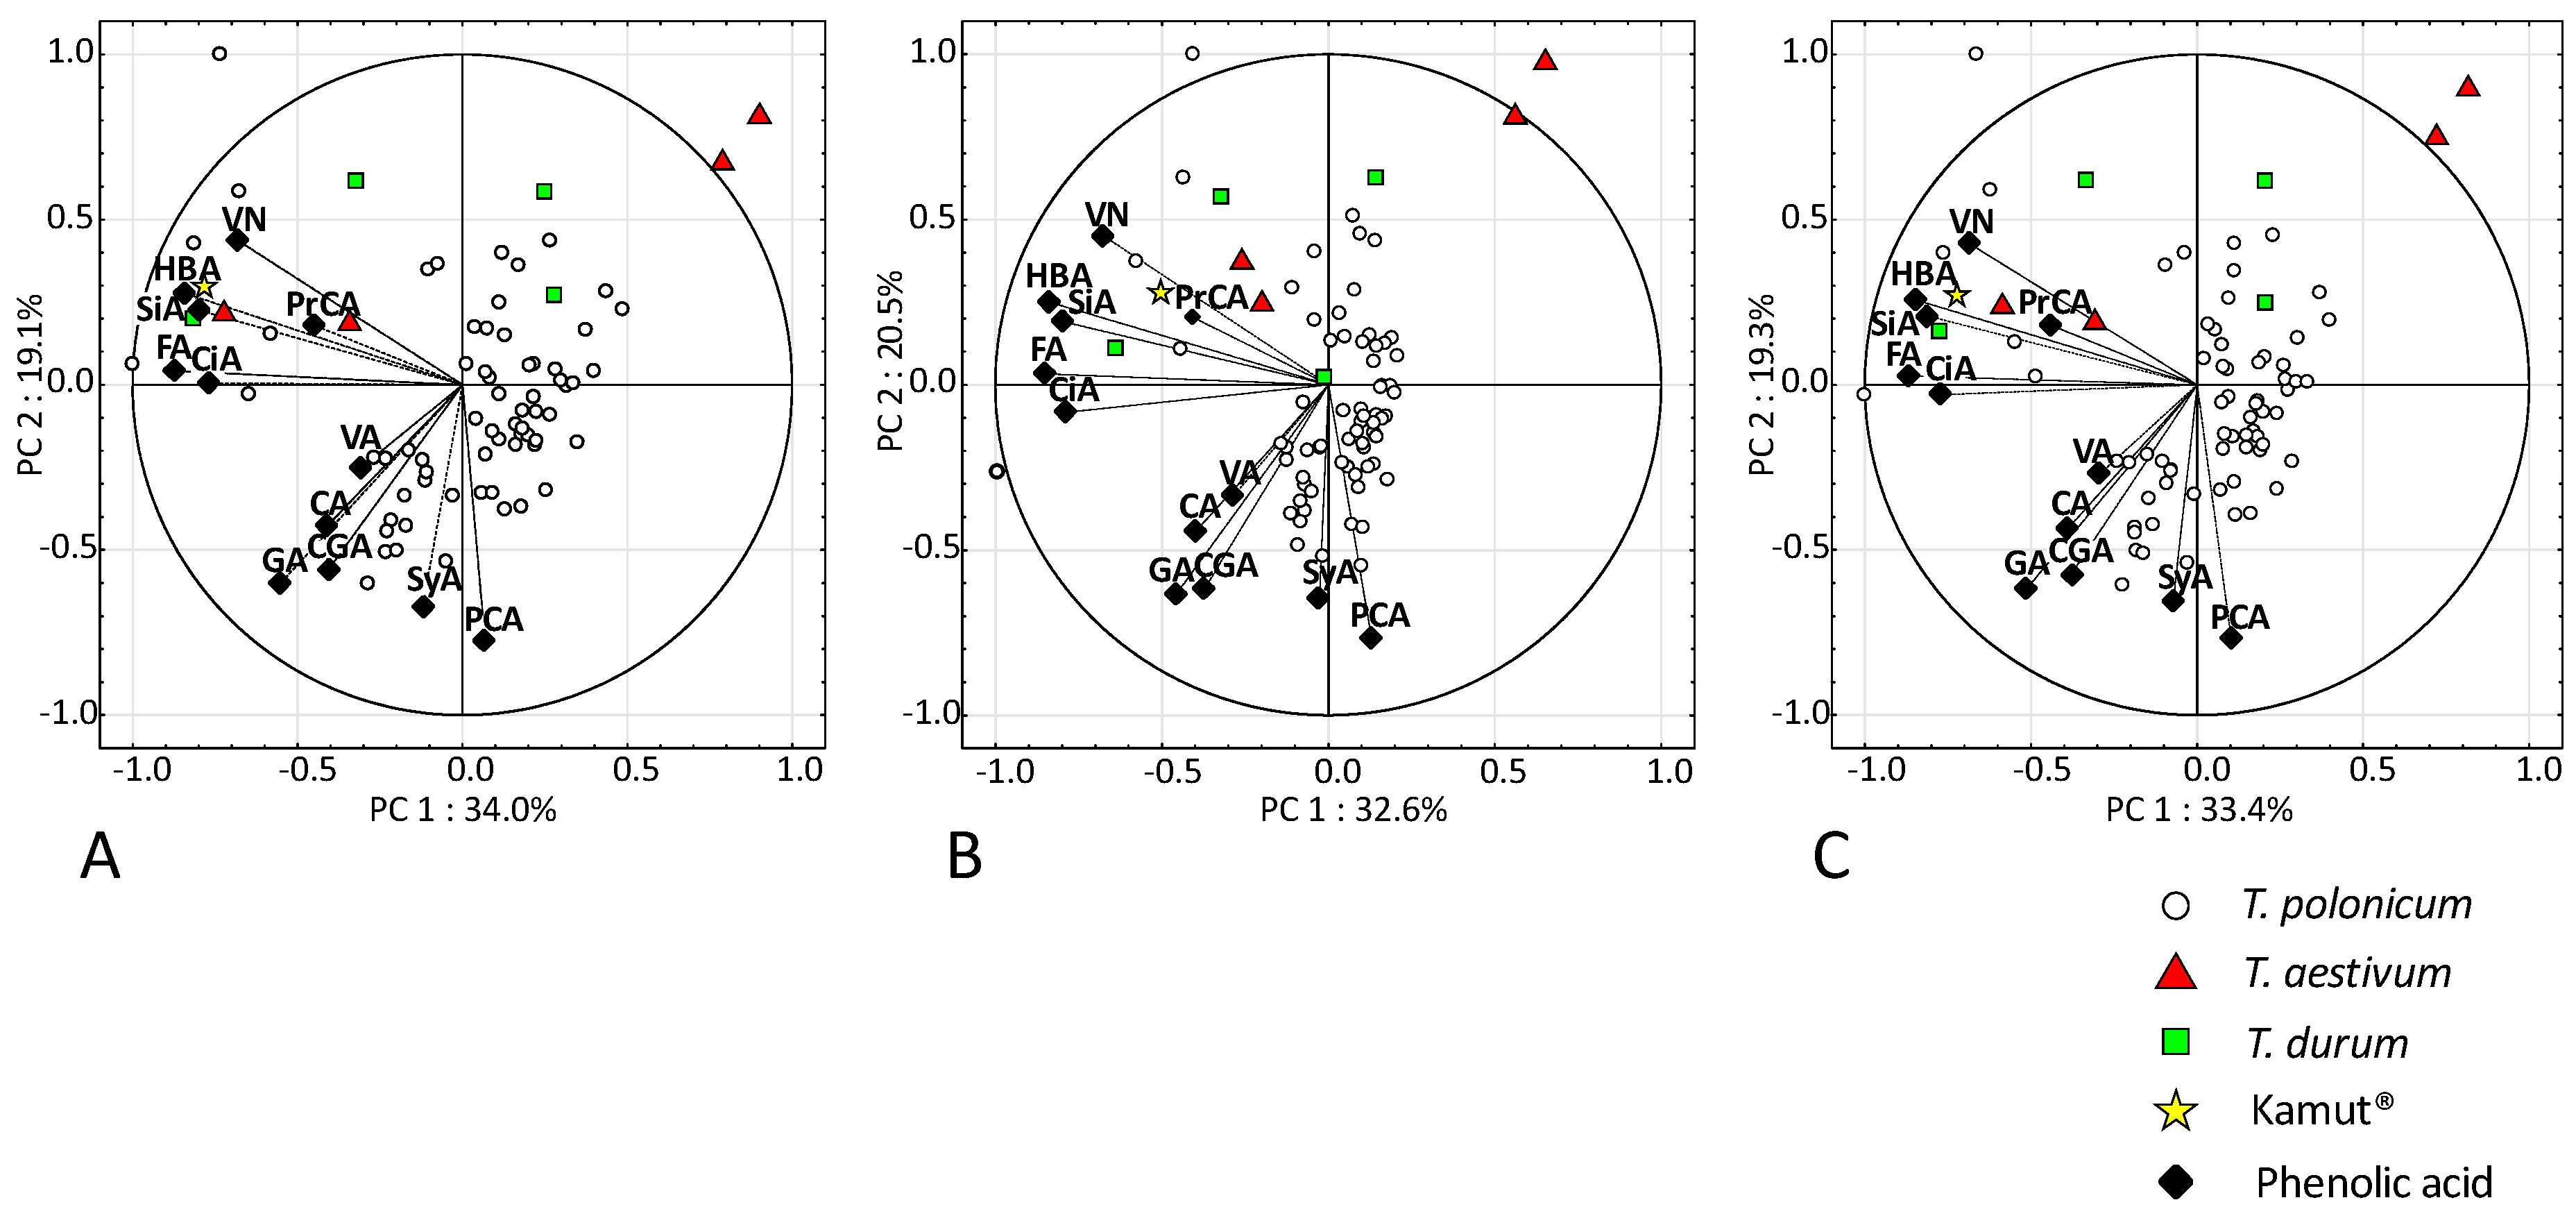
3.2. Content of Bound and Free Phenolic Acids (FPAs)

The mean concentrations of bound PAs, FPAs, and vanillin in four Triticum species are presented in Table 3. The studied species differed significantly in the content of most of the 11 analyzed PAs. In general, the concentrations of these metabolites were highest in bran and lowest in flour. Ferulic acid was the predominant PA in all milling fractions, and its content was highest in Kamut® wheat. The concentration of FA in Kamut® wheat grain (1455.8 mg kg−1) was nearly 2.7 times higher than in bread wheat (544.2 mg kg−1) and nearly twice higher than in Polish wheat (734 mg kg−1). Polish wheat was characterized by significantly highest concentrations of PCA and SyA (9.4 and 41 mg kg−1, respectively) and high concentrations of GA and CA (12.0 and 97.8 mg kg−1, respectively). The concentration of GA was slightly higher only in Kamut® wheat (14.9 mg kg−1). The grain, flour, and bran of Polish wheat lines were characterized by average concentrations of HBA, CA, PrCA, and CiA, compared with the remaining wheat species, but in all cases, these values were slightly higher than in bread wheat. Interestingly, T. polonicum samples were characterized by a relatively low concentration of VA and the significantly lowest concentration of its aldehyde VN, which was 2.5 to more than 3 times lower than in the grain and bran of bread wheat, respectively. Total PA concentrations in four Triticum species were compared based on standardized actual values because the differences between individual PAs reached two orders of magnitude. Total PA concentrations in grain, flour, and bran were highest in Kamut® wheat and lowest in bread wheat (Table 3). The concentrations of the studied PAs in grain were processed by cluster analysis, and the results are presented in a heat map and a dendrogram in Figure 4. The analysis supported the identification of six clusters, two of which (I and IV) contained only Polish wheat lines (28 and 17 lines, respectively, that accounted for 68.2% of all T. polonicum lines). Cluster II was composed of 14 T. polonicum lines and two T. durum cultivars. Cluster III contained two elite cultivars of T. aestivum which were characterized by the highest processing suitability, but very low concentrations of Ca, CGA, GA, and SyA in grain. Cluster V comprised five T. polonicum lines and Kamut® wheat with high CiA content and low CA content. Cluster VI grouped the remaining two cultivars of bread wheat and two durum wheat cultivars. Line POL-9 (PL 22195) was not included in any cluster and formed a separate object, mainly due to the highest concentration of PrCA and a relatively high content of SiA in grain. Polish wheat grain was characterized by high concentrations of PCA and SyA (9.4 and 41.0 mg kg−1, respectively) and low HBA content (65.2 mg kg−1) relative to the remaining species of the genus Triticum. The grain of Kamut® wheat (T. turanicum) which is closely related to T. polonicum was generally abundant in PAs, in particular HBA, CGA, FA, GA, and CiA. These observations corroborate the results of PCA concerning PA levels in grain, flour, and bran (Figure 5). The first two principal components explained 52.7% (grain) to 53.1% (flour and bran) of variance. Similar relationships were noted in grain and both milling fractions, which suggests that most Polish wheat accessions had a completely different PA profile than the remaining Triticum species.
The analyzed wheat species did not differ significantly in the concentrations of FPAs, but the content of these metabolites in grain and both milling fractions was highest in Kamut® wheat, followed by Polish wheat (Table 3). On average, FPA levels were highest in bran (3144 mg kg−1), followed by grain and flour (619 and 254 mg kg−1, respectively).

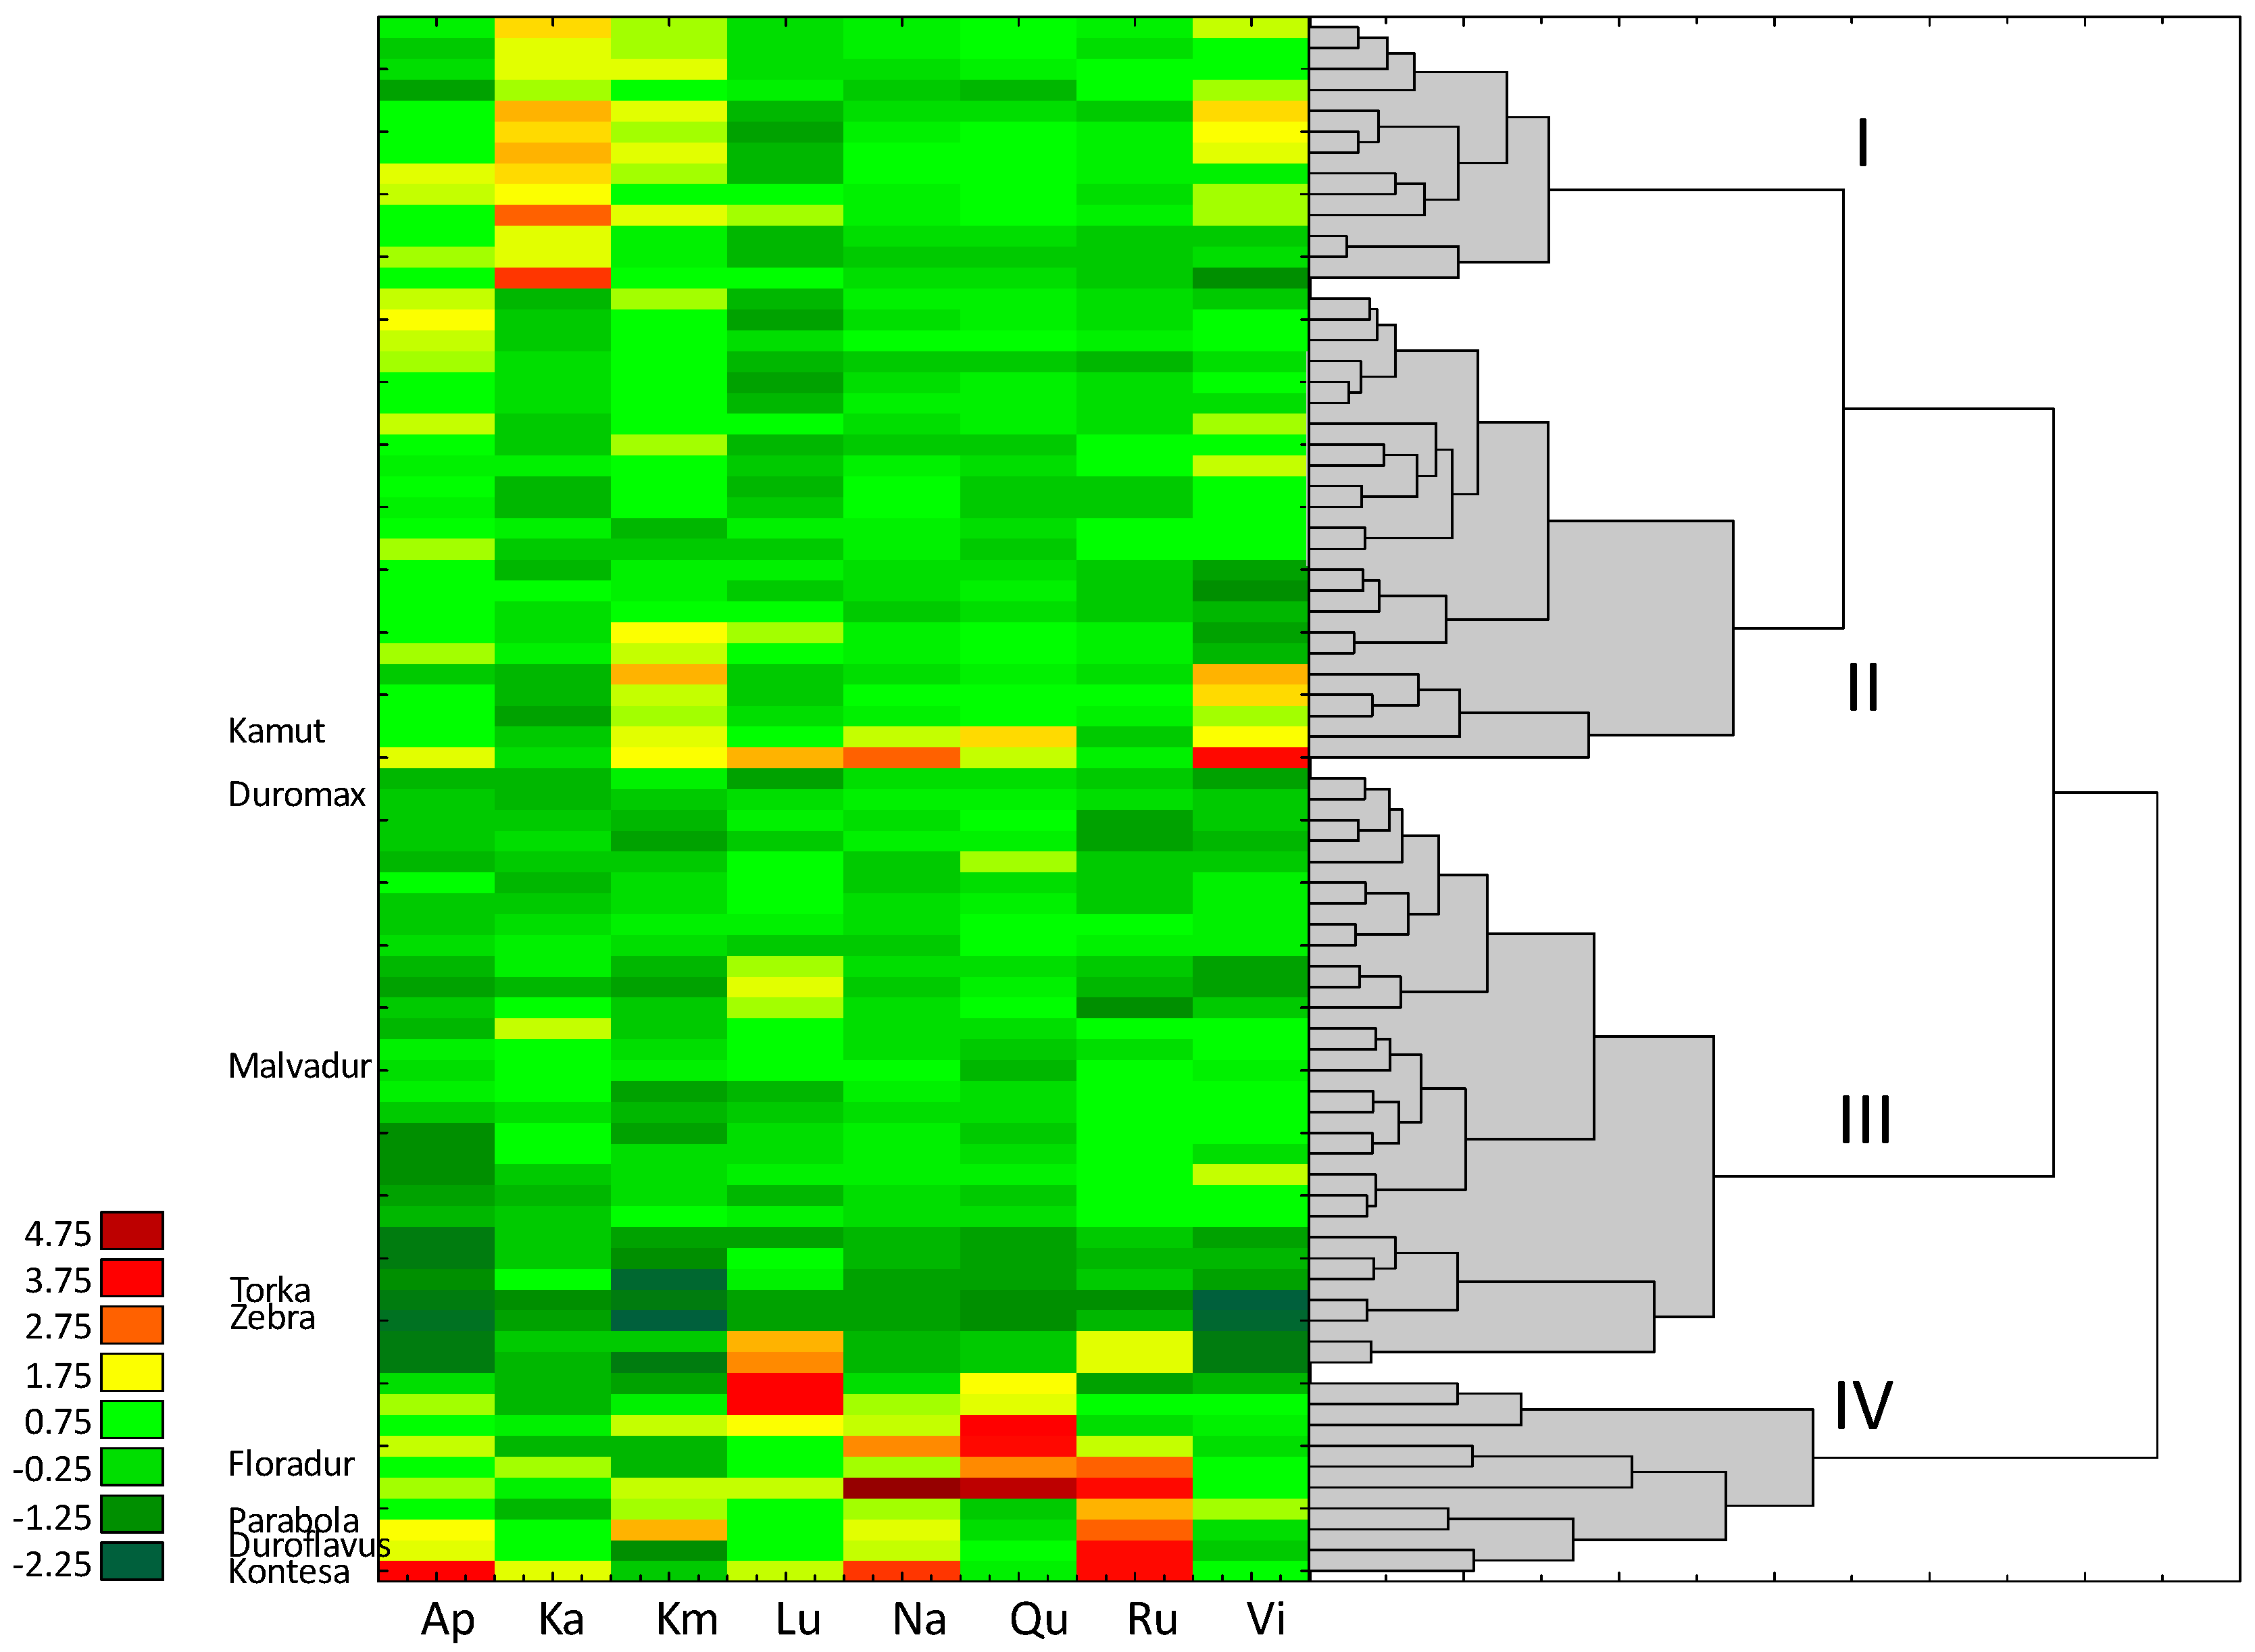
3.3. Content of Flavonoids

The average flavonoid content in the grain of four Triticum species is presented in Table 4. The concentrations of Ap and Lu (flavones), Qu and Km (flavonols), Na (flavanone), Ka (catechin), Ru and Vi (flavonoid glycosides) were determined. The analyzed Triticum species did not differ significantly in flavonoid content. Interestingly, significant differences were found only in the average concentrations of Ru in all milling fractions and grain. The content of Ru in T. polonicum flour (5.2 mg kg−1) was similar to that noted in the remaining species (from 4.0 to 8.9 mg kg−1 in Kamut® wheat and durum wheat, respectively). Polish wheat bran was significantly less abundant in Ru (20.4 mg kg−1) than durum wheat bran (38.3 mg kg−1). Rutin concentration was significantly lowest in the grain, flour, and bran of Kamut® wheat (6.3, 4.0, and 14.8 mg kg−1, respectively). In turn, all Kamut® wheat samples were characterized by very high concentrations of Qu, Na, and Vi, but significant differences were noted only in the content of Vi. The concentration of Qu in Kamut® wheat was more than five times higher than in bread wheat and more than twice higher than in Polish wheat. It should be noted that T. polonicum lines differed considerably in this respect, as demonstrated by the high value of relative standard deviation (RSD) at 72%. The grain of three Polish wheat lines contained more Qu than Kamut® wheat, and the highest Qu content was determined at 192.57 mg kg−1. Interestingly, the grain of these three T. polonicum accessions was also more abundant in Na than Kamut® wheat (47.8 to 140.4 mg kg−1).
The total concentrations of all analyzed flavonoids in the studied samples are presented in Table 4. The highest values were noted in the grain and both milling fractions of Kamut® wheat, followed by durum wheat. The total flavonoid content of Polish wheat was only marginally higher than in bread wheat. No significant differences were found between the studied Triticum species.
The results of the cluster analysis investigating the concentrations of eight flavonoids in the grain of all studied wheat lines and cultivars are presented in a dendrogram and a heat map in Figure 6.
Cluster I contained only 13 T. polonicum lines which were characterized by a high concentration of Ka, a relatively low concentration of Lu, and varied concentrations of Vi. Cluster II was composed of 22 Polish wheat lines and Kamut® wheat with low concentrations of Ka and Lu, and highly varied Vi content. Cluster II included accession 50 (PL 22479) whose grain was characterized by the highest content of Vi (35.55 mg kg−1) and one of the highest concentrations of Na (79.37 mg kg−1) relative to the remaining lines and cultivars. The largest third cluster grouped 29 objects, including 25 T. polonicum lines, two T. durum cultivars, and two T. aestivum cultivars. The main distinguishing feature of these objects was the low content of Ap, K, and Vi. The grain of bread wheat cv. Torka was characterized by the lowest concentration of Vi (0.43 mg kg−1) relative to the remaining wheat lines and cultivars, whereas the grain of bread wheat cv. Zebra was least abundant in Km and Ap (1.03 and 2.30 mg kg−1, respectively). Torka and Zebra are elite cultivars with the highest processing suitability. Cluster IV was composed of six Polish wheat accessions, two durum wheat cultivars, and two bread wheat cultivars. This cluster contained breeding lines derived from accession PI 167622 with the highest content of Na, Qu, and Ru in grain (140.35, 192.57 and 21.54 mg kg−1, respectively), accessions PL 22195 and PI 191881 with high levels of Qu (145.13 and 154.17 mg kg−1, respectively), as well as accessions PL 22991 and PI 16762 with the highest concentration of Lu in grain (129.9 and 124.59 mg kg−1, respectively.
The discrimination of the analyzed wheat lines and cultivars based on the PCA of flavonoid concentrations in flour, bran, and grain was highly similar to that noted in the PCA of PAs (Figure 7). The first two PCs explained 58.1% to 59% of the total variance, and the concentrations of Lu, Ru, and Ka had the lowest discriminatory power. The grain of bread wheat cultivars, in particular Torka and Zebra, had a completely different flavonoid profile than T. polonicum, which is consistent with the results of PA analysis.

4. Discussion

Triticum polonicum remains insufficiently investigated. Contemporary tetraploid wheat species, in particular T. durum, and, to a much smaller extent, T. dicoccon and Kamut® wheat (T. turanicum), play a far less important role than bread wheat (T. aestivum) in the global economy. Durum wheat, the most economically important tetraploid species, is grown on nearly 13 million hectares around the world, and global grain yields reach 40 million tons [32]. In turn, more than 731 million tons of bread wheat grain were produced in the 2018/2019 season [33]. The remaining alternative Triticum species continue to attract the growing interest of consumers and agricultural producers, in particular organic farmers [34], but their share of the global wheat market is unlikely to increase significantly in the near future. However, the nutritional value and health benefits of various wheat taxa, in particular those that could potentially be used for breeding new cultivars, should be studied. The results of fluorescence in situ hybridization revealed similarities as well as differences in the chromosomal organization of T. polonicum relative to T. dicoccon, T. durum, and T. turanicum [35]. These observations pave the way for future research into hybrids of Polish wheat and other tetraploid wheat species.
In the present study, T. polonicum was compared with four cultivars of bread wheat characterized by significant differences in the processing suitability of grain, four durum wheat cultivars with high processing suitability, and Kamut® wheat. Kamut® wheat is renowned for its high nutritional value, health benefits, and the presence of gluten proteins with low allergenic potential [36]. The taxonomic status of Kamut® wheat stirred controversy for many years. This tetraploid wheat had been classified as Triticum polonicum, T. turanicum Jakubz., T. turgidum, and T. durum [37]. These results suggest that Kamut® wheat has originated from naturally occurring Triticum dicoccon conv. dicoccon × T. polonicum hybrids. In turn, Khlestkina et al. [38] postulated that Kamut® wheat was derived from natural interbreeding between T. durum and T. polonicum. Kamut® wheat was used in the current experiment because it is closely related to Polish wheat.

4.1. Antioxidant Activity

The ABTS capacity of 66 T. polonicum lines ranged from 1320 to 2208 µmol TE kg−1 of grain, 4016 to 6218 µmol TE kg−1 of bran, and 618 to 985 µmol TE kg−1 of flour. Despite the absence of significant differences in the average ABTS capacity of grain in the four analyzed Triticum species, significant differences were found in flour and bran, where ABTS capacity was significantly lowest in bread wheat. Contrary to the results reported by Shahidi and Liyana-Pathirana [11], the antioxidant activity of T. durum grain, bran, and flour were not significantly lower than in bread wheat. The opposite was noted: the ABTS capacity of milling fractions was significantly higher in T. durum than in bread wheat, which corroborates the findings of Ciudad-Mulero et al. [39]. According to these authors, the absorbance of DPPH radicals was significantly higher in durum wheat grain than in bread wheat. These results also point to the absence of a strong correlation between antioxidant activity and phenolic content. In turn, such a positive correlation was reported by Lv et al. [40] and Shahidi and Liyana-Pathirana [11]. In the present experiment, the ABTS capacity of whole grain was not significantly correlated with total PA content. However, while the correlation coefficient r approximated 0 in 66 breeding lines of T. polonicum, it was determined at 0.664 in nine cultivars of the remaining three Triticum species, i.e., on the threshold of significance (p < 0.05). ABTS capacity was nearly three times higher in bran than in grain, but significant correlations were not observed in T. polonicum. In the remaining nine cultivars, the value of r was significant at 0.742. In wheat grain, most metabolites responsible for antioxidant activity are located in the pericarp fused with the seed coat and the germ. High antioxidant activity of wheat fractions, in particular germ and bran, was reported in several studies. Some authors have also demonstrated that the aleurone layer is more abundant in antioxidant compounds than other bran tissues, mainly due to its high PA content [41].

4.2. Phenolic Acids

Ferulic acid was the predominant PA in the grain of all four Triticum species, and it accounted for 53.4% (durum wheat) to 62.1% (Kamut® wheat) of total bound PAs. These results are lower than the values reported by Horvat et al. [42] in bread wheat grain. In the cited study, FA concentration peaked at 448 mg g−1, accounting for 74% of all bound PAs. According to Klepacka and Fornal [43], this powerful antioxidant was the major PA in wheat and barley grain, whereas SyA was predominant in oat, rye, and buckwheat grain. In the above study, FA concentration was significantly higher in the seed coat of wheat, and its content in ester linkages was many-fold higher than in insoluble complexes. In the current experiment, the concentrations of FA and bound PAs were 2.5-times higher on average in bran than in whole grain. Ferulic acid content was highest in Kamut® wheat grain at 1455 mg kg−1. In the work of Abdel-Aal and Rabalski [44], Kamut® wheat contained 326 mg g−1 FA, which is nearly 4.5 times less than in this experiment. According to the above authors, the FA content of Kamut® wheat did not differ significantly from that determined in soft, hard, and durum wheat. Kamut® wheat (T. turanicum), which is closely related to T. polonicum, has a unique genetic structure. In 1949, 36 kernels of Kamut® wheat were imported from Egypt and grown in the USA [45]. Therefore, Kamut® wheat has a relatively narrow genetic base, which is responsible for the high ecovalence and a strong response to environmental stratification in self-pollinating plants such as T. turanicum. These observations were validated by Di Loreto et al. [46] who studied the impact of environmental factors on the quality of Kamut® Khorasan grain grown on the same farm in Montana (USA) for two decades. The cited authors analyzed the accumulation of phytochemicals in grain and reported considerable variations in the content of macronutrients and nutraceuticals, including total polyphenol content. They concluded that environmental factors play a fundamental role in the accumulation of primary and secondary metabolites in wheat kernels. In the present study, Kamut® wheat grain was characterized by the highest content of FA as well as four other PAs: HBA, CGA, GA, and CiA. According to Shahidi and Liana-Pathirana [11], total phenolic content was nearly three times higher in the bran than in the whole grain of Canada Western Amber Durum (CWAD) wheat and Canada Western Red Spring (CWRS) wheat, which corroborates the results of this experiment. The grain and bran of Polish wheat were characterized by relatively high concentrations of SyA and PCA, which was their distinguishing feature. In this respect, Polish wheat differed considerably from the remaining Triticum species despite the low proportions of these PAs in total bound PAs (SyA—2.9%; PCA—0.7%). Similar to other PAs, SyA is a powerful antioxidant with antimicrobial, anti-inflammatory, anticarcinogenic, and anti-diabetic properties which exert protective effects on the heart, liver, and brain [47]. Therefore, the high content of SyA enhances the nutritional value of T. polonicum grain.

4.3. Flavonoids

Wheat grain is not highly abundant in flavonoids. These metabolites are important bioactive compounds with considerable antioxidant potential. They are found mainly in colored fruits and vegetables, and they deliver a host of health benefits. Flavonoid concentrations are highest in wheat varieties with colored, in particular, purple and black, grain [48]. According to Lachman et al. [49], purple and blue grain is a rich source of anthocyanins, whereas wheat species with yellow grain, including durum wheat and einkorn, are rich in carotenoids and are suitable for the production of pasta. In the present study, all cultivars and lines of the examined Triticum species had light yellow or golden yellow grain, which can probably be attributed to minor differences in the flavonoid content of grain and milling fractions. However, Polish wheat did not differ considerably from bread wheat and durum wheat in terms of total flavonoid concentrations. The grain and both milling fractions of Kamut® wheat were most abundant in flavonoids, but the observed differences were not significant. The abundance of flavonoids in Kamut® wheat can be attributed to a very high concentration of Qu which was more than five times higher than in bread wheat and more than twice higher than in durum wheat. The high content of Qu in Kamut® wheat could be linked with low levels of Ru which is a Qu glycoside. Therefore, it appears that the Ru biosynthetic pathway proceeds differently in Kamut® wheat than in other wheat species. The results of this study, in particular phenolic and flavonoid concentrations, confirm other authors’ findings that Kamut® wheat has high nutritional value and offers potential health benefits [46,50].

5. Conclusions

The grain and milling fractions of the analyzed T. polonicum lines differed considerably in antioxidant activity and the concentrations of carotenoids, PAs, and flavonoids. In Polish wheat, the mean content of the analyzed metabolites was higher than in bread wheat and somewhat lower than in durum wheat. Polish wheat grain can be a valuable resource for the production of functional foods with health-promoting properties and for breeding new varieties. The grain and milling fractions of several T. polonicum lines were characterized by higher concentrations of the examined nutraceuticals than Kamut® wheat. In view of the substantial impact of environmental factors on the accumulation of primary and secondary metabolites in wheat grain, further research is needed to determine the agronomic potential of these lines.

Author Contributions

Conceptualization, E.S. and M.W.; methodology, K.S.-S. and E.S.; investigation, K.S.-S. and T.B.; writing—original draft preparation, E.S.; writing—review and editing, M.W.; visualization, M.W. All authors have read and agreed to the published version of the manuscript.

Funding

Project financially supported by Minister of Science and Higher Education in the range of the program entitled “Regional Initiative of Excellence” for the years 2019–2022, Project No. 010/RID/2018/19, amount of funding 12.000.000 PLN.

Conflicts of Interest

The authors declare no conflict of interest.

Abbreviations

PA—phenolic acid, HBA—4-hydroxybenzoic acid, CA—caffeic acid, CGA—chlorogenic acid, FA—ferulic acid, GA—gallic acid, PCA—p-coumaric acid, PrCA—protocatechuic acid, SiA—sinapic acid, SyA—syringic acid, CiA—t-cinnamic acid, VA—vanillic acid, FPA—free phenolic acids, VN—vanillin, Ap—apigenin, Ka—catechin, Km—kaempferol, Lu—luteolin, Na—naringenin, Qu—quercetin, Ru—rutin, Vi—vitexin, LUT—lutein, ZEA—zeaxanthin, β-C—β-carotene.

References

  1. Đor₫ević, T.M.; Šiler-Marinković, S.S.; Dimitrijević-Brankovic, S.I. Effect of fermentation on antioxidant properties of some cereals and pseudo cereals. Food Chem. 2010, 119, 957–963. [Google Scholar] [CrossRef]
  2. Dykes, L.; Rooney, L.W. Phenolic compounds in cereal grains and their health benefits. Cereal Food World 2007, 52, 105–111. [Google Scholar] [CrossRef]
  3. Hidalgo, A.; Brandolini, A. Nutritional properties of einkorn wheat (Triticum monococcum L.). J. Sci. Food Agric. 2014, 94, 601–612. [Google Scholar] [CrossRef] [PubMed]
  4. Fares, C.; Platani, C.; Baiano, A.; Menga, V. Effect of processing and cooking on phenolic acid profile and antioxidant capacity of durum wheat pasta enriched with debranning fractions of wheat. Food Chem. 2010, 119, 1023–1029. [Google Scholar] [CrossRef]
  5. Leoncini, E.; Prata, C.; Malaguti, M.; Marotti, I.; Segura-Carretero, A.; Catizone, P.; Dinelli, G.; Hrelia, S. Phytochemical Profile and Nutraceutical Value of Old and Modern Common Wheat Cultivars. PLoS ONE 2012, 7, e45997. [Google Scholar] [CrossRef] [Green Version]
  6. Ward, J.L.; Poutanen, K.; Gebruers, K.; Piironen, V.; Lampi, A.-M.; Nyström, L.; Andersson, A.A.; Boros, D.; Rakszegi, M.; Bedo, Z.; et al. The HEALTHGRAIN cereal diversity screen: Concept, results, and prospects. J. Agric. Food Chem. 2008, 56, 9699–9709. [Google Scholar] [CrossRef]
  7. Giambanelli, E.; Ferioli, F.; Kocaoglu, B.; Jorjadze, M.; Alexieva, I.; Darbinyan, N.; Antuono, F. A comparative study of bioactive compounds in primitive wheat populations from Italy, Turkey, Georgia, Bulgaria and Armenia. J. Sci. Food Agric. 2013, 93, 3490–3501. [Google Scholar] [CrossRef]
  8. Arzani, A.; Ashraf, M. Cultivated ancient wheats (Triticum spp.): A potential source of health-beneficial food products. Compr. Rev. Food Sci. F 2017, 16, 477–488. [Google Scholar] [CrossRef] [Green Version]
  9. Atanasova-Penichon, V.; Barreau, C.; Richard-Forget, F. Antioxidant Secondary Metabolites in Cereals: Potential Involvement in Resistance to Fusarium and Mycotoxin Accumulation. Front. Microbiol. 2016, 7, 566. [Google Scholar] [CrossRef] [Green Version]
  10. Abdel-Aal, E.S.; Hucl, P.; Sosulski, F.W.; Graf, R.; Gillott, C.; Pietrzak, L. Screening Spring Wheat for Midge Resistance in Relation to Ferulic Acid Content. J. Agric. Food Chem. 2001, 49, 3559–3566. [Google Scholar] [CrossRef]
  11. Shahidi, F.; Liana-Pathirana, C. Antioxidant properties of wheat grain and its fractions. In Wheat Antioxidants; Yu, L., Ed.; John Wiley & Sons Inc.: Hoboken, NJ, USA, 2008; pp. 7–23. [Google Scholar]
  12. Gorinstein, S.; Lojek, A.; Ciz, M.; Pawelzik, E.; Delgado-Licon, E.; Medina, O.J.; Moreno, M.; Salas, I.A.; Goshev, I. Comparison of composition and antioxidant capacity of some cereals and pseudocereals. Int. J. Food Sci. Technol. 2008, 43, 629–637. [Google Scholar] [CrossRef]
  13. Adom, K.K.; Liu, R.H. Antioxidant activity of grains. J. Agric. Food Chem. 2002, 50, 6182–6187. [Google Scholar] [CrossRef] [PubMed]
  14. Ndolo, V.U.; Beta, T. Comparative studies on composition and distribution of phenolic acids in cereal grain botanical fractions. Cereal Chem. 2014, 91, 522–530. [Google Scholar] [CrossRef]
  15. Irakli, M.N.; Samanidou, V.F.; Biliaderis, C.G.; Papadoyannis, I.N. Development and validation of an HPLC-method for determination of free and bound phenolic acids in cereals after solid-phase extraction. Food Chem. 2012, 134, 1624–1632. [Google Scholar] [CrossRef]
  16. Boz, H. Ferulic acid in cereals-a review. Czech J. Food Sci. 2015, 33, 1–7. [Google Scholar] [CrossRef] [Green Version]
  17. Das, A.K.; Singh, V. Antioxidative free and bound phenolic constituents in pericarp, germ and endosperm of Indian dent (Zea mays var. indentata) and flint (Zea mays var. indurata) maize. J. Funct. Food 2015, 13, 363–374. [Google Scholar] [CrossRef]
  18. Mpofu, A.; Sapirstein, H.D.; Beta, T. Genotype and environmental variation in phenolic content, phenolic acid composition, and antioxidant activity of hard spring wheat. J. Agric. Food Chem. 2006, 54, 1265–1270. [Google Scholar] [CrossRef]
  19. Fernandez-Orozco, R.; Li, L.; Harflett, C.; Shewry, P.R.; Ward, J.L. Effects of environment and genotype on phenolic acids in wheat in the HEALTHGRAIN diversity screen. J. Agric. Food Chem. 2010, 58, 9341–9352. [Google Scholar] [CrossRef]
  20. Shewry, P.R.; Piironen, V.; Lampi, A.-M.; Edelmann, M.; Kariluoto, S.; Nurmi, T.; Fernandez-Orozco, R.; Andersson, A.A.M.; Åman, P.; Fraś, A.; et al. Effects of Genotype and Environment on the Content and Composition of Phytochemicals and Dietary Fiber Components in Rye in the HEALTHGRAIN Diversity Screen. J. Agric. Food Chem. 2010, 58, 9372–9383. [Google Scholar] [CrossRef]
  21. Falk, J.; Krahnstover, A.; van der Kooij, T.A.W.; Schlensog, M.; Krupinska, K. Tocopherol and tocotrienol accumulation during development of caryopses from barley (Hordeum vulgare L.). Phytochemistry 2004, 65, 2977–2985. [Google Scholar] [CrossRef]
  22. Onyeneho, S.N.; Hettiarachchy, N.S. Antioxidant activity of durum wheat bran. J. Agric. Food Chem. 1992, 40, 1496–1500. [Google Scholar] [CrossRef]
  23. Miller, H.E.; Rigelhof, F.; Marquart, L.; Prakash, A.; Kanter, M. Whole-grain products and antioxidants. Cereal Food World 2000, 45, 59–63. [Google Scholar]
  24. Quaglia, G. Other Durum Wheat Products. In Durum Wheat: Chemistry and Technology; Fabriani, G., Lintas, C., Eds.; American Association of Cereal Chemists: St. Paul, MN, USA, 1988; p. 263. [Google Scholar]
  25. Eticha, F.; Belay, G.; Bekele, E. Species diversity in wheat landrace populations from two regions of Ethiopia. Genet. Resour. Crop Evol. 2006, 53, 387–393. [Google Scholar] [CrossRef]
  26. Bieńkowska, T.; Suchowilska, E.; Kandler, W.; Krska, R.; Wiwart, M. Triticum polonicum L. as potential source material for the biofortification of wheat with essential micronutrients. Plant Genet. Resour. C 2019, 17, 213–220. [Google Scholar] [CrossRef]
  27. Suchowilska, E.; Szafrańska, A.; Słowik, E.; Wiwart, M. Flour from Triticum polonicum L. as a potential ingredient in bread production. Cereal Chem. 2019, 96, 554–563. [Google Scholar] [CrossRef]
  28. Wiwart, M.; Suchowilska, E.; Kandler, W.; Sulyok, M.; Groenwald, P.; Krska, R. Can Polish wheat (Triticum polonicum L.) be an interesting gene source for breeding wheat cultivars with increased resistance to Fusarium head blight? Genet. Resour. Crop Evol. 2013, 60, 2359–2373. [Google Scholar] [CrossRef]
  29. Witzenberger, A.; Van den Hack, H.; Boom, T. Erläuterungen zum BBCH-Dezimalcode für die Entwicklungsstadien des Getreides—Mit Abbildungen. Gesunde Pflanz. 1989, 41, 384–388. [Google Scholar]
  30. Przybylska-Balcerek, A.; Frankowski, J.; Stuper-Szablewska, K. Bioactive compounds in sorghum. Eur. Food Res. Technol. 2019, 245, 1075–1080. [Google Scholar] [CrossRef]
  31. TIBCO Software Inc. Statistica (Data Analysis Software System), version 13. 2017. Available online: http://statistica.io (accessed on 27 September 2020).
  32. World-Grain.com. Available online: https://www.world-grain.com/articles/8777-global-durum-wheat-use-trending-upward (accessed on 27 September 2020).
  33. Statista.com. Available online: https://www.statista.com/statistics/267268/production-of-wheat-worldwide-since-1990/) (accessed on 27 September 2020).
  34. Bencze, S.; Makádi, M.; Aranyos, T.J.; Földi, M.; Hertelendy, P.; Mikó, P.; Bosi, S.; Negri, L.; Drexler, D. Re-Introduction of Ancient Wheat Cultivars into Organic Agriculture-Emmer and Einkorn Cultivation Experiences under Marginal Conditions. Sustainability 2020, 12, 1584. [Google Scholar] [CrossRef] [Green Version]
  35. Kwiatek, M.; Majka, M.; Majka, J.; Belter, J.; Suchowilska, E.; Wachowska, U.; Wiwart, M.; Wiśniewska, H. Intraspecific Polymorphisms of Cytogenetic Markers Mapped on Chromosomes of Triticum polonicum L. PLoS ONE 2016, 11, e0158883. [Google Scholar] [CrossRef] [Green Version]
  36. Bordoni, A.; Danesi, F.; Di Nunzio, M.; Taccari, A.; Valli, V. Ancient wheat and health: A legend or the reality? A review on KAMUT khorasan wheat. Int. J. Food Sci. Nutr. 2017, 68, 278–286. [Google Scholar] [CrossRef] [PubMed] [Green Version]
  37. Michalcová, V.; Dušinský, R.; Sabo, M.; Al Beyroutiová, M.; Hauptvogel, P.; Ivaničová, Z.; Švec, M. Taxonomical classification and origin of Kamut® wheat. Plant Syst. Evol. 2014, 300, 1749–1757. [Google Scholar] [CrossRef]
  38. Khlestkina, E.K.; Röder, M.S.; Grausgruber, H.; Börner, A. A DNA fingerprinting-based taxonomic allocation of Kamut wheat. Plant Genet. Resour. C 2006, 4, 172–180. [Google Scholar] [CrossRef]
  39. Ciudad-Mulero, M.; Barros, L.; Fernandes, Â.; Ferreira, I.C.F.R.; Callejo, M.; Matallana-González, M.C.; Fernández-Ruiz, V.; Morales, P.; Carrillo, J.M. Potential Health Claims of Durum and Bread Wheat Flours as Functional Ingredients. Nutrients 2020, 12, 504. [Google Scholar] [CrossRef] [Green Version]
  40. Lv, J.; Yu, L.; Lu, Y.; Niu, Y.; Liu, L.; Costa, J.; Yu, L. Phytochemical compositions, and antioxidant properties, and antiproliferative activities of wheat flour. Food Chem. 2012, 135, 325–331. [Google Scholar] [CrossRef]
  41. Hemery, Y.; Rouau, X.; Lullien-Pellerin, V.; Barron, C.; Abecassis, J. Dry processes to develop wheat fractions and products with enhanced nutritional quality. J. Cereal Sci. 2007, 46, 327–347. [Google Scholar] [CrossRef]
  42. Horvat, D.; Šimić, G.; Drezner, G.; Lalić, A.; Ledenčan, T.; Tucak, M.; Plavšić, H.; Andrić, L.; Zdunić, Z. Phenolic Acid Profiles and Antioxidant Activity of Major Cereal Crops. Antioxidants 2020, 9, 527. [Google Scholar] [CrossRef]
  43. Klepacka, J.; Fornal, Ł. Ferulic acid and its position among the phenolic compounds of wheat. Crit. Rev. Food Sci. Nutr. 2007, 46, 639–647. [Google Scholar] [CrossRef]
  44. Abdel-Aal, E.-S.M.; Rabalski, I. Bioactive Compounds and their Antioxidant Capacity in Selected Primitive and Modern Wheat Species. Open Agric. J. 2008, 2, 7–14. [Google Scholar] [CrossRef] [Green Version]
  45. Kamut.com. Available online: https://www.kamut.com/en/discover/the-story (accessed on 27 September 2020).
  46. Di Loreto, A.; Di Silvestro, R.; Dinelli, G.; Bregola, V.; Stenico, V.; Sferrazza, R.E.; Marotti, I.; Quinn, R.; Bosi, S. Nutritional and nutraceutical aspects of KAMUT® khorasan wheat grown during the last two decades. J. Agric. Sci. 2017, 155, 954–965. [Google Scholar] [CrossRef]
  47. Srinivasulu, C.; Ramgopal, M.; Ramanjaneyulu, G.; Anuradha, C.M.; Suresh, K.C. Syringic acid (SA)—A Review of Its Occurrence, Biosynthesis, Pharmacological and Industrial Importance. Biomed. Pharmacother. 2018, 108, 547–557. [Google Scholar] [CrossRef] [PubMed]
  48. Saini, P.; Kumar, N.; Kumar, S.; Mwaurah, P.W.; Panghal, A.; Attkan, A.K.; Singh, V.K.; Garg, M.K.; Singh, V. Bioactive compounds, nutritional benefits and food applications of colored wheat: A comprehensive review. Crit. Rev. Food Sci. Nutr. 2020. [Google Scholar] [CrossRef] [PubMed]
  49. Lachman, J.; Martinek, P.; Kotíkova, Z.; Orsak, M.; Sulc, M. Genetics and chemistry of pigments in wheat grain: A review. J. Cereal Sci. 2017, 74, 145–154. [Google Scholar] [CrossRef]
  50. Cicero, A.F.G.; Fogacci, F.; Veronesi, M.; Grandi, E.; Dinelli, G.; Hrelia, S.; Borghi, C. Short-Term Hemodynamic Effects of Modern Wheat Products Substitution in Diet with Ancient Wheat Products: A Cross-Over, Randomized Clinical Trial. Nutrients 2018, 10, 1666. [Google Scholar] [CrossRef] [Green Version]
Figure 1. The antioxidant activity of the grain, bran, and flour of the analyzed accessions and cultivars of four Triticum species. T.p.Triticum polonicum, T.a.T. aestivum, T.d.T. durum, T.tT. turanicum. a,b—mean values marked with the same letters do not differ significantly only for flour. A–C—the mean values for bran, grain, and flour marked with different letters differ significantly at p < 0.01.
Agriculture 10 00591 g001
Figure 2. The results of cluster analysis investigating the concentrations of three carotenoids in the grain of the analyzed T. polonicum lines versus four durum wheat cultivars (Floradur, Duroflavus, Malvadur, and Duromax), four bread wheat cultivars (Kontesa, Parabola, Torka, and Zebra) and Kamut® wheat. LUT—lutein, ZEA—zeaxanthin, β-C—β-carotene. 9, 12, 62—distinctive T. polonicum lines. I, II, III indicate the main clusters.
Agriculture 10 00591 g002
Figure 3. Biplots presenting the results of the principal component analysis for the concentrations of three carotenoids in the flour (A), bran (B), and grain of the analyzed wheat accessions and cultivars (C). LUT—lutein. ZEA—zeaxanthin, β-C—β-carotene.
Agriculture 10 00591 g003
Figure 4. The results of cluster analysis for the concentrations of 11 phenolic acids and vanillin in the grain of the analyzed T. polonicum accessions versus four durum wheat cultivars (Floradur, Duroflavus, Malvadur, and Duromax), four bread wheat cultivars (Kontesa, Parabola, Torka, and Zebra) and Kamut wheat. HBA—4-hydroxybenzoic acid, CA—caffeic acid, CGA—chlorogenic acid, FA—ferulic acid, GA—gallic acid, PCA—p-coumaric acid, PrCA—protocatechuic acid, SiA—sinapic acid, SyA—syringic acid, CiA—t-cinnamic acid, VA—vanillic acid; VN—vanillin. I…VI indicate the main clusters.
Agriculture 10 00591 g004
Figure 5. Biplots presenting the results of the principal component analysis for the concentrations of bound phenolic acids and vanillin in the flour (A), bran (B), and grain (C) of the analyzed wheat accessions and cultivars. HBA—4-hydroxybenzoic acid, CA—caffeic acid, CGA—chlorogenic acid, FA—ferulic acid, GA—gallic acid, PCA—p-coumaric acid, PrCA—protocatechuic acid, SiA—sinapic acid, SyA—syringic acid, CiA—t-cinnamic acid, VA—vanillic acid; VN—vanillin.
Agriculture 10 00591 g005
Figure 6. The results of the cluster analysis investigating the concentrations of eight flavonoids in the grain of the analyzed T. polonicum accessions versus four durum wheat cultivars (Floradur, Duroflavus, Malvadur, and Duromax), four bread wheat cultivars (Kontesa, Parabola, Torka, and Zebra), and Kamut® wheat. Ap—apigenin, Ka—catechin, Km—kaempferol, Lu—luteolin, Na—naringenin, Qu—quercetin, Ru—rutin, Vi—vitexin. I…IV indicate the main clusters.
Agriculture 10 00591 g006
Figure 7. Biplots presenting the results of the principal component analysis for flavonoid concentrations in the flour (A), bran (B), and grain of the analyzed wheat accessions and cultivars (C). Ap—apigenin, Ka—catechin, Km—kaempferol, Lu—luteolin, Na—naringenin, Qu—quercetin, Ru—rutin, Vi—vitexin.
Agriculture 10 00591 g007
Table 1. Lines and cultivars of Triticum spp. examined in the experiment.
LineNameAccessionSourceLineNameAccessionSource
Triticum polonicum40NK160TRI 4344IPK
1NK118Cltr 13919NPGS41NK161TRI 5358IPK
2NK119PI 29447NPGS42NK162TRI 6961IPK
3NK120PI 56261NPGS43NK163TRI 9650IPK
4NK121PI 56262NPGS44NK164TRI 28853IPK
5NK122PI 134945NPGS45NK167TRI 19192IPK
6NK123PI 185309NPGS46NK168TRI 19053IPK
7NK124PI 191620NPGS47POL-1PL21801NCPGR
8NK125PI 191837NPGS48POL-2PL 21802NCPGR
9NK126PI 192666NPGS49POL-3PL 22488NCPGR
10NK127PI 210845NPGS50POL-4PL 22479NCPGR
11NK128PI 245663NPGS51POL-5PL 23047NCPGR
12NK129PI 266846NPGS52POL-6PL 20770NCPGR
13NK131PI 272565NPGS53POL-7PL 22991NCPGR
14NK132PI 272566NPGS54POL-8PL 22746NCPGR
15NK133PI 278647NPGS55POL-9PL 22195NCPGR
16NK134PI 290512NPGS56POL-11PI 56262NPGS
17NK135PI 306548NPGS57POL12Cltr 13919NPGS
18NK136PI 306549NPGS58POL-12’Cltr 13919NPGS
19NK137PI 330554NPGS59POL-12”Cltr 13919NPGS
20NK138PI 349052NPGS60POL-14PI 167622NPGS
21NK139PI 352489NPGS61POL-14’PI 167622NPGS
22NK140PI 387457NPGS62POL-14”PI 167622NPGS
23NK141PI 566593NPGS63POL-16PI 191881NPGS
24NK142TRI 889IPK64POL-19PI 225335NPGS
25NK143TRI 891IPK65POL-22PI 272570NPGS
26NK144TRI 893IPK66POL-25PI 384265NPGS
27NK146TRI 1896IPKTriticum durum
28NK147TRI 1950IPK67DuroflavuscultivarSaatbau Linz, Austria
29NK148TRI 1951IPK68DuromaxcultivarSaatbau Linz, Austria
30NK150TRI 3248IPK69FloradurcultivarProbstdorfer Saatzucht, Austria
31NK151TRI 3311IPK70MalvadurcultivarProbstdorfer Saatzucht, Austria
32NK152TRI 3410IPKTriticum aestivum
33NK153TRI 3412IPK71TorkaElite (E) cultivarHodowla Roślin Strzelce, Poland
34NK154TRI 3440IPK72ParabolaQuality (A) cultivarMałopolska Hodowla Roślin, Poland
35NK155TRI 3442IPK73KontesaQuality (A) cultivarHodowla Roślin Strzelce, Poland
36NK156TRI 3478IPK74ZebraElite (E) cultivarDANKO, Hodowla Roślin, Poland
37NK157TRI 3550IPKTriticum turanicum
38NK158TRI 3597IPK75Kamut®cultivarSupermarket, Austria
39NK159TRI 4342IPK
IPK—Leibniz Institute of Plant Genetics and Crop Plant Research in Gatersleben, Germany, NPGS—the National Plant Germplasm System in the USA, NCPGR—National Center for Plant Genetic Resources, Poland.
Table 2. Flour extraction rates, bran yield, and carotenoid concentrations (mg kg−1) in the grain and both milling fractions of the analyzed Triticum species.
Extraction Rate (%)LUTZEAβ-CTotal Carotenoids (LUT + ZEA+ β-C)
FBGFBGFBGFBGFB
T. polonicum (n = 66)75.6 a,b19.3 a,b1.18 b1.60 b0.73 b0.630.630.221.36 b0.262.21 b3.17 b2.49 b3.16 b
T. durum (n = 4)76.7 a17.8 b1.92 a2.39 a0.78 a,b0.890.890.222.04 a0.283.30 a4.84 a3.56 a4.30 a
T. aestivum (n = 4)73.5 b21.7 a1.56 a,b1.77 a,b0.92 a0.790.790.211.59 a,b0.262.69 a,b3.94 a,b2.82 a,b3.82 a,b
T. turanicum (Kamut®)74.9 a,b20.4 a,b1.35 a,b1.68 a,b0.78 a,b0.810.810.191.45 a,b0.222.68 a,b3.61 a,b2.71 b3.65 a,b
Mean (weighted)75.519.41.24 A1.65 A0.74 B0.65 A0.65 A0.22 B1.41 B0.26 C2.30 A3.31 A2.57 B3.26 A
F—flour, G—grain, B—bran, LUT—lutein, ZEA—zeaxanthin, β-C—β-carotene. a,b—values for the species followed by the same letter within columns do not differ significantly at p < 0.01 in the Student-Newman-Keuls multiple range test. A–C—the overall means calculated for grain, flour, and bran followed by the same letter do not differ significantly in the Student-Newman-Keuls multiple range test.
Table 3. Concentrations of bound phenolic acids, free phenolic acids, and vanillin in the flour, bran, and grain of 66 T. polonicum lines versus four T. durum cultivars, four T. aestivum cultivars, and Kamut® wheat.
Phenolic Acids (mg kg−1)VN
HBACACGAFAGAPCAPrCASiASyACiAVA∑FAFPA
Flour
T. polonicum41.2 b61.7101.5 b463.8 b7.65.9 a26.939.925.9 a60.4 b12.30.3502560.32 b
T. durum64.5 b81.888.2 b466.3 b5.82.5 b28.643.616.8 a,b58.8 b14.6−1.1542330.88 a
T. aestivum31.8 b56.457.2 b353.8 b6.14.9 a,b19.743.57.3 b35.3 b13.4−6.6512210.87 a
T. turanicum (Kamut®)88.4 a16.6142.4 a728.0 a7.43.1 a,b19.036.010.3 a,b109.2 a13.18.1173120.78 a
Mean (weighted)42.6B61.9 B99.0 C461.6 C7.4 B5.6 B26.5 B40.2 B24.2 B59.6 B12.5 B 254 C0.40 B
Bran
T. polonicum159.4 b242.3 a,b400.7 a,b1800.7 b29.6 a,b23.4 a104.9155.2100.8 a236.8 b48.40.41832051.24 b
T. durum276.4 a,b352.6 a376.5 a,b1949.9 b25.3 a,b10.8 b121.1187.975.6 a,b246.0 b61.91.31426333.70 a
T. aestivum109.1 b190.2 a,b193.5 b1195.2 b20.5 b17.5 a,b66.2146.424.4 c116.9 b46.4−9.78525303.00 a
T. turanicum (Kamut®)413.777.6 b666.8 a3408.0 a34.8 a14.4 a,b89.0167.648.3 bc511.0 a61.26.31136253.70 a
Mean (weighted)166.3 A243.2 A391.9 A1797.8 A29.0 A22.3 A103.5 A156.6 A94.7 A234.6 A49.2A 3144 A1.50 A
Grain
T. polonicum65.2 b97.8 a,b161.2 b734.0 b12.0 a,b9.4 a42.763.241.0 a95.8 b19.50.3696310.51
T. durum104.2 a,b132.3 a142.4 b749.9 b9.5 b4.0 b46.170.527.4 a,b94.6 b23.6−0.7034671.41
T. aestivum49.1 b86.7 a,b88.0 b544.2 b9.3 b7.7 a,b30.366.911.1 b54.0 b20.8−7.3435611.35
T. turanicum (Kamut®)176.7 a33.1 b284.8 a1455.8 a14.9 a6.2 a,b38.071.620.6 b218.3 a26.17.8587261.57
Mean (weighted)67.9 B98.2 A,B157.9 B734.3 B11.8 B9.0 B42.2 B63.9 B38.4 B95.1 B19.9 B 619 B0.60 B
HBA—4–hydroxybenzoic acid, CA—caffeic acid, CGA—chlorogenic acid, FA—ferulic acid, GA—gallic acid, PCA—p-coumaric acid, PrCA—protocatechuic acid, SiA—sinapic acid, SyA—syringic acid, CiA—t-cinnamic acid, VA—vanillic acid, FPA—free phenolic acids, VN—vanillin; ∑FA—sum of standardized values for all bound phenolic acids; a,b,c—significant (p < 0.01) difference between wheat species in the Student-Newman-Keuls multiple range test, separately for flour, bran, and grain; A–C—the overall means calculated for grain, flour and bran followed by the same letter do not differ significantly in the Student-Newman-Keuls multiple range test.
Table 4. Concentrations of the analyzed flavonoids (mg kg−1) in the flour, bran, and grain of T. polonicum versus four T. durum cultivars, four T. aestivum cultivars, and Kamut® wheat.
ApKaKmLuNaQuRuViTotal FLVs
Flour
T. polonicum22.99.49.723.115.127.85.2 a,b10.0123.2
RSD%4473367482713842
T. durum24.411.16.425.323.435.48.9 a8.4143.3
RSD%4343293031844821
T. aestivum27.79.17.320.223.512.87.8 a,b5.8114.2
RSD%1051011031011091097878
T. turanicum (Kamut®)27.45.314.523.429.566.84.0 b16.9187.8
Bran
T. polonicum90.237.238.489.458.4109.220.4 b38.8 a,b482
RSD%4476377178723537
T. durum105.048.328.2110.8101.8146.638.3 a36.4 a,b615.4
RSD%4045393332804425
T. aestivum92.830.725.667.878.742.926.6 a,b19.4 b384.5
RSD%103981119710510677102
T. turanicum (Kamut®) 100.519.553.196.8108.2245.214.8 b62.3 a700.4
Grain
T. polonicum36.414.915.536.523.944.18.3 a,b15.8 a,b195.4
RSD%4474367381723740
T. durum39.517.910.441.137.956.914.5 a13.5 a,b231.7
RSD%4343303031844822
T. aestivum42.614.011.431.036.119.612.1 a,b8.9 b175.7
RSD%10510110510010810878105
T. turanicum (Kamut®)42.98.322.741.446.2104.86.3 b26.6 a299.2
Ap—apigenin, Ka—catechin, Km—kaempferol, Lu—luteolin, Na—naringenin, Qu—quercetin, Ru—rutin, Vi—vitexin; Total FLVs—total concentration of all analyzed flavonoids; a,b,c—significant (p < 0.01) difference between wheat species in the Student-Newman-Keuls multiple range test, separately for flour, bran, and grain.
Publisher’s Note: MDPI stays neutral with regard to jurisdictional claims in published maps and institutional affiliations.

