Temporal–Spatial Distribution of Risky Sites for Feeding Cattle in China Based on Temperature/Humidity Index

1
Jilin Provincial Laboratory of Grassland Farming, Northeast Institute of Geography and Agroecology, Chinese Academy of Sciences, Changchun 130102, China
2
University of Chinese Academy of Sciences, Beijing 100049, China
*
Author to whom correspondence should be addressed.
Agriculture 2020, 10(11), 571; https://doi.org/10.3390/agriculture10110571
Submission received: 28 September 2020
/
Revised: 10 November 2020
/
Accepted: 16 November 2020
/
Published: 22 November 2020
(This article belongs to the Section Farm Animal Production)
Abstract
:This study identifies risk areas for cattle husbandry based on temperature and a relative humidity index (THI) derived from climate data (1987 to 2016) at 839 meteorological stations in China using geostatistics (ordinary and indicator kriging) in the geographical information system (GIS). In general, monthly mean THI values were the highest in July and the lowest in January for all regions. The correlation analysis showed that there were negative relationships between THI values and latitude or elevation for the whole year (p < 0.01). The THI values were higher at low latitudes in coastal areas and at high latitudes in arid areas in summer. The healthy risk for cattle production varied depending on the time of the year and region. The study shows that cattle production is suitable throughout the whole year in the Qinghai-Tibet Plateau; from October to April for most areas, except the southern coastal areas; in May and September in Northeast China, North China, and parts of Northwest China; in June in Heilongjiang and Inner Mongolia. The information obtained in this study can provide a regional distribution of risk for the cattle industry in China.
1. Introduction
China is a largely agricultural country, where the livestock industry plays an important role in the national economy. From 2000 to 2018, the production of beef increased by 25.5 percent and the production of milk nearly doubled in China [1]. The cattle industry plays an important role in the agricultural economy; there are 53 kinds of cattle breeds in China [2,3]. Moreover, in order to promote the development of animal husbandry and increase farmers’ income, the Chinese government has issued a series of policies and subsidies, such as replacing grain crops with feed crops. For the sustainable development of the cattle industry, reasonable planning is necessary, including the location of new livestock farms, risk assessments of existing livestock farms, and mitigation measures.
Climate is one of the most important factors in cattle production. The most suitable environment temperature range for cattle production is 5–25 °C. When the temperature exceeds 25 °C, the body temperature of cattle will rise and their forage intake will decrease [4]. In recent decades, warming temperatures have been one of the main challenges facing the world [5]. High temperatures will have adverse effects, such as heat stress on cattle. Heat stress is the sum of the nonspecific physiological responses of animals [6,7]. Heat stress occurs when a combination of high temperature and high relative humidity exceeds the animals’ heat regulation ability. At the same time, it is also affected by wind speed, solar radiation, and precipitation [8]. Heat stress invokes a series of physiological responses (increases in respiration rate, body temperature, panting and sweating, and decreases in milk yield and reproductive and immune function) and behavioral responses (increases in drinking, standing time, and number of steps, and decreases in feed intake and total daily lying time) in cattle [9,10,11,12,13,14,15]. For example, annual economic losses of livestock industries due to heat stress range from USD1.69 to 2.36 billion in the United States, with losses of USD897–1500 million in the dairy industry and USD370 million in the beef industry [16].
The temperature–humidity index (THI) is the most commonly used index in many countries [17,18]. The THI is calculated according to the following expression: THI = 0.8 × T + RH × (T − 14.4) + 46.4 [19]. The Livestock Weather Safety Index, based on THI values, was first used by the US National Weather Service, with 4 levels, namely, normal (THI ≤ 74), alert (THI = 75 to 78), danger (THI = 79 to 83), and emergency status, for animals (THI ≥ 84) [20]. In an early study, Johnson [21] reported that milk production began to decline at a THI value of 72. In more recent studies, Bouraoui et al. [9] found that milk yield decreased by 0.41 kg/day/cow when THI exceeded 69, whereas West et al. [22] reported that feed intake and milk production declined at a THI of 72. Furthermore, Vitali et al. [23] found that when THI maximum values exceeded 80, cow mortality increased. At the lower range, Gernand et al. [24] indicated that the heat stress threshold for protein yield was THI 68. When THI exceeds 72, Akyuz et al. [25] suggest that measures should be taken to reduce the decline in milk production as the main physiological changes in dairy cattle occur at THI of 74 [26]. Research based on the THI index can not only determine the thresholds of animals with different degrees of heat stress but also analyze the animal response under different temperature–humidity indexes. The abovementioned research helps decision-makers or livestock farmers to formulate mitigation measures under different heat stress levels.
Many studies have been carried out to research the serious losses caused by heat stress to cattle, and they have focused only on the relationship between the temperature–humidity index and cattle production; few studies have been done to determine the spatial distribution of dangerous locations for cattle production. Moreover, the available spatial distribution of heat stress in cattle, based on the temperature–humidity index in China, is insufficient. The geographic information system (GIS) is a powerful tool for the input, storage, analysis, and display of geographic data [27]. With ever-improving computer technology, GIS has been widely used in many disciplinary areas, including the evaluation of forests [28,29], wetlands [30,31], groundwater [32], climate [33,34], plants [35], soil [36,37], and agricultural production [15]. However, there are very limited reports of cattle production using GIS, apart from the work by Güler [38], who reported that the cattle suffered from severe heat stress from June to September in some parts of Turkey based on THI using the geographic information system.
The aim of this study is to conduct a risk assessment for cattle production across five geological regions in China using THI values and GIS spatial analysis technology. The work of this paper mainly includes the following points: (1) based on the data of 839 stations across the country, the monthly mean THI values in five climatic zones were statistically analyzed; (2) according to the Livestock Weather Safety Index, the temperature–humidity index was divided into 4 heat stress levels, and the range of different heat stress levels was spatialized; (3) the probability distribution of severe heat stress degrees (that is, the temperature–humidity index exceeded 79) was spatially distributed. The identification of dangerous locations for raising cattle will promote the development of livestock productivity and is helpful for decision-makers and relevant stakeholders to formulate strategies to promote the sustainable development of cattle production.
2. Materials and Methods
2.1. Study Area
This study was conducted in mainland China. The research area contained 23 provinces, 5 autonomous regions, and 4 municipalities, directly under the central government. The terrain of China is complex and varied, being high in the west and low in the east. Mountains, plateaus, and hills account for approximately two-thirds of the land area, whereas basins and plains account for the remaining third.
2.2. Research Data
Daily maximum temperature and relative humidity datasets of 839 meteorological stations from 1987 to 2016 were collected from the National Meteorological Information Center. We divided China into 5 climate regions—tropical, arid, temperate, cold, and polar—as per the Koppen climate classification [39]. The spatial distribution of the weather stations is shown in Figure 1.
2.3. THI Calculation
Daily maximum temperature and daily relative humidity data were used to calculate the daily THI for each meteorological station using the following equation (adapted from Thom) [19]:
where T is air temperature (°C), and RH is relative humidity (%).
THI = 0.8 × T + RH × (T − 14.4) + 46.4
Then, the THI value is classified into 4 stress levels: normal (THI ≤ 74), alert (THI = 75 to 78), danger (THI = 79 to 83), and emergency (THI ≥ 84) [20].
2.4. Data Processing
First, the monthly mean THI value of 12 months in the 5 climate regions, based on the THI values of each site, was calculated. Then, the correlation coefficient between the THI value and various indexes (longitude, latitude, and elevation) was calculated. In order to obtain the spatial variation of THI values, the ordinary kriging and the indicator kriging were used in ArcGIS software to visualize the spatial distribution of THI values and map the probabilities of exceeding (or not exceeding) a THI threshold value, defined as 79. Stations were interpolated to raster maps with 0.1° × 0.1° cells, according to the latitude and longitude of each site.
3. Results
The lowest monthly mean THI in 5 climate regions occurred in January, whereas the corresponding highest values were in July, except for the tropical region (highest values in June and July), according to the analysis of consecutive 30-year data (Table 1). THI values exceeding the emergency threshold of 84 were mainly in the tropical region from April to September and in the temperate region in July and August. THI values were between 79 and 83 in the tropical region in March and October and in the temperate region in June and September. THI values between 75 and 78 were present in the tropical region in February and November, in the arid region in July and August, in the temperate region in May, and in the cold region in July and August. THI values were below the normal threshold of 74 in the tropical region in January and December, in the arid region from September to the next June, in the temperate region from October to the next April, in the cold region from September to the next June, and in the polar region all year round. The highest annual THI value was in the tropical region; the lowest was in the polar region.
The THI values were negatively correlated with elevation from May to September (−0.71, −0.83, −0.89, −0.87, and −0.74; p < 0.01; Table 2) and also negatively correlated with latitude from October to next April (−0.77, −0.92, −0.95, −0.94, −0.91, −0.85, and −0.72; p < 0.01; Table 2). The correlation between daily THI values and longitude was highly positive from May to October (p < 0.01) but negative for January and February (p < 0.05).
Based on monthly spatial THI analysis (Figure 2), THI values above the emergency threshold of 84 were mainly located on the southeast coast from June to September; THI values between 79 and 83 were distributed in South China, Central China, East China, North China, Northeast China, and Northwest China from June to September; THI values between 75 and 78 were present in some areas except for Qinghai-Tibet Plateau from January to December; THI values below the normal threshold of 74 were widely distributed in the study area, and the THI value for Qinghai-Tibet Plateau was below 74 throughout the year.
The monthly maximum THI values from January to December during the 1987–2016 period are showed in Figure 3. The highest values of monthly maximum THI (≥84) were distributed in the eastern and northwestern parts of the study area from April to October; THI values between 79 and 83 were distributed in the north of the study area, especially in May, June, August, and September, including Heilongjiang, Jilin, Inner Mongolia, and Xinjiang; THI values between 75 and 78 were present in Northwest China, North China, and Northeast China, especially in April, May, and September; the lowest monthly maximum THI values (≤74) were located in Qinghai-Tibet Plateau and during the warmest months from May to September.
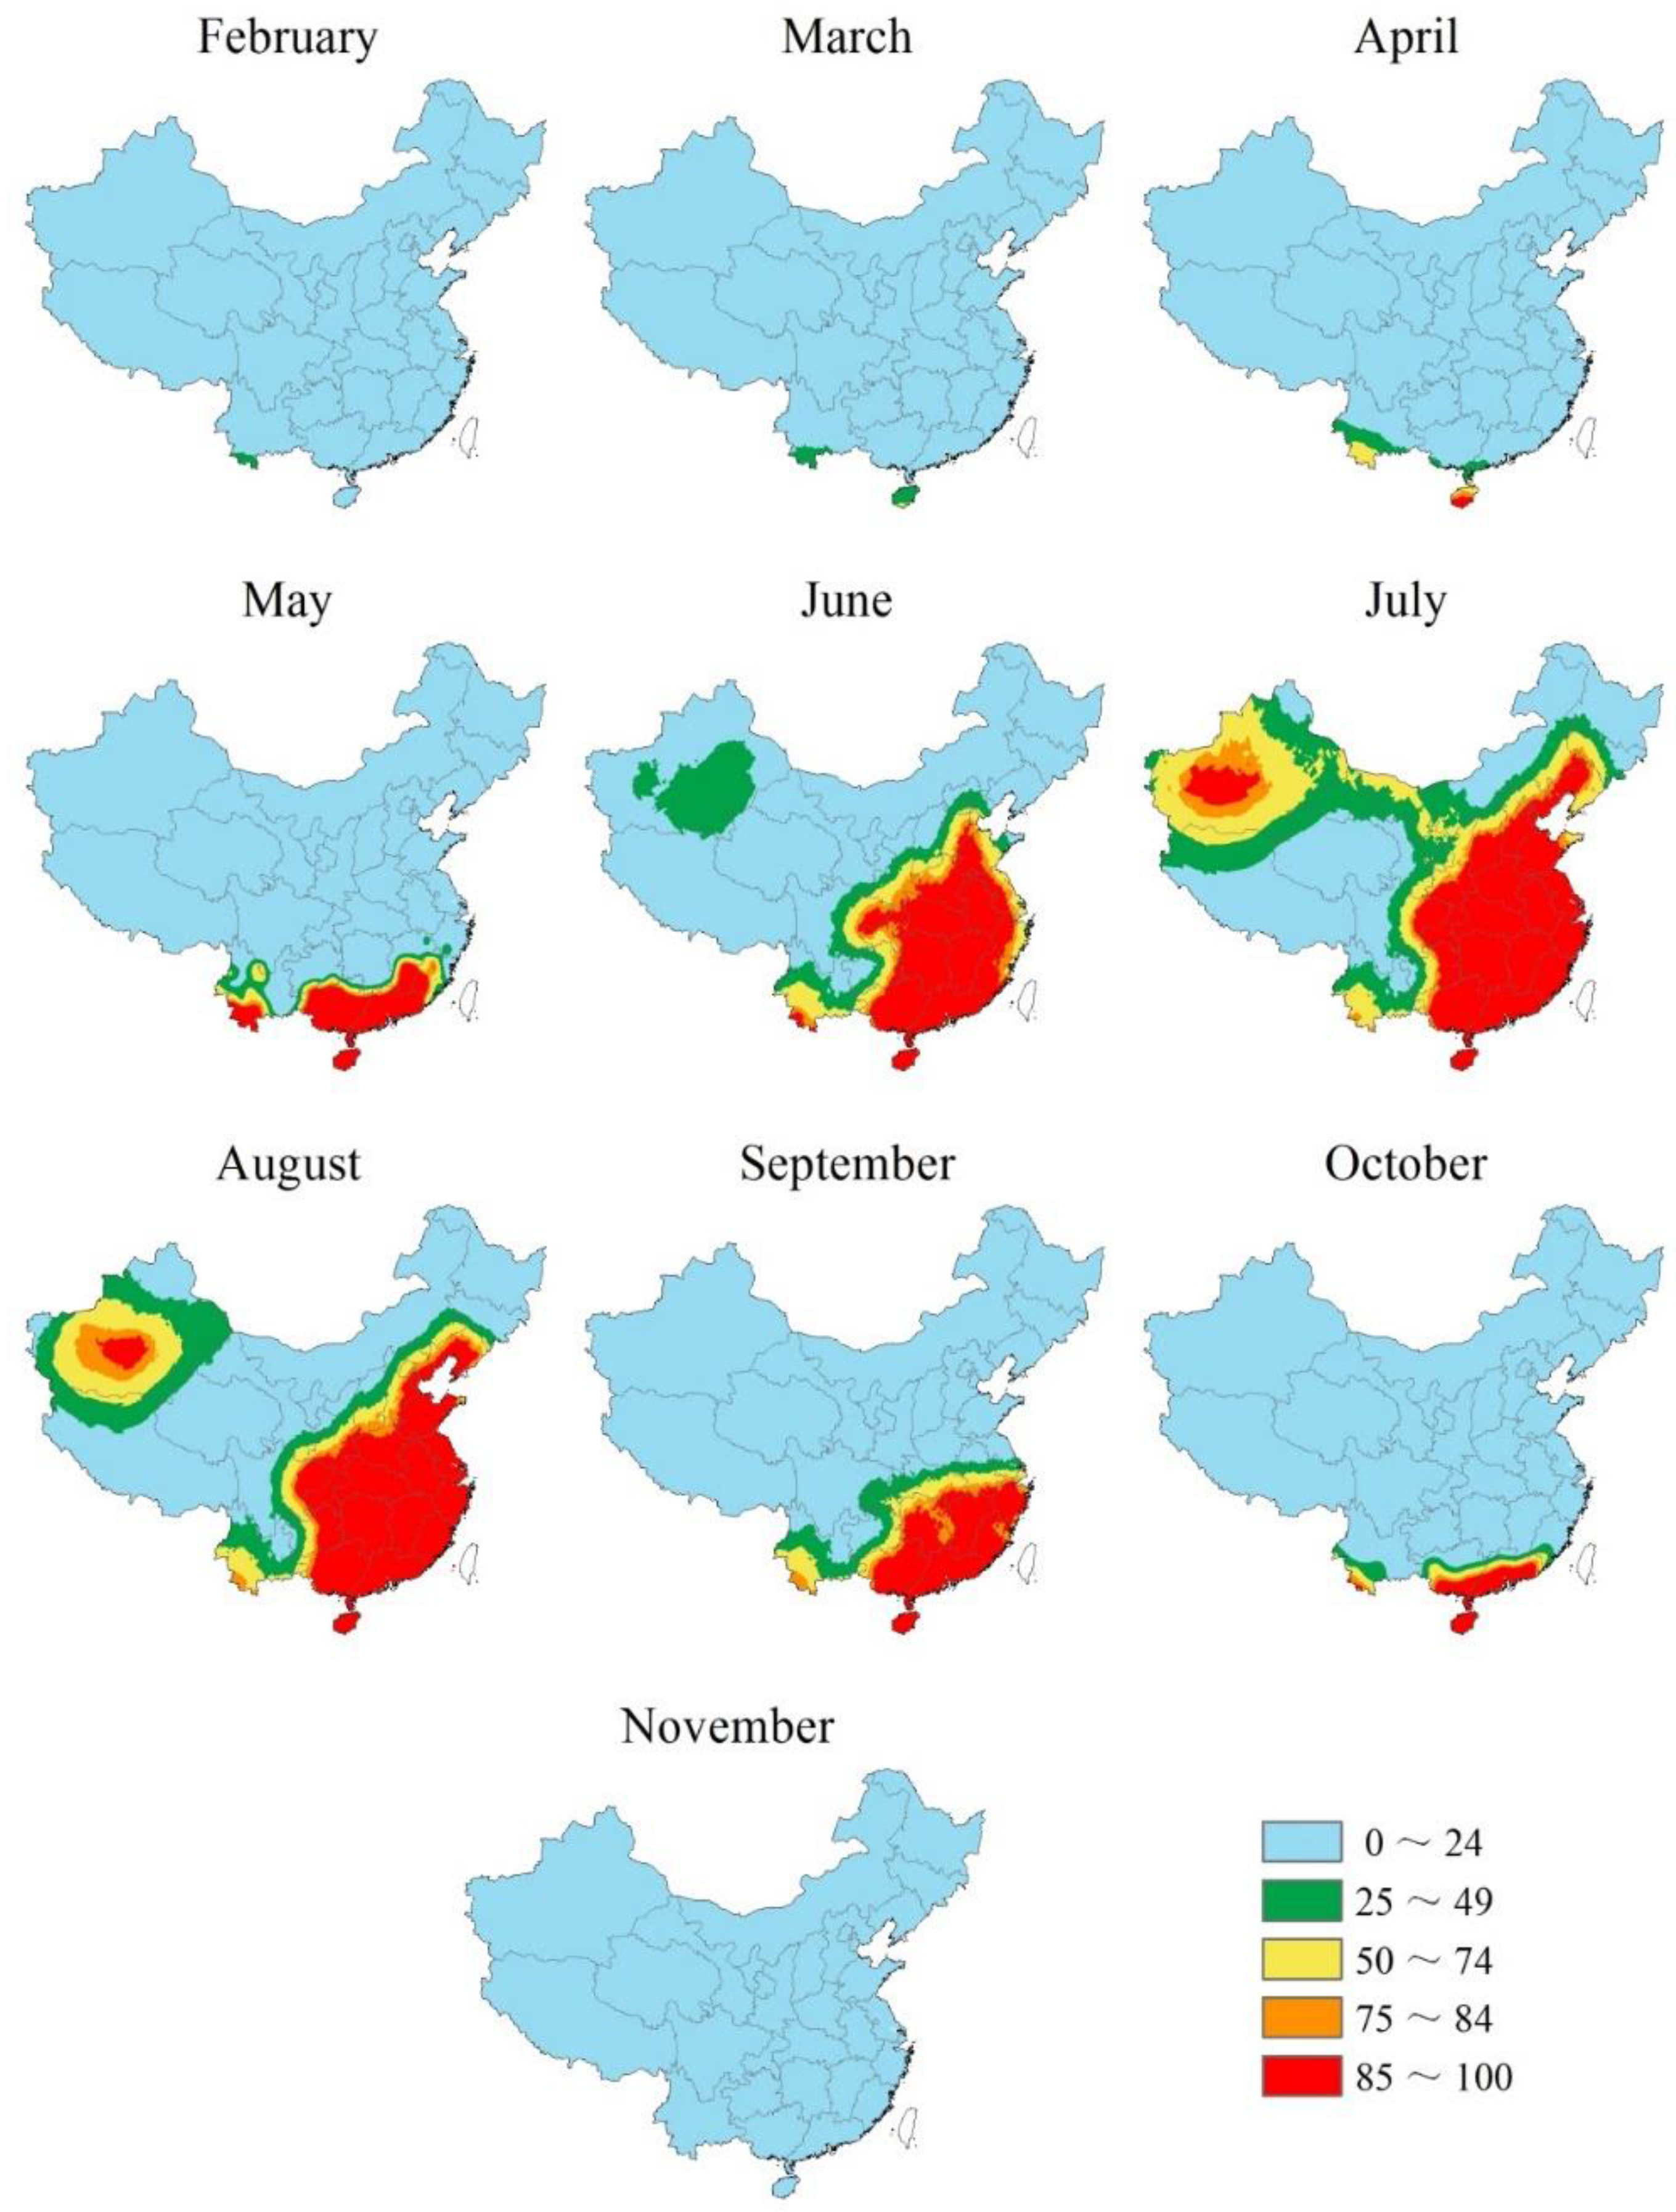
Monthly probability values of areas exceeding the THI danger threshold of 79 are listed in Table 3, and spatial maps of the probability of monthly THI values exceeding 79 from February to November are shown in Figure 4. In July, the proportion of THI values greater than the threshold value (79), with a probability of more than 25%, was the largest. Areas in which the probability of exceeding a THI value of 79 ranged from 0% to 24% accounted for 33.4% of the study area; from 25% to 49% accounted for 19.4%; from 50% to 74% accounted for 17.0%; from 75% to 84% accounted for 5.5%; exceeded 85% accounted for 24.6% of the area. In a probability map calculated from July data, South China, East China, Central China, and parts of North China, Southwest China, and Tarim Basin had the highest risk of heat stress.
4. Discussion
Weather and climate affect the growth of plants and animals, human life, and many more aspects [40,41]. With the warming of climate, the heat stress of cattle is getting more and more serious [42]. The current study reveals the characteristics of the spatiotemporal distribution of heat stress for cattle production in China based on THI and GIS analysis. A number of strategies are taken to mitigate heat stress, depending on climate regions.
In the polar region, the monthly mean THI values and the monthly maximum THI values were lower than the threshold of 74, indicating that there was no heat stress in this region all year round; yaks with cold tolerance are mainly distributed here [43]. Therefore, no action is needed to alleviate heat stress in this region.
In the tropical and temperate regions, the monthly mean THI values exceed the danger threshold of 79 in most areas from June to September, and in July and August, the THI values in some areas exceed the emergency threshold of 84. Occasionally, THI values in some areas in those two regions are greater than 79 from April to October and greater than 84 from May to September. Thus, those regions are identified as the most severely affected, with the longest duration of heat stress, in China. The surface temperatures of different body regions continue to rise with the increase of THI; the surface temperature of the head region can be above 40 °C, the surface temperatures of the neck, chest, and abdomen region close to 39 °C, and the surface temperatures of forelegs and rear legs can reach 37 °C [26]. The respiration rate of dairy cows increases significantly when the THI value exceeds 80 [44]. Heat-resistant breeds, such as buffalo breeds and Dehong humped cattle, are mainly distributed in the southwest [45,46]. Hence, a number of measures are suggested to alleviate heat stress in advance, including (1) breeding new heat-resistant varieties to improve the heat-resistant performance of cattle, with a great example in the crossbreed of Yunling cattle, which is a crossbreed of a foreign heat-resistant variety with local cattle, with great resistance to heat stress [47,48,49]; (2) reducing the risk of heat stress through nutrition control, such as adding a certain amount of starch, fat, minerals, antioxidants, vitamins, folic acid, methionine, prebiotics, and probiotics to the feed using GABA sedatives and traditional Chinese medicine prescriptions [50,51,52,53,54,55,56]; (3) providing physical barriers or facilities to reduce the risk of heat stress, such as setting up sheds and planting trees in the cowshed and rest areas, spraying the cattle with cold water frequently when the temperature is too high, and providing electric fan and spray systems for dairy cows in yards or under the sheds, feeding cattle at night, and raising buffalo in the south [11,57,58,59,60].
In the arid region, the monthly mean THI values for most areas exceed 79 from June to August, and the monthly maximum THI values exceed 79 from May to September, occasionally exceeding 84 from June to August. When the THI value exceeds 79, cows’ lying time was negatively correlated with THI [61]. In this paper, heat stress in the Xinjiang reach dangerous levels in July, and the milk production loss in this area was up to 140 kg/cow/month in 2016 [62]. One of the effective strategies is to improve the immune function and metabolic activity of cattle. Skibiel et al. [63] found that adding OmniGen-AF to cow diets, with the physical cool-down of cows during late pregnancy, can increase the weight of postpartum calves. Batistel et al. [64] suggested that ethyl-cellulose rumen-protected methionine can increase cattle dry matter intake and increase live weight gain. Furthermore, Sheikh et al. [65] reported that inorganic zinc can reduce the concentration of heat shock protein and interleukin 6 (IL-6) in heat-stressed cows, thereby enhancing the body’s immunity and alleviating heat stress. Recently, Sun et al. [66] found that the addition of zymosan in diet can effectively increase dry matter intake, reduce respiratory rate, and thereby increase milk yield.
In the cold region, the monthly mean THI values exceed 79 in July and August, and the monthly maximum THI values exceed 79 from June to September, occasionally exceeding 84 in July and August. In this area, the risk of heat stress is mainly in summer. When the THI value exceeds 79, milk yield and fat and protein contents decrease with the increase of THI [67,68]. Heat stress in northern China, such as in Hebei, Shandong, and Henan, reach emergency levels in July, and the loss of milk production has been calculated as 90–120 kg/cow/month [62]. The main breeds are Mongolian cattle, Chinese Holstein cattle, Inner-Mongolia Sanhe cattle, and Yanbian cattle, which have the characteristics of cold tolerance in this region [69,70,71,72]. The strategies recommended in the tropical region are applicable to alleviate heat stress during the summer, such as building sunshades, installing electric fans, reducing the number of heads in the mob, increasing the feeding times at night, adding more green materials in the diet, and increasing minerals and microelements to ensure the healthy growth of cattle [11,60,73,74,75,76].
5. Conclusions
The risk of heat stress varies with geographical location and topography. THI values are negatively correlated with latitude and altitude. Cattle in tropical and temperate regions experience severe heat stress in July and August, whereas cattle in arid and cold regions suffer from moderate heat stress from June to August and July and August, respectively. There is no heat stress throughout the year in the polar region. The risk of heat stress can be alleviated with animal breeding, changes in diet, and providing sheds or facilities to lower the temperature physically.
Above all, different measures should be taken to alleviate the heat stress of cattle in different climate regions to promote cattle production. The results of this study are very helpful for policymakers to formulate cattle production policies, such as new site selection, evaluation of existing sites, and adoption of relative measures in risky locations.
Author Contributions
Conceptualization, D.Z.; methodology, T.W.; software, T.W.; writing—original draft preparation, T.W.; writing—review and editing, R.Z. and D.Z.; supervision, D.Z. All authors have read and agreed to the published version of the manuscript.
Funding
This research was funded by the National Key Research and Development Program of China, grant number 2016YFC0500606.
Acknowledgments
The authors thank Guangdi Li at Wagga Wagga Agricultural Institute for his work on improving the data analysis and discussion of this manuscript.
Conflicts of Interest
The authors declare no conflict of interest.
References
- National Bureau of Statistics. China Statistical Yearbook 2017; China Statistics Press: Beijing, China, 2019.
- Qiu, H.; Ju, Z.; Chang, Z. A survey of cattle production in China. World Anim. Rev. 1993, 3, 75. [Google Scholar]
- China National Commission of Animal Genetics Resources. Animal Genetic Resources in China-Bovine; China Agriculture Press: Beijing, China, 2011. [Google Scholar]
- McDowell, R.E. Improvement of Livestock Production in Warm Climates; W.H. Freeman and Co.: San Francisco, CA, USA, 1972. [Google Scholar]
- IPCC (Intergovernmental Panel on Climate Change). Climate Change 2014; Cambridge University Press: Cambridge, UK, 2014. [Google Scholar]
- Herbut, P.; Angrecka, S.; Walczak, J. Environmental parameters to assessing of heat stress in dairy cattle-a review. Int. J. Biometeorol. 2018, 62, 2089–2097. [Google Scholar] [CrossRef] [PubMed] [Green Version]
- Wang, X.; Bjerg, B.S.; Choi, C.Y.; Zong, C.; Zhang, G. A review and quantitative assessment of cattle-related thermal indices. J. Therm. Biol. 2018, 77, 24–37. [Google Scholar] [CrossRef] [PubMed]
- Mader, T.L.; Davis, M.S.; Brown-Brandl, T. Environmental factors influencing heat stress in feedlot cattle. J. Anim. Sci. 2006, 84, 712–719. [Google Scholar] [CrossRef] [PubMed] [Green Version]
- Bouraoui, R.; Lahmar, M.; Majdoub, A.; Djemali, M.N.; Belyea, R. The relationship of temperature-humidity index with milk production of dairy cows in a Mediterranean climate. Anim. Res. 2002, 51, 479–491. [Google Scholar] [CrossRef] [Green Version]
- West, J.W. Effects of Heat-Stress on Production in Dairy Cattle. J. Dairy Sci. 2003, 86, 2131–2144. [Google Scholar] [CrossRef]
- Calamari, L.; Petrera, F.; Stefanini, L.; Abeni, F. Effects of different feeding time and frequency on metabolic conditions and milk production in heat-stressed dairy cows. Int. J. Biometeorol. 2013, 57, 785–796. [Google Scholar] [CrossRef]
- Polsky, L.; Von Keyserlingk, M.A.G. Invited review: Effects of heat stress on dairy cattle welfare. J. Dairy Sci. 2017, 100, 8645–8657. [Google Scholar] [CrossRef] [Green Version]
- Heinicke, J.; Hoffmann, G.; Ammon, C.; Amon, B.; Amon, T. Effects of the daily heat load duration exceeding determined heat load thresholds on activity traits of lactating dairy cows. J. Therm. Biol. 2018, 77, 67–74. [Google Scholar] [CrossRef]
- Herbut, P.; Angrecka, S. Relationship between THI level and dairy cows’ behaviour during summer period. Ital. J. Anim. Sci. 2018, 17, 226–233. [Google Scholar] [CrossRef] [Green Version]
- Liu, J.; Li, L.; Chen, X.; Lu, Y.; Wang, D. Effects of heat stress on body temperature, milk production, and reproduction in dairy cows: A novel idea for monitoring and evaluation of heat stress—A review. Asian-Australas. J. Anim. Sci. 2019, 32, 1332–1339. [Google Scholar] [CrossRef] [PubMed]
- St-Pierre, N.R.; Cobanov, B.; Schnitkey, G. Economic Losses from Heat Stress by US Livestock Industries. J. Dairy Sci. 2003, 86, E52–E77. [Google Scholar] [CrossRef] [Green Version]
- Bohmanova, J.; Misztal, I.; Cole, J.B. Temperature-humidity indices as indicators of milk production losses due to heat stress. J. Dairy Sci. 2007, 90, 1947–1956. [Google Scholar] [CrossRef]
- Kim, W.S.; Lee, J.-S.; Jeon, S.W.; Peng, D.Q.; Kim, Y.S.; Bae, M.H.; Jo, Y.H.; Lee, H.G. Correlation between blood, physiological and behavioral parameters in beef calves under heat stress. Asian-Australas. J. Anim. Sci. 2018, 31, 919–925. [Google Scholar] [CrossRef]
- Thom, E.C. Cooling degrees: Day air-conditioning, heating and ventilating. Trans. Am. Soc. Heat. 1958, 55, 65–69. [Google Scholar]
- LCI. Patterns of Transit Losses; Livestock Conservation: Omaha, NE, USA, 1970. [Google Scholar]
- Johnson, H.D. Environmental management of cattle to minimize the stress of climatic changes. Int. J. Biometeorol. 1980, 24, 65–78. [Google Scholar]
- West, J.W.; Mullinix, B.G.; Bernard, J.K. Effects of Hot, Humid Weather on Milk Temperature, Dry Matter Intake, and Milk Yield of Lactating Dairy Cows. J. Dairy Sci. 2003, 86, 232–242. [Google Scholar] [CrossRef] [Green Version]
- Vitali, A.; Segnalini, M.; Bertocchi, L.; Bernabucci, U.; Nardone, A.; Lacetera, N. Seasonal pattern of mortality and relationships between mortality and temperature-humidity index in dairy cows. J. Dairy Sci. 2009, 92, 3781–3790. [Google Scholar] [CrossRef] [Green Version]
- Gernand, E.; Konig, S.; Kipp, C. Influence of on-farm measurements for heat stress indicators on dairy cow productivity, female fertility, and health. J. Dairy Sci. 2019, 102, 6660–6671. [Google Scholar] [CrossRef]
- Akyuz, A.; Boyaci, S.; Cayli, A. Determination of Critical Period for Dairy Cows Using Temperature Humidity Index. J. Anim. Vet. Adv. 2010, 9, 1824–1827. [Google Scholar] [CrossRef]
- Jeelani, R.; Konwar, D.; Khan, A.; Kumar, D.; Chakraborty, D.; Brahma, B. Reassessment of temperature-humidity index for measuring heat stress in crossbred dairy cattle of a sub-tropical region. J. Therm. Biol. 2019, 82, 99–106. [Google Scholar] [CrossRef] [PubMed]
- Zhang, C.; McGrath, D. Geostatistical and GIS analyses on soil organic carbon concentrations in grassland of southeastern Ireland from two different periods. Geoderma 2004, 119, 261–275. [Google Scholar] [CrossRef]
- Sivrikaya, F.; Baskent, E.Z.; Sevik, U.; Akgul, C.; Kadiogullari, A.İ.; Degermenci, A.S. A GIS-based decision support system for forest management plans in Turkey. Environ. Eng. Manag. J. 2010, 9, 929–937. [Google Scholar] [CrossRef]
- Golbon, R.; Cotter, M.; Mahbod, M.; Sauerborn, J. Global Assessment of Climate-Driven Susceptibility to South American Leaf Blight of Rubber Using Emerging Hot Spot Analysis and Gridded Historical Daily Data. Forests 2019, 10, 203. [Google Scholar] [CrossRef] [Green Version]
- Mondal, B.; Dolui, G.; Pramanik, M.; Maity, S.; Biswas, S.S.; Pal, R. Urban expansion and wetland shrinkage estimation using a GIS-based model in the East Kolkata Wetland, India. Ecol. Indic. 2017, 83, 62–73. [Google Scholar] [CrossRef]
- Siles, G.; Charland, A.; Voirin, Y.; Bénié, G.B. Integration of landscape and structure indicators into a web-based geoinformation system for assessing wetlands status. Ecol. Indic. 2019, 52, 166–176. [Google Scholar] [CrossRef]
- Avila-Sandoval, C.; Júnez-Ferreira, H.; González-Trinidad, J.; Bautista-Capetillo, C.; Pacheco-Guerrero, A.; Olmos-Trujillo, E. Spatio-Temporal Analysis of Natural and Anthropogenic Arsenic Sources in Groundwater Flow Systems. Int. J. Environ. Res. Public Health 2018, 15, 2374. [Google Scholar] [CrossRef] [Green Version]
- Suryabhagavan, K.V. GIS-based climate variability and drought characterization in Ethiopia over three decades. Weather Clim. Extrem. 2017, 15, 11–23. [Google Scholar] [CrossRef]
- Praene, J.P.; Malet-Damour, B.; Radanielina, M.H.; Fontaine, L.; Rivière, G. GIS-based approach to identify climatic zoning: A hierarchical clustering on principal component analysis. Build. Environ. 2019, 164, 106330. [Google Scholar] [CrossRef] [Green Version]
- Zhang, Y.; Woodward, N.T.; Unger, D.; Hung, I.K.; Oswald, B.P.; Farrish, K.W. A GIS tool for plant spatial pattern analysis. Environ. Modell. Softw. 2011, 26, 1251–1254. [Google Scholar] [CrossRef] [Green Version]
- Ganasri, B.P.; Ramesh, H. Assessment of soil erosion by RUSLE model using remote sensing and GIS—A case study of Nethravathi Basin. Geosci. Front. 2016, 7, 953–961. [Google Scholar] [CrossRef] [Green Version]
- Akumu, C.E.; Baldwin, K.; Dennis, S. GIS-based modeling of forest soil moisture regime classes: Using Rinker Lake in northwestern Ontario, Canada as a case study. Geoderma 2019, 351, 25–35. [Google Scholar] [CrossRef]
- Güler, M. An evaluation of risky sites for cattle production in northern Turkey based on temperature/humidity index calculated using GIS and indicator kriging. Meteorol. Appl. 2015, 22, 360–367. [Google Scholar] [CrossRef]
- Peel, M.C.; Finlayson, B.L.; McMahon, T.A. Updated world map of the Koppen-Geiger climate classification. Hydrol. Earth Syst. Sci. 2007, 11, 1633–1644. [Google Scholar] [CrossRef] [Green Version]
- Lara, L.J.; Rostagno, M.H. Impact of Heat Stress on Poultry Production. Animals 2013, 3, 356–369. [Google Scholar] [CrossRef]
- Leinonen, I.; Williams, A.G.; Kyriazakis, I. The effects of welfare-enhancing system changes on the environmental impacts of broiler and egg production. Poult. Sci. 2014, 93, 256–266. [Google Scholar] [CrossRef]
- Robinson, P.J. On the definition of a heat wave. J. Appl. Meteorol. 2001, 40, 762–775. [Google Scholar] [CrossRef]
- Wu, J. The distributions of Chinese yak breeds in response to climate change over the past 50 years. Anim. Sci. J. 2016, 87, 947–958. [Google Scholar] [CrossRef]
- Pinto, S.; Hoffmann, G.; Ammon, C.; Amon, B.; Heuwieser, W.; Halachmi, I.; Banhazi, T.; Amon, T. Influence of Barn Climate, Body Postures and Milk Yield on the Respiration Rate of Dairy Cows. Ann. Anim. Sci. 2019, 19, 469–481. [Google Scholar] [CrossRef] [Green Version]
- Li, R.; Li, C.; Chen, H.; Li, R.; Chong, Q.; Xiao, H.; Chen, S. Genome-wide scan of selection signatures in Dehong humped cattle for heat tolerance and disease resistance. Anim. Genet. 2019, 51, 292–299. [Google Scholar] [CrossRef]
- Wang, J.; He, Y.; Pang, K.; Zeng, Q.; Zhang, X.; Ren, F.; Guo, H. Changes in milk yield and composition of colostrum and regular milk from four buffalo breeds in China during lactation. J. Sci. Food Agric. 2019, 99, 5799–5807. [Google Scholar] [CrossRef] [PubMed]
- Scharf, B.; Carroll, J.A.; Riley, D.G.; Chase, C.C., Jr.; Coleman, S.W.; Keisler, D.H.; Weaber, R.L.; Spiers, D.E. Evaluation of physiological and blood serum differences in heat-tolerant (Romosinuano) and heat-susceptible (Angus) Bos taurus cattle during controlled heat challenge. J. Anim. Sci. 2010, 88, 2321–2336. [Google Scholar] [CrossRef] [PubMed] [Green Version]
- McManus, C.; Castanheira, M.; Paiva, S.R.; Louvandini, H.; Fioravanti, M.C.; Paludo, G.R.; Bianchini, E.; Correa, P.S. Use of multivariate analyses for determining heat tolerance in Brazilian cattle. Trop. Anim. Health Prod. 2011, 43, 623–630. [Google Scholar] [CrossRef] [PubMed] [Green Version]
- Xia, X.; Qu, K.; Li, F.; Jia, P.; Chen, Q.; Chen, N.; Zhang, J.; Chen, H.; Huang, B.; Lei, C. Abundant Genetic Diversity of Yunling Cattle Based on Mitochondrial Genome. Animals 2019, 9, 641. [Google Scholar] [CrossRef] [PubMed] [Green Version]
- Padilla, L.; Matsui, T.; Kamiya, Y.; Kamiya, M.; Tanaka, M.; Yano, H. Heat stress decreases plasma vitamin C concentration in lactating cows. Livest. Sci. 2006, 101, 300–304. [Google Scholar] [CrossRef]
- Koyama, H.; Ikeda, S.; Sugimoto, M.; Kume, S. Effects of folic acid on the development and oxidative stress of mouse embryos exposed to heat stress. Reprod. Domest. Anim. 2012, 47, 921–927. [Google Scholar] [CrossRef]
- Hassanpour, H.; Moghaddam, A.K.Z.; Khosravi, M.; Mayahi, M. Effects of synbiotic on the intestinal morphology and humoral immune response in broiler chickens. Livest. Sci. 2013, 153, 116–122. [Google Scholar] [CrossRef]
- Nikkhah, A.; Kianzad, D.; Hajhosseini, A.; Zalbeyk, A. Protected methionine prolonged provision improves summer production and reproduction of lactating dairy cows. Pak. J. Biol. Sci. 2013, 16, 558–563. [Google Scholar] [CrossRef]
- Song, X.; Luo, J.; Fu, D.; Zhao, X.; Bunlue, K.; Xu, Z.; Qu, M. Traditional chinese medicine prescriptions enhance growth performance of heat stressed beef cattle by relieving heat stress responses and increasing apparent nutrient digestibility. Asian-Australas J. Anim. Sci. 2014, 27, 1513–1520. [Google Scholar] [CrossRef] [Green Version]
- Akbarian, A.; Michiels, J.; Degroote, J.; Majdeddin, M.; Golian, A.; De Smet, S. Association between heat stress and oxidative stress in poultry; mitochondrial dysfunction and dietary interventions with phytochemicals. J. Anim. Sci. Biotechnol. 2016, 7, 37. [Google Scholar] [CrossRef] [Green Version]
- Rejeb, M.; Sadraoui, R.; Najar, T. Role of Vitamin C on Immune Function under Heat Stress Condition in Dairy Cows. Asian J. Anim. Vet. Adv. 2016, 11, 717–724. [Google Scholar] [CrossRef]
- Marcillac-Embertson, N.M.; Robinson, P.H.; Fadel, J.G.; Mitloehner, F.M. Effects of shade and sprinklers on performance, behavior, physiology, and the environment of heifers. J. Dairy Sci. 2009, 92, 506–517. [Google Scholar] [CrossRef] [PubMed]
- Boyd, B.M.; Shackelford, S.D.; Hales, K.E.; Brown-Brandl, T.M.; Bremer, M.L.; Spangler, M.L.; Wheeler, T.L.; King, D.A.; Erickson, G.E. Effects of shade and feeding zilpaterol hydrochloride to finishing steers on performance, carcass quality, heat stress, mobility, and body temperature. J. Anim. Sci. 2015, 93, 5801–5811. [Google Scholar] [CrossRef] [PubMed]
- Van Laer, E.; Tuyttens, F.A.; Ampe, B.; Sonck, B.; Moons, C.P.; Vandaele, L. Effect of summer conditions and shade on the production and metabolism of Holstein dairy cows on pasture in temperate climate. Animal 2015, 9, 1547–1558. [Google Scholar] [CrossRef] [PubMed] [Green Version]
- Giro, A.; Pezzopane, J.R.M.; Barioni Junior, W.; Pedroso, A.F.; Lemes, A.P.; Botta, D.; Romanello, N.; Barreto, A.D.N.; Garcia, A.R. Behavior and body surface temperature of beef cattle in integrated crop-livestock systems with or without tree shading. Sci. Total Environ. 2019, 684, 587–596. [Google Scholar] [CrossRef]
- Herbut, P.; Angrecka, S. The effect of heat stress on time spent lying by cows in a housing system. Ann. Anim. Sci. 2018, 18, 825–833. [Google Scholar] [CrossRef] [Green Version]
- Ranjitkar, S.; Bu, D.; Van Wijk, M.; Ma, Y.; Ma, L.; Zhao, L.; Shi, J.; Liu, C.; Xu, J. Will heat stress take its toll on milk production in China? Clim. Chang. 2020, 161, 637–652. [Google Scholar] [CrossRef]
- Skibiel, A.L.; Fabris, T.F.; Corra, F.N.; Torres, Y.M.; McLean, D.J.; Chapman, J.D.; Kirk, D.J.; Dahl, G.E.; Laporta, J. Effects of feeding an immunomodulatory supplement to heat-stressed or actively cooled cows during late gestation on postnatal immunity, health, and growth of calves. J. Dairy Sci. 2017, 100, 7659–7668. [Google Scholar] [CrossRef] [Green Version]
- Batistel, F.; Arroyo, J.M.; Bellingeri, A.; Wang, L.; Saremi, B.; Parys, C.; Trevisi, E.; Cardoso, F.C.; Loor, J.J. Ethyl-cellulose rumen-protected methionine enhances performance during the periparturient period and early lactation in Holstein dairy cows. J. Dairy Sci. 2017, 100, 7455–7467. [Google Scholar] [CrossRef] [Green Version]
- Sheikh, A.A.; Aggarwal, A.; Indu, B.; Aarif, O. Inorganic zinc supplementation modulates heat shock and immune response in heat stressed peripheral blood mononuclear cells of periparturient dairy cows. Theriogenology 2017, 95, 75–82. [Google Scholar] [CrossRef]
- Sun, Y.; Liu, J.; Ye, G.; Gan, F.; Hamid, M.; Liao, S.; Huang, K. Protective effects of zymosan on heat stress-induced immunosuppression and apoptosis in dairy cows and peripheral blood mononuclear cells. Cell Stress Chaperones 2018, 23, 1069–1078. [Google Scholar] [CrossRef] [PubMed]
- Kekana, T.W.; Nherera-Chokuda, F.V.; Muya, M.C.; Manyama, K.M.; Lehloenya, K.C. Milk production and blood metabolites of dairy cattle as influenced by thermal-humidity index. Trop. Anim. Health Pro. 2018, 50, 921–924. [Google Scholar] [CrossRef] [PubMed] [Green Version]
- Ma, L.; Yang, Y.; Zhao, X.; Wang, F.; Gao, S.; Bu, D. Heat stress induces proteomic changes in the liver and mammary tissue of dairy cows independent of feed intake: An iTRAQ study. PLoS ONE 2019, 14, e0209182. [Google Scholar] [CrossRef] [PubMed]
- Ning, Q.; Qu, K.; Hanif, Q.; Jia, Y.; Cheng, H.; Zhang, J.; Chen, N.; Chen, H.; Huang, B.; Lei, C. MTOR Variation Related to Heat Resistance of Chinese Cattle. Animals 2019, 9, 915. [Google Scholar] [CrossRef] [Green Version]
- Zhou, Z.; Huang, B.; Lai, Z.; Li, S.; Wu, F.; Qu, K.; Jia, Y.; Hou, J.; Liu, J.; Lei, C.; et al. The Distribution Characteristics of a 19-bp Indel of the PLAG1 Gene in Chinese Cattle. Animals 2019, 9, 1082. [Google Scholar] [CrossRef] [Green Version]
- Hu, L.; Ma, Y.; Liu, L.; Kang, L.; Brito, L.F.; Wang, D.; Wu, H.; Liu, A.; Wang, Y.; Xu, Q. Detection of functional polymorphisms in the hsp70 gene and association with cold stress response in Inner-Mongolia Sanhe cattle. Cell Stress Chaperon. 2019, 24, 409–418. [Google Scholar] [CrossRef]
- Shen, J.; Hanif, Q.; Cao, Y.; Yu, Y.; Lei, C.; Zhang, G.; Zhao, Y. Whole Genome Scan and Selection Signatures for Climate Adaption in Yanbian Cattle. Front. Genet. 2020, 11, 94. [Google Scholar] [CrossRef]
- Calegari, F.; Calamari, L.; Frazzi, E. Misting and fan cooling of the rest area in a dairy barn. Int. J. Biometeorol. 2012, 56, 287–295. [Google Scholar] [CrossRef]
- Cheng, J.-B.; Fan, C.-Y.; Sun, X.-Z.; Wang, J.-Q.; Zheng, N.; Zhang, X.-K.; Qin, J.-J.; Wang, X.-M. Effects of Bupleurum extract on blood metabolism, antioxidant status and immune function in heat-stressed dairy cows. J. Integr. Agric. 2018, 17, 657–663. [Google Scholar] [CrossRef] [Green Version]
- Conte, G.; Ciampolini, R.; Cassandro, M.; Lasagna, E.; Calamari, L.; Bernabucci, U.; Abeni, F. Feeding and nutrition management of heat-stressed dairy ruminants. Ital. J. Anim. Sci. 2018, 17, 604–620. [Google Scholar] [CrossRef] [Green Version]
- Negron-Perez, V.M.; Fausnacht, D.W.; Rhoads, M.L. Invited review: Management strategies capable of improving the reproductive performance of heat-stressed dairy cattle. J. Dairy Sci. 2019, 102, 10695–10710. [Google Scholar] [CrossRef] [PubMed]
Figure 1.
Distribution of meteorological stations.

Figure 2.
Classified monthly mean THI maps for January to December.
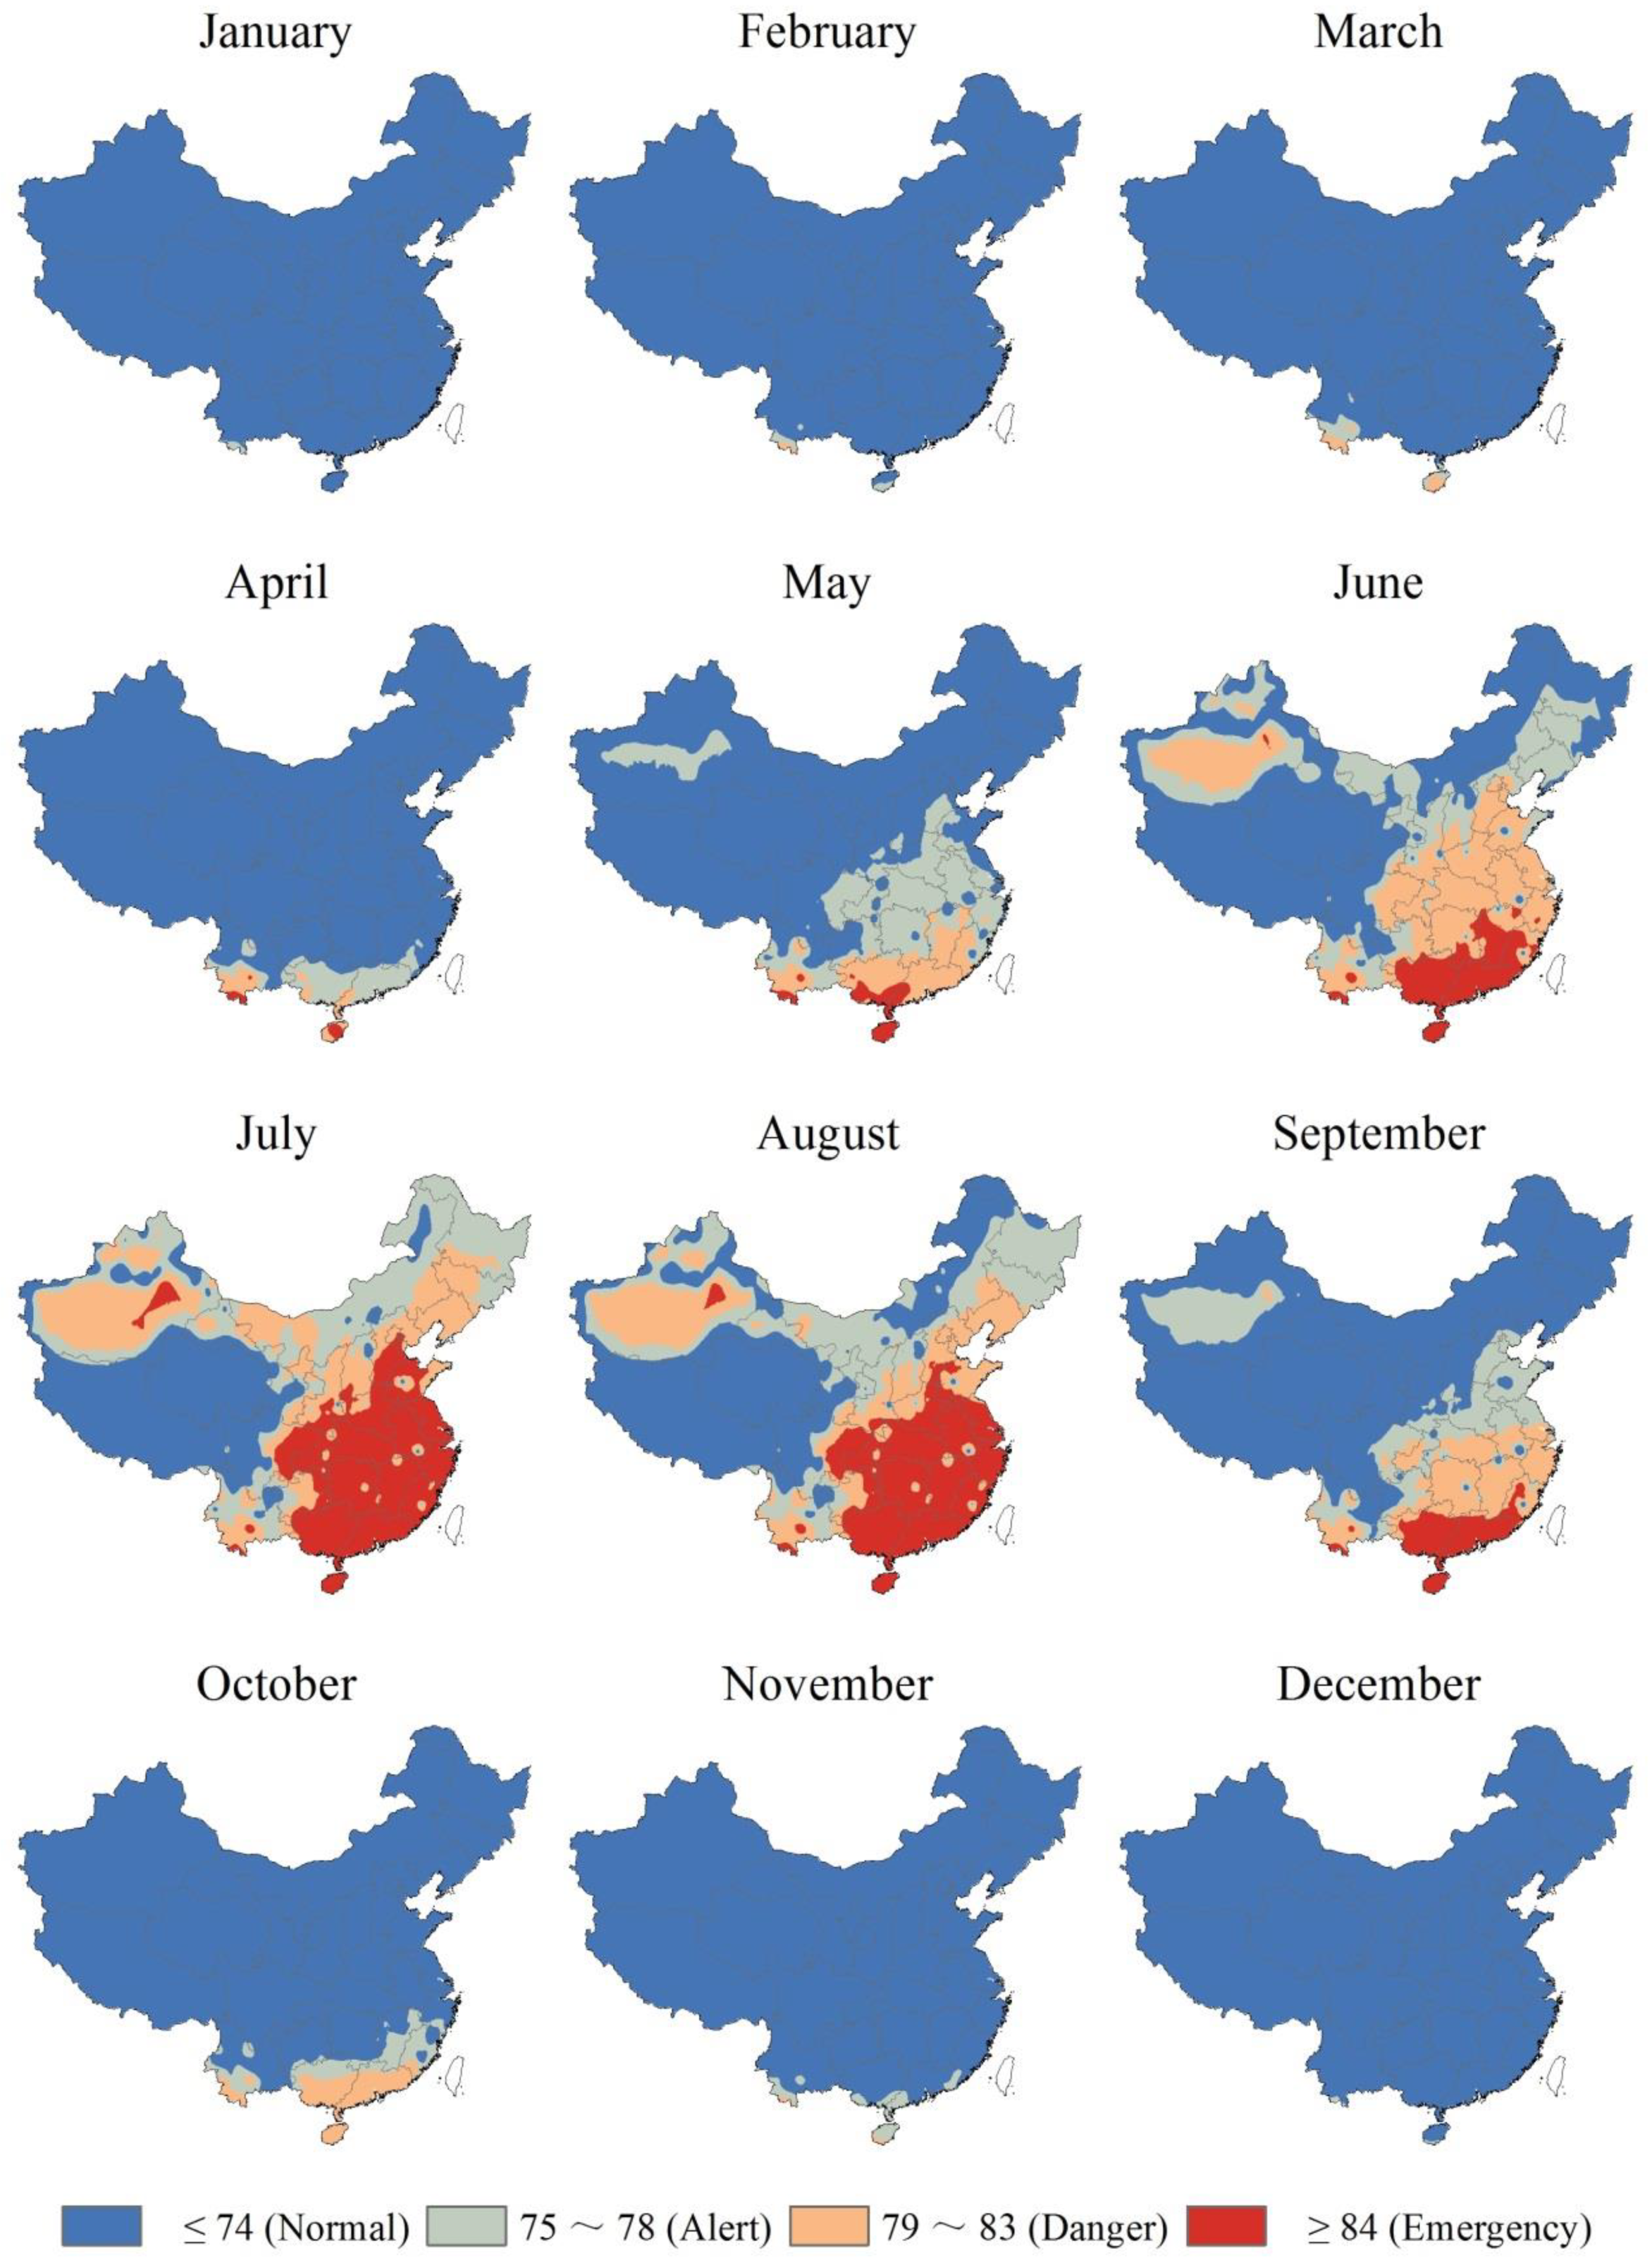
Figure 3.
Classified monthly maximum THI maps for January to December.
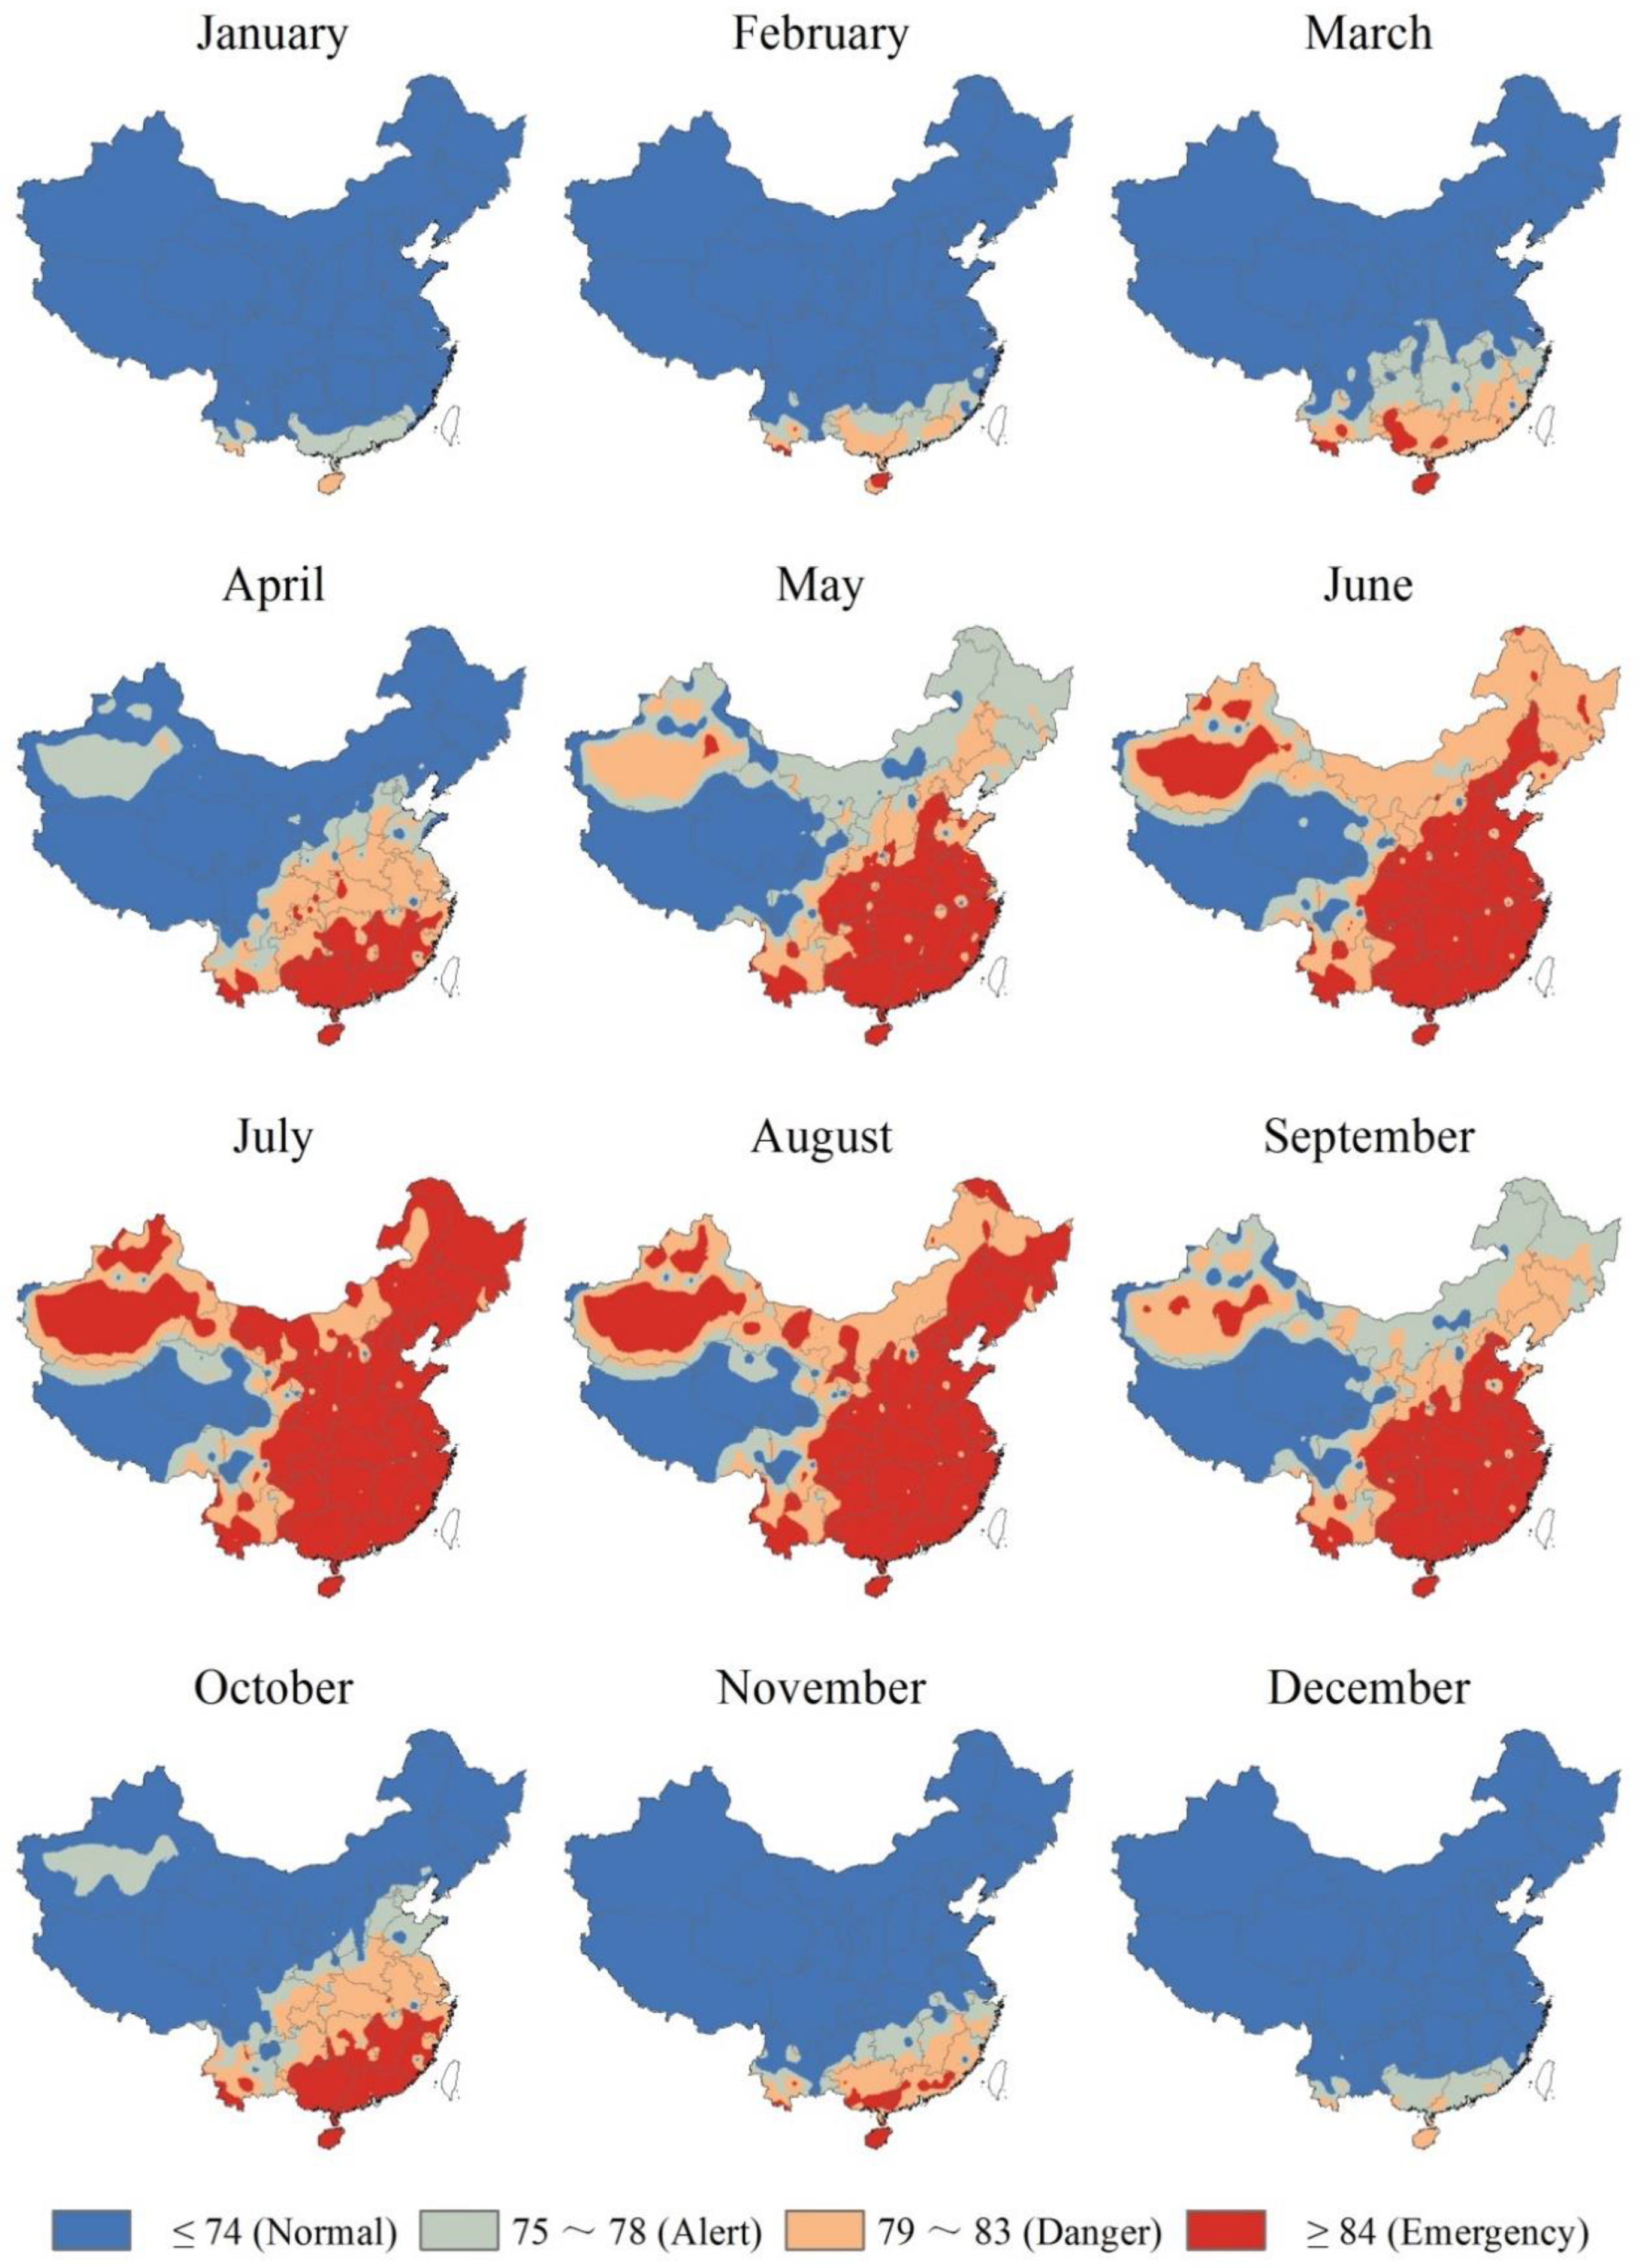
Figure 4.
Indicator kriging maps produced using THI 79 for February to November.

Table 1.
Descriptive statistics for temperature–humidity index (THI) values.
| Climate Region | Tropical | Arid | Temperate | Cold | Polar |
|---|---|---|---|---|---|
| January | 73 | 35 | 53 | 33 | 35 |
| February | 75 | 42 | 56 | 39 | 38 |
| March | 79 | 52 | 62 | 48 | 43 |
| April | 84 | 62 | 71 | 59 | 47 |
| May | 86 | 69 | 77 | 67 | 52 |
| June | 87 | 74 | 81 | 73 | 56 |
| July | 87 | 78 | 85 | 77 | 59 |
| August | 86 | 76 | 84 | 76 | 58 |
| September | 85 | 70 | 79 | 69 | 54 |
| October | 82 | 60 | 72 | 58 | 47 |
| November | 78 | 48 | 64 | 45 | 41 |
| December | 74 | 38 | 56 | 35 | 37 |
| Mean | 81 | 59 | 70 | 57 | 47 |
Table 2.
Correlation coefficients of independent variables (significance levels).
| Variables | Latitude | Longitude | Elevation |
|---|---|---|---|
| January | −0.94 ** | −0.08 * | −0.11 ** |
| February | −0.91 ** | −0.07 * | −0.16 ** |
| March | −0.85 ** | −0.07 | −0.29 ** |
| April | −0.72 ** | 0.05 | −0.54 ** |
| May | −0.59 ** | 0.2 ** | −0.71 ** |
| June | −0.43 ** | 0.32 ** | −0.83 ** |
| July | −0.35 ** | 0.42 ** | −0.89 ** |
| August | −0.41 ** | 0.40 ** | −0.87 ** |
| September | −0.61 ** | 0.28 ** | −0.74 ** |
| October | −0.77 ** | 0.16 ** | −0.57 ** |
| November | −0.92 ** | 0.01 | −0.30 ** |
| December | −0.95 ** | −0.06 | −0.15 ** |
* p < 0.05.; ** p < 0.01.
Table 3.
Classification of calculated probability values and area distribution (%) by month.
| Probability (%) | 0–24 | 25–49 | 50–74 | 75–84 | 85–100 |
|---|---|---|---|---|---|
| January | |||||
| February | 99.81 | 0.19 | |||
| March | 99.32 | 0.65 | 0.03 | ||
| April | 98.19 | 1.10 | 0.47 | 0.12 | 0.12 |
| May | 91.65 | 1.78 | 1.35 | 0.66 | 4.55 |
| June | 65.13 | 11.63 | 5.13 | 3.61 | 14.50 |
| July | 33.44 | 19.43 | 17.04 | 5.48 | 24.60 |
| August | 47.85 | 14.84 | 10.54 | 4.89 | 21.89 |
| September | 82.84 | 4.12 | 2.91 | 2.38 | 7.74 |
| October | 95.68 | 1.29 | 0.88 | 0.45 | 1.69 |
| November | 100.00 | ||||
| December |
Publisher’s Note: MDPI stays neutral with regard to jurisdictional claims in published maps and institutional affiliations. |
© 2020 by the authors. Licensee MDPI, Basel, Switzerland. This article is an open access article distributed under the terms and conditions of the Creative Commons Attribution (CC BY) license (http://creativecommons.org/licenses/by/4.0/).
Share and Cite
MDPI and ACS Style
Wang, T.; Zhong, R.; Zhou, D. Temporal–Spatial Distribution of Risky Sites for Feeding Cattle in China Based on Temperature/Humidity Index. Agriculture 2020, 10, 571. https://doi.org/10.3390/agriculture10110571
AMA Style
Wang T, Zhong R, Zhou D. Temporal–Spatial Distribution of Risky Sites for Feeding Cattle in China Based on Temperature/Humidity Index. Agriculture. 2020; 10(11):571. https://doi.org/10.3390/agriculture10110571
Chicago/Turabian StyleWang, Ting, Rongzhen Zhong, and Daowei Zhou. 2020. "Temporal–Spatial Distribution of Risky Sites for Feeding Cattle in China Based on Temperature/Humidity Index" Agriculture 10, no. 11: 571. https://doi.org/10.3390/agriculture10110571
Note that from the first issue of 2016, this journal uses article numbers instead of page numbers. See further details here.