Mortality from Alcoholic Cardiomyopathy: Exploring the Gap between Estimated and Civil Registry Data


1
Institute of Clinical Psychology and Psychotherapy, TU Dresden, Chemnitzer Str. 46, 01187 Dresden, Germany
2
Center for Interdisciplinary Addiction Research (ZIS), Department of Psychiatry and Psychotherapy, University Medical Center Hamburg-Eppendorf (UKE), Martinistraße 52, 20246 Hamburg, Germany
3
Institute for Mental Health Policy Research, CAMH, 33 Russell Street, Toronto, ON M5S 2S1, Canada
4
Dalla Lana School of Public Health, University of Toronto, 155 College Street, 6th Floor, Toronto, ON M5T 3M7, Canada
5
Campbell Family Mental Health Research Institute, CAMH, 250 College Street, Toronto, ON M5T 1R8, Canada
6
Institute of Medical Science (IMS), University of Toronto, Medical Sciences Building, 1 King’s College Circle, Room 2374, Toronto, ON M5S 1A8, Canada
7
Department of Psychiatry, University of Toronto, 250 College Street, 8th Floor, Toronto, ON M5T 1R8, Canada
8
WHO Collaborating Centre for Mental Health and Addiction, 33 Russell Street, Toronto, ON M5S 2S1, Canada
9
Department of International Health Projects, Institute for Leadership and Health Management, I.M. Sechenov First Moscow State Medical University, Trubetskaya str., 8, b. 2, Moscow 119992, Russia
*
Author to whom correspondence should be addressed.
J. Clin. Med. 2019, 8(8), 1137; https://doi.org/10.3390/jcm8081137
Submission received: 21 June 2019
/
Revised: 22 July 2019
/
Accepted: 29 July 2019
/
Published: 31 July 2019
(This article belongs to the Special Issue The Metabolic Mechanisms of Cardiomyopathy)
Abstract
:Background: Based on civil registries, 26,000 people died from alcoholic cardiomyopathy (ACM) in 2015 globally. In the Global Burden of Disease (GBD) 2017 study, garbage coded deaths were redistributed to ACM, resulting in substantially higher ACM mortality estimates (96,669 deaths, 95% confidence interval: 82,812–97,507). We aimed to explore the gap between civil registry and GBD mortality data, accounting for alcohol exposure as a cause of ACM. Methods: ACM mortality rates were obtained from civil registries and GBD for n = 77 countries. The relationship between registered and estimated mortality rates was assessed by sex and age groups, using Pearson correlation coefficients, in addition to comparing mortality rates with population alcohol exposure—the underlying cause of ACM. Results: Among people aged 65 years or older, civil registry mortality rates of ACM decreased markedly whereas GBD mortality rates increased. The widening gap of registered and estimated mortality rates in the elderly is reflected in a decrease of correlations. The age distribution of alcohol exposure is more consistent with the distribution of civil registry rather than GBD mortality rates. Conclusions: Among older adults, GBD mortality estimates of ACM seem implausible and are inconsistent with alcohol exposure. The garbage code redistribution algorithm should include alcohol exposure for ACM and other alcohol-attributable diseases.
1. Introduction
Heavy alcohol use is a major contributor to cardiovascular diseases (CVD) [1,2]. Among other conditions, high levels of alcohol use can lead to alcoholic cardiomyopathy (ACM), which is characterized by a dilation and impairment of the left ventricle [3]. While this condition is the result of the toxic effects of alcohol, the symptoms and clinical presentation are not unique to ACM but largely resemble other dilated cardiomyopathies [4]. As with other cardiomyopathies, ACM is associated with systolic dysfunction and a considerable risk factor for myocardial infarctions and sudden death [4,5]. In the past few years, interest on ACM grew as reflected in the publication of several reviews describing clinical presentations [5], pathophysiological mechanisms [6], as well as the causal relationship between heavy alcohol consumption and incidence of ACM [7].
For most alcohol-attributable conditions, mortality is estimated via alcohol-attributable fractions (AAFs) based on alcohol exposure and risk relations. For ACM, however, this method cannot be applied to due to a lack of data quantifying the risk relations [7]. Hence, an alternative method was proposed [8], based on cause of death data reported by countries with civil registration of vital statistics [9]; these vital statistics were available for 91 countries and formed the basis to model ACM as cause of death for all countries and globally [10]. According to these estimates, there were 25,997 global deaths from ACM in 2015. Applying a different methodology, the Global Burden of Disease (GBD) 2017 study resulted in a more than three-fold mortality figure (90,669 deaths in 2015, 95% confidence interval: 82,812–97,507) [11]. Higher GBD estimates were the result of redistributing so called garbage coded deaths to well-defined cause of death codes, including ACM and other CVD [12]. The term garbage code has first been coined in 1996 and refers to all codes, which are not useful for public health analyses [13,14]. More precisely, the term encompasses all codes that are not recognized by the Tenth revision of the International Classification of Diseases (ICD-10, [15]) in describing the actual underlying cause of death. Instead, garbage codes may indicate a symptom (e.g., pain) or an intermediate cause of death, such as heart failure [16].
The outlined gap in ACM mortality estimates warrants further attention given the large difference and because GBD mortality estimates are susceptible to the methods employed in redistributing garbage coded deaths, as previously demonstrated for ischemic heart disease [17]. In this contribution, we sought to further explore the gap between registered and estimated ACM deaths. For this purpose, we used mortality data from civil registries, which serve as one main input for the GBD study, and compare these data with mortality estimates as published in the last GBD update [12]. We aimed to examine the association of registered and estimated ACM mortality rates in countries with available civil registry data. Further, we compared ACM mortality distributions to the distribution of alcohol exposure—its underlying cause by definition. In sensitivity analyses, we examined associations of ACM and garbage coded deaths, which constitute the base for redistributing garbage codes to well-defined causes of death in the GBD study [12].
2. Experimental Section
2.1. Description of Data Sources and Disease Definitions
We obtained adult (15 years or older) mortality data from two sources: (1) civil registration data from the World Health Organization (WHO) mortality database [18], and (2) estimated mortality data from the GBD 2017 study [11].
From the WHO mortality database, we retained all country-years with any four-digit ICD-10 code and available data on sex and age. After matching the ICD-10 codes [15] with the disease categories as defined in the GBD 2017 study, we obtained country-, year-, sex-, and age-specific mortality data for the following categories: CVD, cardiomyopathy and myocarditis (hereafter referred to as ‘all cardiomyopathies’), ACM, as well as CVD and heart failure garbage codes (for the definition of each category, see Appendix A and [19]). We calculated the death counts for a new cause of death category ‘all CVD’ from the sum of CVD and CVD garbage code cause of death definition. For country-years with mortality data available only for one sex, we assumed 0 deaths for the other sex. From the GBD database, we obtained the estimated mortality data for the same disease categories (except for garbage codes) [11].
The two mortality data sets were then matched on the above given disease categories and all country-years with available mortality data on ACM and heart failure garbage codes from civil registries were retained, resulting in a total number of 77 countries (with 823 country-years). In order to calculate mortality rates (i.e., deaths per 100,000 adults) we combined the mortality data with population estimates from the UN Population Division [20]. Alcohol exposure was defined as intake of pure alcohol per adult (in liters per year, alcohol per capita consumption). Alcohol exposure data were obtained from a recent modeling study using WHO sources and forecasting techniques [21]. Alcohol exposure data was not available for all 5-year age bands, which required the aggregation of mortality data into the available age groups. In addition to same-year, 5-year and 10-year lagged alcohol exposure estimates were calculated to account for the estimated lag time between exposure and disease incidence [7]. These lag times are in line with findings of a recent review and clinical guidelines [7,22].
2.2. Descriptive Analyses
For descriptive analyses, we only used data from the most recent available year per country (n = 77 data points by sex and age group). For both registered and estimated deaths, we calculated death counts and age-standardized mortality rates per 100,000 adults. To illustrate the gap between registered and estimated deaths, we calculated the ratio of estimated to registered deaths and mortality rates (the larger the ratio, the larger the gap). To examine the association of registered and estimated ACM deaths, Pearson correlations were computed for all adults and by sex and age.
2.3. Sensitivity Analyses
In sensitivity analyses, we aimed to test whether ACM deaths and garbage coded deaths were negatively associated. In the GBD study, a negative association between garbage coded deaths and target diseases is the requirement for the redistribution models [12,13,23]. In brief, these models assume that in jurisdictions with accurate coding practice, a low proportion of deaths are assigned to garbage codes and all other diseases are accurately coded. Consequently, a negative association indicates that the fewer deaths being assigned to garbage codes, the more deaths are being accurately coded. In the GBD study, a negative association between garbage coded deaths and a given cause of death is used as indicator for the redistribution of garbage coded deaths, while positive or non-significant associations indicate that garbage coded deaths may not be redistributed to the given disease.
In this contribution, we performed similar regression models using proportion of ACM deaths among all CVD deaths as target disease and proportion of heart failure deaths among all CVD deaths as garbage codes. We selected heart failure deaths as they were cited as source for redistributing deaths to ACM in the GBD 2017 study [12]. Furthermore, in previous studies the redistribution of heart failure deaths has resulted in an increase of deaths attributable to cardiomyopathy [16,23], which should theoretically increase the number of ACM deaths, as well.
Poisson regression models examined the relationship of heart failure garbage coded deaths (independent variable) and ACM deaths (dependent variable), allowing for random intercepts in each country. As opposed to GBD redistribution models, we included alcohol per capita consumption as additional covariate, which was identified as main driver for estimating ACM mortality [10]. Further, we allowed for nonlinear associations by including polynomials of the independent variable. For more details on the sensitivity analyses, see Appendix A.
All analyses were conducted with R version 3.5.1 [24].
3. Results
A descriptive summary of the mortality data compiled for this study can be found in Table 1.
3.1. Epidemiology of Registered and Estimated ACM Mortality
Using data from the most recent available year for each country, data from n = 77 countries could be obtained, representing 1.54 billion adults, mainly living in the Americas and WHO European Region (for a summary on included countries key data, see Supplementary Table S1). Since 1990, 63,016 ACM deaths (females: 8816; males: 54,200) were recorded in civil registries. For the same set of countries during the same period, the GBD study estimated the ACM death count at 370,675 (females: 66,080; males: 304,595). Thus, for each registered ACM death, nearly 5 additional deaths have been estimated in the GBD study for the included countries (female ratio: 7.5; male ratio: 5.6). For all cardiomyopathies, the gap between estimated to registered deaths is similar to ACM (female ratio: 8.1; male ratio: 6.3), but it is considerably lower for deaths from all CVD (female ratio: 1.8; male ratio: 1.6).
While the variation by sex was relatively low, there were substantial differences in the distribution of estimated and registered deaths across all ages by cause of death definition. In Figure 1, the registered and estimated mortality rates are presented by sex and across all 5-year age groups (see Appendix A for mortality rates by cause, sex, and age). The age distribution of registered and estimated deaths was largely parallel for CVD, with largely constant ratios of estimated to registered mortality rates across all age groups (1.5–2.0). For all cardiomyopathies, distribution of registered and estimated mortality rates were similar, with exponential increases in older age groups. The ratios of estimated and registered mortality rates for all cardiomyopathies were closer among 15 to 59 year olds (2.4–4.7) and increased in older ages (75 years or older: 9.1–11.4).
In contrast, the age distribution of registered and estimated mortality rates of ACM diverged substantially. While registered mortality rates largely resemble a normal distribution peaking at ages 60–64 (0.7 deaths per 100,000 adults) and decreasing thereafter, the estimated ACM mortality rates were left-skewed and peaked in the oldest age group (4.7 deaths per 100,000 people aged 85+ years). Consequently, the gap between estimated and registered mortality rates widened with increasing age, with lowest ratios among 25 to 64 year olds (3.2–5.0) and highest ratios in older ages (75 years and older: 13.1–33.4).
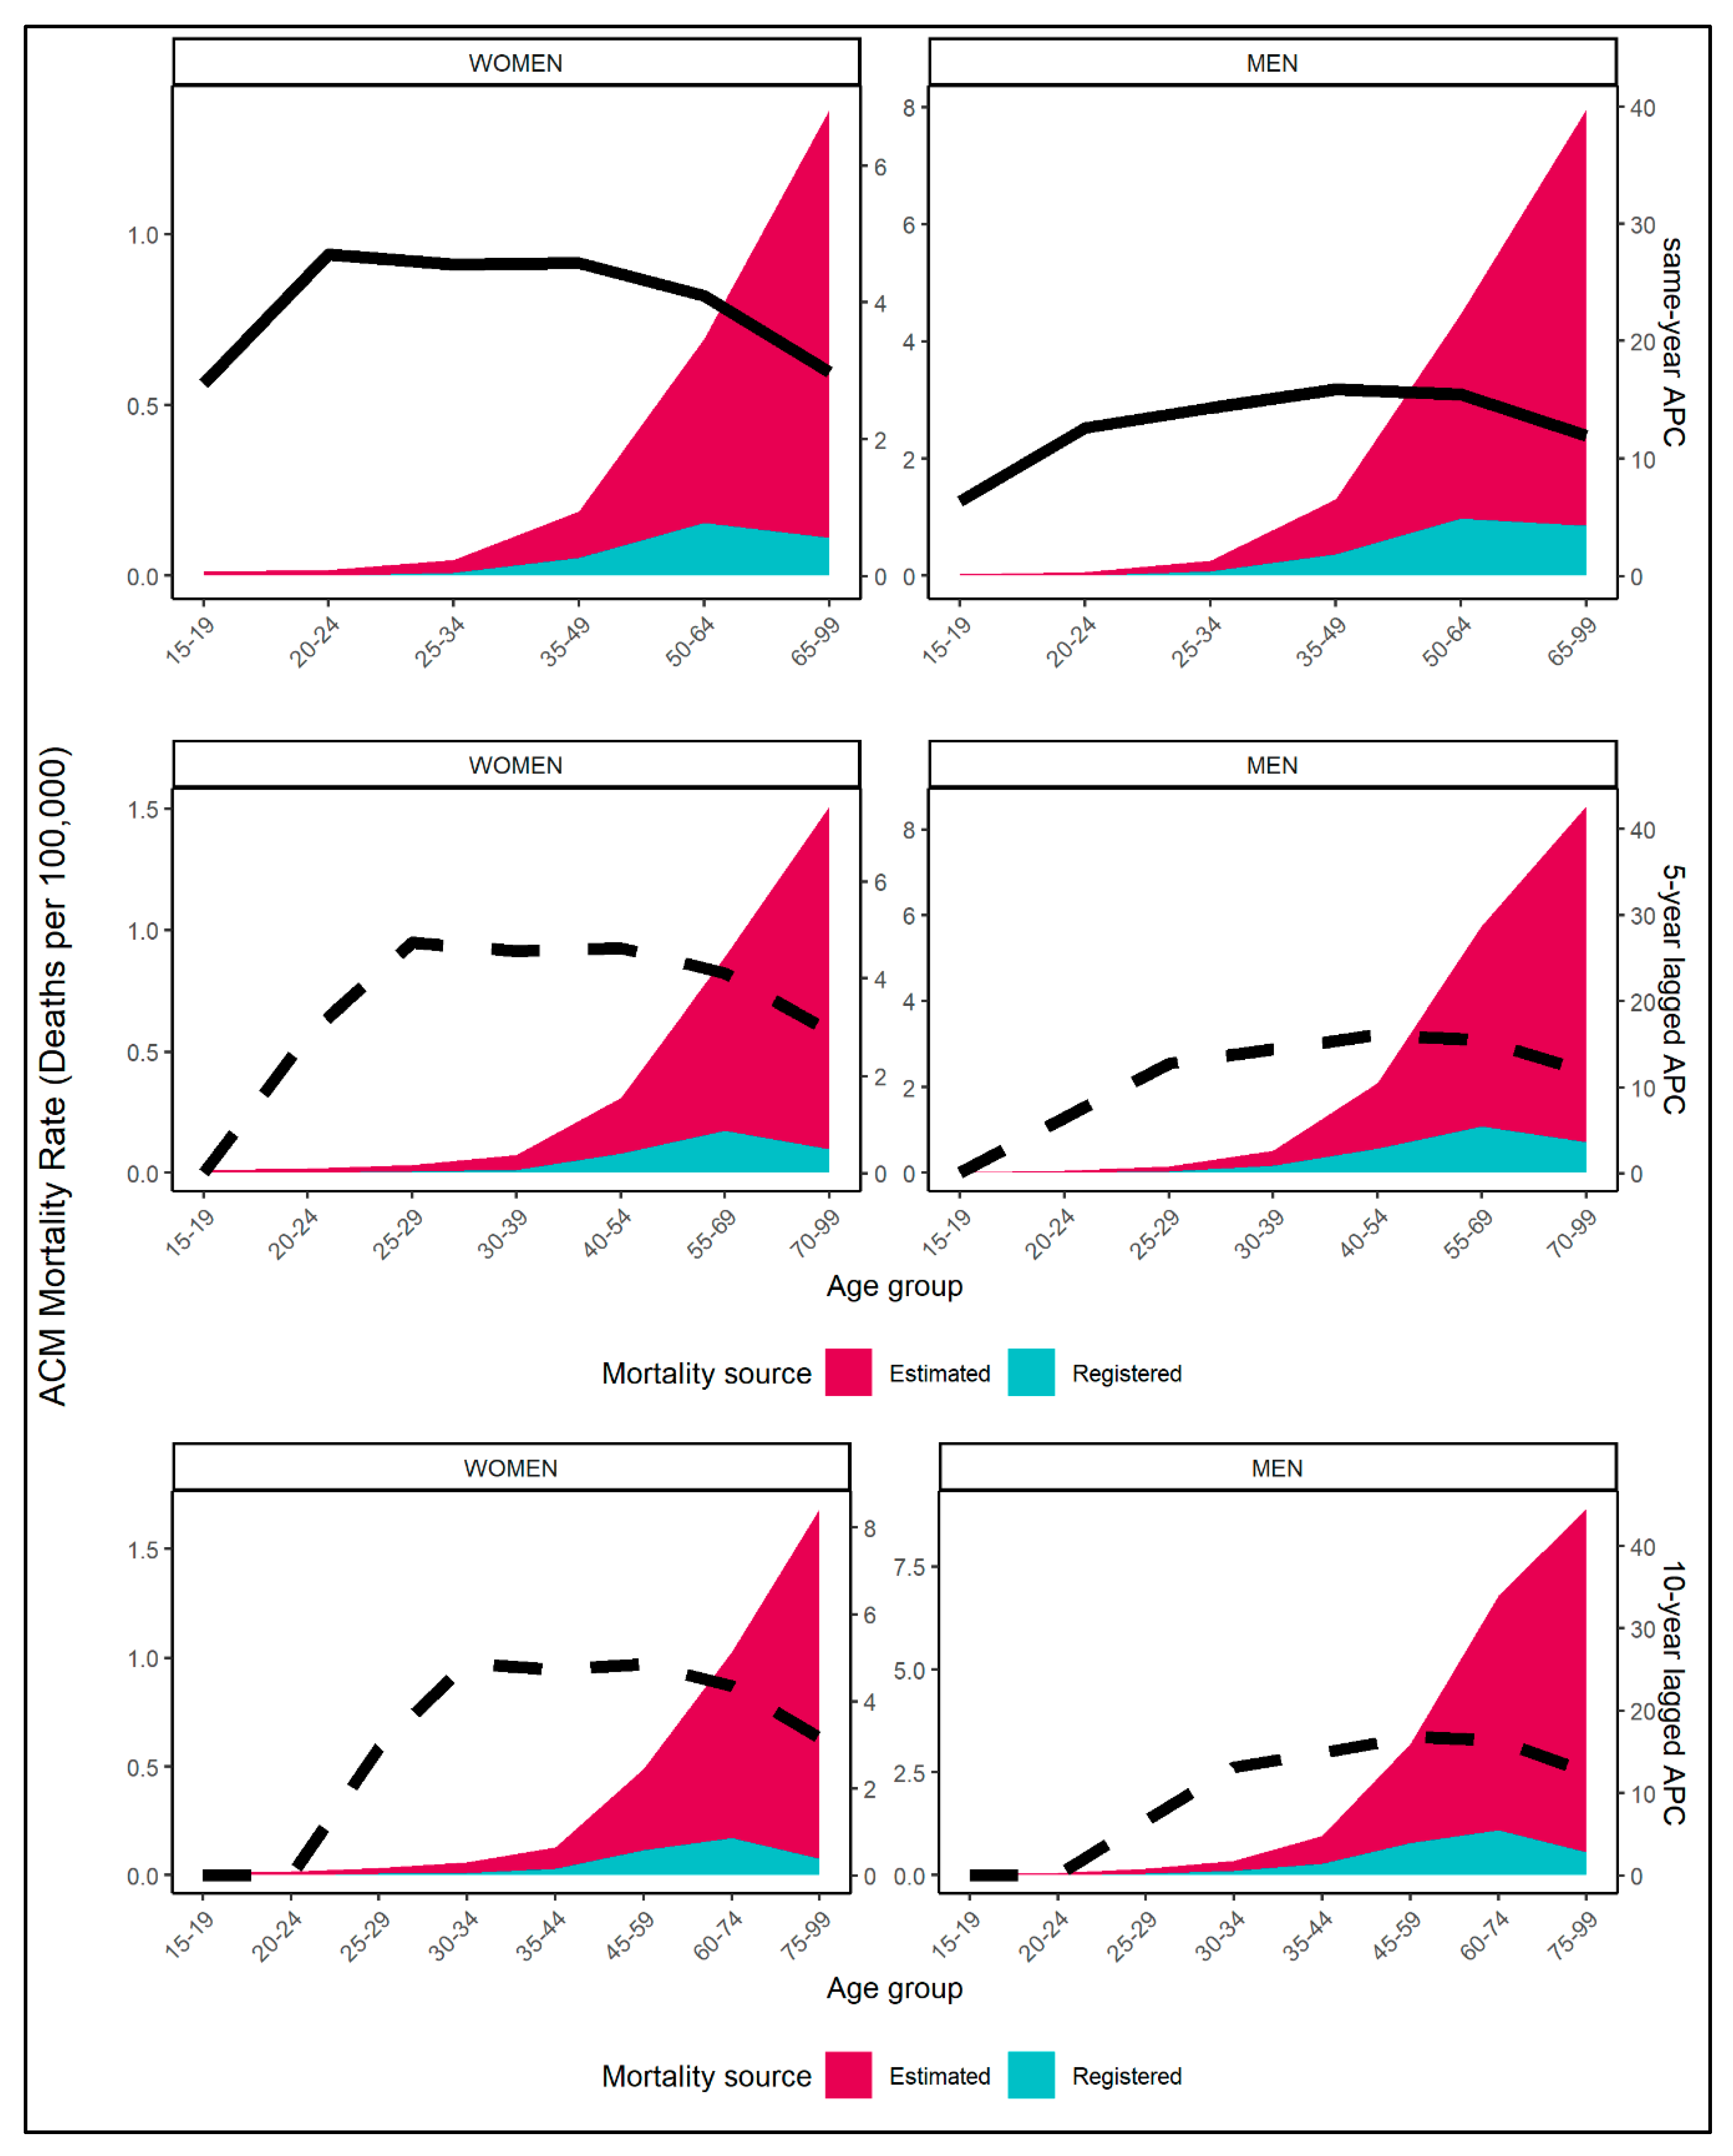
The diverging age pattern in ACM mortality figures can also be observed in Figure 2, where registered and estimated mortality rates are presented together with alcohol exposure estimates, for available age groups. The plot suggests that the age distribution of alcohol exposure was more congruent with registered rather than estimated ACM mortality rates. Among older age groups, both registered mortality rates for ACM and alcohol exposure decreased, while the estimated mortality rates increased. Similar patterns can be observed for both same-year, 5-year, and 10-year lagged alcohol exposure.
The age-dependent association of registered and estimated ACM deaths is also presented in Table 2. The correlation of registered and estimated ACM mortality rates was high among all adults for both women and men. Among men, high correlations (>0.55) can be observed for all ages between 20 and 79 years. In older age groups, the correlations were below 0.20. Among women, registered and estimated ACM mortality rates were not associated in the youngest (25–29 years) and oldest (75 and older) age groups, but were associated in the age groups in between. Furthermore, and among both sexes, the association was most pronounced (i.e., >0.7) up to 64-year old people and decreases thereafter.
3.2. Sensitivity Analyses
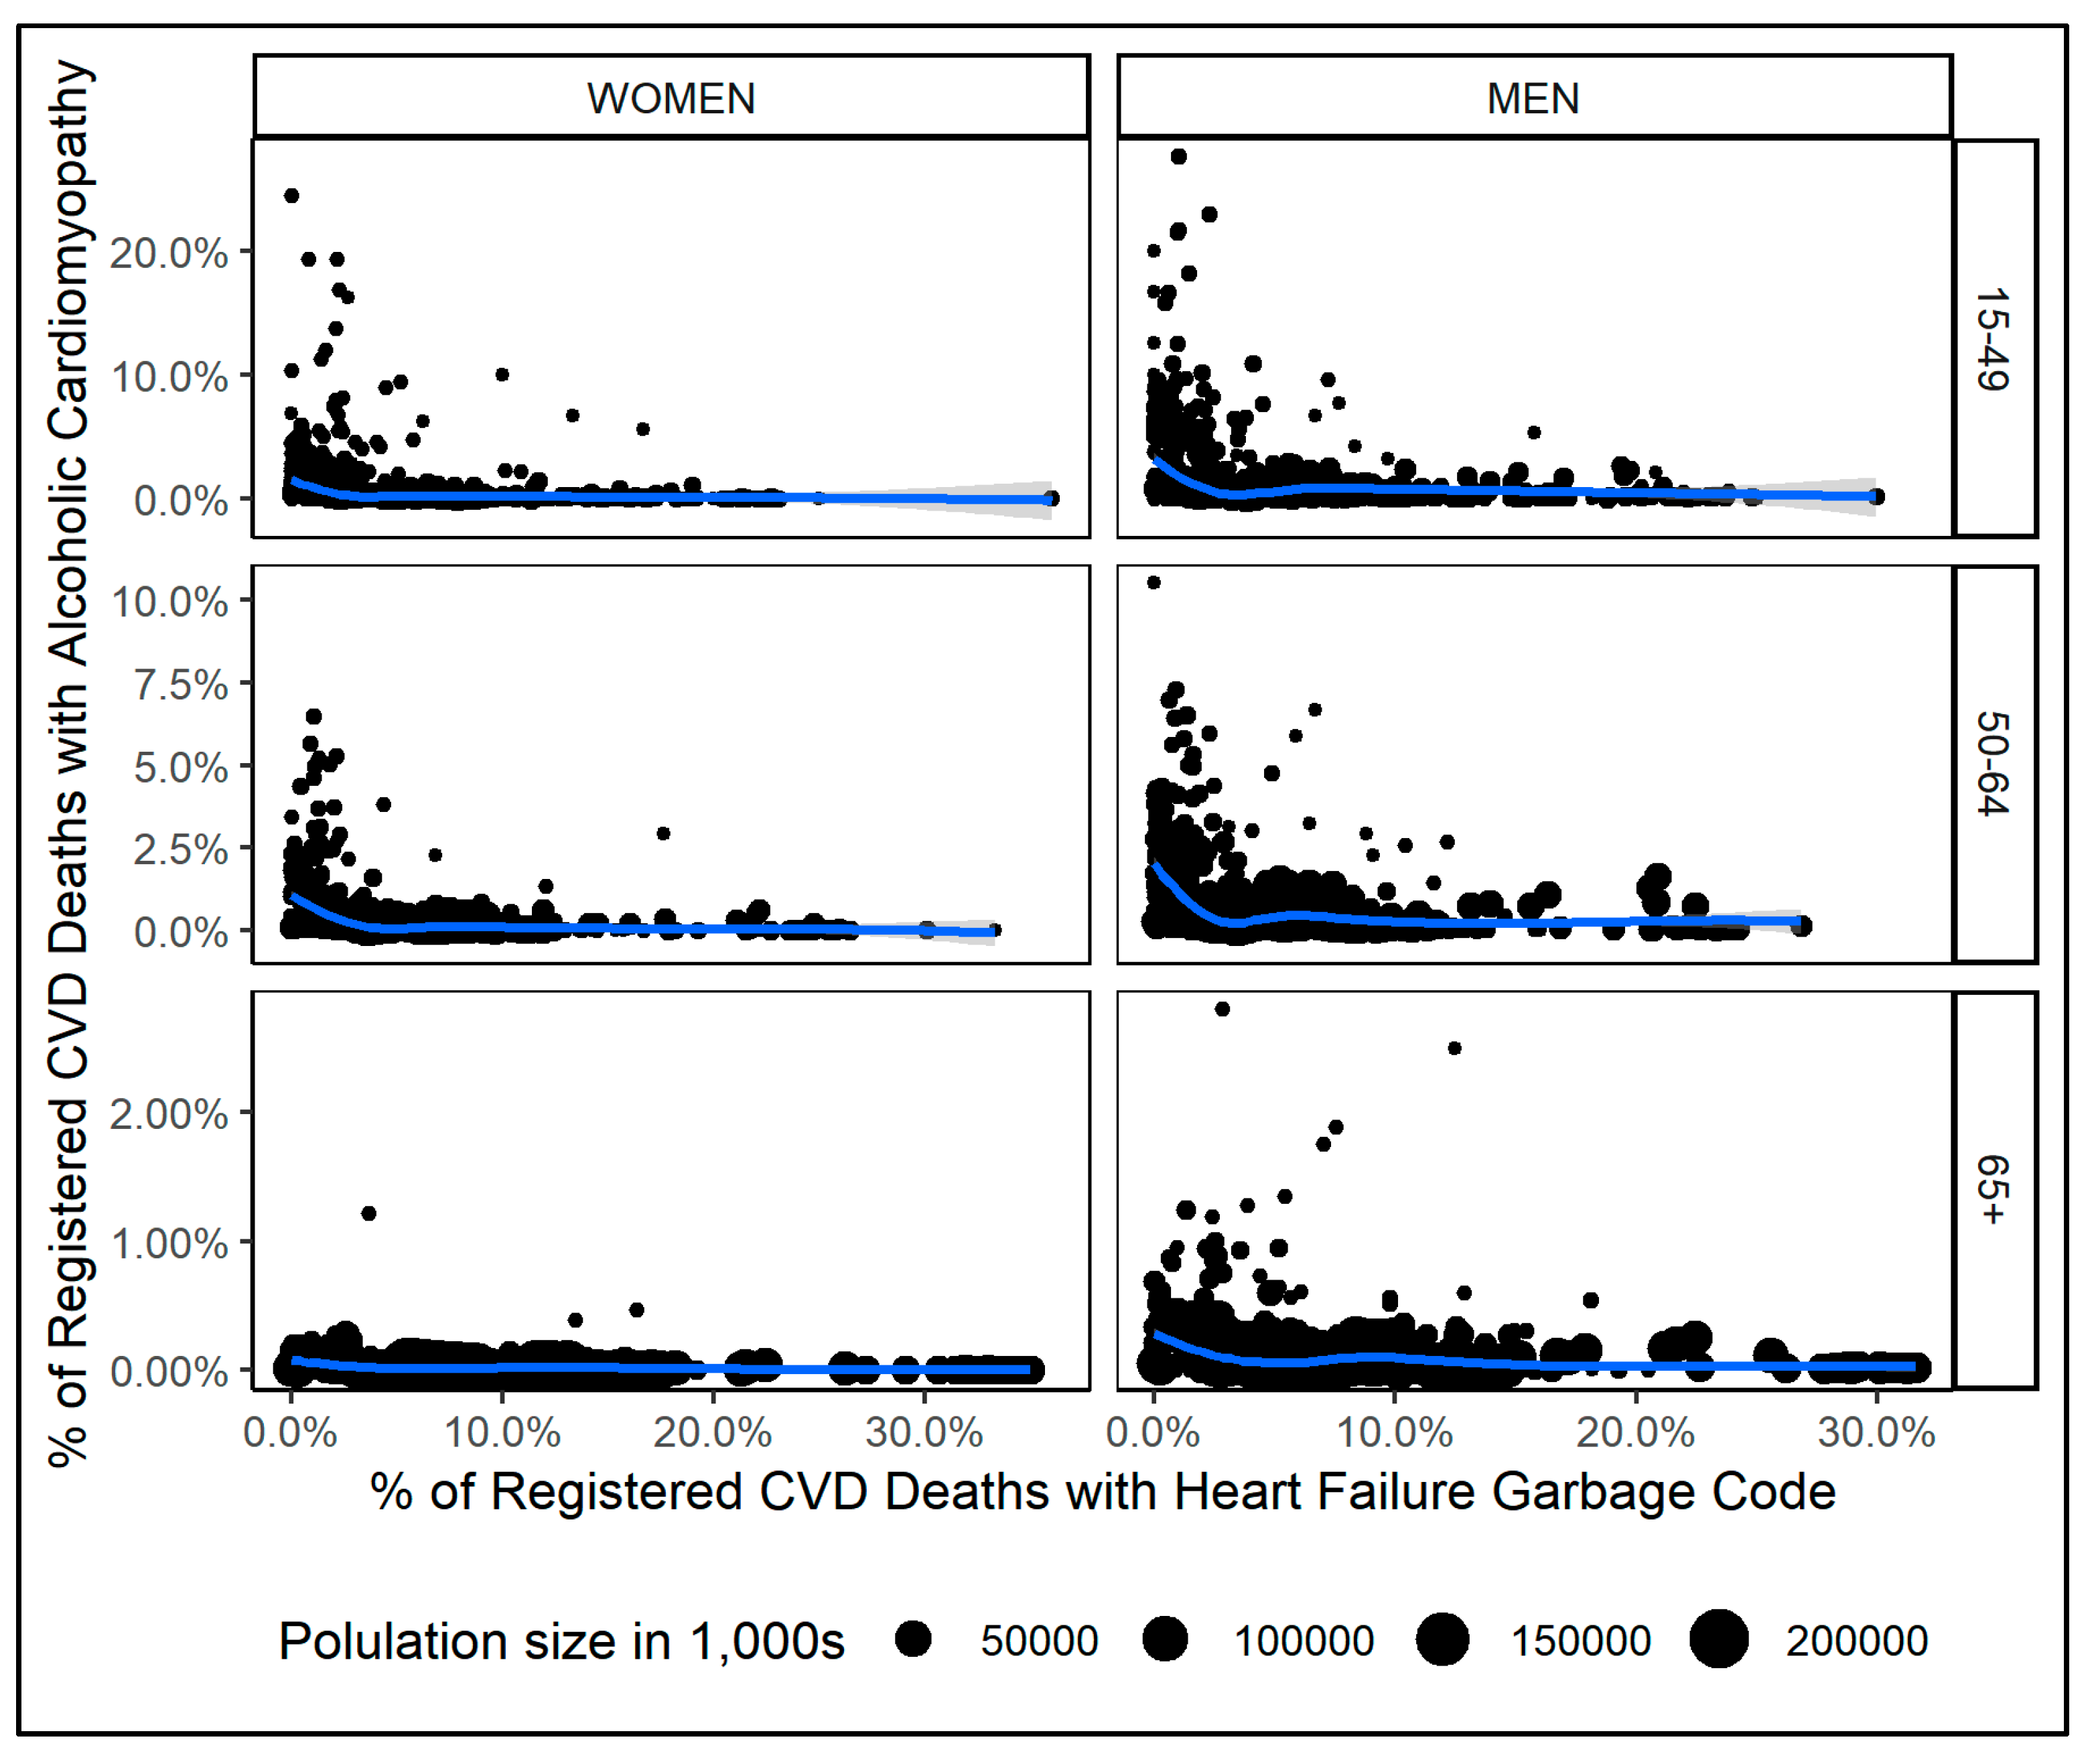
Results of sensitivity analyses are illustrated in Figure 3 (for model results, see Appendix A). Between proportion of ACM deaths and proportion of heart failure deaths among all CVD deaths, there was a non-monotonous negative association. Only for very low proportions of heart failure deaths among all CVD deaths (below 5%) could a decrease in the proportion of ACM deaths among all CVD deaths be observed.
4. Discussion
4.1. Summary of the Findings
This study compared mortality data from civil registries with estimates from the GBD 2017 study, using data from n = 77 countries.
The GBD mortality estimates of ACM seem implausible for the elderly population. Among people aged 65 years or older, the registered ACM mortality rates follow a decrease in alcohol exposure, which is the core determinant of ACM. A similar age distribution of ACM has also been identified in a recent study examining hospitalization data of the United States of America [25]. In contrast, the estimated ACM mortality rates continue to increase with an ageing population. Given a decrease in alcohol exposure among the elderly, an increase of ACM mortality in people aged 65 years or older is unlikely and may result in overestimating the total number of ACM deaths in the GBD study.
4.2. Improving ACM Mortality Estimates
For other alcohol-attributable diseases, mortality is estimated using alcohol-attributable fractions, which are calculated from exposure and risk functions (for global mortality estimates, see reference [26]; for a summary of risk functions, see reference [27]). As alcohol-attributable fractions are stratified by age groups, the decline in exposure in the elderly population can be reflected in lower alcohol-attributable fractions in these age groups. For ACM, mortality in the GBD study is estimated by redistributing garbage coded deaths, yet without accounting for age variations in alcohol exposure [12,23].
In our view, ACM mortality estimates should be made consistent with alcohol exposure, because this is its core determinant. Further, reductions of alcohol use have been associated with improvements of the clinical course of ACM [28], including mortality risks [29]. In order to align alcohol exposure and ACM mortality estimates in the GBD study, alcohol exposure data should be included in models estimating redistributing proportions for ACM. As indicated in this study, a 5-year or 10-year lag of alcohol exposure may prove useful in redistribution models, which likely represents the period of heavy alcohol intake required to develop ACM [7,22]. While a 5-year period of heavy chronic drinking has been used as lower bound to develop ACM [30,31], up to 25 years of heavy chronic drinking among affected patients have been reported in a number of clinical studies [30,32,33]. However, such long lag times may capture treatment onset rather than disease incidence, similar to the delay between onset and treatment of alcohol use disorders [34]. Thus, in the absence of data from population studies, we proposed to use a 10-year lag to model disease onset until further confirmative data is available. Among 15–24 year olds, a 10-year lag would result in 0 ACM deaths, which is largely in line with the registered deaths and is coherent with alcohol-attributable mortality estimation for cancer [26].
4.3. The Impact of Garbage Code Redistribution for ACM Mortality Estimates
In the GBD study, garbage coded deaths are redistributed to other well-defined diseases, including ACM. Since GBD 2013, redistribution proportions are estimated to redistribute garbage coded deaths to selected target diseases (the method proposed in reference [23]; for details of application see Appendix 1 of reference [12]).
Unfortunately, cause-specific results of the redistribution models are not available, thus, it remains unknown how many of the estimated ACM deaths have been redistributed from which garbage code. However, heart failure deaths have been cited as one out of three garbage codes which were redistributed to ACM in the GBD study [12]. Further, heart failure deaths account for a substantial share of CVD deaths in civil registry data and several studies have proposed methods to redistribute heart failure deaths [13,16,23,35]. In brief, heart failure describes an impaired functioning of the heart muscle and is an intermediate state between death and the actual underlying cause, which can be CVDs (e.g., cardiomyopathy, ischemic heart disease) but also other non-communicable diseases such as chronic respiratory diseases, diabetes, or cirrhosis [12,35].
Results from our sensitivity analyses suggest that heart failure deaths may not be redistributed to ACM in the majority of countries included in this study. This is in line with previous studies showing only marginal—if any—increases of mortality from all cardiomyopathies after redistributing heart failure garbage codes [16,23]. In GBD, senility and atherosclerosis have been referred to as other garbage codes, which were redistributed to CVD, including ACM [12]. More details on the misclassification of cause of deaths codes should be provided in the GBD study to improve clinical care and cause of death coding practice. For ACM, this is particularly important as five out of six deaths may not be recognized.
4.4. Clinical Relevance
There is a large gap between registered and estimated deaths due to ACM but also due to all other cardiomyopathies. Primarily, a large number of deaths assigned with garbage codes may be the result of inaccurate cause of death coding. However, this gap could also be an indicator for suboptimal clinical care (detection, treatment) during a lifetime. To diagnose ACM, clinicians need to identify a dilated heart muscle, rule out other potential causes, and conduct an extensive assessment of the patients’ alcohol use [3,22]. However, the substantial stigma around alcohol dependence [36] may deter clinicians from such conversations with their patients, as reported in primary care [37]. Clinicians may further be discouraged to have discussions around alcohol with their patients because of several uncertainties with this topic, e.g., the differential impact on diseases—especially for cardiovascular diseases, for which both beneficial and detrimental effects have been observed (for an overview of risk functions, see reference [27]), the fact that there is no recognized “safe” level of alcohol consumption (for a recent discussion, see references [38,39,40]), or the lack of an international consensus in defining risky drinking [41].
However, even if all ACM cases were accurately identified in clinical practice (i.e., no garbage codes), the contribution of alcohol may still be underestimated if based on death certificates only [42]. In summary, vital statistics may be the best available data source to estimate ACM mortality to date. Yet, prospective studies on the relationship between alcohol intake and incidence of cardiomyopathy are required to yield more accurate mortality estimates.
4.5. Strengths and Limitations
This study used mortality data from 77 countries, representing the majority of high-income countries with highly accurate data from civil registries [9]. However, countries without such data are not represented in this study, most notably African and Asian countries. Thus, the presented results may not apply to non-Caucasian populations from low- and middle-income countries. Further, we restricted the sensitivity analyses to heart failure, which was cited as major source for garbage code redistribution for ACM. As ACM-specific results from the algorithm that redistributes garbage codes in the GBD 2017 study are not available, the impact of redistributing other garbage codes to ACM mortality could not be determined in this study. As the alcohol exposure data used in the GBD study are not available to the authors, we used data from a recent modeling study based on WHO collection and estimation of per capita consumption per country, which is considered the most valid estimate of overall alcohol exposure [43], and was validated by country representatives [44]. This has limited the breakup of mortality data to age groups, for which alcohol exposure data is available.
5. Conclusions
GBD mortality estimates of ACM are implausible for adults aged 65 years or older, as they are incongruent with civil registry and alcohol exposure data in this age group. In order to produce more consistent ACM mortality estimates, the redistribution algorithms in the GBD study should be aligned with alcohol exposure data.
Supplementary Materials
The following are available online at https://www.mdpi.com/2077-0383/8/8/1137/s1, Supplementary Table S1: Country-level data for key variables including source years. The dataset generated and analyzed during this study is available in the figshare repository, https://figshare.com/articles/Mortality_from_alcoholic_cardiomyopathy/7624766 (DOI: 10.6084/m9.figshare.7624766).
Author Contributions
Conceptualization, J.M.; methodology, J.M. and J.R.; software, J.M.; validation, J.M. and J.R.; formal analysis, J.M.; investigation, J.M.; resources, J.M. and J.R.; data curation, J.M.; writing–original draft preparation, J.M.; writing–review and editing, J.M. and J.R.; visualization, J.M.; supervision, J.R.; project administration, J.R.; funding acquisition, N/A
Conflicts of Interest
The authors declare no conflict of interest.
Appendix A
Appendix A.1. Methods
Appendix A.1.1. Definition of Cause of Death Categories
In Appendix Table A1, the disease definitions for all cardiovascular diseases (including garbage codes), cardiovascular diseases (excluding garbage codes), all cardiomyopathies, alcoholic cardiomyopathy, and cardiovascular as well as heart failure garbage codes are presented. The table lists ICD-10 cause of deaths codes matched with mortality data obtained from the World Health Organization.

Table A1.
Cause of death definition.
| GBD Cause of Death Definition | ICD-10 Cause of Death Codes | Short Term Used in Manuscript |
|---|---|---|
| All cardiovascular diseases (sum of garbage and non-garbage codes) | Non-garbage: B33.2, G45-G46.8, I01-I01.9, I02.0, I05-I09.9, I11-I11.9, I20-I25.9, I28-I28.8, I30-I31.1, I31.8-I37.8, I38-I41.9, I42.1-I42.8, I43-I43.9, I47-I48.9, I51.0-I51.4, I60-I63.9, I65-I66.9, I67.0-I67.3, I67.5-I67.6, I68.0-I68.2, I69.0-I69.3, I70.2-I70.8, I71-I73.9, I77-I83.9, I86-I89.0, I89.9, I98, K75.1 Garbage: Level-1: I26-I26.9, I31.2-I31.4, I37.9, I46-I46.9, I50-I50.9, I51.7, I67.4, I76, I95-I95.1, I95.8-I95.9, Level-2: I10-I10.9, I15-I15.9, I27-I27.0, I27.2-I27.9, I28.9, I70-I70.1, I70.9, I74-I75.8 Level-3: I00.0, I03-I04., I14-I14., I16-I19, I29-I29.9, I44-I45.9, I49-I49.9, I51, I51.6, I51.8-I59, I90-I94, I96-I96.9, I98.4-I98.8, I99 Level-4: I42-I42.0, I42.9, I51.5, I64-I64.9, I67, I67.8-I68, I68.8-I69, I69.4-I69.9 | All CVD |
| Cardiovascular diseases | B33.2, G45-G46.8, I01-I01.9, I02.0, I05-I09.9, I11-I11.9, I20-I25.9, I28-I28.8, I30-I31.1, I31.8-I37.8, I38-I41.9, I42.1-I42.8, I43-I43.9, I47-I48.9, I51.0-I51.4, I60-I63.9, I65-I66.9, I67.0-I67.3, I67.5-I67.6, I68.0-I68.2, I69.0-I69.3, I70.2-I70.8, I71-I73.9, I77-I83.9, I86-I89.0, I89.9, I98, K75.1 | CVD |
| Cardiomyopathy and myocarditis | B33.2, I40-I41.9, I42.1-I42.8, I43-I43.9, I51.4 | All cardiomyopathies |
| Alcoholic cardiomyopathy | I42.6 | ACM |
| Garbage codes in ICD-10 category of circulatory diseases | Level-1: I26-I26.9, I31.2-I31.4, I37.9, I46-I46.9, I50-I50.9, I51.7, I67.4, I76, I95-I95.1, I95.8-I95.9, Level-2: I10-I10.9, I15-I15.9, I27-I27.0, I27.2-I27.9, I28.9, I70-I70.1, I70.9, I74-I75.8 Level-3: I00.0, I03-I04., I14-I14., I16-I19, I29-I29.9, I44-I45.9, I49-I49.9, I51, I51.6, I51.8-I59, I90-I94, I96-I96.9, I98.4-I98.8, I99 Level-4: I42-I42.0, I42.9, I51.5, I64-I64.9, I67, I67.8-I68, I68.8-I69, I69.4-I69.9 | CVD garbage codes |
| Heart failure garbage codes | I50 | HF garbage code |
Note: Mapping of ICD-10 codes to disease category obtained from GBD 2017 study.
Appendix A.1.2. Description of Sensitivity Analyses
In the GBD study, a redistribution model is applied to estimate so called redistribution proportions, which are employed for redistributing garbage coded deaths to other diseases. In this study, we performed a similar model building on the hypotheses that among all cardiovascular deaths, the proportion of deaths with heart failure (HF) garbage codes is negatively associated with the proportion of ACM deaths.
For the sensitivity analyses, we used all mortality data from all available years, i.e. from 823 country-years (for details, see Supplementary Table S1). The denominator for calculating HF garbage code and ACM proportions was ‘all CVD’ and was calculated from the sum of all registered deaths from CVD and CVD garbage codes (for definition, see Appendix Table A1). Prior to building regression models, the data structure of the dependent variable (% of ACM deaths) was examined using scatter plots and bivariate correlations with % of HF garbage code deaths and alcohol exposure (for results see Appendix Table A2).
Table A2.
Bivariate correlations of % HF garbage codes and % ACM mortality.
| 15–49 Year Olds | 50–64 Year Olds | 65+ Year Olds | ||||||||
|---|---|---|---|---|---|---|---|---|---|---|
| % ACM | % HF Garbage Codes | APC | % ACM | % HF Garbage Codes | APC | % ACM | % HF Garbage Codes | APC | ||
| Women | % ACM | 1 | 1 | 1 | ||||||
| % HF Garbage codes | −0.15 | 1 | −0.24 | 1 | −0.19 | 1 | ||||
| APC | 0.26 | −0.17 | 1 | 0.34 | −0.14 | 1 | 0.21 | −0.01 | 1 | |
| Men | % ACM | 1 | 1 | 1 | ||||||
| % HF Garbage codes | −0.24 | 1 | −0.29 | 1 | −0.21 | 1 | ||||
| APC | 0.30 | −0.15 | 1 | 0.35 | −0.15 | 1 | 0.21 | −0.10 | 1 | |
Note: ACM = Alcoholic cardiomyopathy. HF = Heart failure. APC = Alcohol per capita consumption. Bivariate correlations based on mortality data from 823 country-years with available civil registry mortality data. Proportion of deaths are calculated from the denominator of all CVD deaths (including garbage codes).
Between ACM and heart failure, the distribution of deaths across age groups were substantially different. Among 50 to 64 year olds, the largest share of ACM deaths (47%) but only a fraction of HF garbage code deaths (7%) have been registered. This pattern reversed for the older age groups (65 years and older), among which 29% of all ACM deaths but 91% of all deaths assigned with HF garbage codes have been registered. Further and as illustrated in Appendix Figure A1, the association of % ACM deaths and % HF garbage code deaths varied largely across sex and age. Consequently, all regression models were stratified by sex and age group (15–49, 50–64, 65+).
Figure A1.
Scatter plots of % HF garbage code deaths and % ACM deaths among all CVD deaths by sex and age group; the blue line denotes a weighted smoothing function of the two variables.
Figure A1.
Scatter plots of % HF garbage code deaths and % ACM deaths among all CVD deaths by sex and age group; the blue line denotes a weighted smoothing function of the two variables.

For each stratum, we fitted the following models: (1A) a fractional response model with a linear combination of both covariates (% HF garbage code deaths and alcohol per capita consumption) and allowing for random intercepts for each country; (1B) a Poisson regression where the dependent variable was multiplied with 10,000 and rounded to the nearest integer and with the same covariate structure as in (1A); (2A) a fractional response regression as in 1A but with an additional set of 3rd order orthogonal polynomials of % HF garbage code deaths (as suggested by scatter plots, see Appendix Figure A1); (2B) a Poisson regression as in 1B but with an additional set of 3rd order orthogonal polynomials of % HF garbage code deaths. Poisson regression models (1B and 2B) were found to be superior to fractional response models in terms of data fit as assessed using R² and plotting fitted and observed data. Subsequently, Poisson models with linear and polynomial covariates were compared within each stratum using analysis of deviance tests. For most strata, model 2B (random effects Poisson regression with 3rd order polynomials of % HF garbage code deaths) were found the best fitting model (Chi²-tests: p < 0.001 for all tests), except young females, for which model 1B indicated best fit (random effects Poisson regression with linear combination of covariates).
For the random effects Poisson regression models, the equation is written as generalized linear model and was performed by sex and three age groups (15–49, 50–64, 65+):
where:
- f() = Poisson function with log link function and Poisson distributed data
- ACMc = percentage of all cardiovascular deaths which were coded to alcohol cardiomyopathy, by country
- α = constant
- HF = percentage of all cardiovascular deaths which were coded to heart failure
- β1 = slope coefficient describing the association between HF and ACMc
- β2 = slope coefficient describing the association between the polynomial HF2 and ACMc (not included among young females)
- β3 = slope coefficient describing the association between the polynomial HF3 and ACMc (not included among young females)
- APC = Alcohol per capita consumption
- β4 = slope coefficient describing the association between APC and ACMc
- γr = country-specific random intercept
- εc = standard error
For comparison, the regression equation used in the GBD study to calculate redistribution proportions is as follows (for details, see Appendix 1 of [12]):
where:
- TGcrt = percentage of deaths within the given garbage code’s universe which were coded to a
- given target group, by country
- α = constant
- Garcrt = percentage of deaths within the given garbage code’s universe which were coded to a given set of garbage codes
- β1 = slope coefficient describing the association between Garcrt and TGcrt
- β2 = slope coefficient describing the association between the interaction Agecrt and Garcrt
- γr = region-specific random intercept (or super-region if the random effect on region is not
- significant)
- θr = region-specific random slope (or super-region if the random effect on region is not
- significant)
- εct = standard error, normally distributed and calculated by bootstrapping
There are two main differences between the GBD redistribution model and the model presented in this study. First, we accounted for alcohol exposure as the core determinant for ACM and second, allowed for a non-linear relationship between HF garbage code and ACM mortality proportions.
Appendix A.2. Results
Appendix A.2.1. Mortality Rates of Registered and Estimated Deaths
In Appendix Table A3, Table A4 and Table A5, the mortality rates of cardiovascular diseases, all cardiomyopathies, and alcoholic cardiomyopathy are presented by sex and age. The table also includes the ratio of estimated to registered mortality rates, which are largely constant for cardiovascular diseases but increase with age for all cardiomyopathies and alcoholic cardiomyopathy.
Table A3.
Mortality rates of registered and estimated deaths of alcoholic cardiomyopathies by sex and age.
Table A3.
Mortality rates of registered and estimated deaths of alcoholic cardiomyopathies by sex and age.
| Women | Men | Both Sexes | |||||||
|---|---|---|---|---|---|---|---|---|---|
| Registered | Estimated | Ratio | Registered | Estimated | Ratio | Registered | Estimated | Ratio | |
| 15–19 | 0.00 | 0.01 | NA | 0.00 | 0.03 | NA | 0.00 | 0.02 | NA |
| 20–24 | 0.00 | 0.02 | NA | 0.01 | 0.06 | 6.6 | 0.00 | 0.04 | 8.5 |
| 25–29 | 0.01 | 0.03 | 3.9 | 0.04 | 0.16 | 3.5 | 0.03 | 0.10 | 3.6 |
| 30–34 | 0.01 | 0.06 | 5.3 | 0.11 | 0.36 | 3.3 | 0.06 | 0.21 | 3.5 |
| 35–39 | 0.01 | 0.09 | 6.7 | 0.23 | 0.68 | 3.0 | 0.12 | 0.39 | 3.2 |
| 40–44 | 0.05 | 0.17 | 3.4 | 0.34 | 1.25 | 3.7 | 0.19 | 0.71 | 3.7 |
| 45–49 | 0.10 | 0.31 | 3.1 | 0.56 | 2.04 | 3.6 | 0.33 | 1.17 | 3.6 |
| 50–54 | 0.10 | 0.46 | 4.7 | 0.83 | 3.10 | 3.7 | 0.46 | 1.76 | 3.8 |
| 55–59 | 0.16 | 0.73 | 4.6 | 1.00 | 4.70 | 4.7 | 0.57 | 2.66 | 4.7 |
| 60–64 | 0.22 | 0.95 | 4.2 | 1.16 | 6.02 | 5.2 | 0.67 | 3.38 | 5.0 |
| 65–69 | 0.14 | 1.03 | 7.2 | 1.14 | 6.88 | 6.0 | 0.61 | 3.79 | 6.2 |
| 70–74 | 0.14 | 1.15 | 8.3 | 0.95 | 7.96 | 8.4 | 0.51 | 4.26 | 8.4 |
| 75–79 | 0.09 | 1.32 | 15.5 | 0.69 | 8.80 | 12.7 | 0.35 | 4.58 | 13.1 |
| 80–84 | 0.09 | 1.44 | 15.4 | 0.56 | 8.59 | 15.2 | 0.28 | 4.32 | 15.2 |
| 85–99 | 0.05 | 2.39 | 45.5 | 0.32 | 9.50 | 29.4 | 0.14 | 4.72 | 33.4 |
Note: Mortality rates = deaths per 100,000 population. Ratio = ratio of estimated to registered deaths. Mortality data obtained from n = 77 countries (see Supplementary Table S1).
Table A4.
Mortality rates of registered and estimated deaths of cardiovascular diseases by sex and age.
Table A4.
Mortality rates of registered and estimated deaths of cardiovascular diseases by sex and age.
| Women | Men | Both Sexes | |||||||
|---|---|---|---|---|---|---|---|---|---|
| Registered | Estimated | Ratio | Registered | Estimated | Ratio | Registered | Estimated | Ratio | |
| 15–19 | 1.3 | 2.8 | 2.2 | 2.1 | 4.1 | 1.9 | 1.7 | 3.5 | 2.0 |
| 20–24 | 1.9 | 4.1 | 2.1 | 3.8 | 6.6 | 1.7 | 2.9 | 5.3 | 1.8 |
| 25–29 | 3.0 | 5.8 | 1.9 | 6.1 | 10.3 | 1.7 | 4.6 | 8.1 | 1.8 |
| 30–34 | 4.9 | 9.2 | 1.9 | 10.6 | 17.5 | 1.7 | 7.7 | 13.4 | 1.7 |
| 35–39 | 8.7 | 15.3 | 1.8 | 19.0 | 30.0 | 1.6 | 13.8 | 22.7 | 1.6 |
| 40–44 | 15.5 | 26.0 | 1.7 | 36.0 | 53.9 | 1.5 | 25.7 | 39.9 | 1.6 |
| 45–49 | 26.7 | 43.9 | 1.6 | 63.6 | 94.3 | 1.5 | 45.0 | 68.9 | 1.5 |
| 50–54 | 43.4 | 71.2 | 1.6 | 109.8 | 162.1 | 1.5 | 76.0 | 116.0 | 1.5 |
| 55–59 | 70.1 | 114.5 | 1.6 | 176.3 | 265.9 | 1.5 | 121.8 | 188.2 | 1.6 |
| 60–64 | 112.6 | 188.1 | 1.7 | 270.1 | 414.3 | 1.5 | 188.0 | 296.4 | 1.6 |
| 65–69 | 181.5 | 304.2 | 1.7 | 386.3 | 600.0 | 1.6 | 278.1 | 443.8 | 1.6 |
| 70–74 | 320.1 | 549.8 | 1.7 | 588.2 | 950.7 | 1.6 | 442.5 | 732.9 | 1.7 |
| 75–79 | 604.2 | 1039.4 | 1.7 | 954.0 | 1552.5 | 1.6 | 756.8 | 1263.3 | 1.7 |
| 80–84 | 1162.5 | 2008.5 | 1.7 | 1632.0 | 2699.4 | 1.6 | 1351.4 | 2286.5 | 1.7 |
| 85–99 | 3112.1 | 5667.5 | 1.8 | 3538.3 | 6178.5 | 1.8 | 3251.8 | 5835.0 | 1.8 |
Note: Mortality rates = deaths per 100,000 population. Ratio = ratio of estimated to registered deaths. Mortality data obtained from n = 77 countries (see Supplementary Table S1).
Table A5.
Mortality rates of registered and estimated deaths of all cardiomyopathies by sex and age.
Table A5.
Mortality rates of registered and estimated deaths of all cardiomyopathies by sex and age.
| Women | Men | Both Sexes | |||||||
|---|---|---|---|---|---|---|---|---|---|
| Registered | Estimated | Ratio | Registered | Estimated | Ratio | Registered | Estimated | Ratio | |
| 15–19 | 0.1 | 0.3 | 2.3 | 0.3 | 0.6 | 2.5 | 0.2 | 0.5 | 2.4 |
| 20–24 | 0.1 | 0.4 | 4.1 | 0.2 | 0.8 | 3.5 | 0.2 | 0.6 | 3.7 |
| 25–29 | 0.2 | 0.5 | 3.3 | 0.4 | 1.2 | 3.1 | 0.3 | 0.8 | 3.2 |
| 30–34 | 0.2 | 0.6 | 3.7 | 0.5 | 1.6 | 3.4 | 0.3 | 1.1 | 3.5 |
| 35–39 | 0.3 | 0.9 | 3.6 | 0.8 | 2.4 | 3.1 | 0.5 | 1.6 | 3.2 |
| 40–44 | 0.3 | 1.2 | 3.7 | 1.0 | 3.6 | 3.7 | 0.7 | 2.4 | 3.7 |
| 45–49 | 0.5 | 1.7 | 3.7 | 1.4 | 5.2 | 3.7 | 1.0 | 3.5 | 3.7 |
| 50–54 | 0.6 | 2.5 | 4.2 | 1.9 | 7.6 | 4.0 | 1.3 | 5.0 | 4.0 |
| 55–59 | 0.8 | 3.9 | 4.8 | 2.4 | 11.1 | 4.7 | 1.6 | 7.4 | 4.7 |
| 60–64 | 1.1 | 5.5 | 5.1 | 2.8 | 14.7 | 5.3 | 1.9 | 9.9 | 5.2 |
| 65–69 | 1.3 | 8.1 | 6.4 | 3.2 | 19.1 | 6.0 | 2.2 | 13.3 | 6.1 |
| 70–74 | 1.9 | 13.4 | 7.0 | 3.4 | 26.9 | 8.0 | 2.6 | 19.6 | 7.6 |
| 75–79 | 2.9 | 25.2 | 8.7 | 4.5 | 42.1 | 9.4 | 3.6 | 32.6 | 9.1 |
| 80–84 | 5.5 | 50.4 | 9.2 | 6.1 | 67.4 | 11.1 | 5.7 | 57.3 | 10.0 |
| 85–99 | 13.2 | 150.9 | 11.5 | 13.4 | 151.1 | 11.3 | 13.2 | 151.0 | 11.4 |
Note: Mortality rates = deaths per 100,000 population. Ratio = ratio of estimated to registered deaths. Mortality data obtained from n = 77 countries (see Supplementary Table S1).
Appendix A.2.2. Sensitivity Analyses: ACM and Heart Failure Deaths
Model results of random effects Poisson regressions are presented in Appendix Table A4. Data fit of regression models was measured in the correlation between observed and fitted data, which was satisfactory (greater than 0.7) in the young- and middle-age strata and poorer in the oldest age group (correlation below 0.5). Further, the variation in the dependent variable (% of ACM deaths) was lowest in the oldest age group, most pronounced among females.
In post-hoc analyses, we examined characteristics of countries where the proportion of CVD deaths assigned with HF garbage codes was lower than 5%. A low share of HF garbage code deaths has been identified in 226 out of 823 country-years (27%) and has been associated with higher age-standardized estimated and registered mortality rates for CVD, all cardiomyopathies and ACM, as well as a lower population size (p < 0.001 for females and males, obtained from Poisson regressions). Further, a low share of HF garbage code deaths was linked to higher alcohol exposure among males (p < 0.001 from linear regression) but not among females (p = 0.019 from linear regression).
Table A6.
Results of regression models on % ACM deaths among all CVD deaths by age and sex.
| 15- to 49-Years-Old | 50- to 64-Years-Old | 65 Years or Older | ||||
|---|---|---|---|---|---|---|
| Women | Men | Women | Men | Women | Men | |
| Fixed effects (standard error) | ||||||
| Intercept | 1.11 (0.38) * | 3.43 (0.22) ** | -0.03 (0.54) | 3.03 (0.2) ** | −1.81 (0.48) ** | 1.24 (0.26) ** |
| First order polynomial of % HF garbage code deaths | 7.87 (0.48) ** | 8.09 (0.27) ** | 8.19 (0.53) ** | 9.05 (0.21) ** | 6.94 (1.08) ** | 9.39 (0.31) ** |
| Second order polynomial of % HF garbage code deaths 1 | / | 1.96 (0.2) ** | 4.01 (0.41) ** | 2.06 (0.15) ** | 2.75 (1.26) | 2.49 (0.27) ** |
| Third order polynomial of % HF garbage code deaths 1 | / | −3.3 (0.21) ** | −3.03 (0.4) ** | −3.92 (0.13) ** | −4.63 (0.71) ** | −2.21 (0.19) ** |
| Alcohol per capita consumption | 0.02 (0.01) | 0.02 (0.002) ** | −0.02 (0.01) | 0.01 (0.002) ** | −0.04 (0.02) | −0.01 (0.003) ** |
| Random effects | ||||||
| Standard deviation of country-level intercepts | 3.07 | 1.88 | 3.73 | 1.72 | 3.29 | 2.23 |
| R-square 2 | 0.772 | 0.815 | 0.868 | 0.732 | 0.333 | 0.475 |
| Mean (standard deviation) of dependent variable | 0.7% (2.1%) | 1.5% (2.9%) | 0.3% (0.7%) | 0.8% (1.2%) | 0.02% (0.06%) | 0.1% (0.2%) |
Note: All results from Poisson regressions (outcome multiplied by 10,000 and rounded to nearest integer) with random intercepts for each country. All models based on n = 77 countries (823 country-years) with available mortality data from civil registries. ACM = alcoholic cardiomyopathy. CVD = Cardiovascular disease. HF = Heart failure. 1 The variable was centered around the sex- and age-specific mean. 2 R-square = square of the correlation coefficient between the actual and fitted values of the dependent variable. * p ≤ 0.01; ** p ≤ 0.001
References
- Rehm, J.; Roerecke, M. Cardiovascular effects of alcohol consumption. Trends Cardiovasc. Med. 2017, 27, 534–538. [Google Scholar] [CrossRef] [PubMed]
- O’Keefe, E.L.; DiNicolantonio, J.J.; O’Keefe, J.H.; Lavie, C.J. Alcohol and CV Health: Jekyll and Hyde J-Curves. Prog. Cardiovasc. Dis. 2018, 61, 68–75. [Google Scholar] [CrossRef] [PubMed] [Green Version]
- Mirijello, A.; Tarli, C.; Vassallo, G.A.; Sestito, L.; Antonelli, M.; d’Angelo, C.; Ferrulli, A.; De Cosmo, S.; Gasbarrini, A.; Addolorato, G. Alcoholic cardiomyopathy: What is known and what is not known. Eur. J. Intern. Med. 2017, 43, 1–5. [Google Scholar] [CrossRef] [PubMed]
- Weintraub, R.G.; Semsarian, C.; Macdonald, P. Dilated cardiomyopathy. Lancet 2017, 390, 400–414. [Google Scholar] [CrossRef]
- Guzzo-Merello, G.; Cobo-Marcos, M.; Gallego-Delgado, M.; Garcia-Pavia, P. Alcoholic cardiomyopathy. World J. Cardiol. 2014, 6, 771–781. [Google Scholar] [CrossRef] [PubMed]
- Piano, M.R.; Phillips, S.A. Alcoholic cardiomyopathy: Pathophysiologic insights. Cardiovasc. Toxicol. 2014, 14, 291–308. [Google Scholar] [CrossRef] [PubMed]
- Rehm, J.; Hasan, O.; Imtiaz, S.; Neufeld, M. Quantifying the contribution of alcohol to cardiomyopathy: A systematic review. Alcohol 2017, 61, 9–15. [Google Scholar] [CrossRef]
- Manthey, J.; Imtiaz, S.; Neufeld, M.; Rylett, M.; Rehm, J. Quantifying the global contribution of alcohol consumption to cardiomyopathy. Popul. Health Metr. 2017, 15. [Google Scholar] [CrossRef]
- Mikkelsen, L.; Phillips, D.E.; AbouZahr, C.; Setel, P.W.; de Savigny, D.; Lozano, R.; Lopez, A.D. A global assessment of civil registration and vital statistics systems: Monitoring data quality and progress. Lancet 2015, 386, 1395–1406. [Google Scholar] [CrossRef]
- Manthey, J.; Probst, C.; Rylett, M.; Rehm, J. National, regional and global mortality due to alcoholic cardiomyopathy in 2015. Heart 2018, 104, 1663–1669. [Google Scholar] [CrossRef] [Green Version]
- Institute for Health Metrics and Evaluation. GBD Results Tool; University of Washington: Seattle, WA, USA, 2018. [Google Scholar]
- Roth, G.A.; Abate, D.; Abate, K.H.; Abay, S.M.; Abbafati, C.; Abbasi, N.; Abbastabar, H.; Abd-Allah, F.; Abdela, J.; Abdelalim, A.; et al. Global, regional, and national age-sex-specific mortality for 282 causes of death in 195 countries and territories, 1980–2017: A systematic analysis for the Global Burden of Disease Study 2017. Lancet 2018, 392, 1736–1788. [Google Scholar] [CrossRef]
- Naghavi, M.; Makela, S.; Foreman, K.; O’Brien, J.; Pourmalek, F.; Lozano, R. Algorithms for enhancing public health utility of national causes-of-death data. Popul. Health Metr. 2010, 8, 9. [Google Scholar] [CrossRef] [PubMed]
- Murray, C.J.L.; Lopez, A.D.; World Health Organization; World Bank; Harvard School of Public Health. The Global Burden of Disease: A Comprehensive Assessment of Mortality and Disability from Diseases, Injuries, and Risk Factors in 1990 and Projected to 2020; Harvard School of Public Health on behalf of the World Health Organization and the World Bank: Cambridge, UK, 1996. [Google Scholar]
- World Health Organization. The ICD-10 Classification of Mental and Behavioural Disorders: Diagnostic Criteria for Research; World Health Organization: Geneva, Switzerland, 1993. [Google Scholar]
- Snyder, M.L.; Love, S.-A.; Sorlie, P.D.; Rosamond, W.D.; Antini, C.; Metcalf, P.A.; Hardy, S.; Suchindran, C.M.; Shahar, E.; Heiss, G. Redistribution of heart failure as the cause of death: The Atherosclerosis Risk in Communities Study. Popul. Health Metr. 2014, 12, 10. [Google Scholar] [CrossRef] [PubMed]
- Wan, X.; Yang, G.H. Is the Mortality Trend of Ischemic Heart Disease by the GBD2013 Study in China Real? Biomed. Environ. Sci. 2017, 30, 204–209. [Google Scholar] [CrossRef] [PubMed]
- World Health Organisation. WHO Mortality Database; World Health Organisation: Geneva, Switzerland, 2018. [Google Scholar]
- Institute for Health Metrics and Evaluation. Global Burden of Disease Study 2017 (GBD 2017) Causes of Death and Nonfatal Causes Mapped to ICD Codes; Institute for Health Metrics and Evaluation: Washington, DC, USA, 2018. [Google Scholar]
- Population Division of the Department of Economic and Social Affairs of the United Nations Secretariat. World Population Prospects: The 2017 Revision, Key Findings and Advance Tables; Population Division of the Department of Economic and Social Affairs of the United Nations Secretariat: New York, NY, USA, 2017. [Google Scholar]
- Manthey, J.; Shield, K.D.; Rylett, M.; Hasan, O.S.M.; Probst, C.; Rehm, J. Alcohol exposure between 1990 and 2017 and forecasts until 2030: A global modeling study. Lancet 2019, 393, 2493–2502. [Google Scholar] [CrossRef]
- Bozkurt, B.; Colvin, M.; Cook, J.; Cooper, L.T.; Deswal, A.; Fonarow, G.C.; Francis, G.S.; Lenihan, D.; Lewis, E.F.; McNamara, D.M.; et al. Current Diagnostic and Treatment Strategies for Specific Dilated Cardiomyopathies: A Scientific Statement From the American Heart Association. Circulation 2016, 134, e579–e646. [Google Scholar] [CrossRef] [PubMed]
- Ahern, R.M.; Lozano, R.; Naghavi, M.; Foreman, K.; Gakidou, E.; Murray, C.J. Improving the public health utility of global cardiovascular mortality data: The rise of ischemic heart disease. Popul. Health Metr. 2011, 9, 8. [Google Scholar] [CrossRef] [PubMed]
- Team, R.C. R: A Language and Environment for Statistical Computing, 3.5.1; R Foundation for Statistical Computing: Vienna, Austria, 2018. [Google Scholar]
- Ram, P.; Lo, K.B.; Shah, M.; Patel, B.; Rangaswami, J.; Figueredo, V.M. National trends in hospitalizations and outcomes in patients with alcoholic cardiomyopathy. Clin. Cardiol. 2018, 41, 1423–1429. [Google Scholar] [CrossRef]
- World Health Organization. Global Status Report on Alcohol and Health 2018; WHO Press: Geneva, Switzerland, 2018. [Google Scholar]
- Rehm, J.; Gmel, G.E., Sr.; Gmel, G.; Hasan, O.S.; Imtiaz, S.; Popova, S.; Probst, C.; Roerecke, M.; Room, R.; Samokhvalov, A.V.; et al. The relationship between different dimensions of alcohol use and the burden of disease-an update. Addiction 2017, 112, 968–1001. [Google Scholar] [CrossRef]
- Guzzo-Merello, G.; Segovia, J.; Dominguez, F.; Cobo-Marcos, M.; Gomez-Bueno, M.; Avellana, P.; Millan, I.; Alonso-Pulpon, L.; Garcia-Pavia, P. Natural history and prognostic factors in alcoholic cardiomyopathy. JACC Heart Fail 2015, 3, 78–86. [Google Scholar] [CrossRef]
- Fauchier, L.; Babuty, D.; Poret, P.; Casset-Senon, D.; Autret, M.L.; Cosnay, P.; Fauchier, J.P. Comparison of long-term outcome of alcoholic and idiopathic dilated cardiomyopathy. Eur. Heart J. 2000, 21, 306–314. [Google Scholar] [CrossRef] [PubMed] [Green Version]
- Lazarević, A.M.; Nakatani, S.; Nešković, A.N.; Marinković, J.; Yasumura, Y.; Stojičić, D.; Miyatake, K.; Bojić, M.; Popović, A.D. Early changes in left ventricular function in chronic asymptomatic alcoholics: Relation to the duration of heavy drinking. J. Am. Coll. Cardiol. 2000, 35, 1599–1606. [Google Scholar] [CrossRef]
- Prazak, P.; Pfisterer, M.; Osswald, S.; Buser, P.; Burkart, F. Differences of disease progression in congestive heart failure due to alcoholic as compared to idiopathic dilated cardiomyopathy. Eur. Heart J. 1996, 17, 251–257. [Google Scholar] [CrossRef] [PubMed] [Green Version]
- Regan, T.J.; Levinson, G.E.; Oldewurtel, H.A.; Frank, M.J.; Weisse, A.B.; Moschos, C.B. Ventricular function in noncardiacs with alcoholic fatty liver: Role of ethanol in the production of cardiomyopathy. J. Clin. Investig. 1969, 48, 397–407. [Google Scholar] [CrossRef]
- Cerqueira, M.D.; Harp, G.D.; Ritchie, J.L.; Stratton, J.R.; Walker, R.D. Rarity of preclinical alcoholic cardiomyopathy in chronic alcoholics <40 years of age. Am. J. Cardiol. 1991, 67, 183–187. [Google Scholar] [CrossRef] [PubMed]
- Chapman, C.; Slade, T.; Hunt, C.; Teesson, M. Delay to first treatment contact for alcohol use disorder. Drug Alcohol Depend. 2015, 147, 116–121. [Google Scholar] [CrossRef]
- Foreman, K.J.; Naghavi, M.; Ezzati, M. Improving the usefulness of US mortality data: New methods for reclassification of underlying cause of death. Popul. Health Metr. 2016, 14, 14. [Google Scholar] [CrossRef] [PubMed]
- Schomerus, G.; Lucht, M.; Holzinger, A.; Matschinger, H.; Carta, M.G.; Angermeyer, M.C. The stigma of alcohol dependence compared with other mental disorders: A review of population studies. Alcohol Alcohol. 2011, 46, 105–112. [Google Scholar] [CrossRef] [PubMed]
- Hanschmidt, F.; Manthey, J.; Kraus, L.; Scafato, E.; Gual, A.; Grimm, C.; Rehm, J. Barriers to Alcohol Screening Among Hypertensive Patients and the Role of Stigma: Lessons for the Implementation of Screening and Brief Interventions in European Primary Care Settings. Alcohol Alcohol. 2017, 52, 572–579. [Google Scholar] [CrossRef] [PubMed]
- Griswold, M.; Gakidou, E. Alcohol and the global burden of disease—Authors’ reply. Lancet 2019, 393, 2391–2392. [Google Scholar] [CrossRef]
- Abat, C.; Roussel, Y.; Chaudet, H.; Raoult, D. Alcohol and the global burden of disease. Lancet 2019, 393, 2390–2391. [Google Scholar] [CrossRef] [Green Version]
- Shield, K.D.; Rehm, J. Alcohol and the global burden of disease. Lancet 2019, 393, 2390–2391. [Google Scholar] [CrossRef]
- Furtwaengler, N.A.; de Visser, R.O. Lack of international consensus in low-risk drinking guidelines. Drug Alcohol Rev. 2013, 32, 11–18. [Google Scholar] [CrossRef] [PubMed]
- Pollock, D.A.; Boyle, C.A.; DeStefano, F.; Moyer, L.A.; Kirk, M.L. Underreporting of Alcohol-Related Mortality on Death Certificates of Young US Army Veterans. JAMA 1987, 258, 345–348. [Google Scholar] [CrossRef] [PubMed]
- Gmel, G.; Rehm, J. Measuring alcohol consumption. Contempor. Drug Probl. 2004, 31, 467–540. [Google Scholar] [CrossRef]
- Poznyak, V.; Fleischmann, A.; Rekve, D.; Rylett, M.; Rehm, J.; Gmel, G. The World Health Organization’s Global Monitoring System on Alcohol and Health. Alcohol Res. Curr. Rev. 2013, 35, 244–249. [Google Scholar]
Figure 1.
Mortality rates of registered (orange) and estimated (blue) deaths over the life span by cause of death definition (rows) and sex (columns); based on most recent available mortality data from n = 77 countries.
Figure 1.
Mortality rates of registered (orange) and estimated (blue) deaths over the life span by cause of death definition (rows) and sex (columns); based on most recent available mortality data from n = 77 countries.
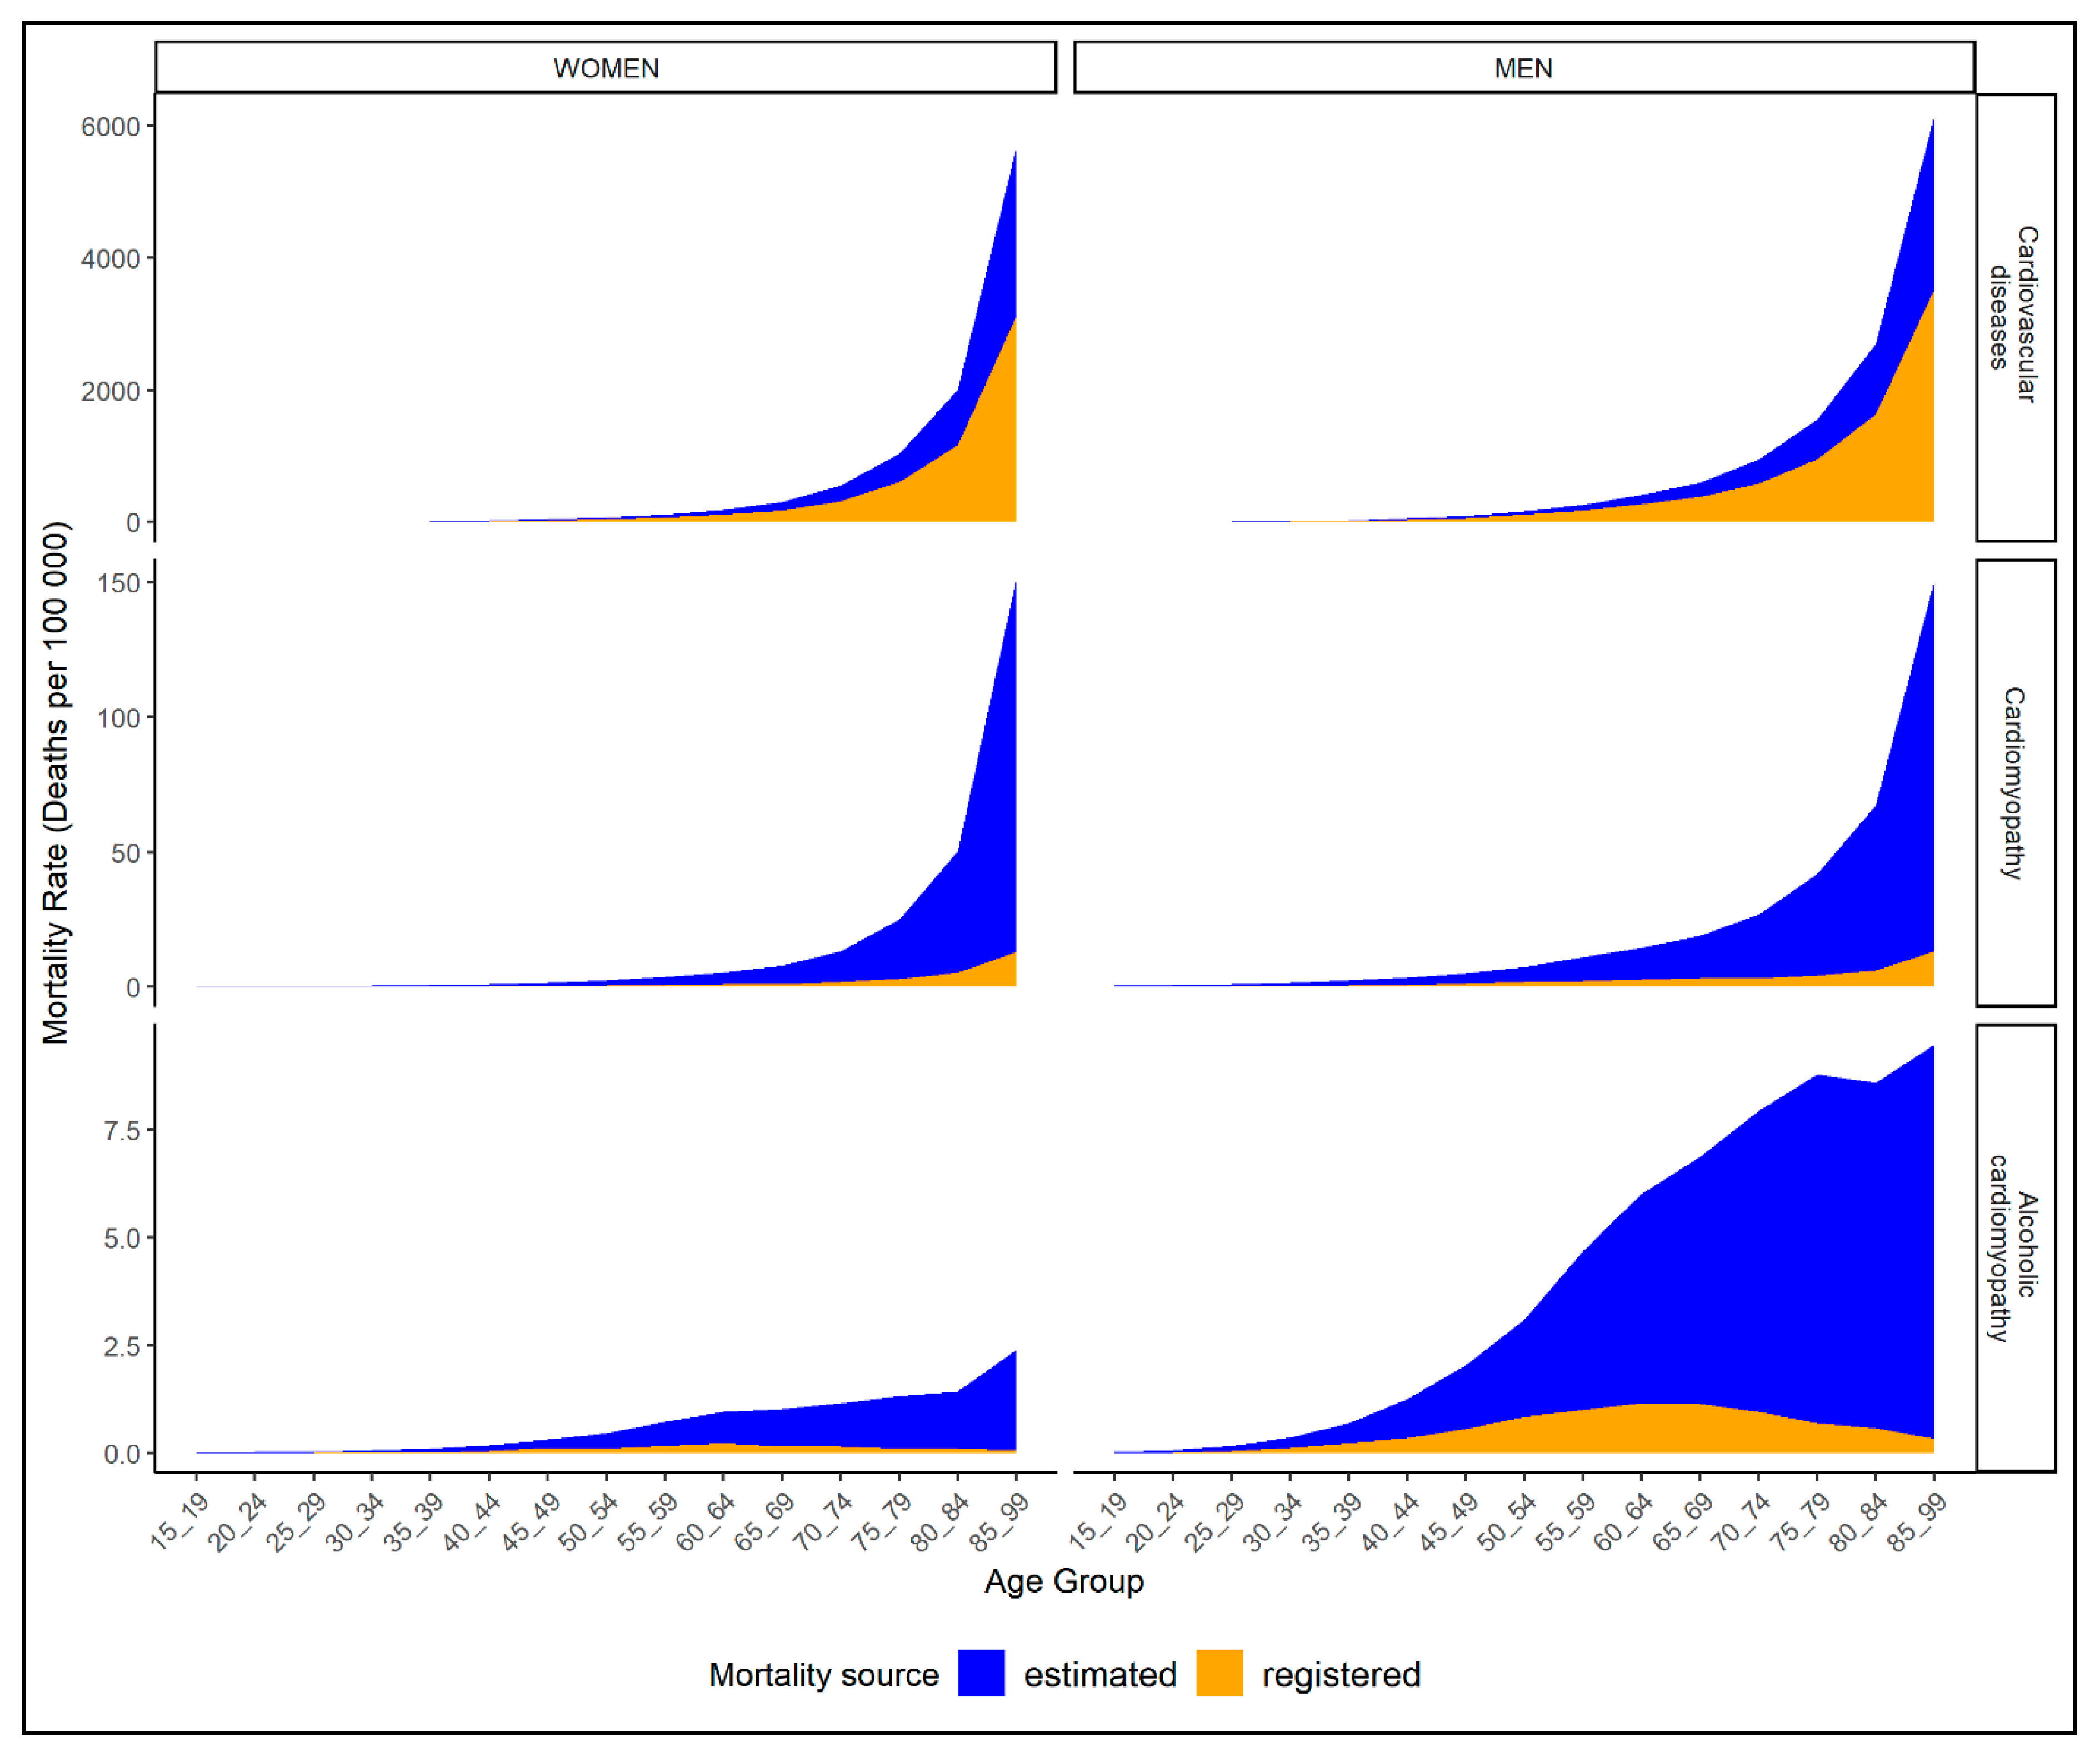
Figure 2.
Estimated (red) and registered (blue) ACM mortality rates per 100,000 and alcohol per capita consumption (APC) over selected age groups and by sex (column) for most recent available data of n = 77 countries; solid line denotes same-year APC (first row) and dashed line denotes 5-year (second row) and 10-year lagged APC (third row).

Figure 3.
Scatter plots of proportion of heart failure garbage code deaths and proportion of ACM deaths among all CVD deaths by sex (column) and age group (row); orange line denotes the smoothing function of fitted proportion of ACM deaths among all CVD deaths obtained from multi-level models.
Figure 3.
Scatter plots of proportion of heart failure garbage code deaths and proportion of ACM deaths among all CVD deaths by sex (column) and age group (row); orange line denotes the smoothing function of fitted proportion of ACM deaths among all CVD deaths obtained from multi-level models.
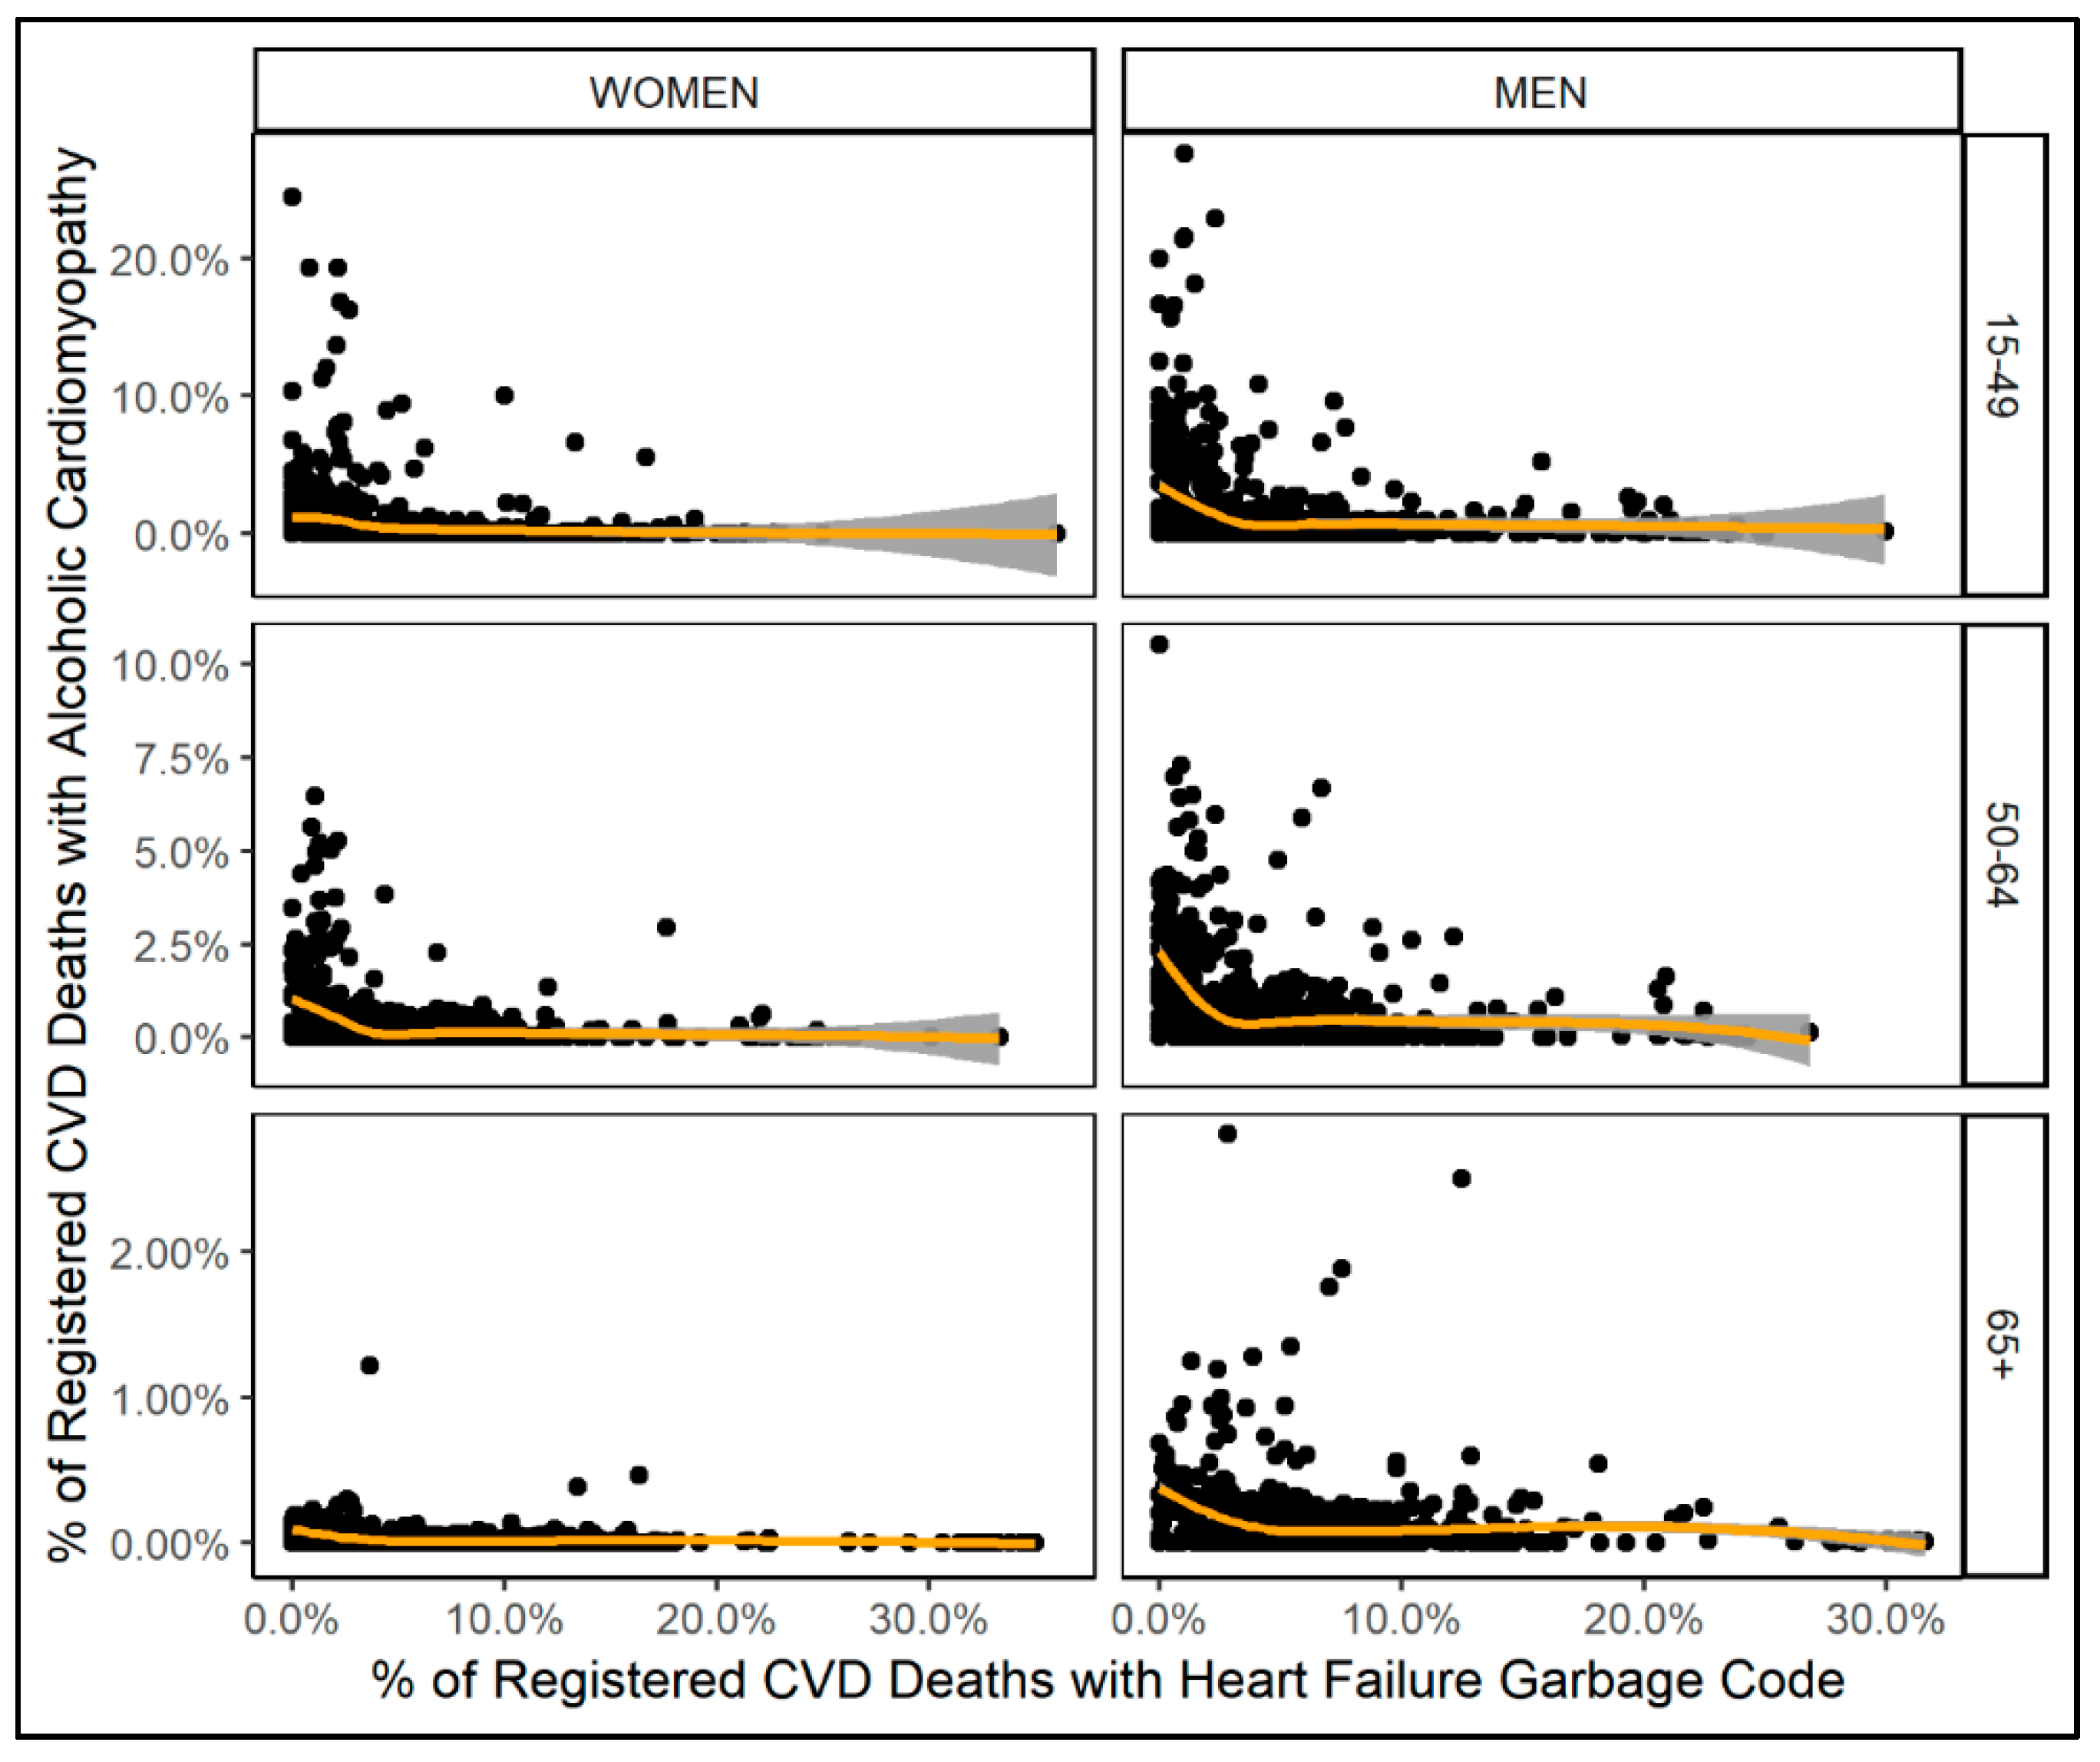
Table 1.
Registered and estimated deaths by disease category and sex.
| GBD Disease Definition | Absolute Number of Deaths | Age-Standardized Mortality Rate 1 | ||||
|---|---|---|---|---|---|---|
| Women | Men | Both sexes | Women | Men | Both sexes | |
| Cardiovascular diseases | ||||||
| Registered 2 | 1,396,965 | 1,469,004 | 2,865,969 | 89.1 | 148.3 | 116.1 |
| Estimated 2 | 2,459,266 | 2,386,248 | 4,845,514 | 154.9 | 239.3 | 193.6 |
| Ratio 3 | 1.8 | 1.6 | 1.7 | 1.7 | 1.6 | 1.7 |
| Cardiomyopathy and myocarditis | ||||||
| Registered 2 | 8,240 | 11,938 | 20,178 | 0.6 | 1.4 | 1.0 |
| Estimated 2 | 66,730 | 75,616 | 142,346 | 4.4 | 8.0 | 6.1 |
| Ratio 3 | 8.1 | 6.3 | 7.1 | 6.8 | 5.9 | 6.2 |
| Alcoholic Cardiomyopathy | ||||||
| Registered 2 | 538 | 3,345 | 3,883 | 0.1 | 0.4 | 0.2 |
| Estimated 2 | 3,589 | 18,894 | 22,483 | 0.3 | 2.1 | 1.2 |
| Ratio 3 | 6.7 | 5.6 | 5.8 | 5.8 | 5.4 | 5.3 |
| Cardiovascular garbage codes | ||||||
| Registered 2 | 963,461 | 780,529 | 1,743,990 | 58.4 | 77.1 | 67.2 |
| Estimated 2 | / | / | / | / | / | / |
| Ratio 3 | / | / | / | / | / | / |
| Heart failure garbage codes | ||||||
| Registered 2 | 283,222 | 209,033 | 492,255 | 15.8 | 20.0 | 17.8 |
| Estimated 2 | / | / | / | / | / | / |
| Ratio 3 | / | / | / | / | / | / |
Note: Based on n = 77 countries, see Supplementary Table S1 for a detailed list of the included countries. 1 Age-standardized number of deaths per 100,000 adults. 2 All deaths obtained from in civil registries [18] or as estimated in the GBD 2017 study [11]. 3 Ratio of estimated to registered deaths.
Table 2.
Correlation of registered and estimated ACM crude mortality rates (deaths per 100,000 people) for all adults and by sex and age groups.
Table 2.
Correlation of registered and estimated ACM crude mortality rates (deaths per 100,000 people) for all adults and by sex and age groups.
| Women | Men | |
|---|---|---|
| All Adults | 0.796 (0.697 to 0.866) ** | 0.917 (0.872 to 0.946) ** |
| By age group | ||
| 15–19 | NA | NA |
| 20–24 | NA | 0.968 (0.95 to 0.979) ** |
| 25–29 | 0.212 (−0.012 to 0.416) | 0.985 (0.977 to 0.991) ** |
| 30–34 | 0.42 (0.217 to 0.589) ** | 0.988 (0.981 to 0.992) ** |
| 35–39 | 0.731 (0.607 to 0.821) ** | 0.956 (0.932 to 0.972) ** |
| 40–44 | 0.779 (0.672 to 0.854) ** | 0.963 (0.942 to 0.976) ** |
| 45–49 | 0.955 (0.93 to 0.971) ** | 0.941 (0.908 to 0.962) ** |
| 50–54 | 0.956 (0.932 to 0.972) ** | 0.764 (0.652 to 0.844) ** |
| 55–59 | 0.815 (0.723 to 0.879) ** | 0.777 (0.67 to 0.853) ** |
| 60–64 | 0.899 (0.845 to 0.935) ** | 0.901 (0.848 to 0.936) ** |
| 65–69 | 0.305 (0.087 to 0.495) * | 0.545 (0.366 to 0.685) ** |
| 70–74 | 0.513 (0.326 to 0.661) ** | 0.73 (0.605 to 0.82) ** |
| 75–79 | 0.184 (−0.042 to 0.391) | 0.618 (0.458 to 0.74) ** |
| 80–84 | 0.099 (−0.127 to 0.316) | 0.158 (−0.069 to 0.369) |
| 85–99 | 0.025 (−0.2 to 0.247) | 0.136 (−0.091 to 0.349) |
Note: Based on most recent available data from n = 77 countries, see Supplementary Table S1 for a detailed list of the included countries; * p < 0.01; ** p < 0.001; NA = correlations could not be calculated due to zero registered deaths.
© 2019 by the authors. Licensee MDPI, Basel, Switzerland. This article is an open access article distributed under the terms and conditions of the Creative Commons Attribution (CC BY) license (http://creativecommons.org/licenses/by/4.0/).
Share and Cite
MDPI and ACS Style
Manthey, J.; Rehm, J. Mortality from Alcoholic Cardiomyopathy: Exploring the Gap between Estimated and Civil Registry Data. J. Clin. Med. 2019, 8, 1137. https://doi.org/10.3390/jcm8081137
AMA Style
Manthey J, Rehm J. Mortality from Alcoholic Cardiomyopathy: Exploring the Gap between Estimated and Civil Registry Data. Journal of Clinical Medicine. 2019; 8(8):1137. https://doi.org/10.3390/jcm8081137
Chicago/Turabian StyleManthey, Jakob, and Jürgen Rehm. 2019. "Mortality from Alcoholic Cardiomyopathy: Exploring the Gap between Estimated and Civil Registry Data" Journal of Clinical Medicine 8, no. 8: 1137. https://doi.org/10.3390/jcm8081137
Note that from the first issue of 2016, this journal uses article numbers instead of page numbers. See further details here.