Combination of Plasma Biomarkers and Clinical Data for the Detection of Myocardial Fibrosis or Aggravation of Heart Failure Symptoms in Heart Failure with Preserved Ejection Fraction Patients


Abstract
:1. Introduction
2. Materials and Methods
2.1. Study Participants and Study Design
2.2. Measurement of Plasma Fibrosis and Inflammation Biomarkers
2.3. Echocardiography
2.4. Magnetic Resonance Imaging Acquisition
2.5. Magnetic Resonance Imaging Analysis
2.6. Statistical Analysis
3. Results
3.1. Baseline Characteristics and Echocardiographic Characteristics of Patients
3.2. Plasma Levels of Biomarkers in Patients with Diastolic Dysfunction
3.3. Factors (Biomarkers) Associated with Cardiac Fibrosis and Aggravated Heart Failure
4. Discussion
4.1. Major Findings
4.2. Study Limitations
Author Contributions
Funding
Conflicts of Interest
References
- Gaasch, W.H.; Zile, M.R. Left ventricular diastolic dysfunction and diastolic heart failure. Annu. Rev. Med. 2004, 55, 373–394. [Google Scholar] [CrossRef] [PubMed]
- Vasan, R.S.; Larson, M.G.; Benjamin, E.J.; Evans, J.C.; Reiss, C.K.; Levy, D. Congestive heart failure in subjects with normal versus reduced left ventricular ejection fraction: Prevalence and mortality in a population-based cohort. J. Am. Coll. Cardiol. 1999, 33, 1948–1955. [Google Scholar] [CrossRef]
- Angeja, B.G.; Grossman, W. Evaluation and management of diastolic heart failure. Circulation 2003, 107, 659–663. [Google Scholar] [CrossRef] [PubMed]
- Udelson, J.E. Heart failure with preserved ejection fraction. Circulation 2011, 124, 540–543. [Google Scholar] [CrossRef] [PubMed]
- Zile, M.R.; Desantis, S.M.; Baicu, C.F.; Stroud, R.E.; Thompson, S.B.; McClure, C.D.; Mehurg, S.M.; Spinale, F.G. Plasma biomarkers that reflect determinants of matrix composition identify the presence of left ventricular hypertrophy and diastolic heart failure. Circ. Heart Fail. 2011, 4, 246–256. [Google Scholar] [CrossRef] [PubMed]
- Barasch, E.; Gottdiener, J.S.; Aurigemma, G.; Kitzman, D.W.; Han, J.; Kop, W.J.; Tracy, R.P. Association between elevated fibrosis markers and heart failure in the elderly: The cardiovascular health study. Circ. Heart Fail. 2009, 2, 303–310. [Google Scholar] [CrossRef] [PubMed]
- Cypen, J.; Ahmad, T.; Testani, J.M.; DeVore, A.D. Novel Biomarkers for the Risk Stratification of Heart Failure with Preserved Ejection Fraction. Curr. Heart Fail. Rep. 2017, 14, 434–443. [Google Scholar] [CrossRef] [PubMed]
- D’Elia, E.; Vaduganathan, M.; Gori, M.; Gavazzi, A.; Butler, J.; Senni, M. Role of biomarkers in cardiac structure phenotyping in heart failure with preserved ejection fraction: Critical appraisal and practical use. Eur J. Heart Fail. 2015, 17, 1231–1239. [Google Scholar] [CrossRef] [PubMed]
- Mascherbauer, J.; Marzluf, B.A.; Tufaro, C.; Pfaffenberger, S.; Graf, A.; Wexberg, P.; Panzenbock, A.; Jakowitsch, J.; Bangert, C.; Laimer, D.; et al. Cardiac magnetic resonance postcontrast T1 time is associated with outcome in patients with heart failure and preserved ejection fraction. Circ. Cardiovasc. Imaging 2013, 6, 1056–1065. [Google Scholar] [CrossRef] [PubMed]
- Lee, J.J.; Liu, S.; Nacif, M.S.; Ugander, M.; Han, J.; Kawel, N.; Sibley, C.T.; Kellman, P.; Arai, A.E.; Bluemke, D.A. Myocardial T1 and extracellular volume fraction mapping at 3 tesla. J. Cardiovasc. Magn. Reson. 2011, 13, 75. [Google Scholar] [CrossRef] [PubMed] [Green Version]
- Su, M.Y.; Lin, L.Y.; Tseng, Y.H.; Chang, C.C.; Wu, C.K.; Lin, J.L.; Tseng, W.Y. CMR-verified diffuse myocardial fibrosis is associated with diastolic dysfunction in HFpEF. JACC Cardiovasc. Imaging 2014, 7, 991–997. [Google Scholar] [CrossRef] [PubMed]
- Paulus, W.J.; Tschope, C.; Sanderson, J.E.; Rusconi, C.; Flachskampf, F.A.; Rademakers, F.E.; Marino, P.; Smiseth, O.A.; De Keulenaer, G.; Leite-Moreira, A.F.; et al. How to diagnose diastolic heart failure: A consensus statement on the diagnosis of heart failure with normal left ventricular ejection fraction by the Heart Failure and Echocardiography Associations of the European Society of Cardiology. Eur. Heart J. 2007, 28, 2539–2550. [Google Scholar] [CrossRef] [PubMed]
- Wu, C.K.; Lee, J.K.; Chiang, F.T.; Yang, C.H.; Huang, S.W.; Hwang, J.J.; Lin, J.L.; Tseng, C.D.; Chen, J.J.; Tsai, C.T. Plasma levels of tumor necrosis factor-alpha and interleukin-6 are associated with diastolic heart failure through downregulation of sarcoplasmic reticulum Ca2+ ATPase. Crit. Care Med. 2011, 39, 984–992. [Google Scholar] [CrossRef] [PubMed]
- Wu, C.K.; Tsai, C.T.; Chang, Y.C.; Luo, J.L.; Wang, Y.C.; Hwang, J.J.; Lin, J.L.; Tseng, C.D.; Chiang, F.T. Genetic polymorphisms of the angiotensin II type 1 receptor gene and diastolic heart failure. J. Hypertens. 2009, 27, 502–507. [Google Scholar] [CrossRef] [PubMed]
- Kellman, P.; Arai, A.E.; McVeigh, E.R.; Aletras, A.H. Phase-sensitive inversion recovery for detecting myocardial infarction using gadolinium-delayed hyperenhancement. Magn. Reson. Med. 2002, 47, 372–383. [Google Scholar] [CrossRef] [PubMed] [Green Version]
- Wong, T.C.; Piehler, K.; Meier, C.G.; Testa, S.M.; Klock, A.M.; Aneizi, A.A.; Shakesprere, J.; Kellman, P.; Shroff, S.G.; Schwartzman, D.S.; et al. Association between extracellular matrix expansion quantified by cardiovascular magnetic resonance and short-term mortality. Circulation 2012, 126, 1206–1216. [Google Scholar] [CrossRef] [PubMed]
- Tseng, W.Y.; Liao, T.Y.; Wang, J.L. Normal systolic and diastolic functions of the left ventricle and left atrium by cine magnetic resonance imaging. J. Cardiovasc. Magn. Reson. 2002, 4, 443–457. [Google Scholar] [CrossRef] [PubMed]
- Ugander, M.; Oki, A.J.; Hsu, L.Y.; Kellman, P.; Greiser, A.; Aletras, A.H.; Sibley, C.T.; Chen, M.Y.; Bandettini, W.P.; Arai, A.E. Extracellular volume imaging by magnetic resonance imaging provides insights into overt and sub-clinical myocardial pathology. Eur. Heart J. 2012, 33, 1268–1278. [Google Scholar] [CrossRef] [PubMed] [Green Version]
- Booth, J.; Pinney, J.; Davenport, A. N-terminal proBNP—marker of cardiac dysfunction, fluid overload, or malnutrition in hemodialysis patients? Clin. J. Am. Soc. Nephrol. 2010, 5, 1036–1040. [Google Scholar] [CrossRef] [PubMed]
- Maeder, M.T.; Kaye, D.M. Heart failure with normal left ventricular ejection fraction. J. Am. Coll. Cardiol. 2009, 53, 905–918. [Google Scholar] [CrossRef] [PubMed]
- Tschope, C.; Kasner, M.; Westermann, D.; Gaub, R.; Poller, W.C.; Schultheiss, H.P. The role of NT-proBNP in the diagnostics of isolated diastolic dysfunction: Correlation with echocardiographic and invasive measurements. Eur. Heart J. 2005, 26, 2277–2284. [Google Scholar] [CrossRef] [PubMed]
- Lim, T.K.; Ashrafian, H.; Dwivedi, G.; Collinson, P.O.; Senior, R. Increased left atrial volume index is an independent predictor of raised serum natriuretic peptide in patients with suspected heart failure but normal left ventricular ejection fraction: Implication for diagnosis of diastolic heart failure. Eur. J. Heart Fail. 2006, 8, 38–45. [Google Scholar] [CrossRef] [PubMed]
- Iwanaga, Y.; Nishi, I.; Furuichi, S.; Noguchi, T.; Sase, K.; Kihara, Y.; Goto, Y.; Nonogi, H. B-type natriuretic peptide strongly reflects diastolic wall stress in patients with chronic heart failure: Comparison between systolic and diastolic heart failure. J. Am. Coll. Cardiol. 2006, 47, 742–748. [Google Scholar] [CrossRef] [PubMed]
- Zile, M.R.; Baicu, C.F. Biomarkers of diastolic dysfunction and myocardial fibrosis: Application to heart failure with a preserved ejection fraction. J. Cardiovasc. Transl. Res. 2013, 6, 501–515. [Google Scholar] [CrossRef] [PubMed]
- O’Meara, E.; de Denus, S.; Rouleau, J.L.; Desai, A. Circulating biomarkers in patients with heart failure and preserved ejection fraction. Curr. Heart Fail. Rep. 2013, 10, 350–358. [Google Scholar] [CrossRef] [PubMed]
- Yang, R.Y.; Rabinovich, G.A.; Liu, F.T. Galectins: Structure, function and therapeutic potential. Expert Rev. Mol. Med. 2008, 10, e17. [Google Scholar] [CrossRef] [PubMed]
- Wu, C.K.; Su, M.Y.; Lee, J.K.; Chiang, F.T.; Hwang, J.J.; Lin, J.L.; Chen, J.J.; Liu, F.T.; Tsai, C.T. Galectin-3 level and the severity of cardiac diastolic dysfunction using cellular and animal models and clinical indices. Sci. Rep. 2015, 5, 17007. [Google Scholar] [CrossRef] [PubMed] [Green Version]
- Jugdutt, B.I. Ventricular remodeling after infarction and the extracellular collagen matrix: When is enough enough? Circulation 2003, 108, 1395–1403. [Google Scholar] [CrossRef] [PubMed]
- Martos, R.; Baugh, J.; Ledwidge, M.; O’Loughlin, C.; Conlon, C.; Patle, A.; Donnelly, S.C.; McDonald, K. Diastolic heart failure: Evidence of increased myocardial collagen turnover linked to diastolic dysfunction. Circulation 2007, 115, 888–895. [Google Scholar] [CrossRef] [PubMed]
- van Veldhuisen, D.J.; Linssen, G.C.; Jaarsma, T.; van Gilst, W.H.; Hoes, A.W.; Tijssen, J.G.; Paulus, W.J.; Voors, A.A.; Hillege, H.L. B-type natriuretic peptide and prognosis in heart failure patients with preserved and reduced ejection fraction. J. Am. Coll. Cardiol. 2013, 61, 1498–1506. [Google Scholar] [CrossRef] [PubMed]
- Lund, L.H.; Donal, E.; Oger, E.; Hage, C.; Persson, H.; Haugen-Lofman, I.; Ennezat, P.V.; Sportouch-Dukhan, C.; Drouet, E.; Daubert, J.C.; et al. Association between cardiovascular vs. non-cardiovascular co-morbidities and outcomes in heart failure with preserved ejection fraction. Eur. J. Heart Fail. 2014, 16, 992–1001. [Google Scholar] [PubMed] [Green Version]
- de Boer, R.A.; Lok, D.J.; Jaarsma, T.; van der Meer, P.; Voors, A.A.; Hillege, H.L.; van Veldhuisen, D.J. Predictive value of plasma galectin-3 levels in heart failure with reduced and preserved ejection fraction. Ann. Med. 2011, 43, 60–68. [Google Scholar] [CrossRef] [PubMed]
- Zile, M.R.; Jhund, P.S.; Baicu, C.F.; Claggett, B.L.; Pieske, B.; Voors, A.A.; Prescott, M.F.; Shi, V.; Lefkowitz, M.; McMurray, J.J.; et al. Plasma Biomarkers Reflecting Profibrotic Processes in Heart Failure with a Preserved Ejection Fraction: Data from the Prospective Comparison of ARNI with ARB on Management of Heart Failure with Preserved Ejection Fraction Study. Circ. Heart Fail. 2016, 9, e002551. [Google Scholar] [CrossRef] [PubMed]
- Cheng, J.M.; Akkerhuis, K.M.; Battes, L.C.; van Vark, L.C.; Hillege, H.L.; Paulus, W.J.; Boersma, E.; Kardys, I. Biomarkers of heart failure with normal ejection fraction: A systematic review. Eur. J. Heart Fail. 2013, 15, 1350–1362. [Google Scholar] [CrossRef] [PubMed]
- Kasner, M.; Westermann, D.; Lopez, B.; Gaub, R.; Escher, F.; Kuhl, U.; Schultheiss, H.P.; Tschope, C. Diastolic tissue Doppler indexes correlate with the degree of collagen expression and cross-linking in heart failure and normal ejection fraction. J. Am. Coll. Cardiol. 2011, 57, 977–985. [Google Scholar] [CrossRef] [PubMed]
- Westermann, D.; Lindner, D.; Kasner, M.; Zietsch, C.; Savvatis, K.; Escher, F.; von Schlippenbach, J.; Skurk, C.; Steendijk, P.; Riad, A.; et al. Cardiac inflammation contributes to changes in the extracellular matrix in patients with heart failure and normal ejection fraction. Circ. Heart Fail. 2011, 4, 44–52. [Google Scholar] [CrossRef] [PubMed]
- Calderone, A.; Thaik, C.M.; Takahashi, N.; Chang, D.L.; Colucci, W.S. Nitric oxide, atrial natriuretic peptide, and cyclic GMP inhibit the growth-promoting effects of norepinephrine in cardiac myocytes and fibroblasts. J. Clin. Investg. 1998, 101, 812–818. [Google Scholar] [CrossRef] [PubMed]
- Paulus, W.J.; Tschope, C. A novel paradigm for heart failure with preserved ejection fraction: Comorbidities drive myocardial dysfunction and remodeling through coronary microvascular endothelial inflammation. J. Am. Coll. Cardiol. 2013, 62, 263–271. [Google Scholar] [CrossRef] [PubMed]
- Jhund, P.S.; Claggett, B.L.; Voors, A.A.; Zile, M.R.; Packer, M.; Pieske, B.M.; Kraigher-Krainer, E.; Shah, A.M.; Prescott, M.F.; Shi, V.; et al. Elevation in high-sensitivity troponin T in heart failure and preserved ejection fraction and influence of treatment with the angiotensin receptor neprilysin inhibitor LCZ696. Circ. Heart Fail. 2014, 7, 953–959. [Google Scholar] [CrossRef] [PubMed]
- Seliger, S.L.; de Lemos, J.; Neeland, I.J.; Christenson, R.; Gottdiener, J.; Drazner, M.H.; Berry, J.; Sorkin, J.; deFilippi, C. Older Adults, “Malignant” Left Ventricular Hypertrophy, and Associated Cardiac-Specific Biomarker Phenotypes to Identify the Differential Risk of New-Onset Reduced versus Preserved Ejection Fraction Heart Failure: CHS (Cardiovascular Health Study). JACC Heart Fail. 2015, 3, 445–455. [Google Scholar] [CrossRef] [PubMed]

| ECV < 28% (n = 39) | ECV ≥ 28% (n = 38) | p-Value | |
|---|---|---|---|
| DM (%) | 12.8 | 44.7 | 0.002 * |
| Baseline | |||
| Age (mean ± SD) | 67.2 ± 10.4 | 68.4 ± 12.6 | 0.632 |
| Sex, M (%) | 51.3 | 36.8 | 0.202 |
| Risk factors | |||
| HTN (%) | 84.6 | 78.9 | 0.519 |
| Dyslipidemia (%) | 48.7 | 42.1 | 0.560 |
| Comorbidities | |||
| CAD (%) PCI (%) CABG (%) | 41.0 41.0 0.0 | 36.8 36.8 5.3 | 0.707 0.707 0.240 |
| Stroke | 2.6 | 5.3 | 0.615 |
| PAD (%) | 5.1 | 2.6 | 0.552 |
| Previous MI (%) | 7.7 | 5.3 | 1.000 |
| CKD (%) | 2.6 | 7.9 | 0.358 |
| eGFR, mL/min/1.73 m2 (mean ± SD) | 78.39 ± 18.76 | 70.21 ± 17.96 | 0.054 |
| Aggravation of HF (%) | 28.2 | 52.6 | 0.029 * |
| Medications | |||
| Anti-platelet (%) | 28.2 | 36.8 | 0.418 |
| ACEI (%) | 0.0 | 2.6 | 0.494 |
| ARB (%) | 53.8 | 52.6 | 0.915 |
| MRI parameters | |||
| LVEDVi, mL/m2 (mean ± SD) | 48.43 ± 12.15 | 51.37 ± 10.70 | 0.265 |
| LVESVi, mL/m2 (mean ± SD) | 10.25 ± 5.16 | 11.25 ± 6.15 | 0.444 |
| LVMi, g/m2 (mean ± SD) | 59.76 ± 11.71 | 61.63 ± 13.86 | 0.525 |
| LVEF, % (mean ± SD) | 78.54 ± 7.11 | 77.80 ± 9.01 | 0.723 |
| Inflammatory markers ** | |||
| TNF-α, pg/mL | 1.98 (1.65–2.51) | 1.80 (1.58–2.16) | 0.300 |
| IL-1β, pg/mL | 0.44 (0.34–0.62) | 0.34 (0.22–0.47) | 0.108 |
| IL-6, pg/mL | 1.68 (1.12–2.39) | 1.51 (1.16–3.34) | 0.756 |
| CRP, ug/mL | 1.31 (0.77–2.45) | 1.27 (0.79–3.64) | 0.395 |
| GDF15, pg/mL | 847.40 (625.50–1301.30) | 1297.50 (697.85–2543.90) | 0.018 * |
| OPN, ng/mL | 106.37 (83.39–124.51) | 101.90 (84.62–130.91) | 0.965 |
| Remodeling markers ** | |||
| TIMP1, ng/mL | 112.94 (98.75–123.96) | 124.58 (96.21–163.48) | 0.081 |
| TIMP2, ng/mL | 130.00 (108.90–147.60) | 144.90 (85.85–183.33) | 0.190 |
| MMP-2, ng/mL | 147.96 (131.61–184.50) | 188.68 (149.79–254.82) | 0.020 |
| MMP-9, ng/mL | 178.40 (116.00–294.30) | 159.95 (88.38–449.0) | 0.815 |
| PIP, ng/mL | 202.02 (158.64–236.55) | 202.86 (162.05–300.74) | 0.492 |
| Galectin-3, ng/mL | 6.81 (5.59–8.67) | 9.92 (7.70–15.41) | <0.001 * |
| CTGF, ng/mL | 0.11 (0.00–1.97) | 0.07 (0.00–13.81) | 0.704 |
| Endothelial function ** | |||
| Endothelin-1, pg/mL | 0.96 (0.80–1.24) | 1.15 (0.88–1.34) | 0.203 |
| Heart failure markers ** | |||
| NT-proBNP, pg/mL | 850.0 (439.5–1335.0) | 153.00 (739.0–3150.0) | 0.021 * |
| ST2, ng/mL | 8.79 (6.71–13.52) | 8.96 (7.17–12.95) | 0.951 |
| OR | 95% CI | p-Value | |
|---|---|---|---|
| ECV a | |||
| DM | 10.732 | 1.542–74.696 | 0.017 |
| MMP-2 | 1.053 | 1.016–1.091 | 0.005 * |
| Galectin-3 | 2.105 | 1.352–3.277 | 0.001 * |
| Endothelin-1 | 16.207 | 0.961–273.333 | 0.053 |
| Heart failure b | |||
| TIMP2 | 1.025 | 1.001–1.050 | 0.044 * |
| NT-proBNP | 1.010 | 1.003–1.017 | 0.004 * |
| Cut Point | OR (95% CI) | Beta Coefficient | Score | AUC (95% CI) | |
|---|---|---|---|---|---|
| DM | Yes | 7.808 (1.654–36.854) | 2.055 | 2 | 0.660 (0.536–0.783) |
| MMP-2 | ≥164.75 ng/mL | 5.654 (1.321–24.128) | 1.731 | 2 | 0.636 (0.511–0.761) |
| Galectin | ≥8.32 ng/mL | 4.413 (1.141–17.075) | 1.485 | 1 | 0.662 (0.540–0.785) |
| Endothelin-1 | ≥1.02 pg/mL | 5.681 (1.389–23.238) | 1.737 | 2 | 0.617 (0.474–0.760) |
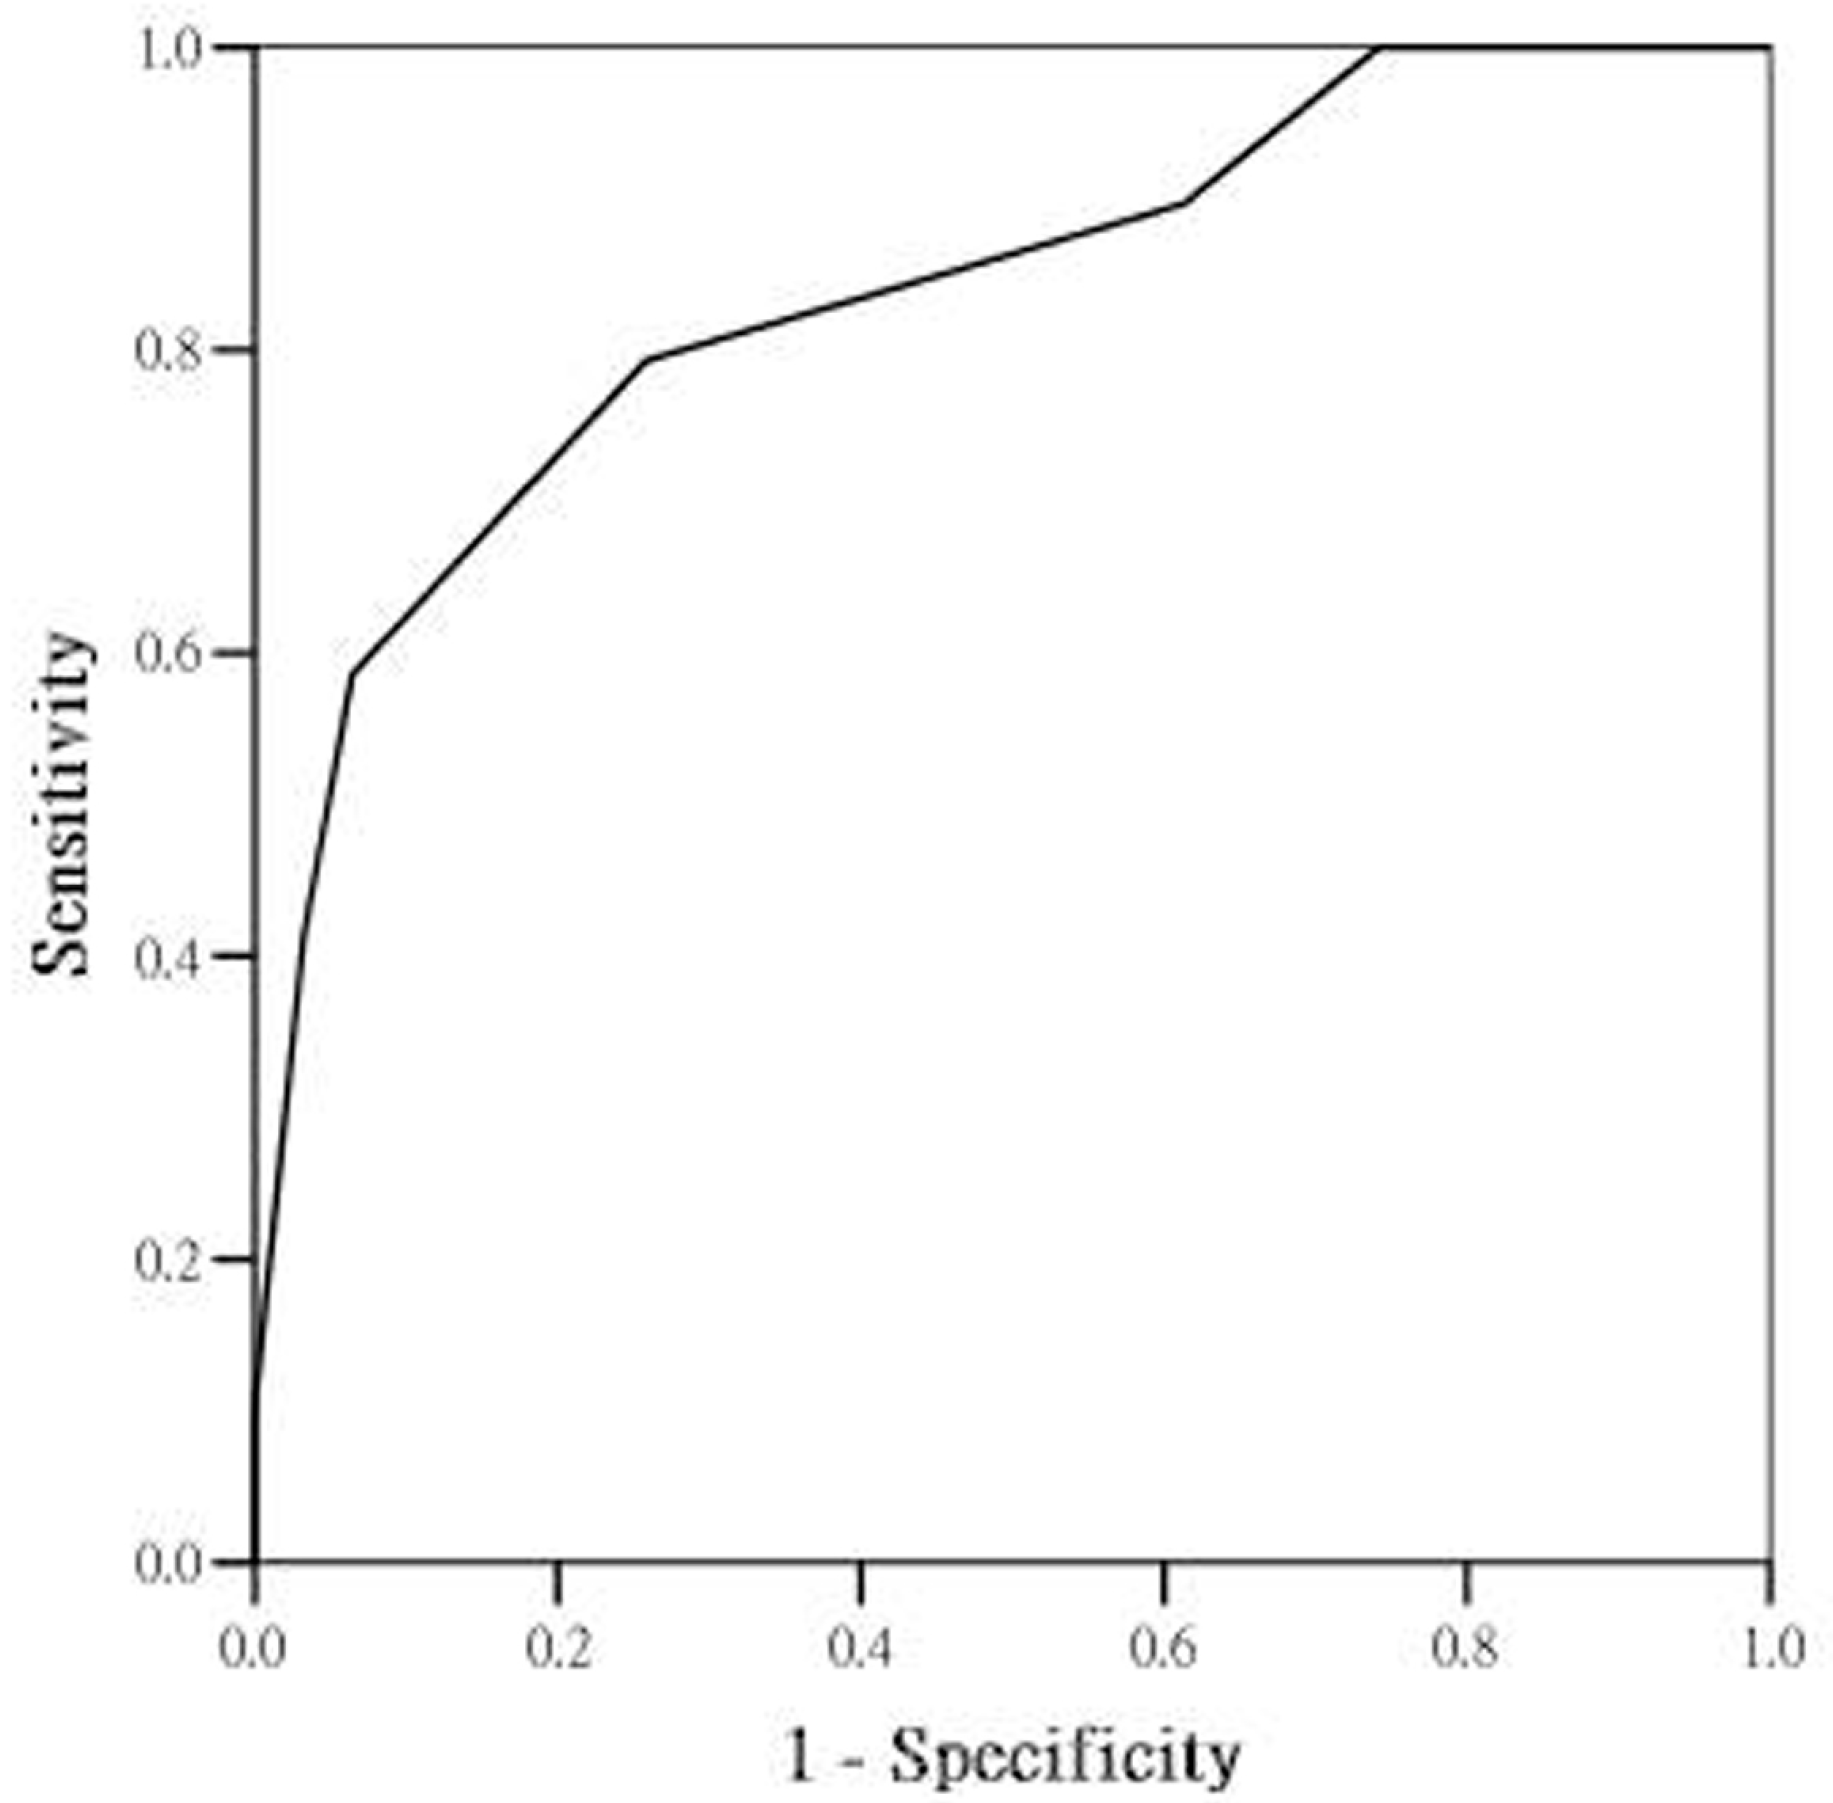
| Combine | 0–7 | 0.838 (0.737–0.939) |
© 2018 by the authors. Licensee MDPI, Basel, Switzerland. This article is an open access article distributed under the terms and conditions of the Creative Commons Attribution (CC BY) license (http://creativecommons.org/licenses/by/4.0/).
Share and Cite
Wu, C.-K.; Su, M.-Y.M.; Wu, Y.-F.; Hwang, J.-J.; Lin, L.-Y. Combination of Plasma Biomarkers and Clinical Data for the Detection of Myocardial Fibrosis or Aggravation of Heart Failure Symptoms in Heart Failure with Preserved Ejection Fraction Patients. J. Clin. Med. 2018, 7, 427. https://doi.org/10.3390/jcm7110427
Wu C-K, Su M-YM, Wu Y-F, Hwang J-J, Lin L-Y. Combination of Plasma Biomarkers and Clinical Data for the Detection of Myocardial Fibrosis or Aggravation of Heart Failure Symptoms in Heart Failure with Preserved Ejection Fraction Patients. Journal of Clinical Medicine. 2018; 7(11):427. https://doi.org/10.3390/jcm7110427
Chicago/Turabian StyleWu, Cho-Kai, Mao-Yuan M. Su, Yi-Fan Wu, Juey-Jen Hwang, and Lian-Yu Lin. 2018. "Combination of Plasma Biomarkers and Clinical Data for the Detection of Myocardial Fibrosis or Aggravation of Heart Failure Symptoms in Heart Failure with Preserved Ejection Fraction Patients" Journal of Clinical Medicine 7, no. 11: 427. https://doi.org/10.3390/jcm7110427