
Systematic Review with Meta-Analyses: Diagnostic Accuracy of FibroMeter Tests in Patients with Non-Alcoholic Fatty Liver Disease

 , , , ,
Abstract
:1. Introduction
2. Materials and Methods
2.1. Search Strategy and Screening
2.2. Inclusion and Exclusion Criteria
2.3. Data Extraction and Quality Assessment
2.4. Statistical Analyses
2.5. Additional Analyses
2.6. Meta-Regression Analysis
3. Results
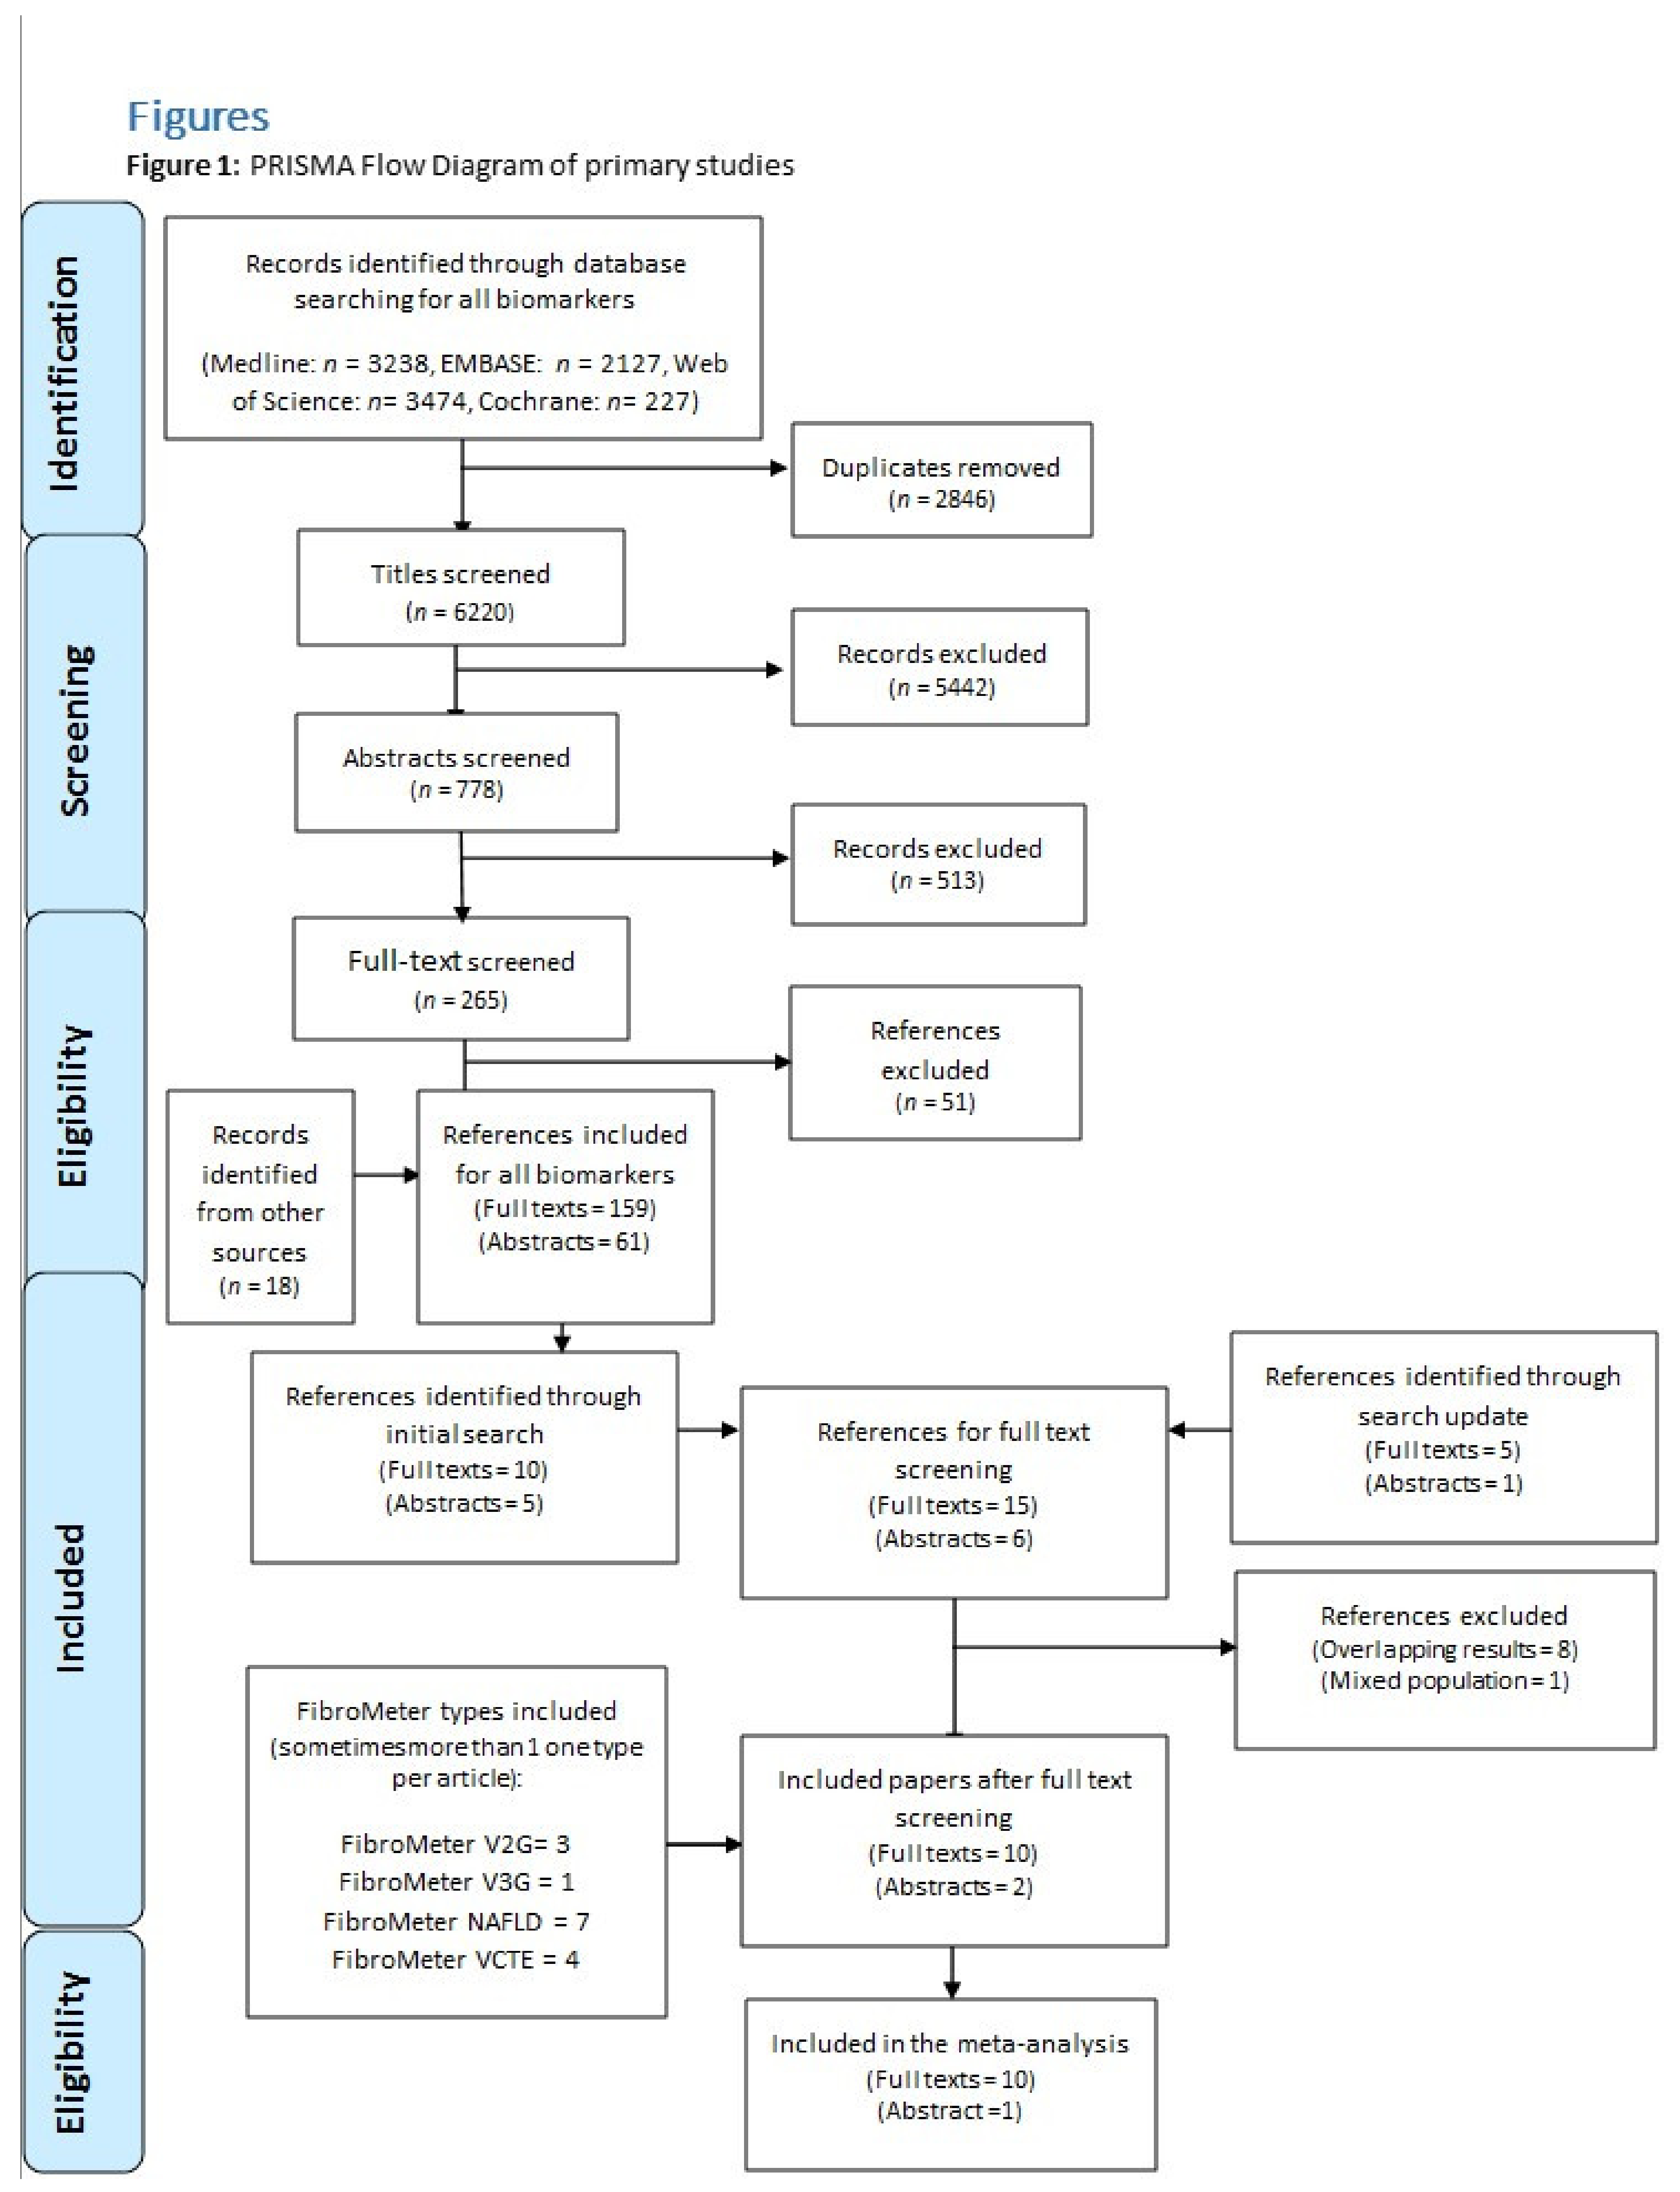
3.1. Search Results
3.2. Study Characteristics
3.3. Target Population
3.4. Target Conditions
3.5. Characteristics of Liver Biopsy
3.6. Methodological Quality Assessment
3.7. Accuracy of FibroMeter in Detecting Significant Fibrosis (F ≥ 2)
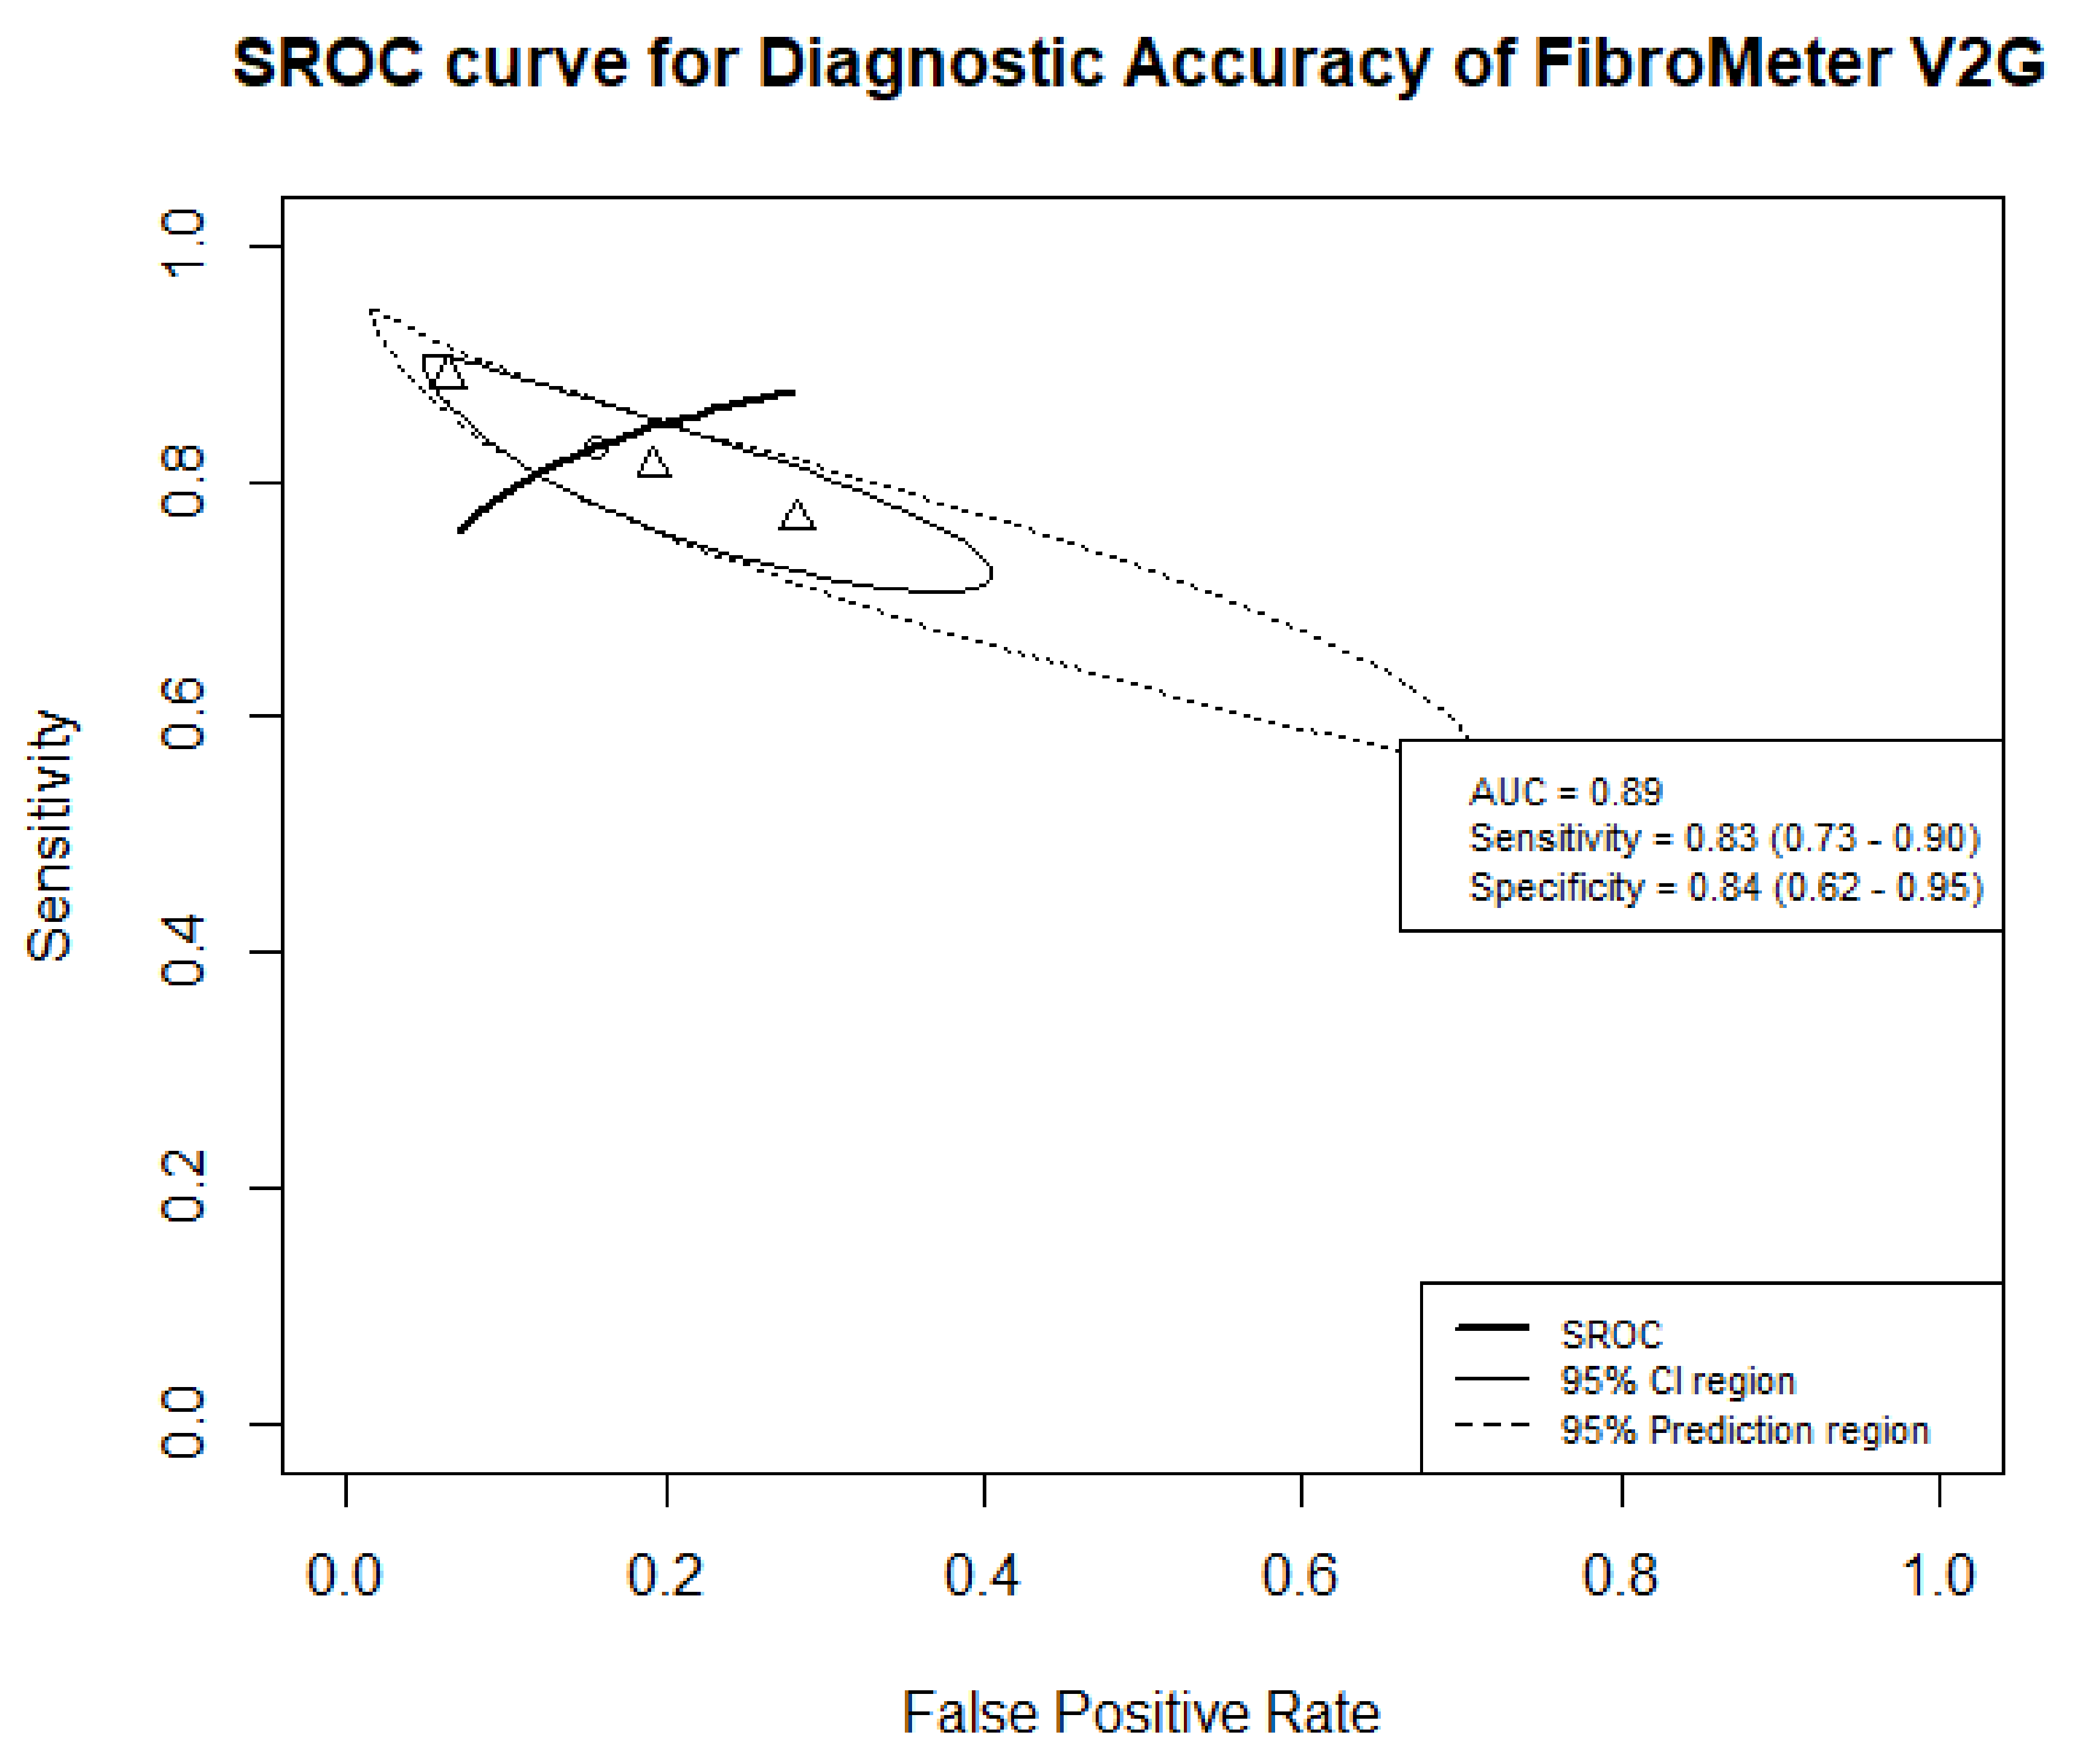
3.7.1. FibroMeter V2G
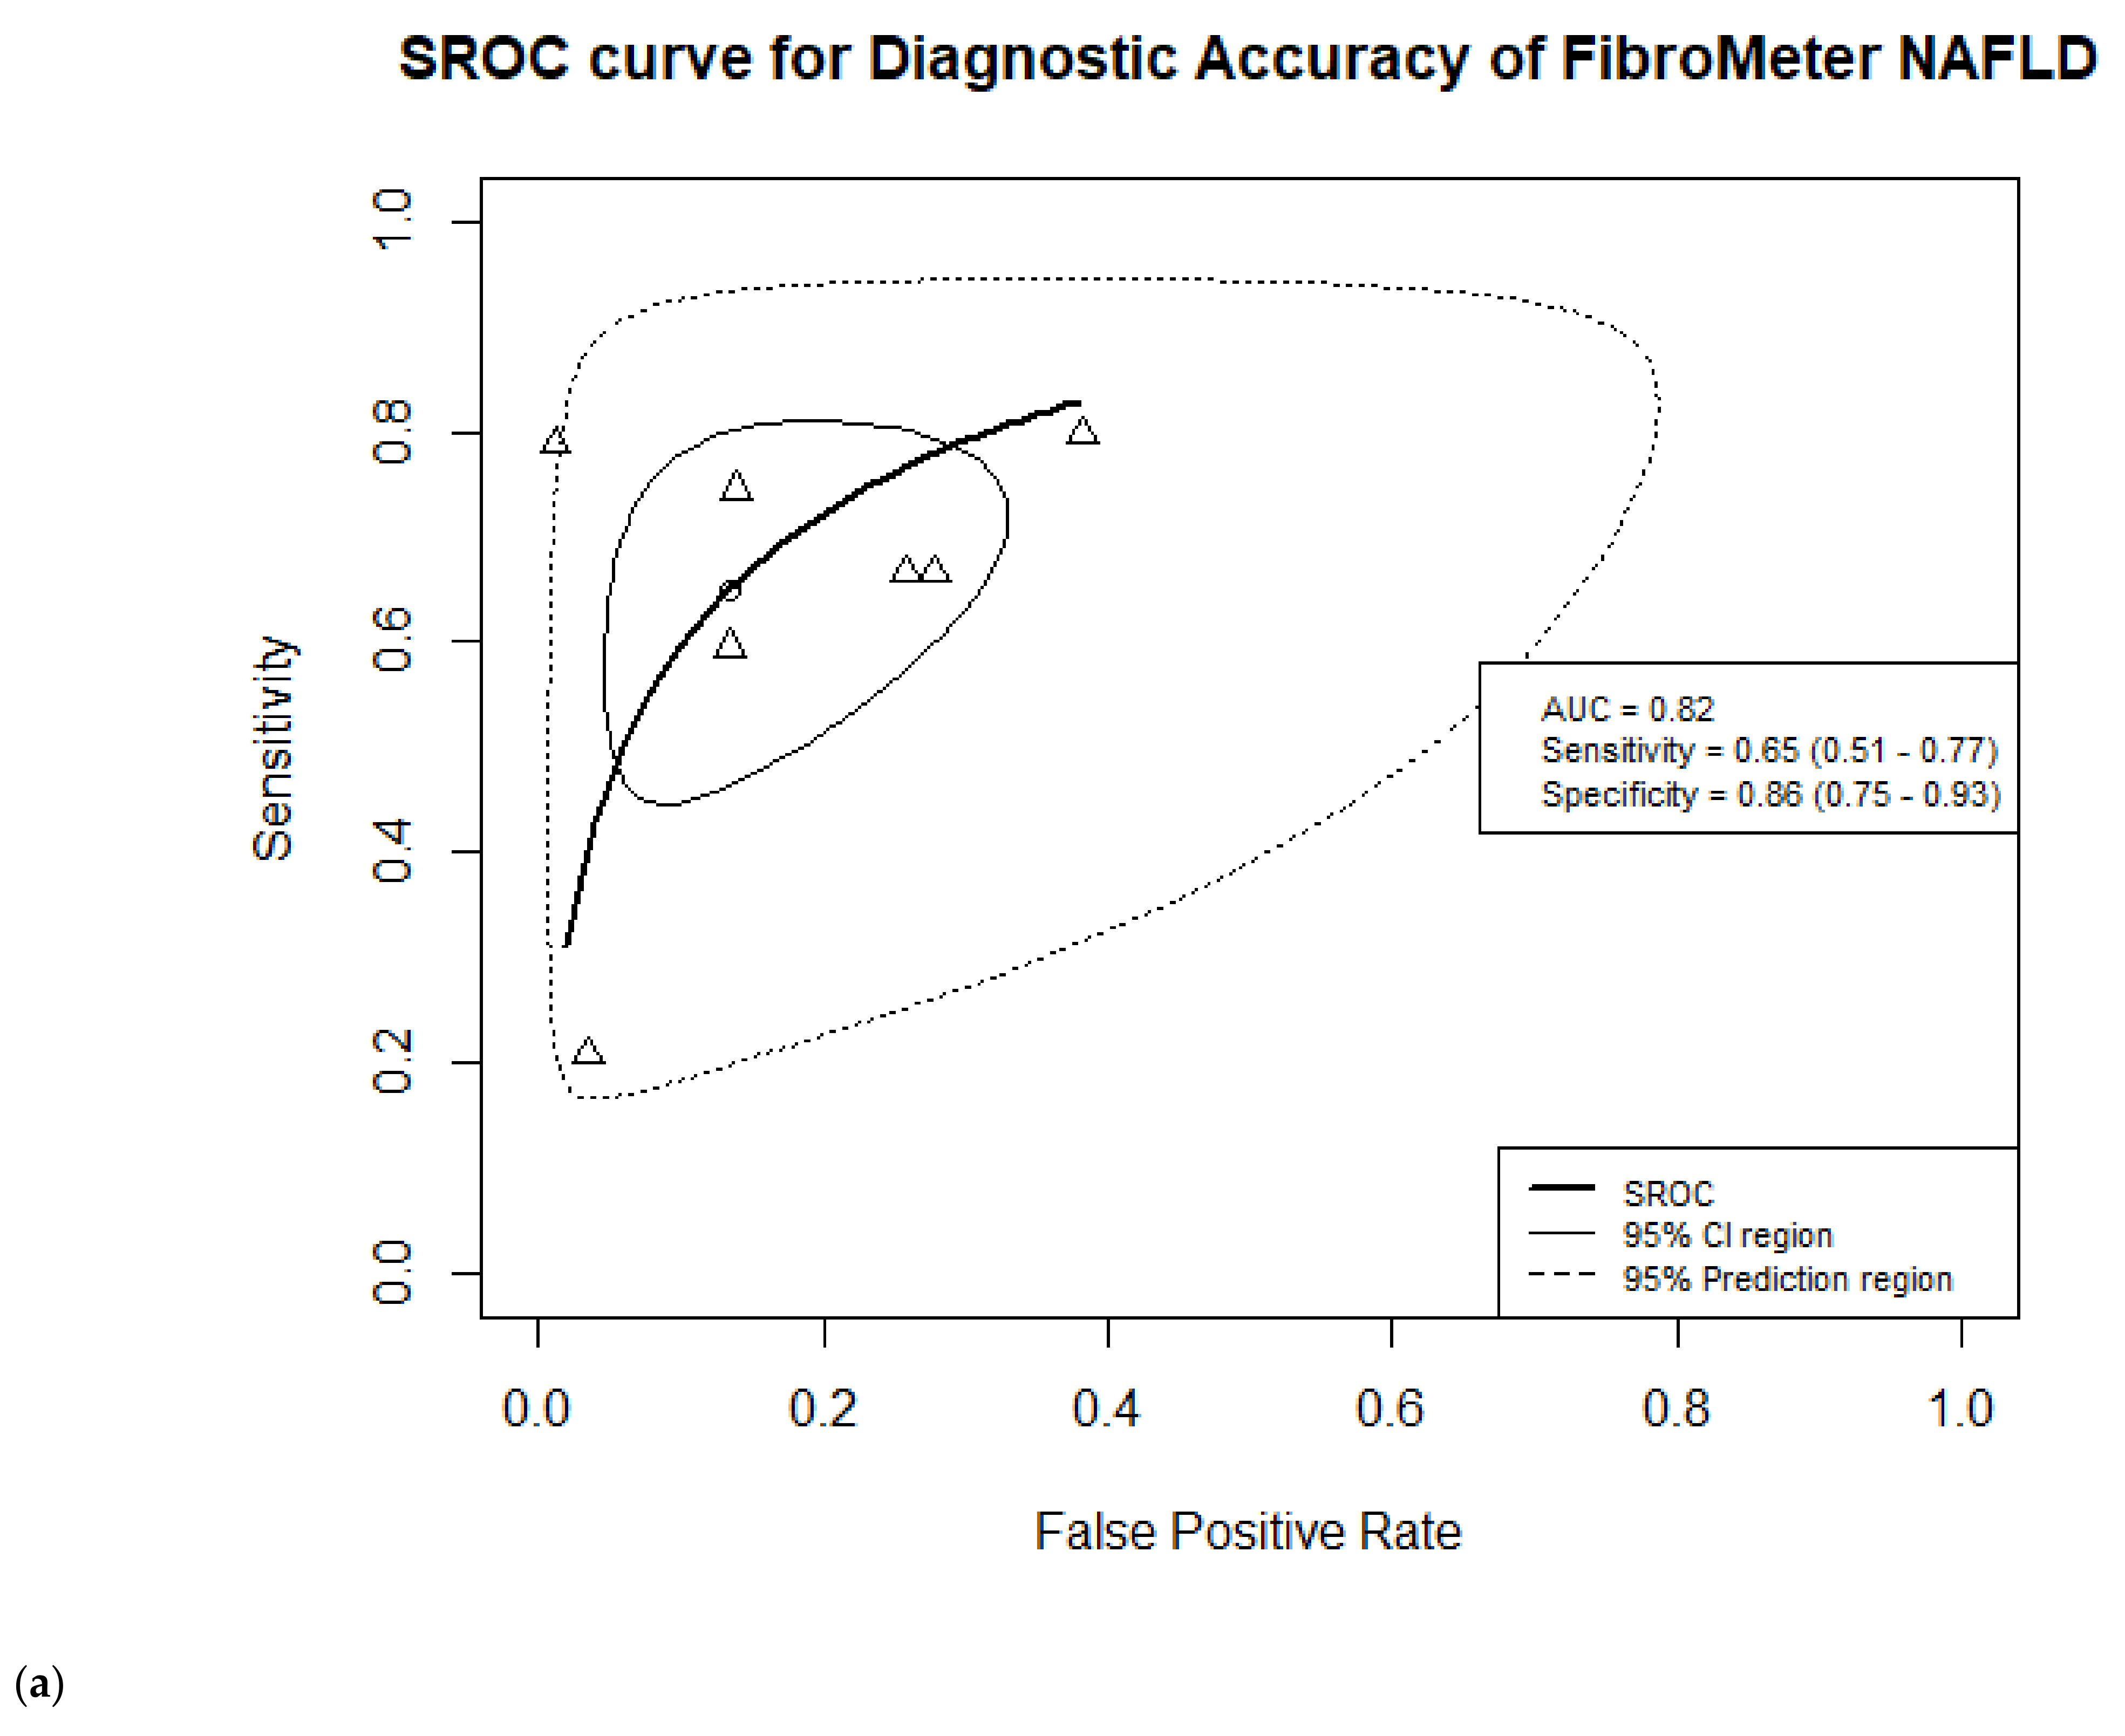
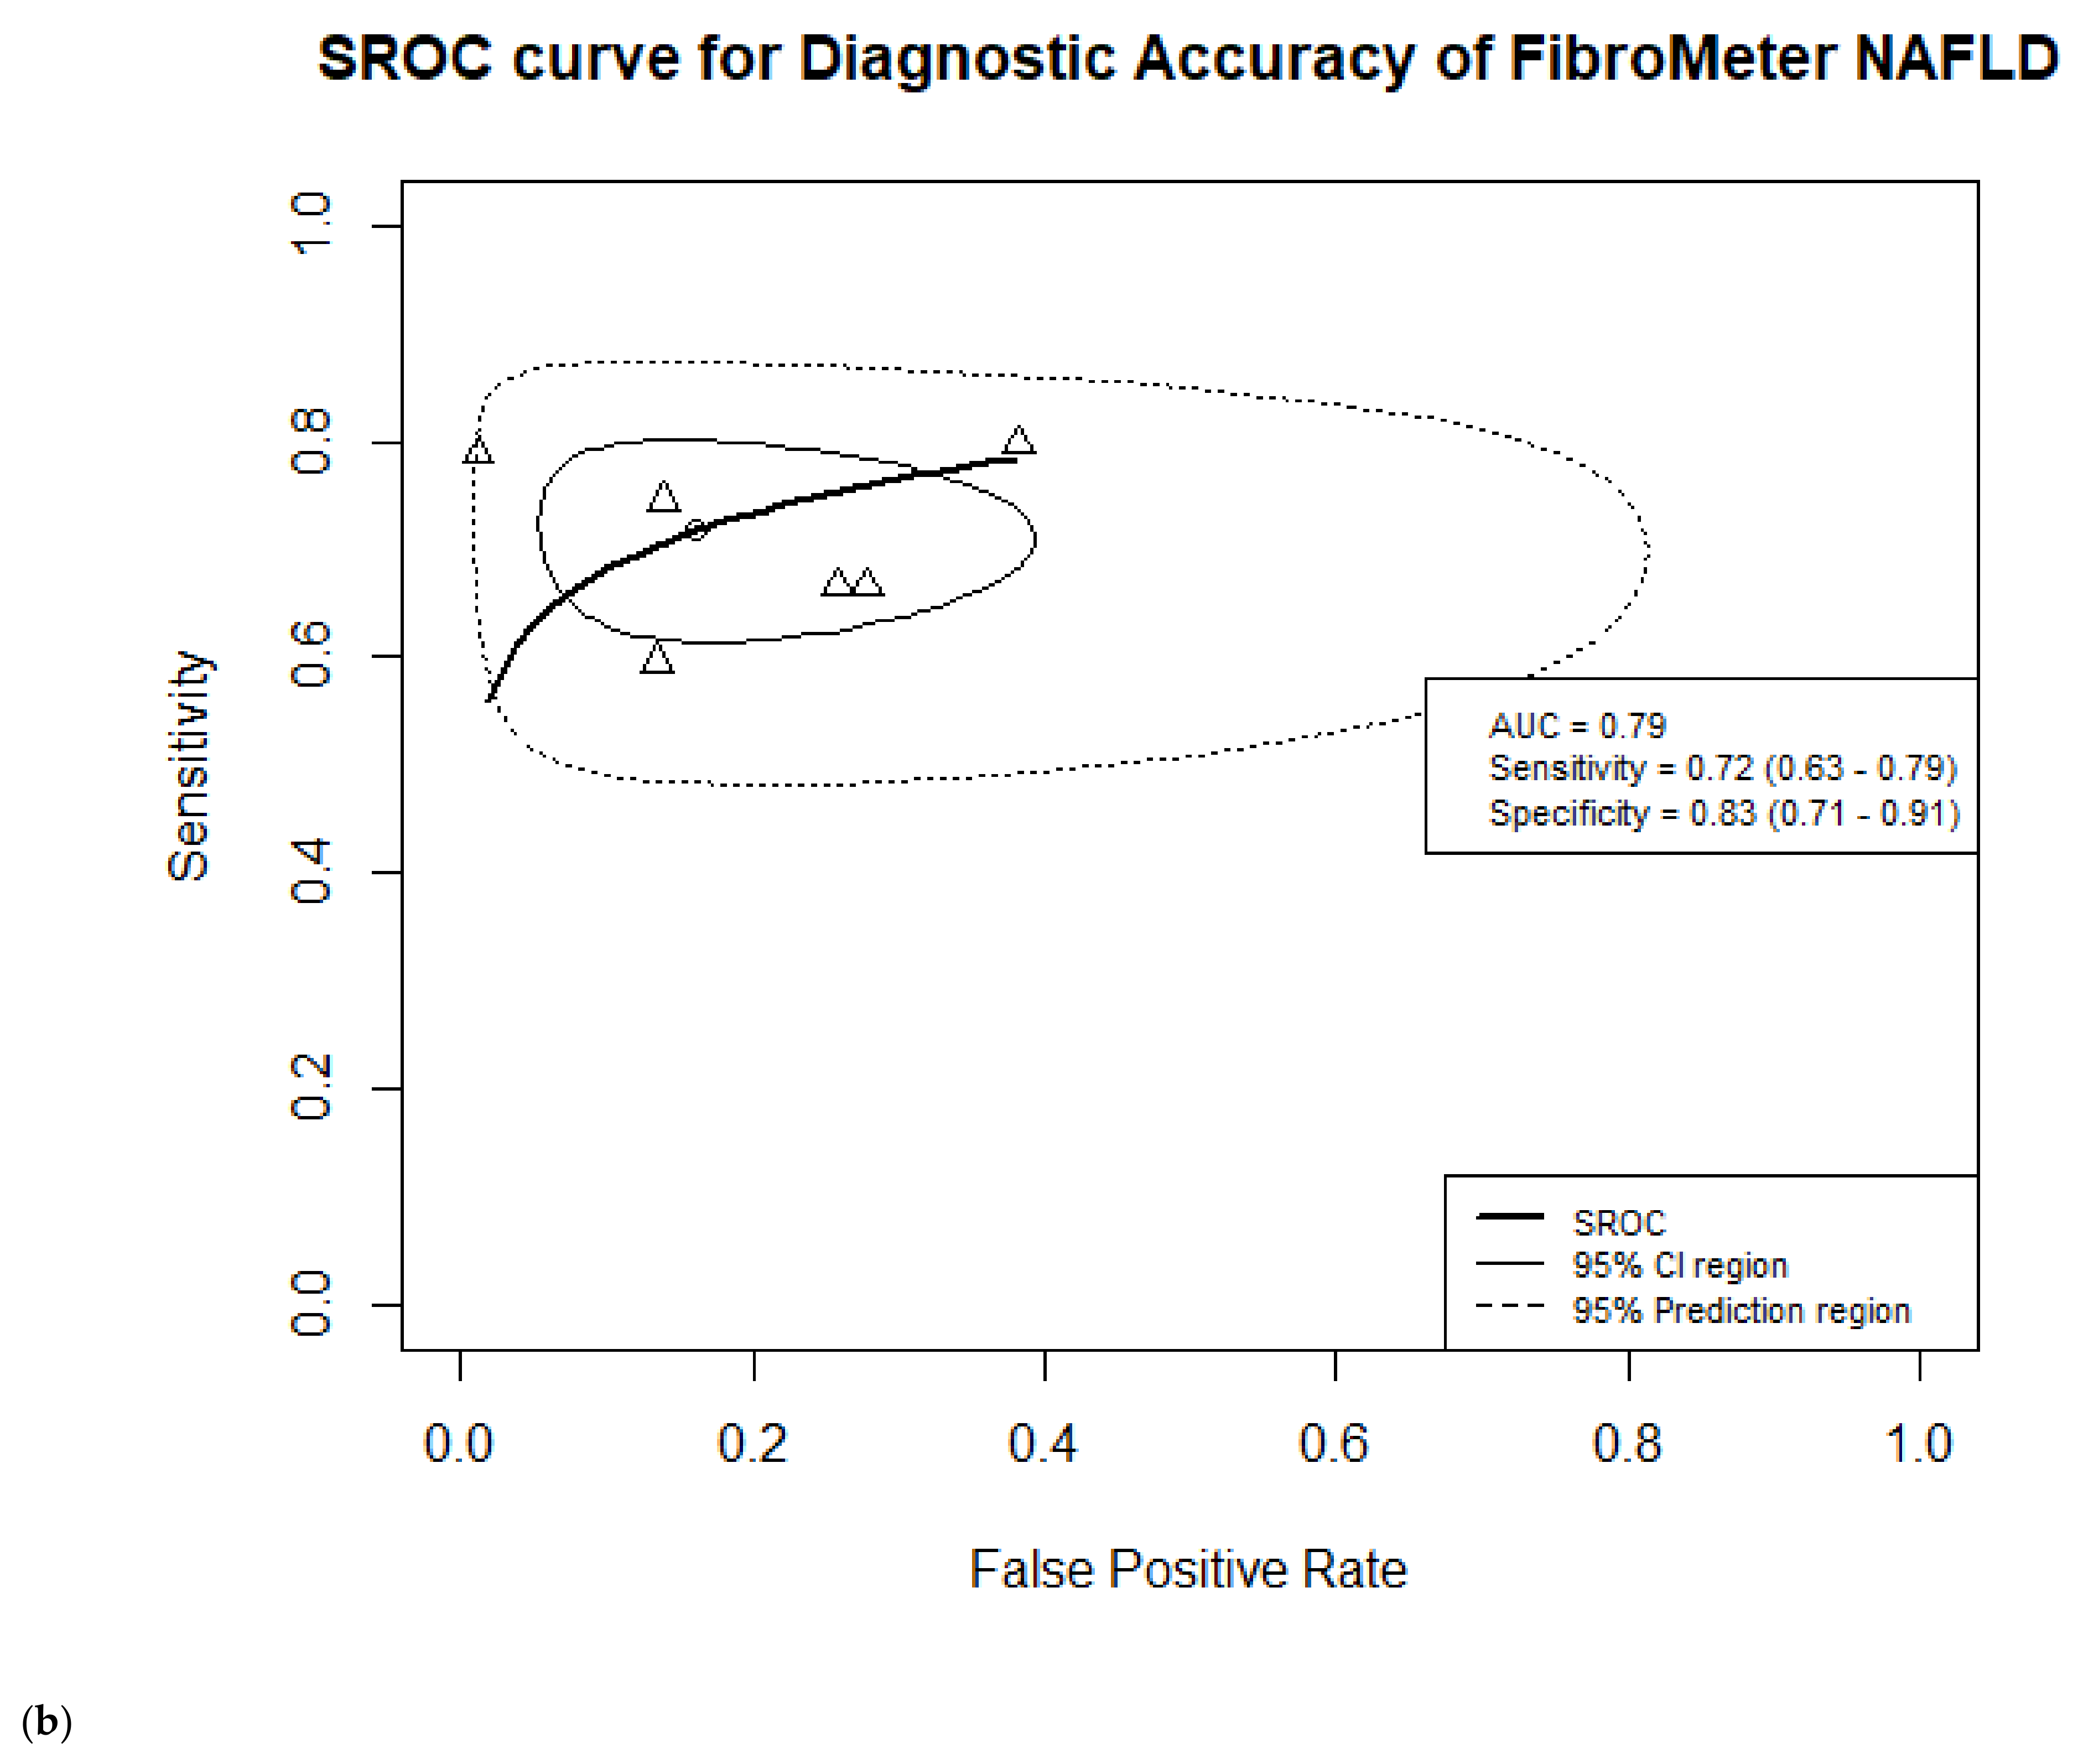
3.7.2. FibroMeter NAFLD
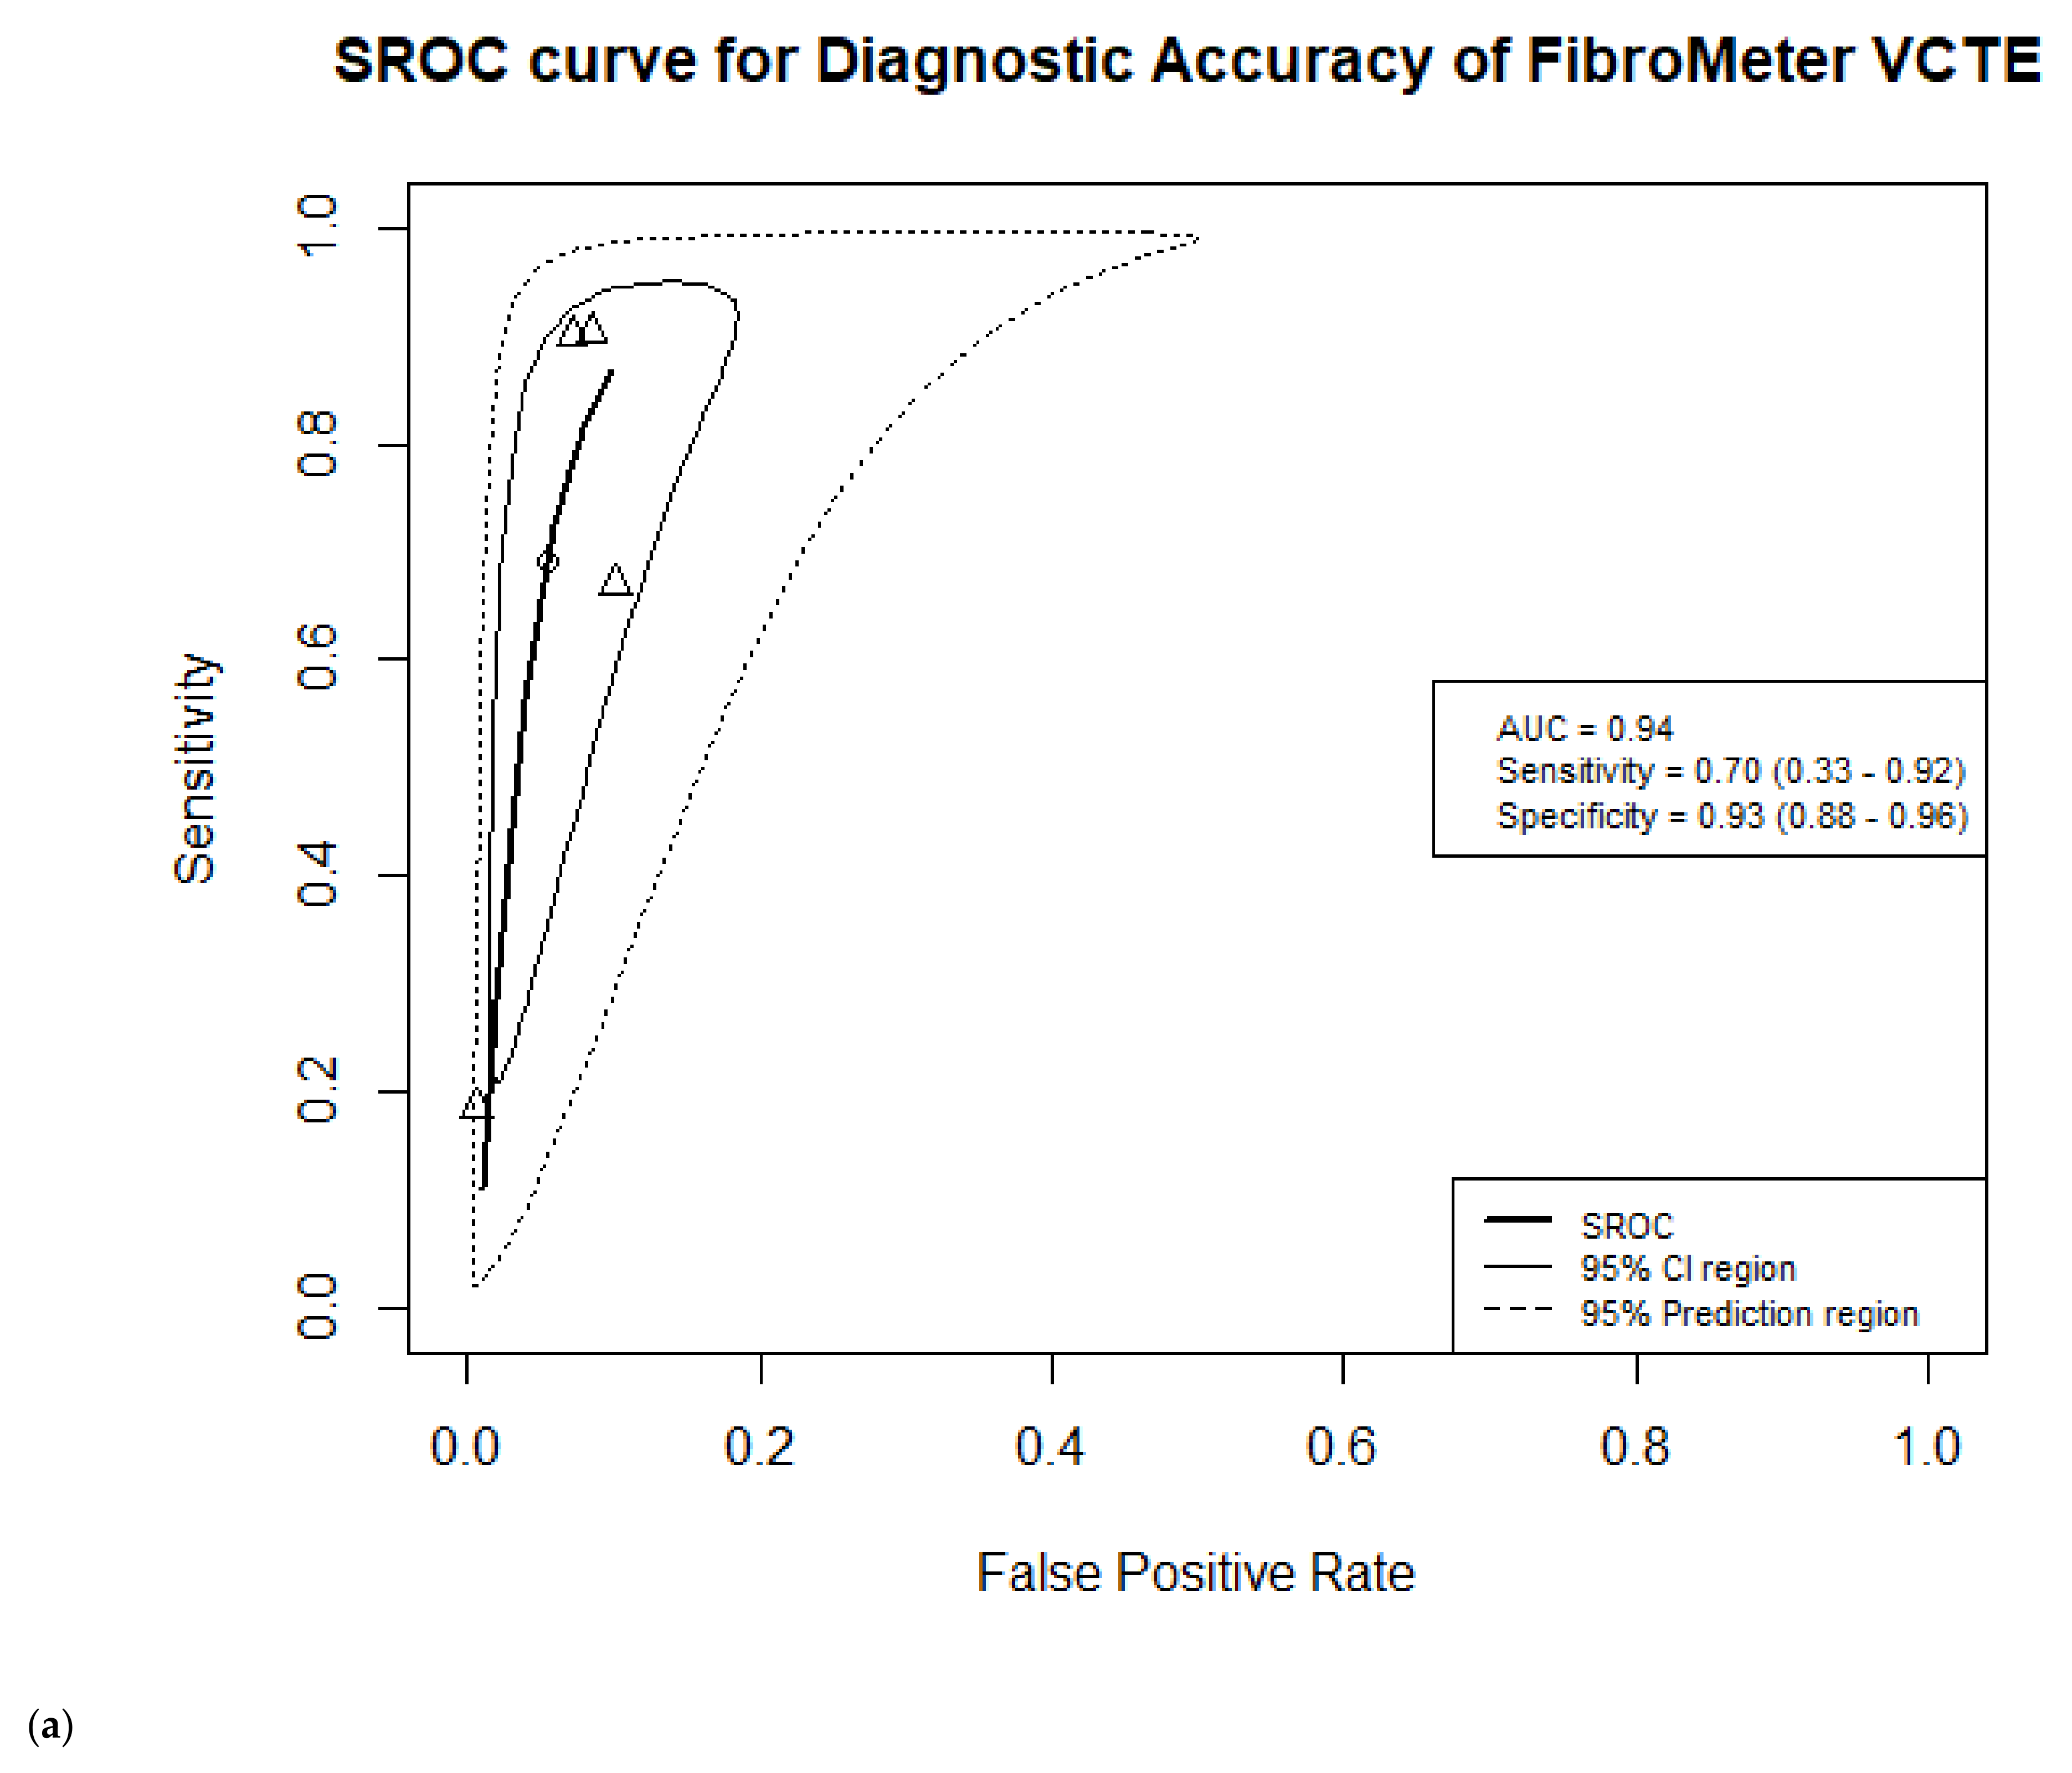
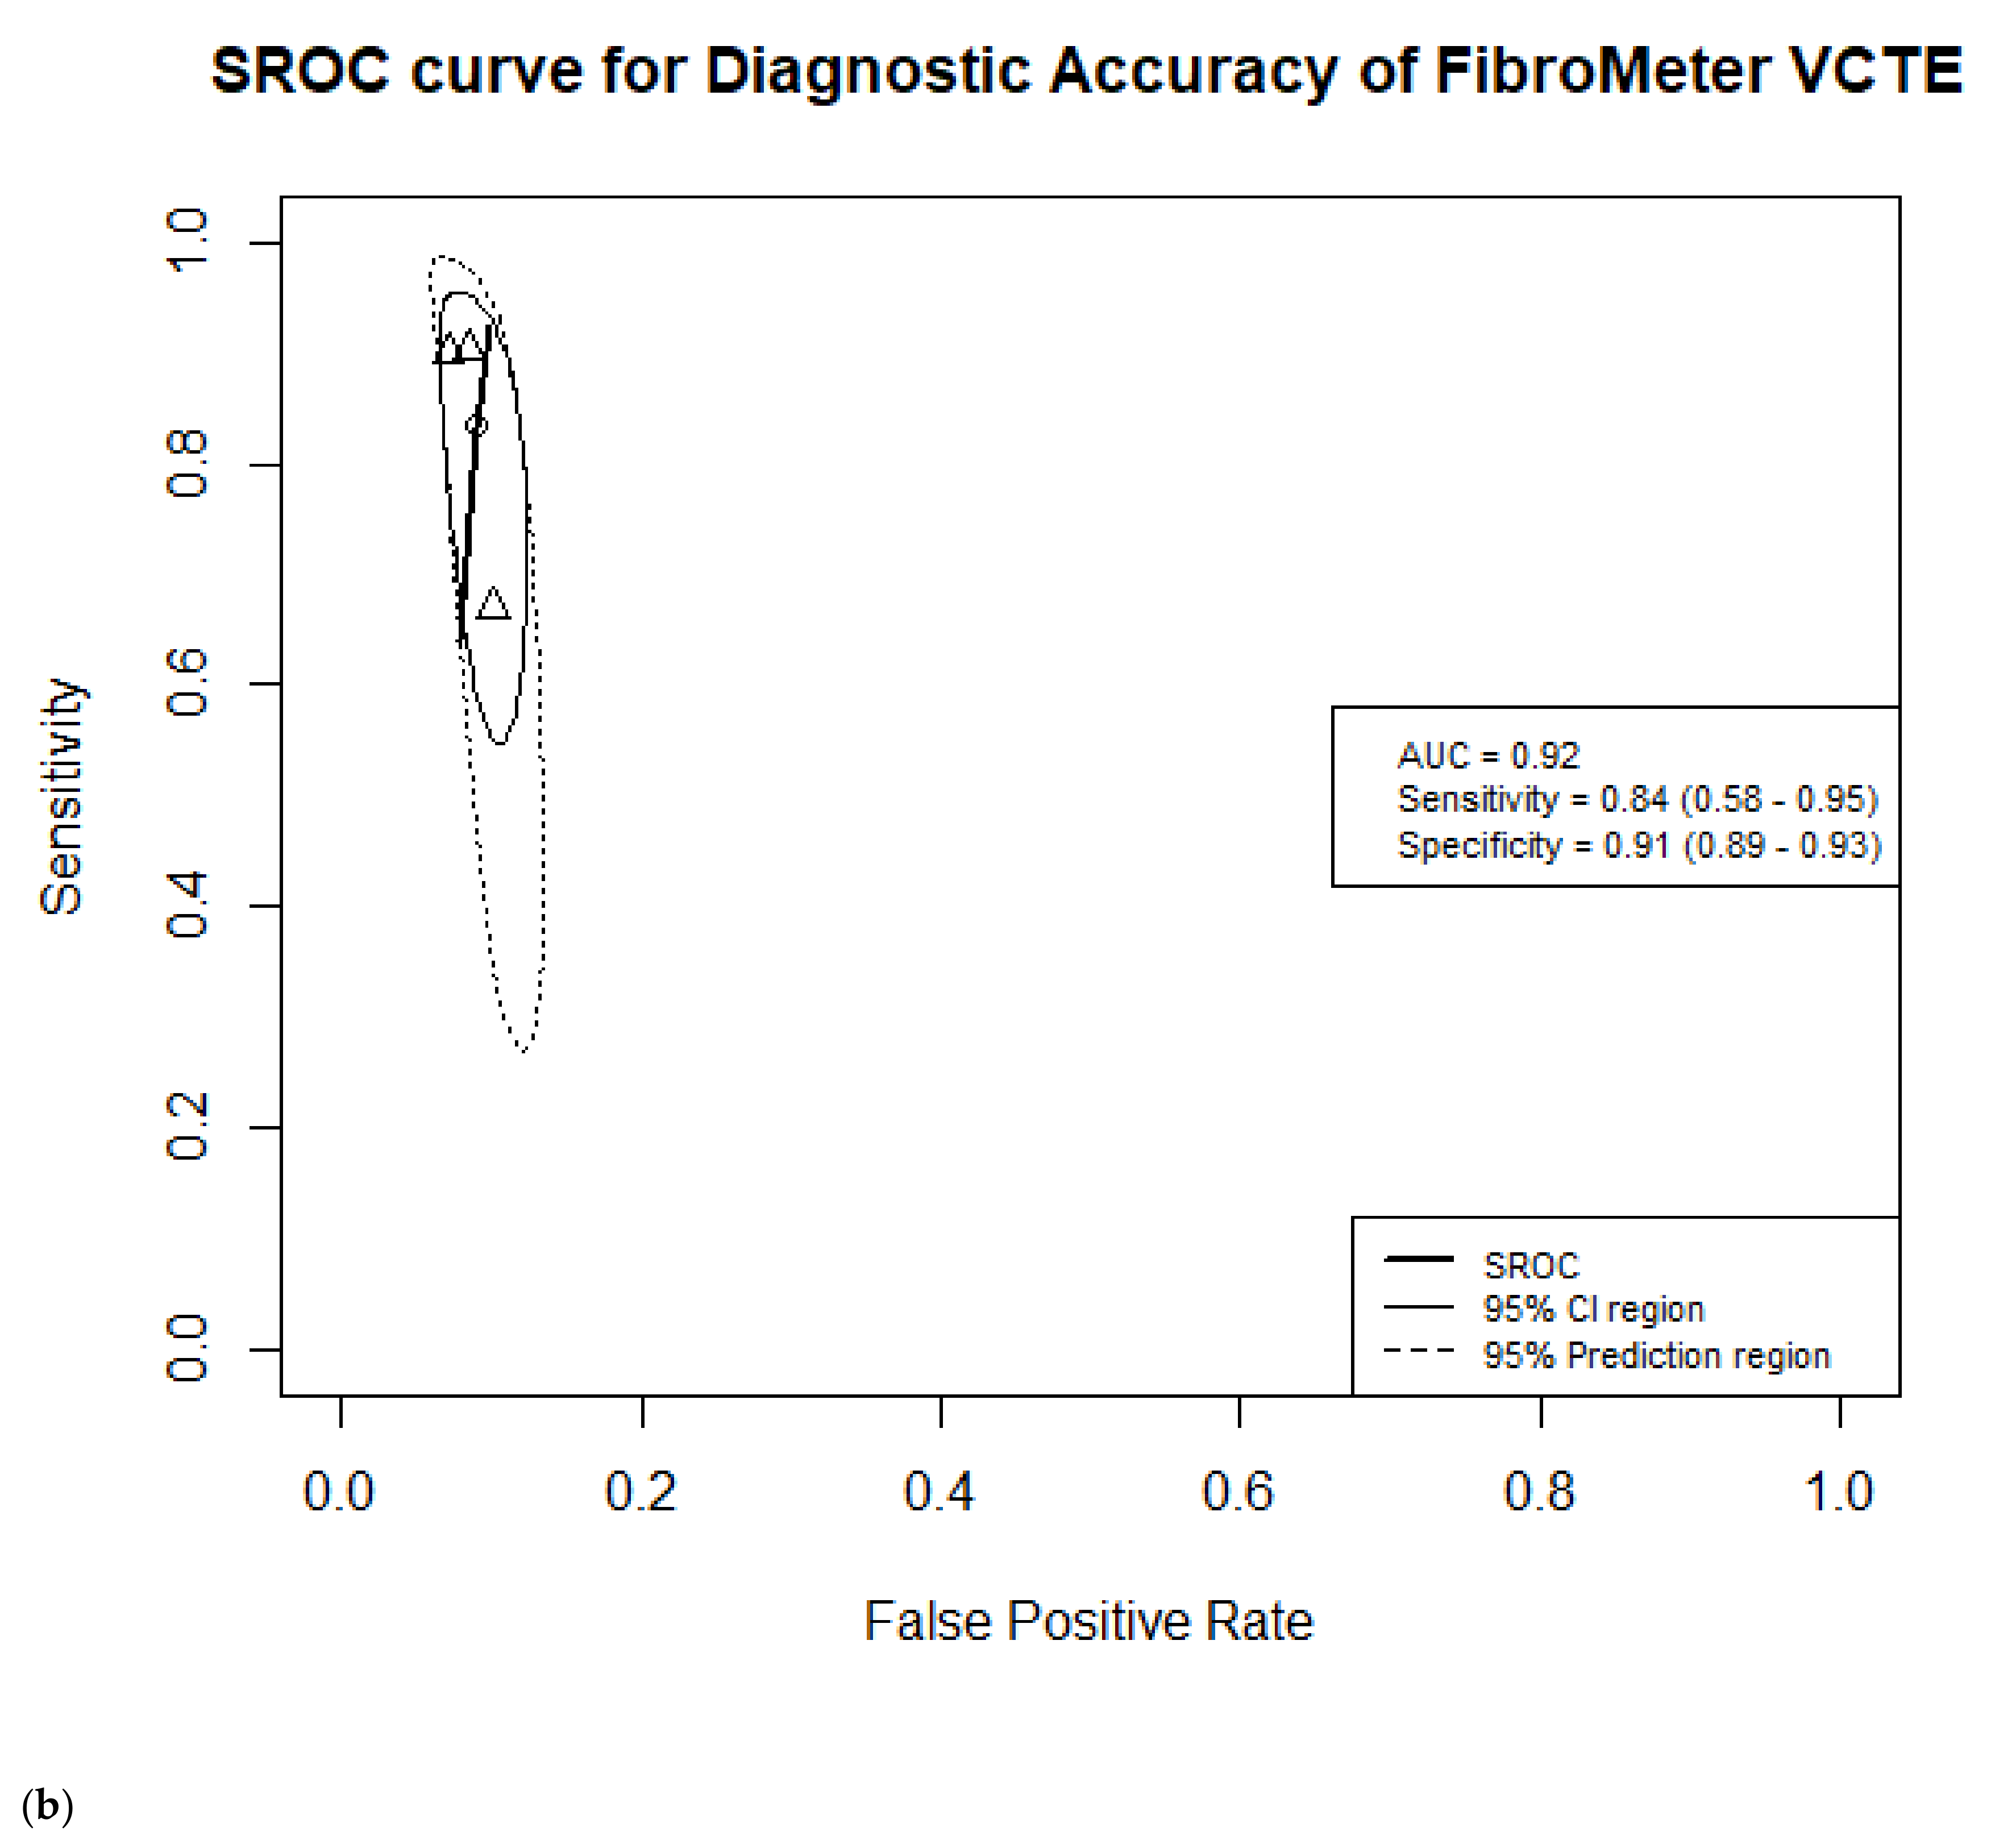
3.7.3. FibroMeter VCTE
3.8. Accuracy of FibroMeter in Detecting Advanced Fibrosis (F ≥ 3)
3.8.1. FibroMeter V2G
3.8.2. FibroMeter NAFLD
3.8.3. FibroMeter VCTE

3.9. Additional Analyses


4. Discussion
4.1. Published Literature
4.2. Strengths and Limitations
4.3. Implications and Future Perspective
5. Conclusions
Supplementary Materials
Author Contributions
Funding
Informed Consent Statement
Data Availability Statement
Acknowledgments
Conflicts of Interest
References
- Younossi, Z.M.; Koenig, A.B.; Abdelatif, D.; Fazel, Y.; Henry, L.; Wymer, M. Global epidemiology of nonalcoholic fatty liver disease—Meta-analytic assessment of prevalence, incidence, and outcomes. Hepatology 2016, 64, 73–84. [Google Scholar] [CrossRef] [PubMed] [Green Version]
- Singh, S.; Allen, A.M.; Wang, Z.; Prokop, L.J.; Murad, M.H.; Loomba, R. Fibrosis Progression in Nonalcoholic Fatty Liver vs. Nonalcoholic Steatohepatitis: A Systematic Review and Meta-analysis of Paired-Biopsy Studies. Clin. Gastroenterol. Hepatol. 2015, 13, 643–654. [Google Scholar] [CrossRef] [PubMed] [Green Version]
- Musso, G.; Gambino, R.; Cassader, M.; Pagano, G. Meta-analysis: Natural history of non-alcoholic fatty liver disease (NAFLD) and diagnostic accuracy of non-invasive tests for liver disease severity. Ann. Med. 2011, 43, 617–649. [Google Scholar] [CrossRef] [PubMed]
- Taylor, R.S.; Taylor, R.J.; Bayliss, S.; Hagström, H.; Nasr, P.; Schattenberg, J.M.; Ishigami, M.; Toyoda, H.; Wong, V.W.; Peleg, N.; et al. Association between Fibrosis Stage and Outcomes of Patients with Nonalcoholic Fatty Liver Disease: A Systematic Review and Meta-Analysis. Gastroenterology 2020, 158, 1611–1625. [Google Scholar] [CrossRef] [Green Version]
- Dulai, P.S.; Singh, S.; Patel, J.; Soni, M.; Prokop, L.J.; Younossi, Z.; Sebastiani, G.; Ekstedt, M.; Hagstrom, H.; Nasr, P.; et al. Increased risk of mortality by fibrosis stage in nonalcoholic fatty liver disease: Systematic review and meta-analysis. Hepatology 2017, 65, 1557–1565. [Google Scholar] [CrossRef]
- European Association for Study of Liver. EASL-ALEH Clinical Practice Guidelines: Non-invasive tests for evaluation of liver disease severity and prognosis. J. Hepatol. 2015, 63, 237–264. [Google Scholar] [CrossRef] [Green Version]
- European Association for the Study of The Liver; European Association for the Study of Diabetes (EASD). EASL-EASD-EASO Clinical Practice Guidelines for the management of non-alcoholic fatty liver disease. J. Hepatol. 2016, 9, 65–90. [Google Scholar] [CrossRef]
- Chalasani, N.; Younossi, Z.; Lavine, J.E.; Charlton, M.; Cusi, K.; Rinella, M.; Harrison, S.A.; Brunt, E.M.; Sanyal, A.J. The diagnosis and management of nonalcoholic fatty liver disease: Practice guidance from the American Association for the Study of Liver Diseases. Hepatology 2018, 67, 328–357. [Google Scholar] [CrossRef]
- Davison, B.A.; Harrison, S.A.; Cotter, G.; Alkhouri, N.; Sanyal, A.; Edwards, C.; Colca, J.R.; Iwashita, J.; Koch, G.G.; Dittrich, H.C. Suboptimal reliability of liver biopsy evaluation has implications for randomized clinical trials. J. Hepatol. 2020, 73, 1322–1332. [Google Scholar] [CrossRef]
- Calès, P.; Boursier, J.; Oberti, F.; Hubert, I.; Gallois, Y.; Rousselet, M.C.; Dib, N.; Moal, V.; Macchi, L.; Chevailler, A.; et al. FibroMeters: A family of blood tests for liver fibrosis. Gastroenterol. Clin. Biol. 2008, 32, 40–51. [Google Scholar] [CrossRef] [Green Version]
- Calès, P.; Oberti, F.; Michalak, S.; Hubert-Fouchard, I.; Rousselet, M.C.; Konaté, A.; Gallois, Y.; Ternisien, C.; Chevallier, A.; Lunel, F. A novel panel of blood markers to assess the degree of liver fibrosis. Hepatology 2005, 42, 1373–1381. [Google Scholar] [CrossRef]
- Guillaume, M.; Moal, V.; Delabaudiere, C.; Zuberbuhler, F.; Robic, M.A.; Lannes, A.; Metivier, S.; Oberti, F.; Gourdy, P.; Fouchard-Hubert, I.; et al. Direct comparison of the specialised blood fibrosis tests FibroMeterV2G and Enhanced Liver Fibro-sis score in patients with non-alcoholic fatty liver disease from tertiary care centres. Aliment. Pharmacol. Ther. 2019, 50, 1214–1222. [Google Scholar] [CrossRef]
- Boursier, J.; Vergniol, J.; Guillet, A.; Hiriart, J.B.; Lannes, A.; Le Bail, B.; Michalak, S.; Chermak, F.; Bertrais, S.; Foucher, J.; et al. Diagnostic accuracy and prognostic significance of blood fibrosis tests and liver stiffness measurement by FibroScan in non-alcoholic fatty liver disease. J. Hepatol. 2016, 65, 570–578. [Google Scholar] [CrossRef]
- Ducancelle, A.; Leroy, V.; Vergniol, J.; Sturm, N.; Le Bail, B.; Zarski, J.P.; Nguyen Khac, E.; Salmon, D.; de Ledinghen, V.; Calès, P. A Single Test Combining Blood Markers and Elastography is More Accurate than Other Fibrosis Tests in the Main Causes of Chronic Liver Diseases. J. Clin. Gastroenterol. 2017, 51, 639–649. [Google Scholar] [CrossRef]
- Eddowes, P.J.; Sasso, M.; Allison, M.; Tsochatzis, E.; Anstee, Q.M.; Sheridan, D.; Guha, I.N.; Cobbold, J.F.; Deeks, J.J.; Paradis, V.; et al. Accuracy of FibroScan Controlled Attenuation Parameter and Liver Stiffness Measurement in Assessing Steatosis and Fibrosis in Patients with Nonalcoholic Fatty Liver Disease. Gastroenterology 2019, 156, 1717–1730. [Google Scholar] [CrossRef] [Green Version]
- Calès, P.; Boursier, J.; Chaigneau, J.; Lainé, F.; Sandrini, J.; Michalak, S.; Hubert, I.; Dib, N.; Oberti, F.; Bertrais, S.; et al. Diagnosis of different liver fibrosis characteristics by blood tests in non-alcoholic fatty liver disease. Liver Int. 2010, 30, 1346–1354. [Google Scholar] [CrossRef]
- Aykut, U.E.; Akyuz, U.; Yesil, A.; Eren, F.; Gerin, F.; Ergelen, R.; Celikel, C.A.; Yilmaz, Y. A comparison of fibrometerTM NAFLD score, NAFLD fibrosis score, and transient elastography as noninvasive diagnostic tools for hepatic fibrosis in patients with biopsy-proven non-alcoholic fatty liver disease. Scand. J. Gastroenterol. 2014, 49, 1343–1348. [Google Scholar] [CrossRef]
- Subasi, C.F.; Aykut, U.E.; Yilmaz, Y. Comparison of noninvasive scores for the detection of advanced fibrosis in patients with nonalcoholic fatty liver disease. Eur. J. Gastroenterol. Hepatol. 2015, 27, 137–141. [Google Scholar] [CrossRef]
- McInnes, M.D.; Moher, D.; Thombs, B.D.; McGrath, T.A.; Bossuyt, P.M.; Clifford, T.; Cohen, J.F.; Deeks, J.J.; Gatsonis, C.; Hooft, L.; et al. Preferred Reporting Items for a Systematic Review and Meta-analysis of Diagnostic Test Accuracy Studies: The PRISMA-DTA Statement. JAMA 2018, 319, 388–396. [Google Scholar] [CrossRef]
- Vali, Y.; Lee, J.; Boursier, J.; Spijker, R.; Löffler, J.; Verheij, J.; Brosnan, M.J.; Böcskei, Z.; Anstee, Q.M.; Bossuyt, P.M.; et al. Enhanced liver fibrosis test for the non-invasive diagnosis of fibrosis in patients with NAFLD: A systematic review and meta-analysis. J. Hepatol. 2020, 73, 252–262. [Google Scholar] [CrossRef]
- Lee, J.; Vali, Y.; Boursier, J.; Duffin, K.; Verheij, J.; Brosnan, M.J.; Zwinderman, K.; Anstee, Q.M.; Bossuyt, P.M.; Zafarmand, M.H. Accuracy of cytokeratin 18 (M30 and M65) in detecting non-alcoholic steatohepatitis and fibrosis: A systematic review and meta-analysis. PLoS ONE 2020, 15, e0238717. [Google Scholar]
- Boursier, J.; de Ledinghen, V.; Leroy, V.; Anty, R.; Francque, S.; Salmon, D.; Lannes, A.; Bertrais, S.; Oberti, F.; Fouchard-Hubert, I.; et al. A stepwise algorithm using an at-a-glance first-line test for the non-invasive diagnosis of advanced liver fibrosis and cirrhosis. J. Hepatol. 2017, 66, 1158–1165. [Google Scholar] [CrossRef]
- Whiting, P.F.; Rutjes, A.W.; Westwood, M.E.; Mallett, S.; Deeks, J.J.; Reitsma, J.B.; Leeflang, M.M.; Sterne, J.A.; Bossuyt, P.M. Quadas-2: A revised tool for the quality assessment of diagnostic accuracy studies. Ann. Intern. Med. 2011, 155, 529–536. [Google Scholar] [CrossRef]
- Review Manager (RevMan) [Computer Program]. Version 5.3; The Nordic Cochrane Centre, The Cochrane Collaboration: Copenhagen, Denmark, 2014.
- Bürkner, P.C.; Doebler, P. Testing for publication bias in diagnostic meta-analysis: A simulation study. Stat. Med. 2014, 33, 3061–3077. [Google Scholar] [CrossRef] [PubMed]
- Boursier, J.; Guillaume, M.; Leroy, V.; Irlès, M.; Roux, M.; Lannes, A.; Foucher, J.; Zuberbuhler, F.; Delabaudière, C.; Barthelon, J.; et al. New sequential combinations of non-invasive fibrosis tests provide an accurate diagnosis of advanced fibrosis in NAFLD. J. Hepatol. 2019, 71, 389–396. [Google Scholar] [CrossRef] [PubMed]
- Calès, P.; Lainé, F.; Boursier, J.; Deugnier, Y.; Moal, V.; Oberti, F.; Hunault, G.; Rousselet, M.C.; Hubert, I.; Laafi, J.; et al. Comparison of blood tests for liver fibrosis specific or not to NAFLD. J. Hepatol. 2009, 50, 165–173. [Google Scholar] [CrossRef] [PubMed] [Green Version]
- Dincses, E.; Yilmaz, Y. Diagnostic usefulness of FibroMeter VCTE for hepatic fibrosis in patients with nonalcoholic fatty liver disease. Eur. J. Gastroenterol. Hepatol. 2015, 27, 1149–1153. [Google Scholar] [CrossRef] [PubMed]
- Loong, T.C.; Wei, J.L.; Leung, J.C.; Wong, G.L.; Shu, S.S.; Chim, A.M.; Chan, A.W.; Choi, P.C.; Tse, Y.K.; Chan, H.L.; et al. Application of the combined FibroMeter vibration-controlled transient elastography algorithm in Chinese patients with non-alcoholic fatty liver disease. J. Gastroenterol. Hepatol. 2017, 32, 1363–1369. [Google Scholar] [CrossRef]
- Siddiqui, M.S.; Patidar, K.R.; Boyett, S.; Luketic, V.A.; Puri, P.; Sanyal, A.J. Performance of non-invasive models of fibrosis in predicting mild to moderate fibrosis in patients with non-alcoholic fatty liver disease. Liver Int. 2016, 36, 572–579. [Google Scholar] [CrossRef]
- Staufer, K.; Halilbasic, E.; Spindelboeck, W.; Eilenberg, M.; Prager, G.; Stadlbauer, V.; Posch, A.; Munda, P.; Marculescu, R.; Obermayer-Pietsch, B.; et al. Evaluation and comparison of six noninvasive tests for prediction of significant or advanced fi-brosis in nonalcoholic fatty liver disease. United Eur. Gastroenterol. J. 2019, 7, 1113–1123. [Google Scholar] [CrossRef] [Green Version]
- Yang, M.; Zhou, G.; Liu, S.; Jiang, L.; Zhu, L.; Guo, C.; Zhang, L.; Zhao, J. Step layered combination of noninvasive fibrosis models improves diagnostic accuracy of advanced fibrosis in nonalcoholic fatty liver disease. J. Gastrointest. Liver Dis. 2019, 28, 289–296. [Google Scholar] [CrossRef]
- Eddowes, P.J.; Allison, M.E.; Tsochatzis, E.; Anstee, Q.M.; Guha, I.N.; Cobbold, J.F.; Sheridan, D.A.; Paradis, V.; Bedossa, P.; Newsome, P. Comparison of published noninvasive biomarkers to reliably exclude severe fibrosis in NAFLD patients. Hepatology 2017, 66, 1134A–1135A. [Google Scholar]
- Sanyal, A.J.; Harrison, S.; Cordonnier, G.; Brozek, J.; Roudot, A.; Praca, E.; Sudrik, F.B.; Megnien, S.; Hanf, R.; Staels, B.; et al. Assessment of serum levels of Chitinase-3-like protein 1 (CHI3L1) improves identification of the NASH patients at risk who should be treated. Hepatology 2016, 64, S717. [Google Scholar] [CrossRef]
- Guha, I.N.; Parkes, J.; Roderick, P.R.; Harris, S.; Rosenberg, W.M. Non-invasive markers associated with liver fibrosis in non-alcoholic fatty liver disease. Gut 2006, 55, 1650–1660. [Google Scholar] [CrossRef]
- Perakakis, N.; Stefanakis, K.; Mantzoros, C.S. The role of omics in the pathophysiology, diagnosis and treatment of non-alcoholic fatty liver disease. Metabolism 2020, 111, 154320. [Google Scholar] [CrossRef]
- Fallatah, H.I. Noninvasive Biomarkers of Liver Fibrosis: An Overview. Adv. Hepatol. 2014, 2014, 357287. [Google Scholar] [CrossRef]
- Soresi, M.; Giannitrapani, L.; Cervello, M.; Licata, A.; Montalto, G. Non invasive tools for the diagnosis of liver cirrhosis. World J. Gastroenterol. 2014, 20, 18131. [Google Scholar] [CrossRef] [Green Version]
- Vilar-Gomez, E.; Chalasani, N. Non-invasive assessment of non-alcoholic fatty liver disease: Clinical prediction rules and blood-based biomarkers. J. Hepatol. 2018, 68, 305–315. [Google Scholar] [CrossRef]
- Newsome, P.N.; Sasso, M.; Deeks, J.J.; Paredes, A.; Boursier, J.; Chan, W.K.; Yilmaz, Y.; Czernichow, S.; Zheng, M.H.; Wong, V.W.; et al. FibroScan-AST (FAST) score for the non-invasive identification of patients with non-alcoholic steatohepatitis with significant activity and fibrosis: A prospective derivation and global validation study. Lancet Gastroenterol. Hepatol. 2020, 5, 362–373. [Google Scholar] [CrossRef] [Green Version]
- Calès, P.; Boursier, J.; Oberti, F.; Moal, V.; Fouchard Hubert, I.; Bertrais, S.; Hunault, G.; Rousselet, M.C. A single blood test adjusted for different liver fibrosis targets improves fibrosis staging and especially cirrhosis diagnosis. Hepatol. Commun. 2018, 2, 455–466. [Google Scholar] [CrossRef]
- Srivastava, A.; Gailer, R.; Tanwar, S.; Trembling, P.; Parkes, J.; Rodger, A.; Suri, D.; Thorburn, D.; Sennett, K.; Morgan, S.; et al. Prospective evaluation of a primary care referral pathway for patients with non-alcoholic fatty liver disease. J. Hepatol. 2019, 71, 371–378. [Google Scholar] [CrossRef] [Green Version]


| Study ID | Setting | Country | Population | N (Females) | Index Test (s) | Mean Age (years) | Mean BMI (kg/m2) | Target Condition/N (%) | Scoring System | ALT (U/L) | T2D | ||
|---|---|---|---|---|---|---|---|---|---|---|---|---|---|
| 1 | Aykut 2014 [17] | Tertiary care centers | Turkey | Suspected NAFLD | 88 (38) | FibroMeter NAFLD | 46 | 30.3 | Significant fibrosis F ≥ 2/44 (50%) Advanced fibrosis F ≥ 3/27 (31%) Cirrhosis F = 4/9 (10%) | NASH CRN | 84 | NR | |
| 2 | Boursier 2016 [13] | Tertiary care centers | France | Biopsy proven NAFLD | 452 (181) | FibroMeter V2G FibroMeter NAFLD | 56 | 31.1 | Significant fibrosis F ≥ 2/NR Advanced fibrosis F ≥ 3/172 (38%) | NASH CRN | 68 | 46.7% | |
| 3 | Boursier 2019 [26] | Tertiary care centers | France | Biopsy proven NAFLD | 938 (389) | FibroMeter V2G FibroMeter VCTE | 57 | 31.8 | Significant fibrosis F ≥ 2/635 (68%) Advanced fibrosis F ≥ 3/383 (41%) | NASH CRN | 56 | 51.1% | |
| 4 | Cales 2009 [27] | Tertiary care centers | France | Biopsy proven NAFLD | 235 (60) | FibroMeter NAFLD | 51 | 28.7 | Significant fibrosis F ≥ 2/65 (28%) ‡ Advanced fibrosis F ≥ 3/44 (19%) ‡ | METAVIR | NR | 24.1% | |
| 5 | Dincses 2015 [28] | Tertiary care centers | Turkey | Biopsy proven NAFLD | 52 (22) | FibroMeter VCTE | 45 | 30.8 | Significant fibrosis F ≥ 2/20 (38%) Advanced fibrosis F ≥ 3/10 (19%) | NASH CRN | 89 | 36.5% | |
| 6 | Eddowes 2017 [33] † | NR | UK | Biopsy proven NAFLD | 266(NR) | FibroMeter VCTE | NR § | NR | Advanced fibrosis F ≥ 3/106 (35%) | NR | NR | NR | |
| 7 | Loong 2017 [29] | Tertiary care centers | China | Suspected NAFLD | 253 (96) | FibroMeter NAFLD FibroMeter VCTE | 52 | 26.8 | Significant fibrosis F ≥ 2/69 (32%) Advanced fibrosis F ≥ 3/43 (20%) Cirrhosis F = 4/20 (9%) | NASH CRN | 58 | 54.9% | |
| 8 | Sanyal 2016 [34] † | Tertiary care centers | NR | Biopsy proven NAFLD | 216 (96) | FibroMeter NAFLD | 52 | 31.2 | NASH with significant fibrosis (NAS ≥ 4; F ≥ 2)/95 (44%) | NASH CRN | 62 | 36.6% | |
| 9 | Siddiqui 2016 [30] | Tertiary care centers | USA | Biopsy proven NAFLD | 145 (92) | FibroMeter NAFLD | 53 | 35.8 | Any fibrosis F ≥ 1/103 (71%) Advanced fibrosis F ≥ 3/51 (35%) | NASH CRN | 81 | 39.3% | |
| 10 | Staufer 2019 [31] | Tertiary care centers | Austria | Suspected NAFLD | 186 (80) | FibroMeter V2G FibroMeter V3G | 52 | 30.5 | Significant fibrosis F ≥ 2/71 (54%) Advanced fibrosis F ≥ 3/49 (37%) NASH + Advanced fibrosis F ≥ 3/35 (27%) Cirrhosis F ≥ 4/20 (15%) | NASH CRN | 55 | 30.0% | |
| 11 | Subasi 2015 [18] | Tertiary care centers | Turkey | Biopsy proven NAFLD | 142 (67) | FibroMeter NAFLD | 45 | 30.9 | Advanced fibrosis F ≥ 3/30 (21%) | NASH CRN | 91 | 16.9% | |
| 12 | Yang 2019 [32] | Tertiary care centers | China | Biopsy proven NAFLD | 453 (186) | FibroMeter NAFLD | 37 | 25.9 | Significant fibrosis F ≥ 2/208 (46%) Advanced fibrosis F ≥ 3/126 (28%) | NASH CRN | 135 | 30.2% |
| Study ID | FibroMeter | Prevalence | Cut-off | AUC | 95% CI AUC | Sensitivity | 95% CI Sensitivity | Specificity | 95% CI Specificity | |
|---|---|---|---|---|---|---|---|---|---|---|
| 1 | Aykut 2014 [17] | FibroMeter NAFLD | 0.50 | 0.62 | 0.62 | 0.06 | 0.39 | 0.25–0.54 | 0.86 | 0.72–0.94 |
| 2 | Boursier 2016a [13] | FibroMeter V2G | NR | NR | 0.79 | 0.02 | NR | NR | NR | NR |
| 2 | Boursier 2016b [13] | FibroMeter NAFLD | NR | NR | 0.76 | 0.02 | NR | NR | NR | NR |
| 3 | Boursier 2019a [26] | FibroMeter V2G | 0.68 | 0.77 | 0.75 | 0.02 | NR | NR | NR | NR |
| 3 | Boursier 2019b [26] | FibroMeter VCTE | 0.68 | 0.69 | 0.83 | 0.01 | NR | NR | NR | NR |
| 4 | Dincses 2015 [28] | FibroMeter VCTE | 0.38 | 0.38 | 0.82 | 0.06 | 0.70 | 0.46–0.87 | 0.88 | 0.70–0.96 |
| 5 | Loong 2017a [29] | FibroMeter NAFLD | 0.32 | 0.62 | 0.78 | 0.04 | 0.52 | 0.41–0.64 | 0.86 | 0.80–0.91 |
| 5 | Loong 2017b [29] | FibroMeter VCTE | 0.32 | 0.38 | 0.86 | 0.04 | 0.55 | 0.43–0.66 | 0.95 | 0.90–0.98 |
| 6 | Staufer 2019 [31] | FibroMeter V2G | 0.54 | 0.31 | 0.86 | 0.79–0.93 | 0.80 | 0.69–0.88 | 0.80 | 0.67–0.89 |
| 6 | Staufer 2019 [31] | FibroMeter V3G | 0.54 | 0.39 | 0.84 | 0.77–0.92 | 0.78 | 0.66–0.86 | 0.80 | 0.68–0.89 |
Publisher’s Note: MDPI stays neutral with regard to jurisdictional claims in published maps and institutional affiliations. |
© 2021 by the authors. Licensee MDPI, Basel, Switzerland. This article is an open access article distributed under the terms and conditions of the Creative Commons Attribution (CC BY) license (https://creativecommons.org/licenses/by/4.0/).
Share and Cite
Van Dijk, A.-M.; Vali, Y.; Mak, A.L.; Lee, J.; Tushuizen, M.E.; Zafarmand, M.H.; Anstee, Q.M.; Brosnan, M.J.; Nieuwdorp, M.; Bossuyt, P.M.; et al. Systematic Review with Meta-Analyses: Diagnostic Accuracy of FibroMeter Tests in Patients with Non-Alcoholic Fatty Liver Disease. J. Clin. Med. 2021, 10, 2910. https://doi.org/10.3390/jcm10132910
Van Dijk A-M, Vali Y, Mak AL, Lee J, Tushuizen ME, Zafarmand MH, Anstee QM, Brosnan MJ, Nieuwdorp M, Bossuyt PM, et al. Systematic Review with Meta-Analyses: Diagnostic Accuracy of FibroMeter Tests in Patients with Non-Alcoholic Fatty Liver Disease. Journal of Clinical Medicine. 2021; 10(13):2910. https://doi.org/10.3390/jcm10132910
Chicago/Turabian StyleVan Dijk, Anne-Marieke, Yasaman Vali, Anne Linde Mak, Jenny Lee, Maarten E. Tushuizen, Mohammad Hadi Zafarmand, Quentin M. Anstee, M. Julia Brosnan, Max Nieuwdorp, Patrick M. Bossuyt, and et al. 2021. "Systematic Review with Meta-Analyses: Diagnostic Accuracy of FibroMeter Tests in Patients with Non-Alcoholic Fatty Liver Disease" Journal of Clinical Medicine 10, no. 13: 2910. https://doi.org/10.3390/jcm10132910