Polyvinylamine Membranes Containing Graphene-Based Nanofillers for Carbon Capture Applications

 , , ,
, , ,  and
and
Abstract
:
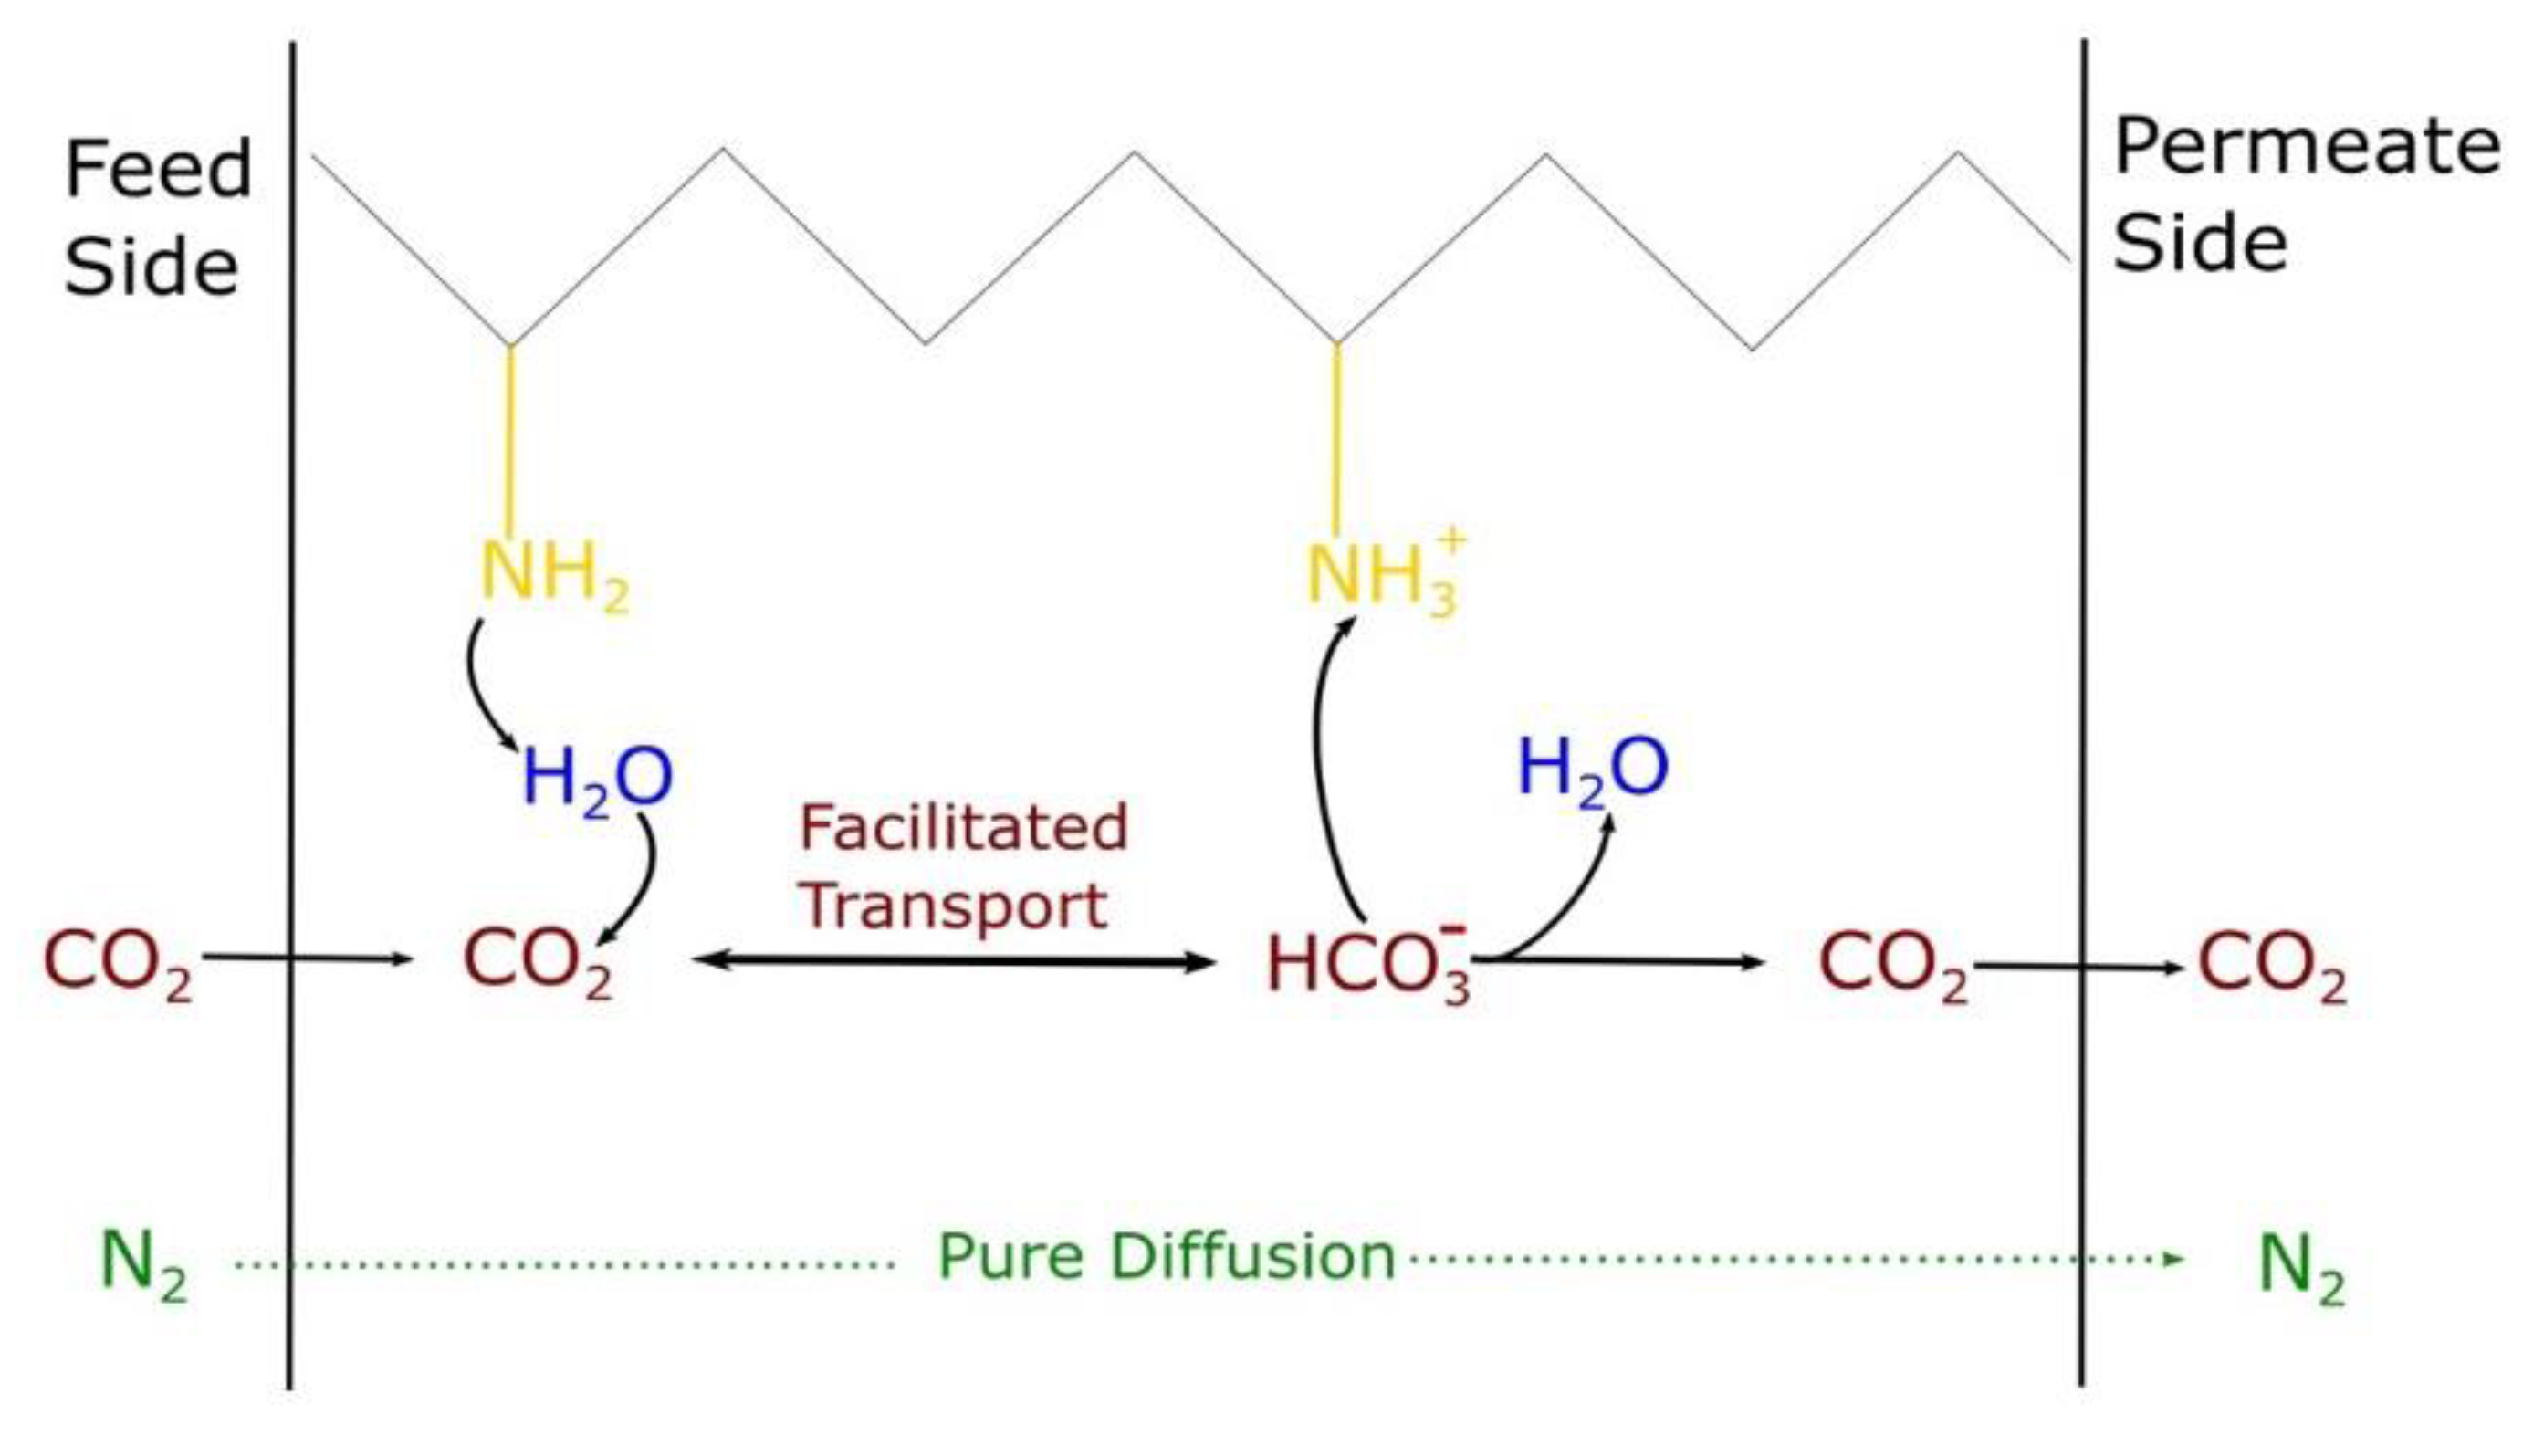
1. Introduction
2. Materials and Methods
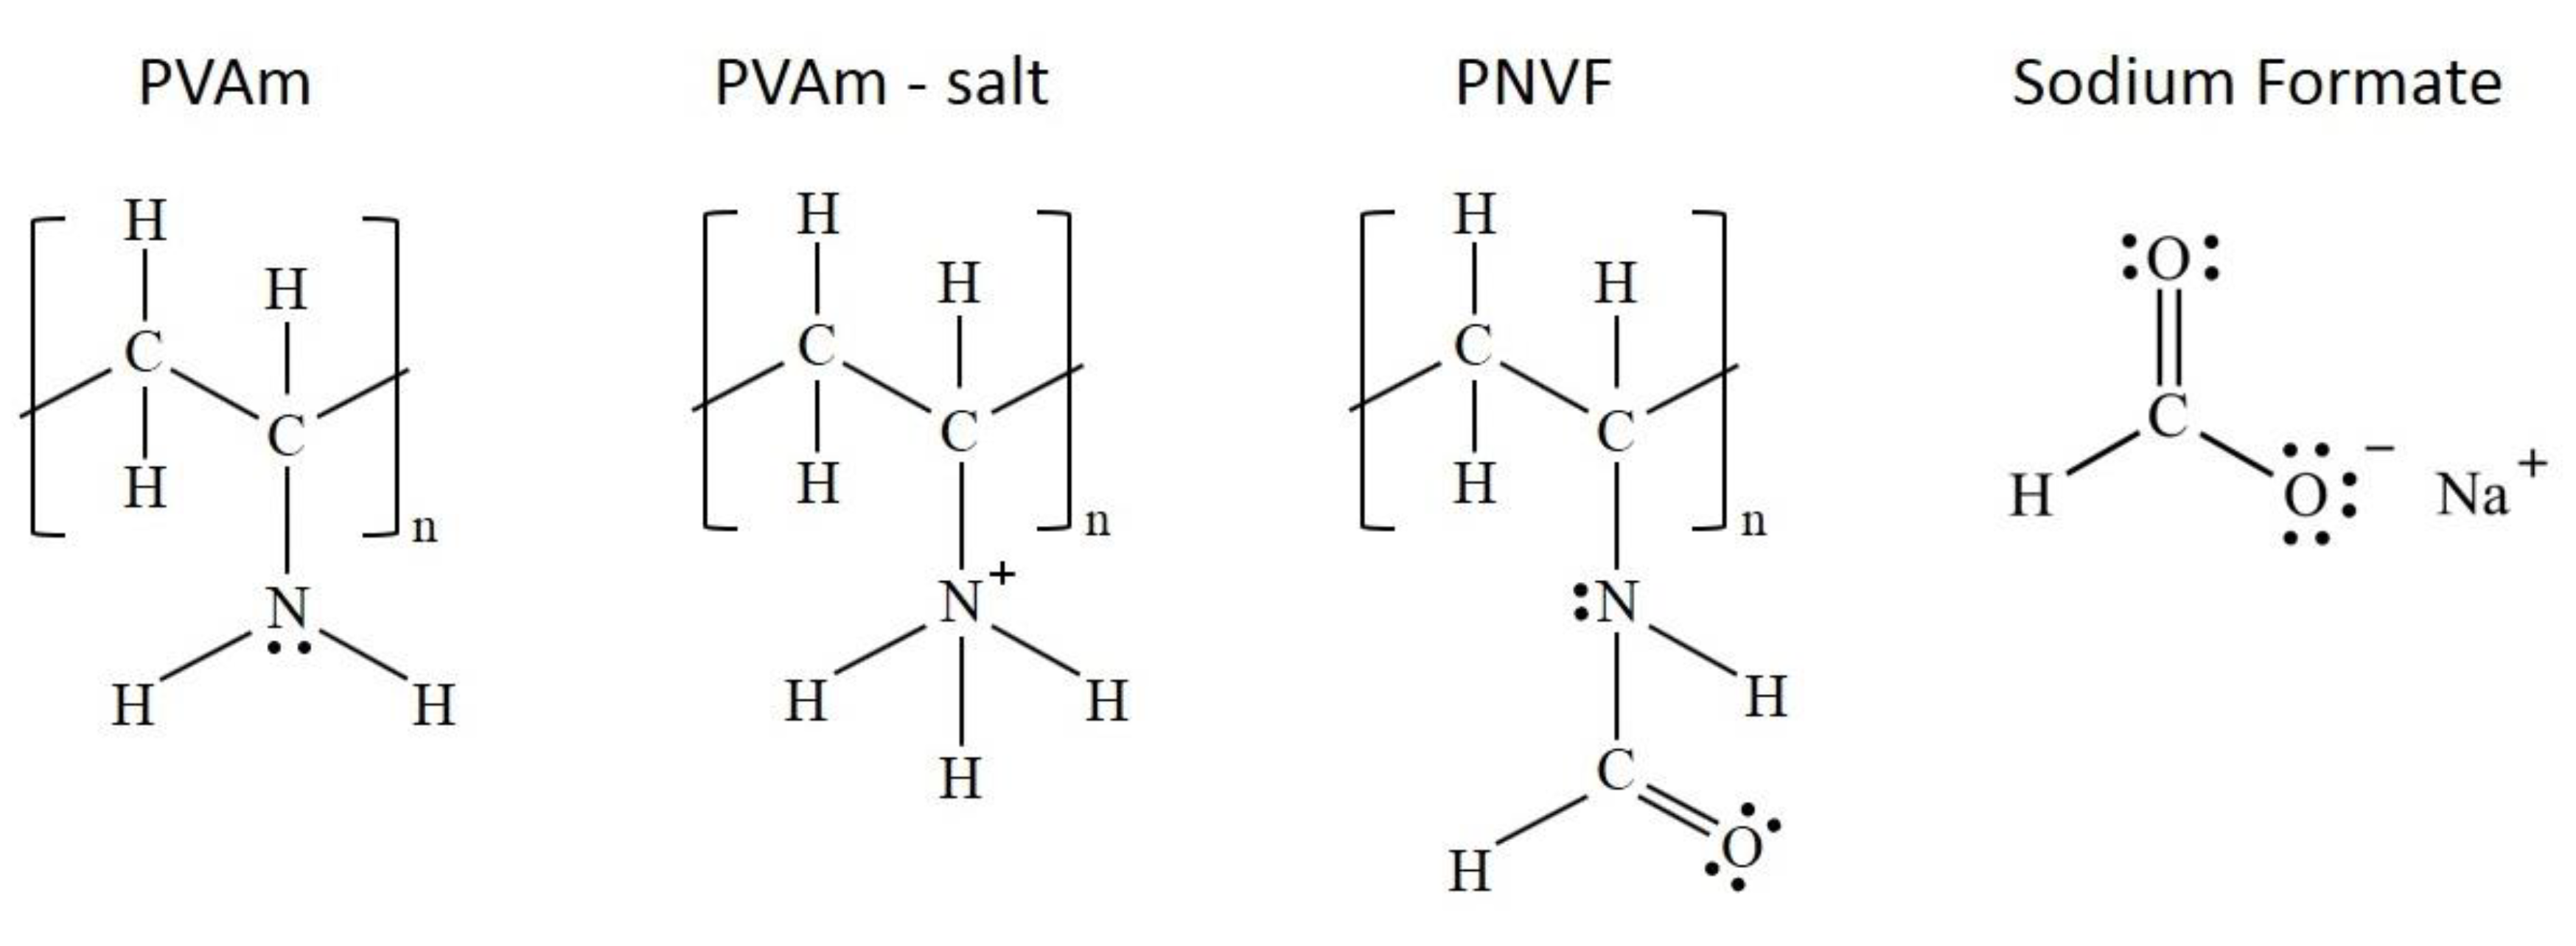
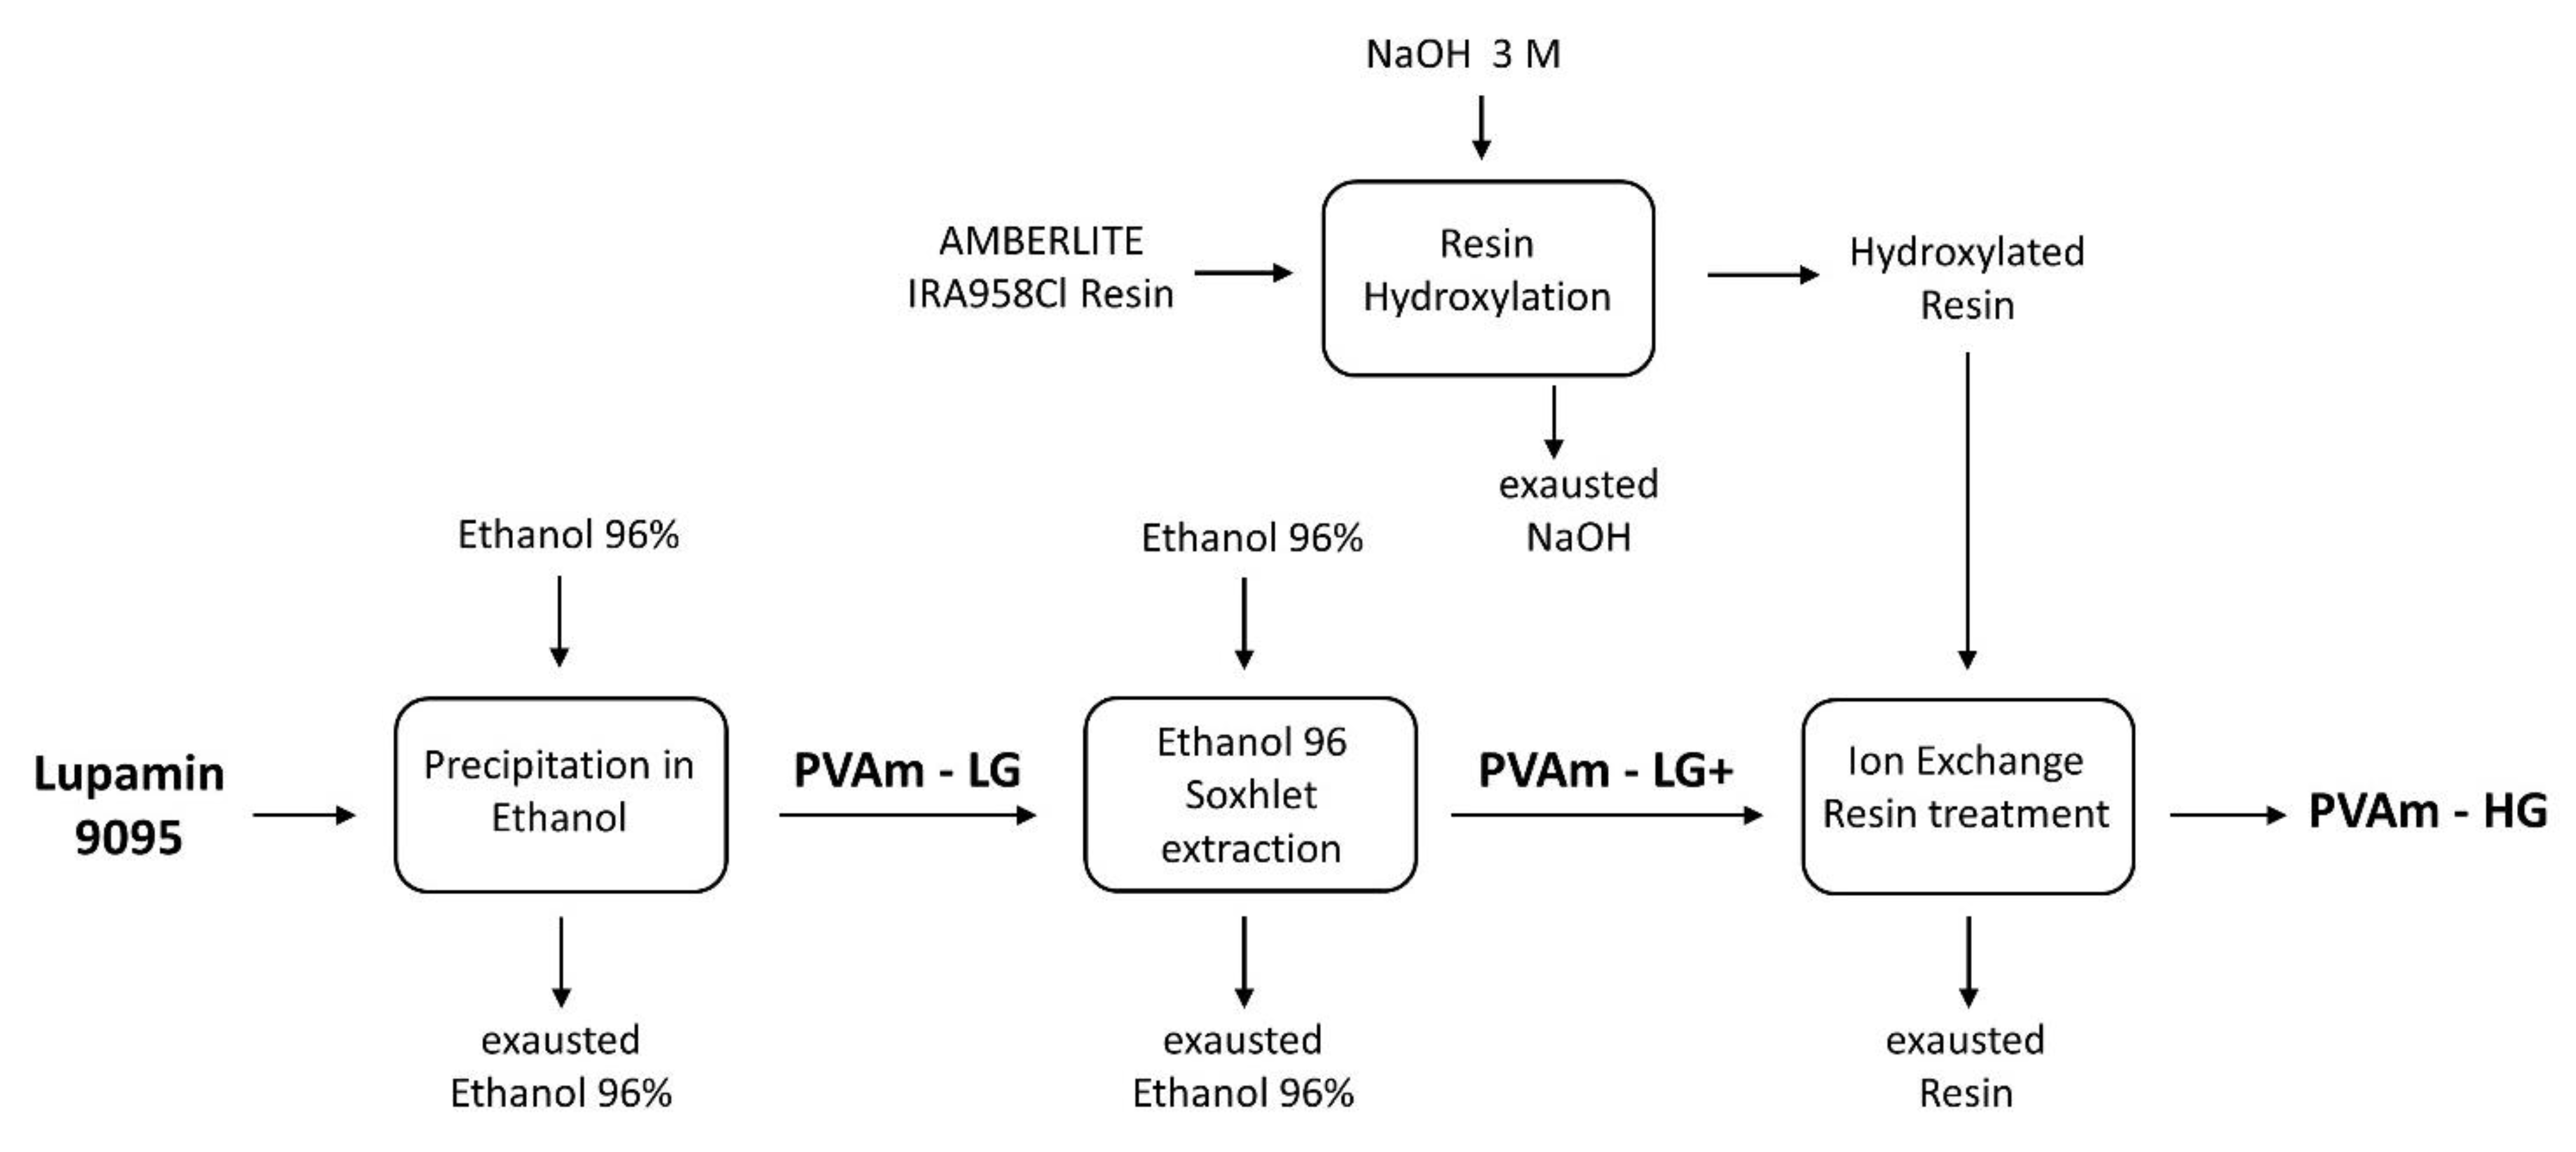
2.1. Purification
2.2. Membrane Preparation
2.3. Chemical-Physical Characterization
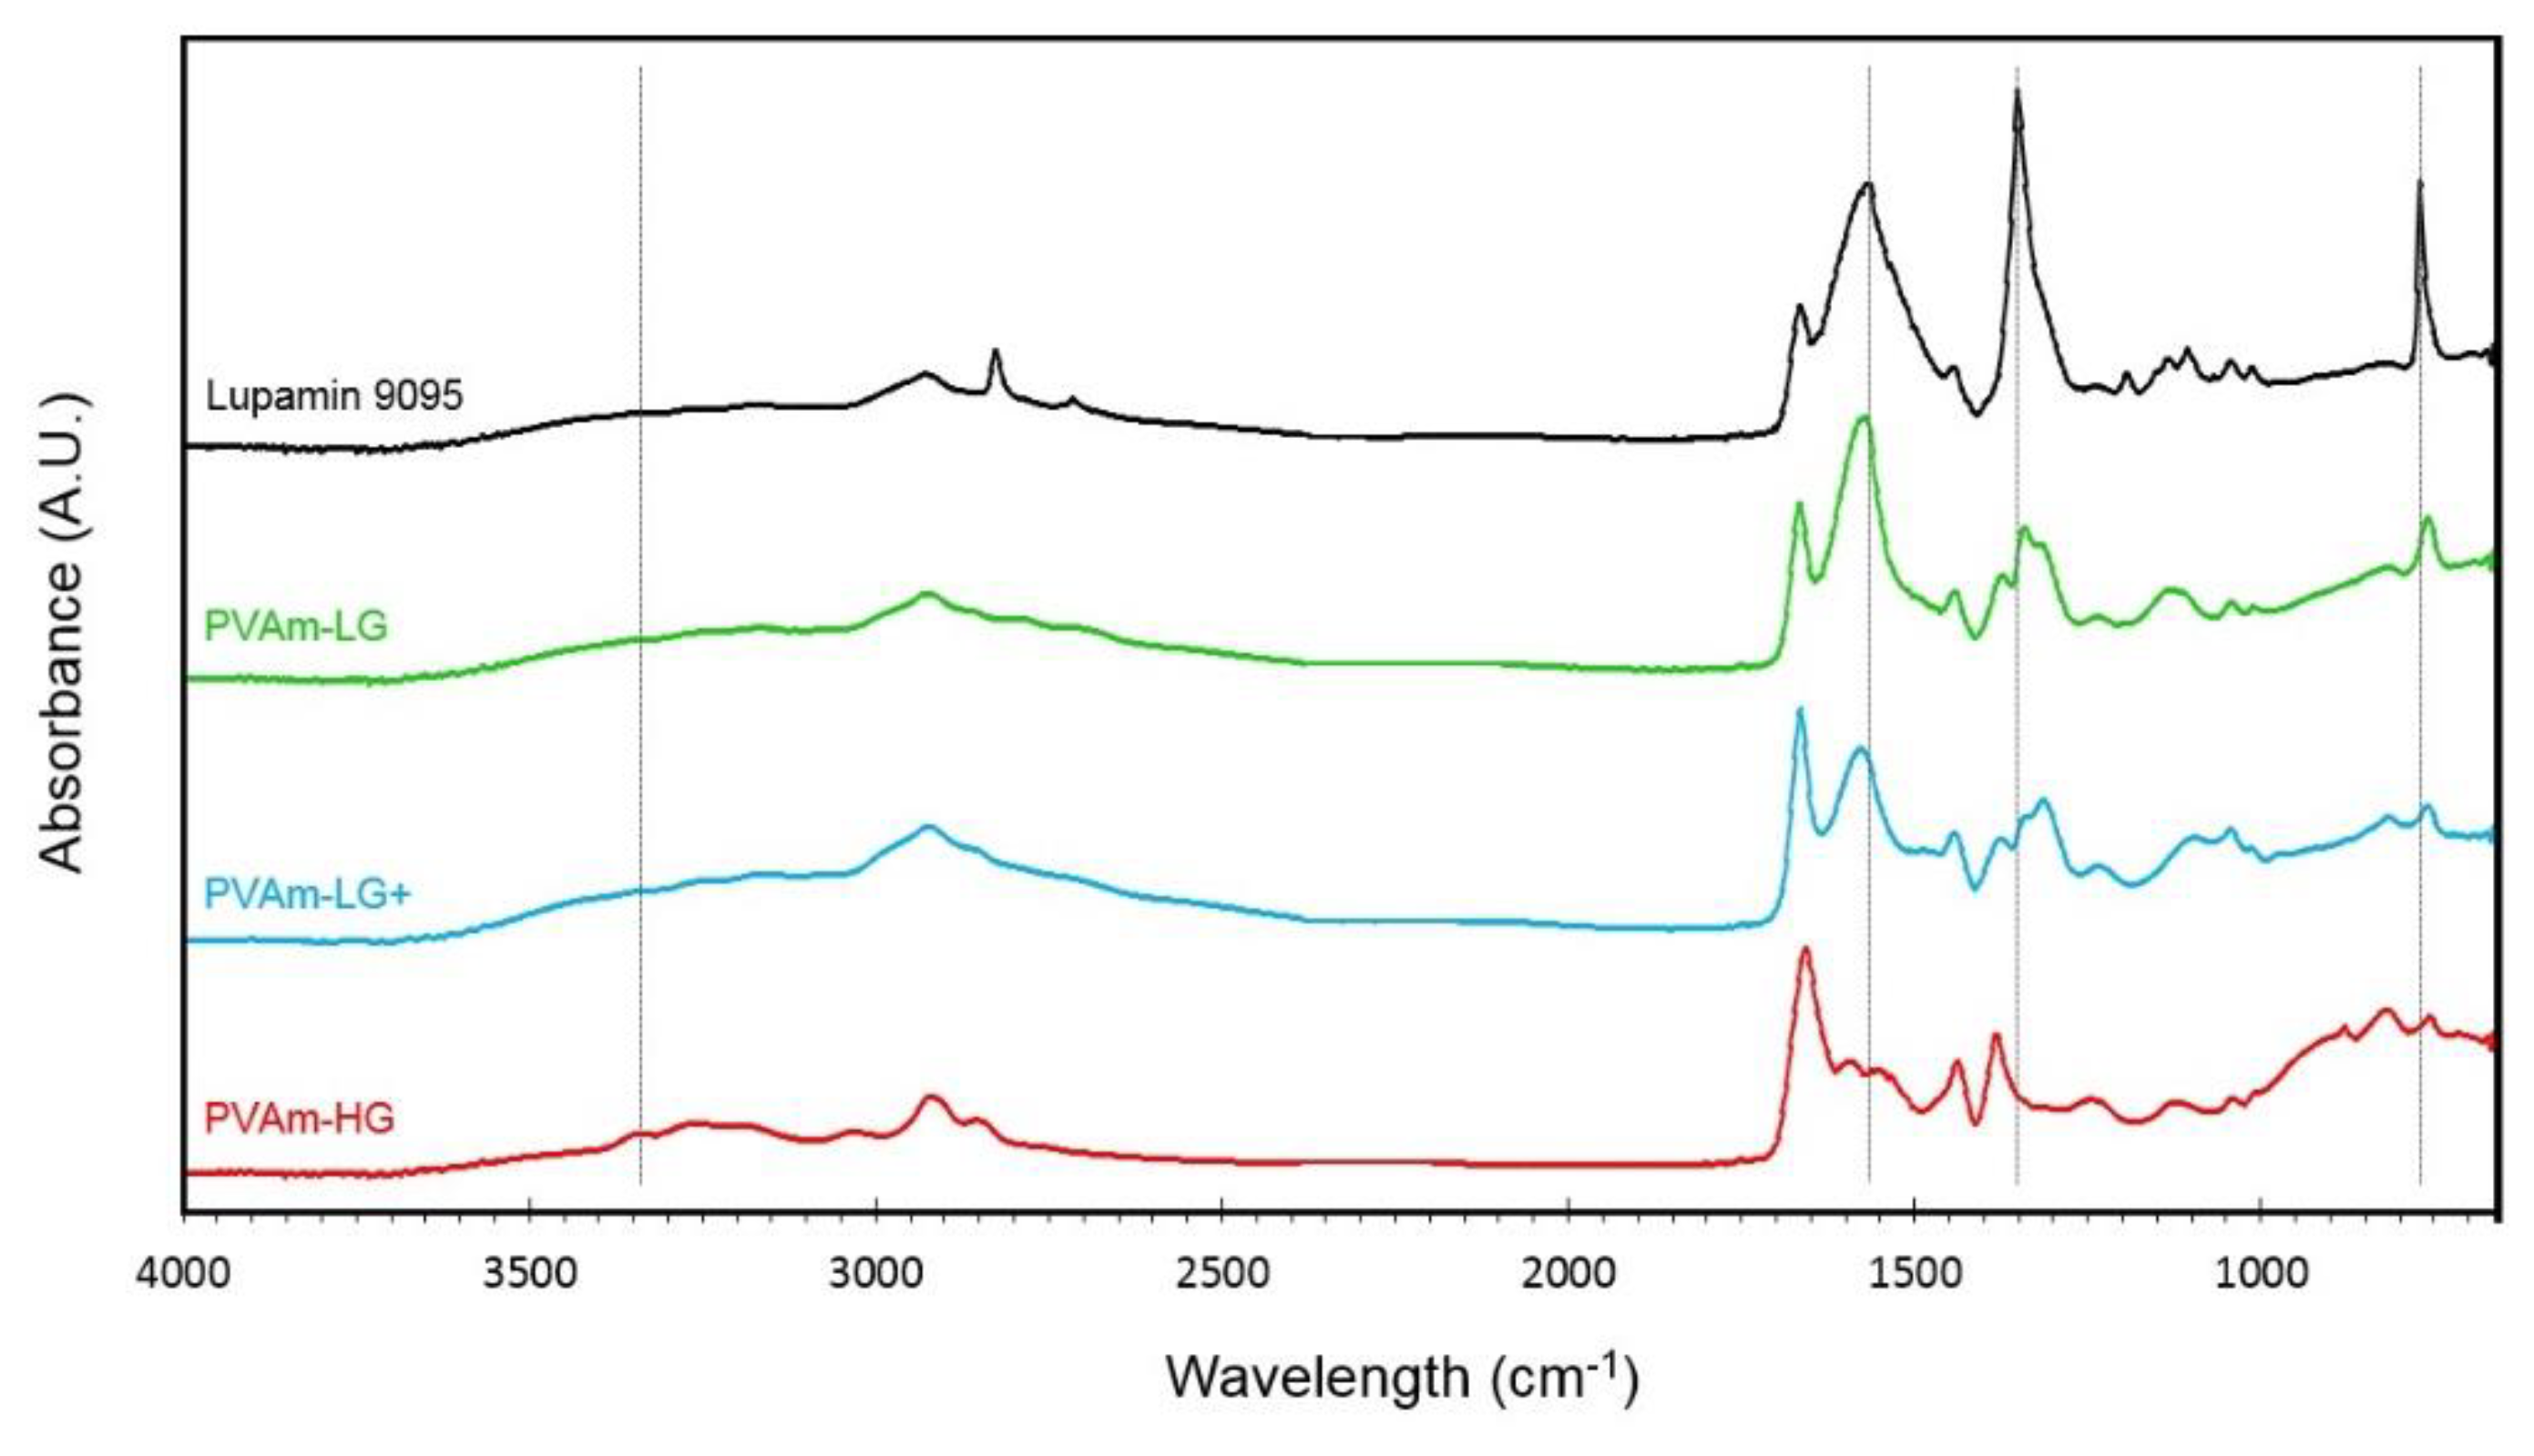
2.3.1. FTIR-ATR
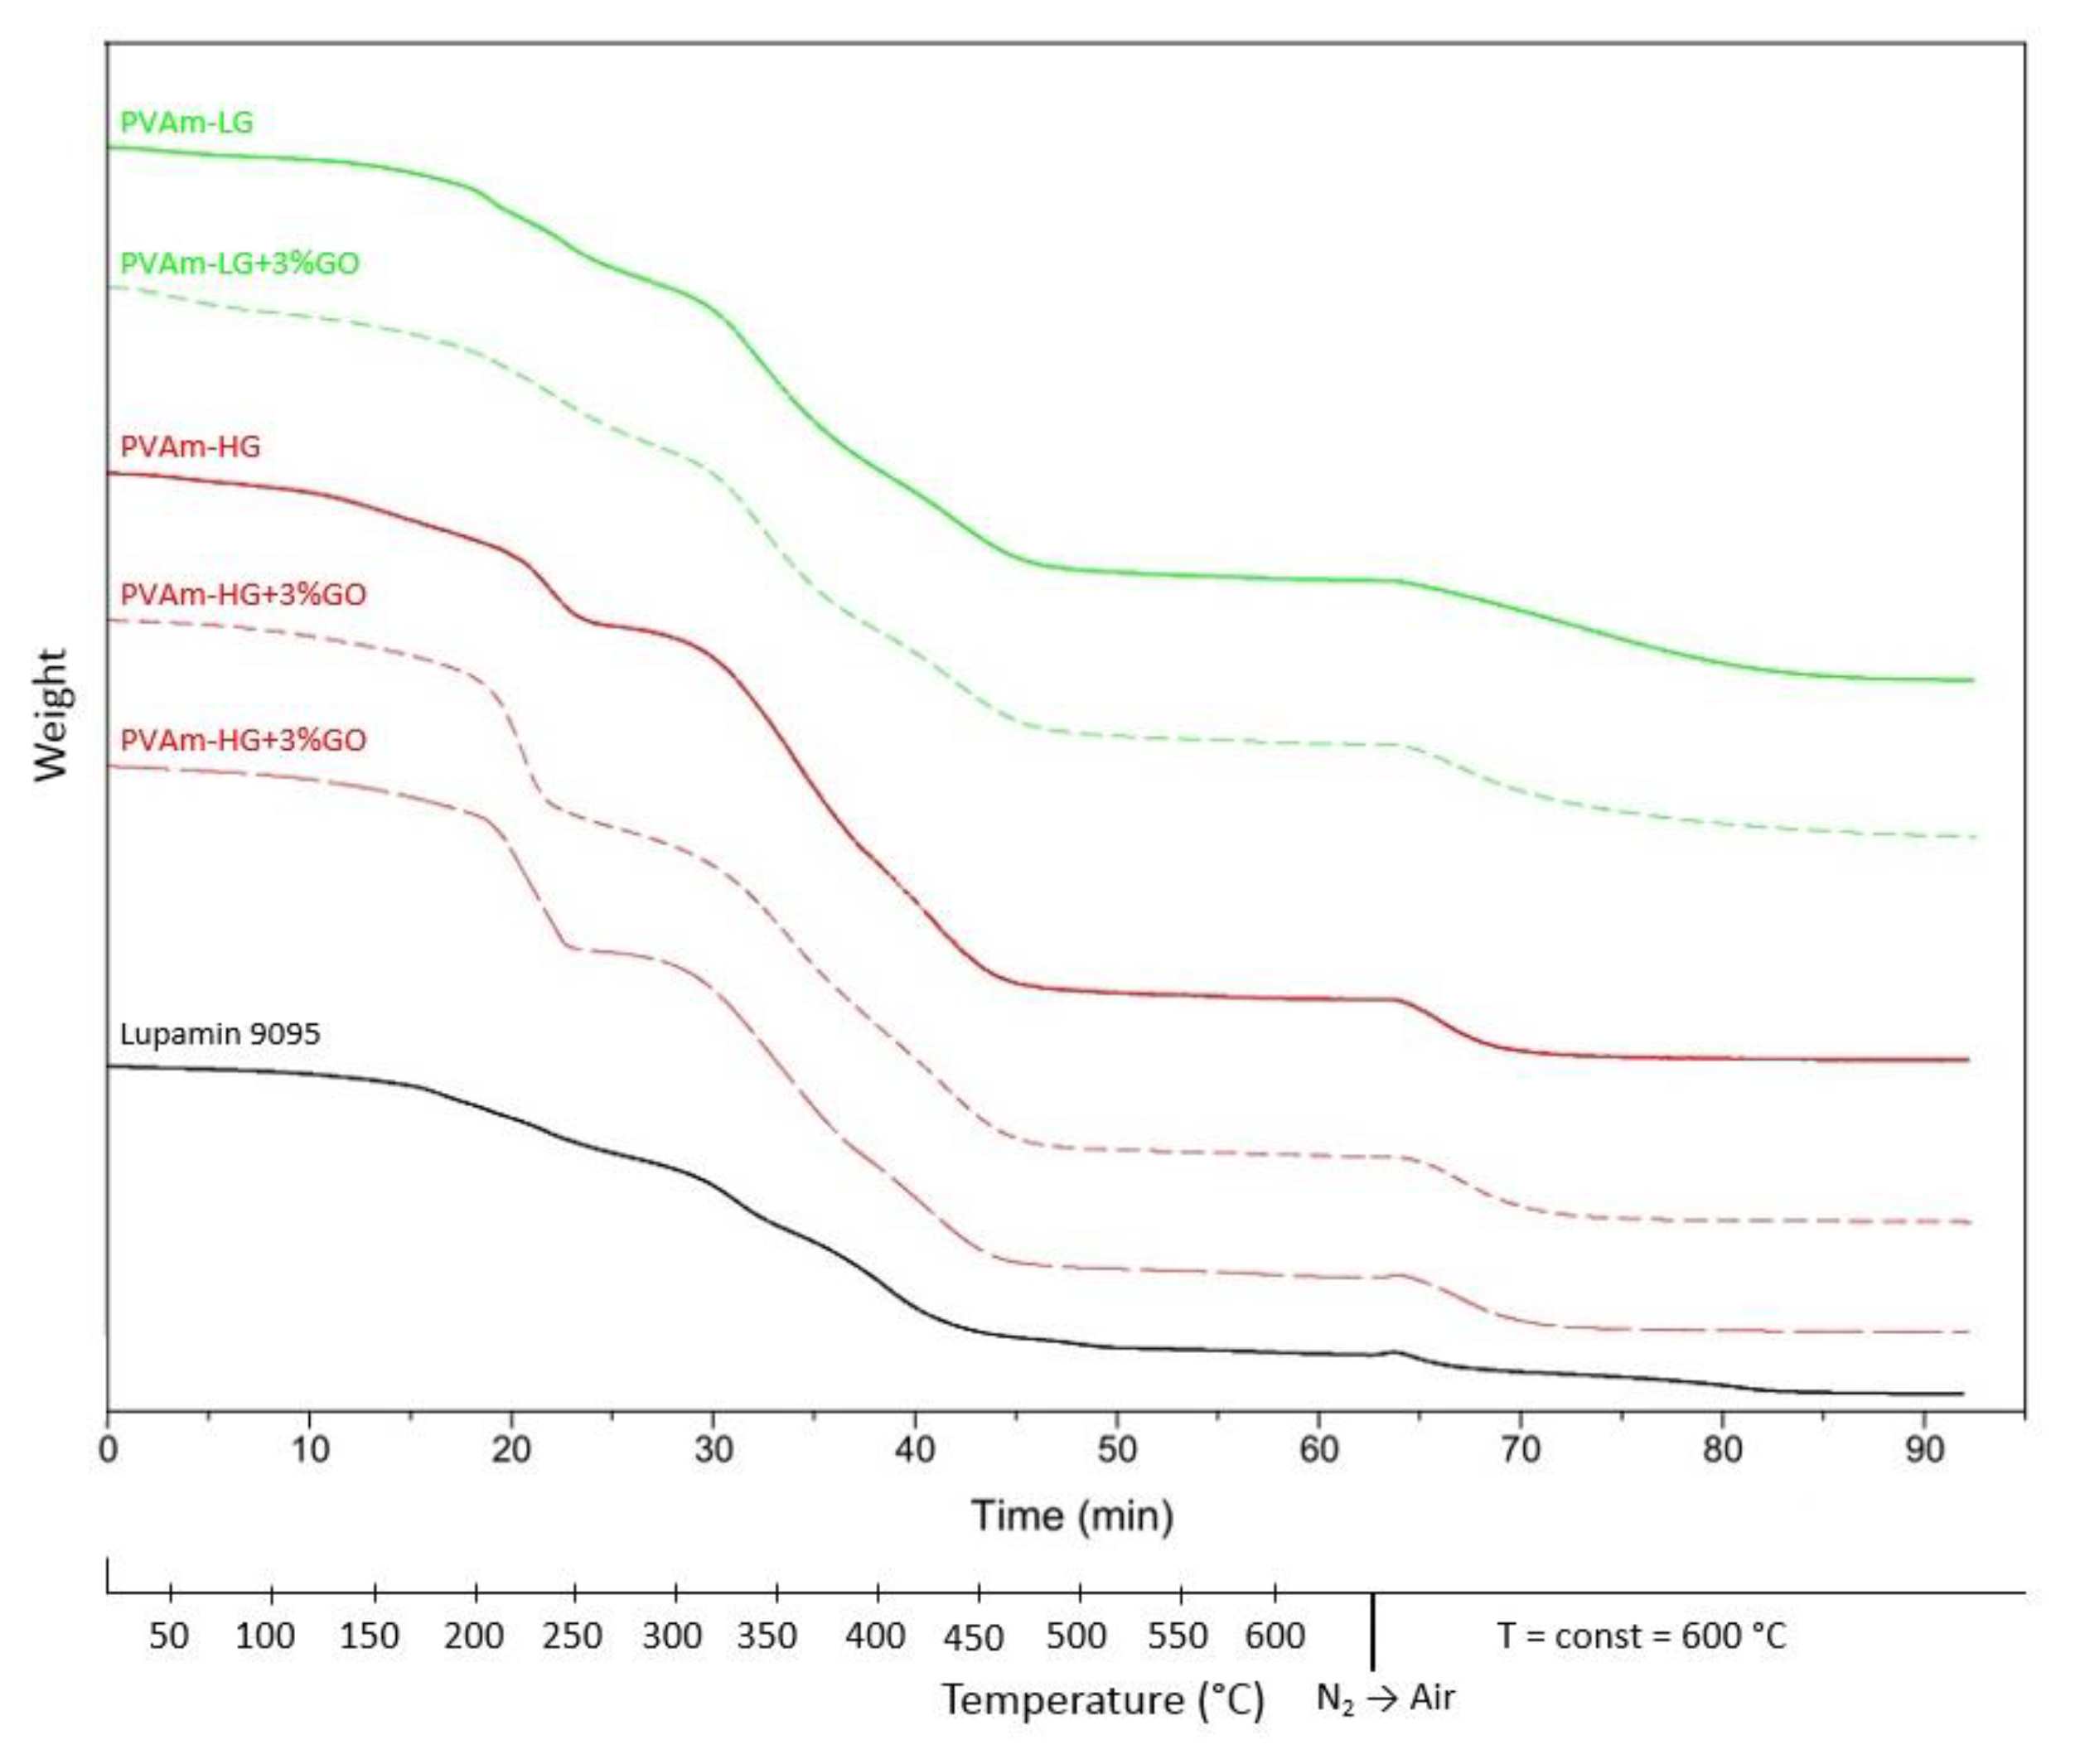
2.3.2. TGA
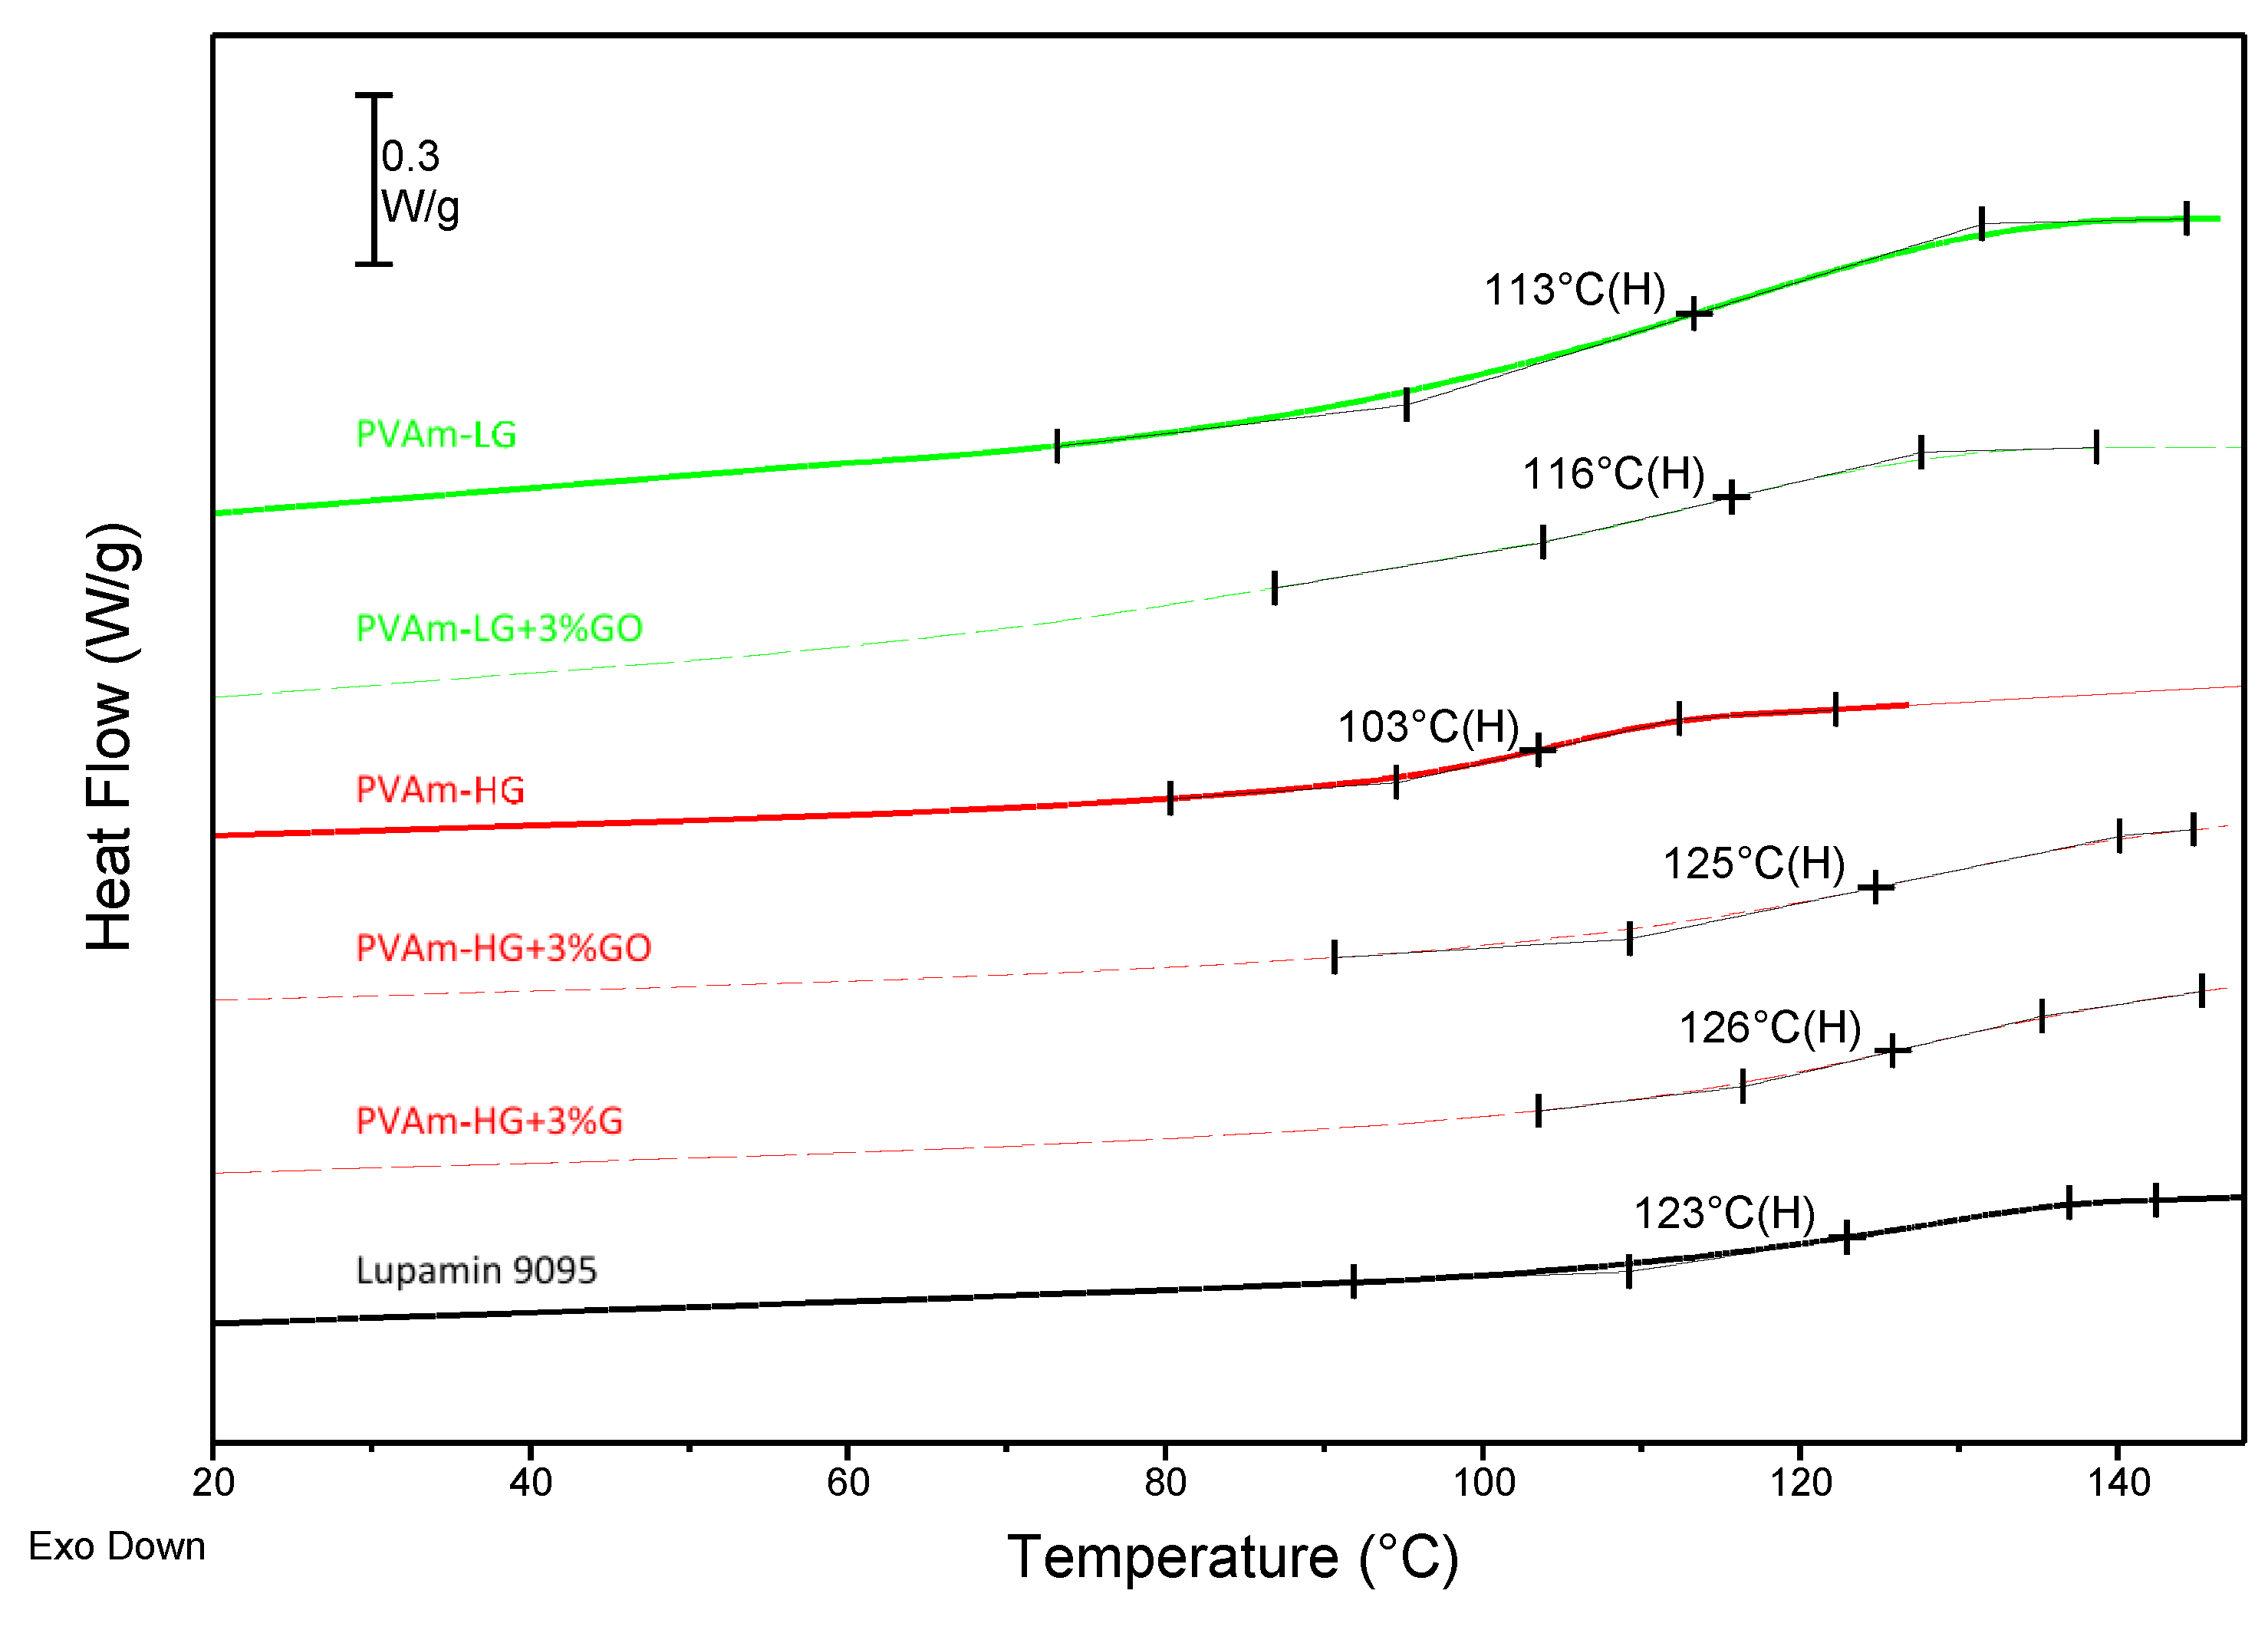
2.3.3. DSC
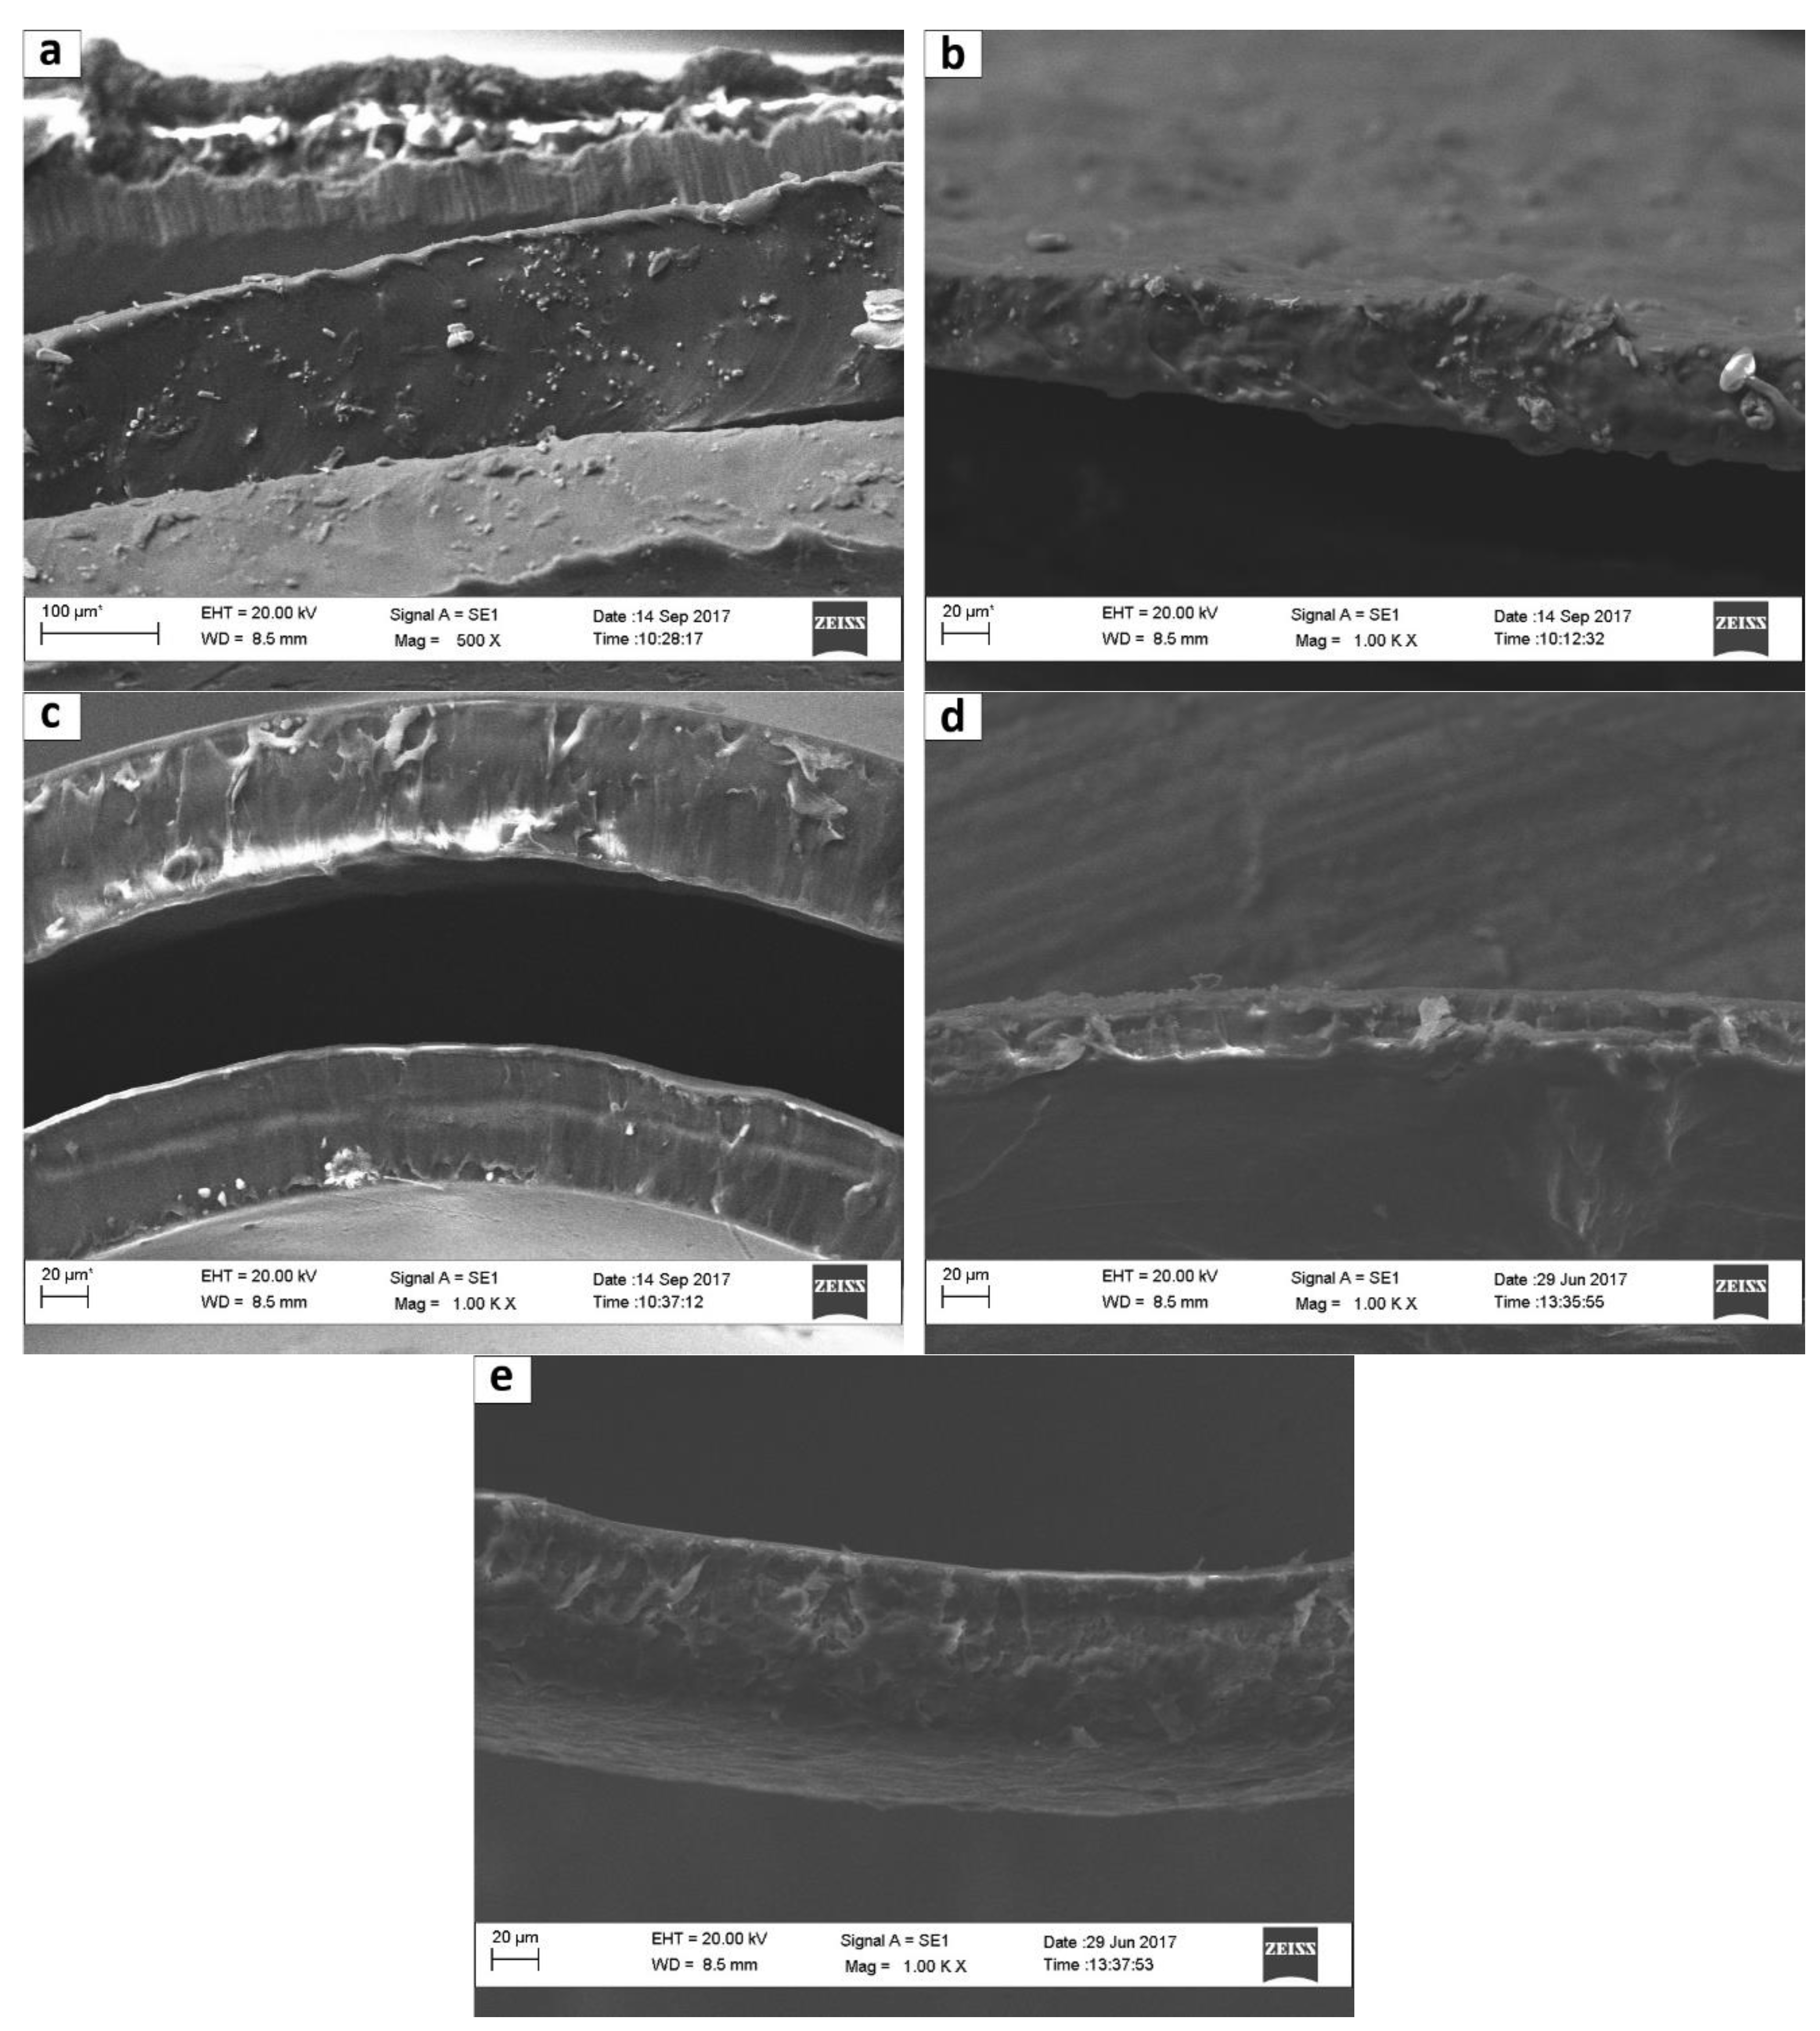
2.3.4. SEM
2.4. Mass Transport Properties
2.4.1. Water Sorption
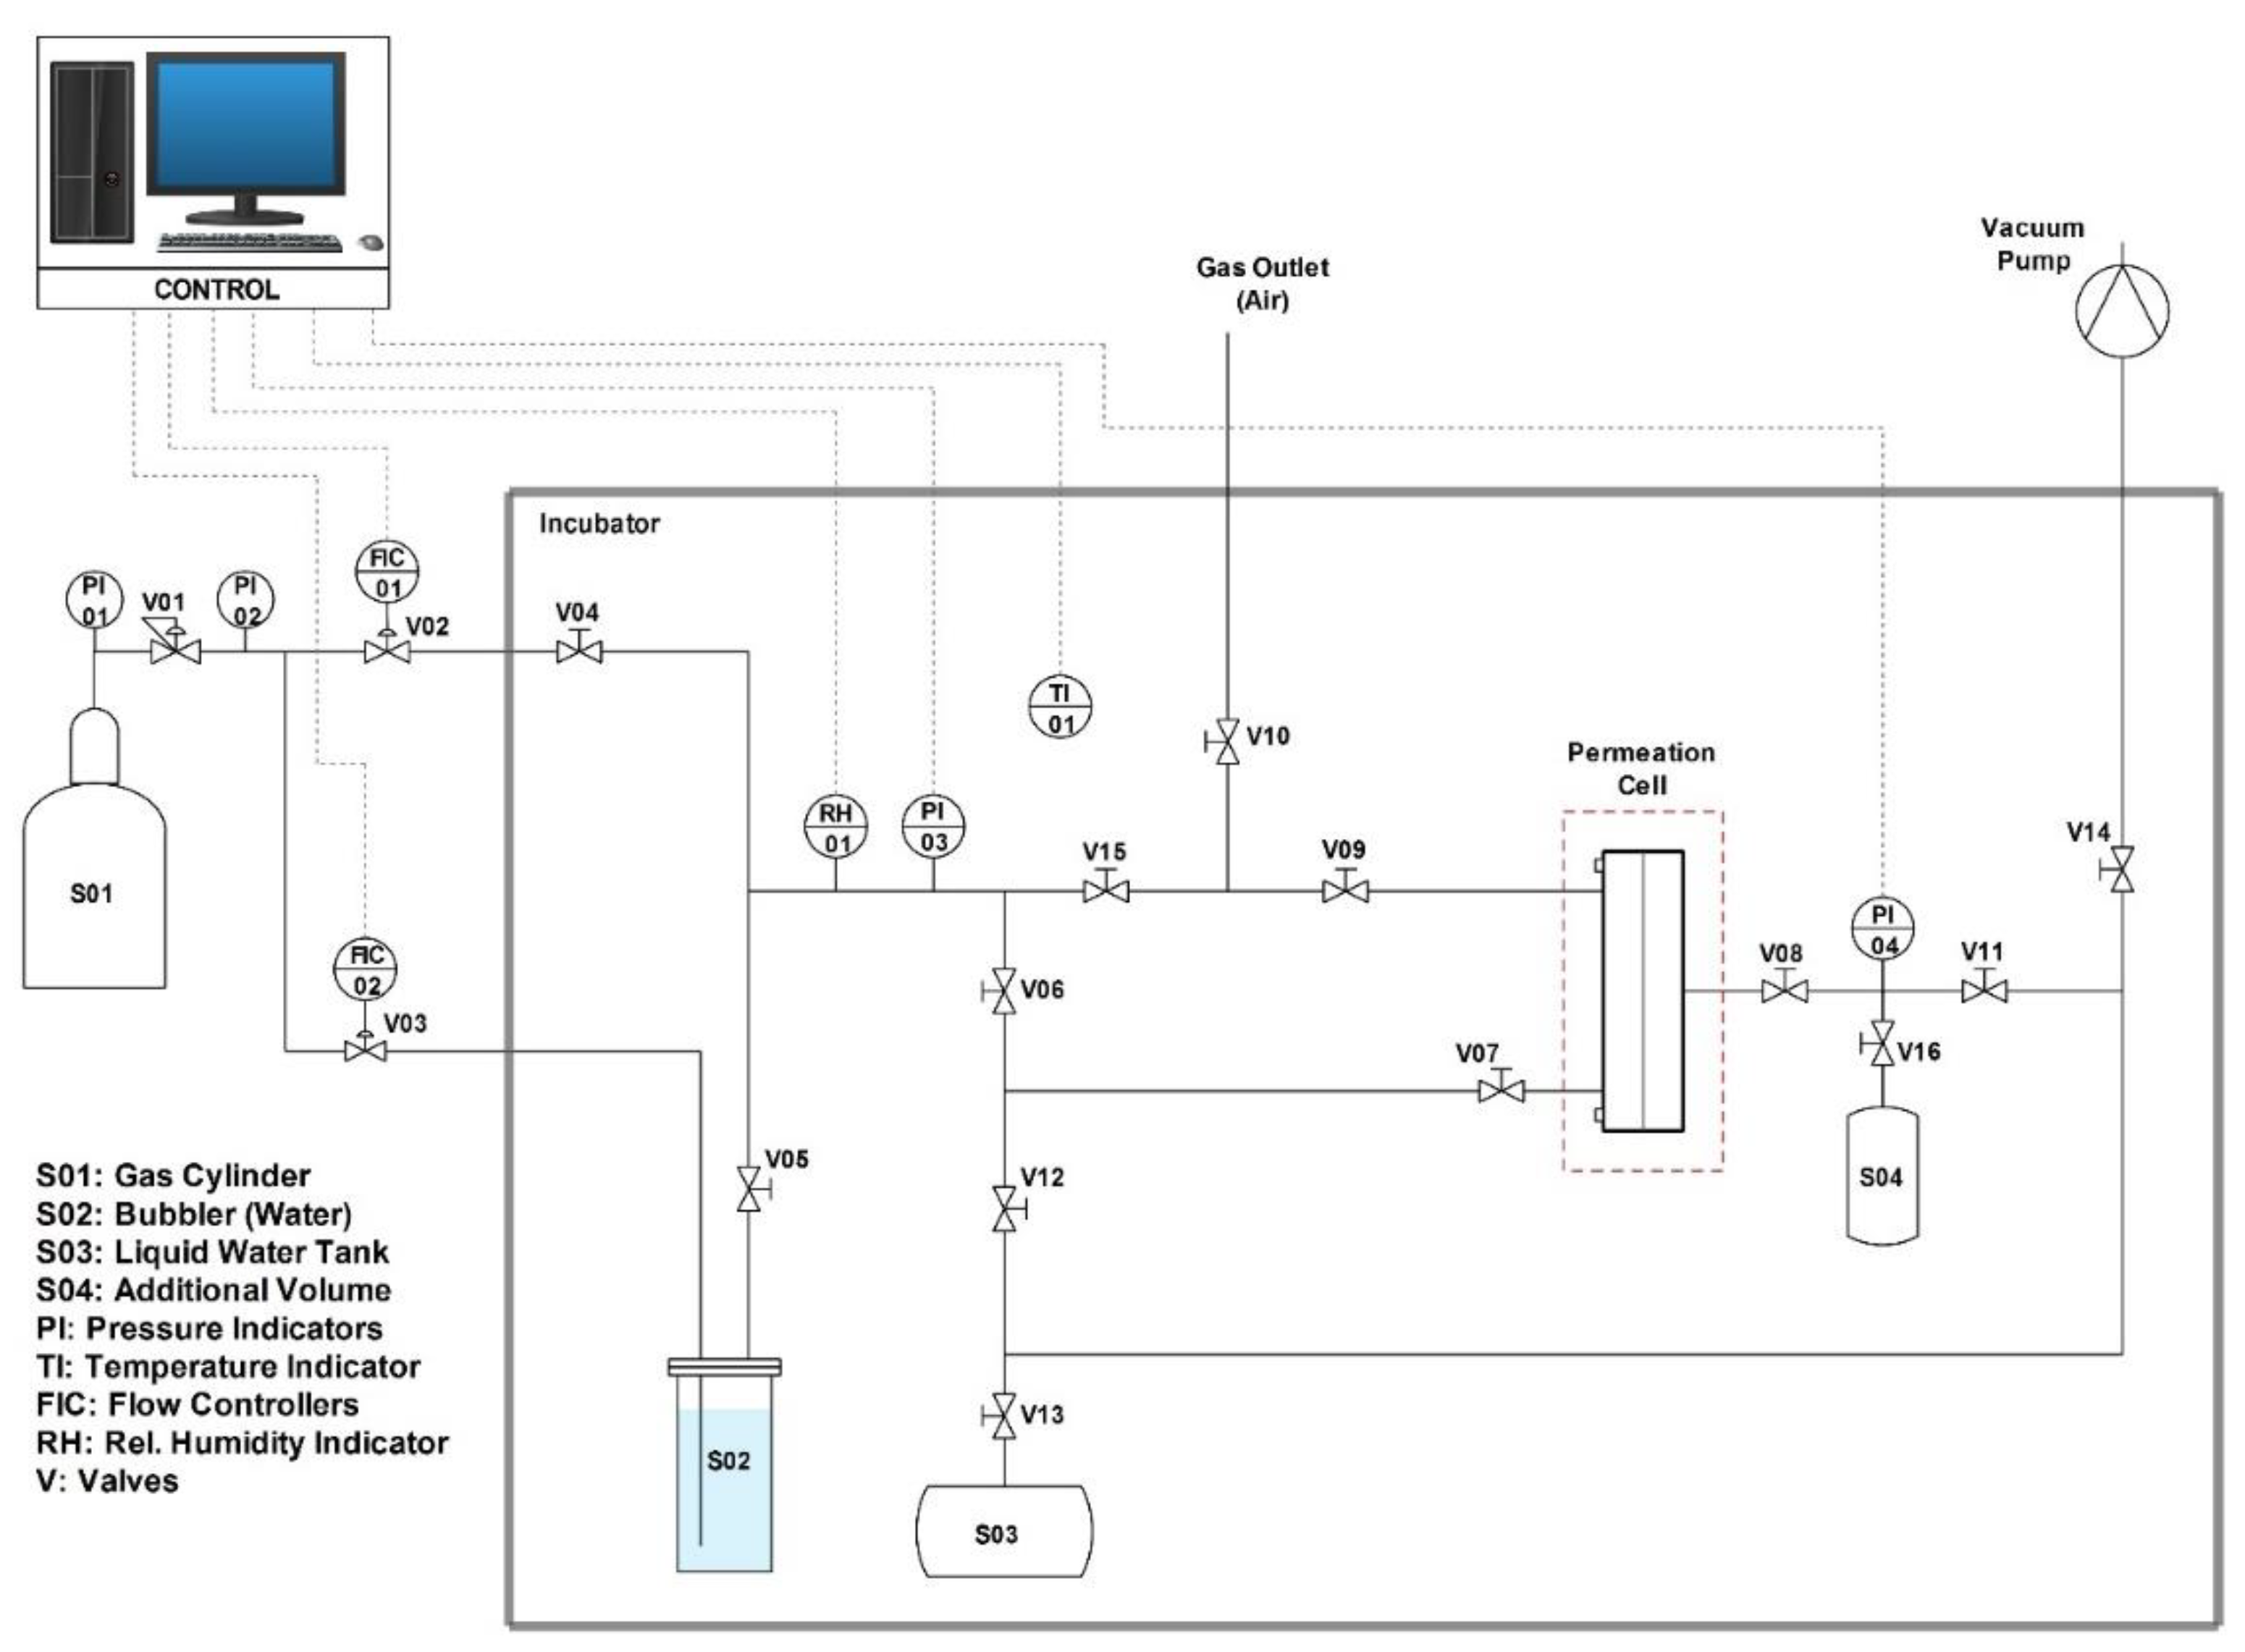
2.4.2. Gas Permeation
3. Results and Discussion
3.1. Chemical-Physical Characterization
3.1.1. FTIR-ATR Characterization
3.1.2. Thermal Characterization
3.1.3. SEM Results
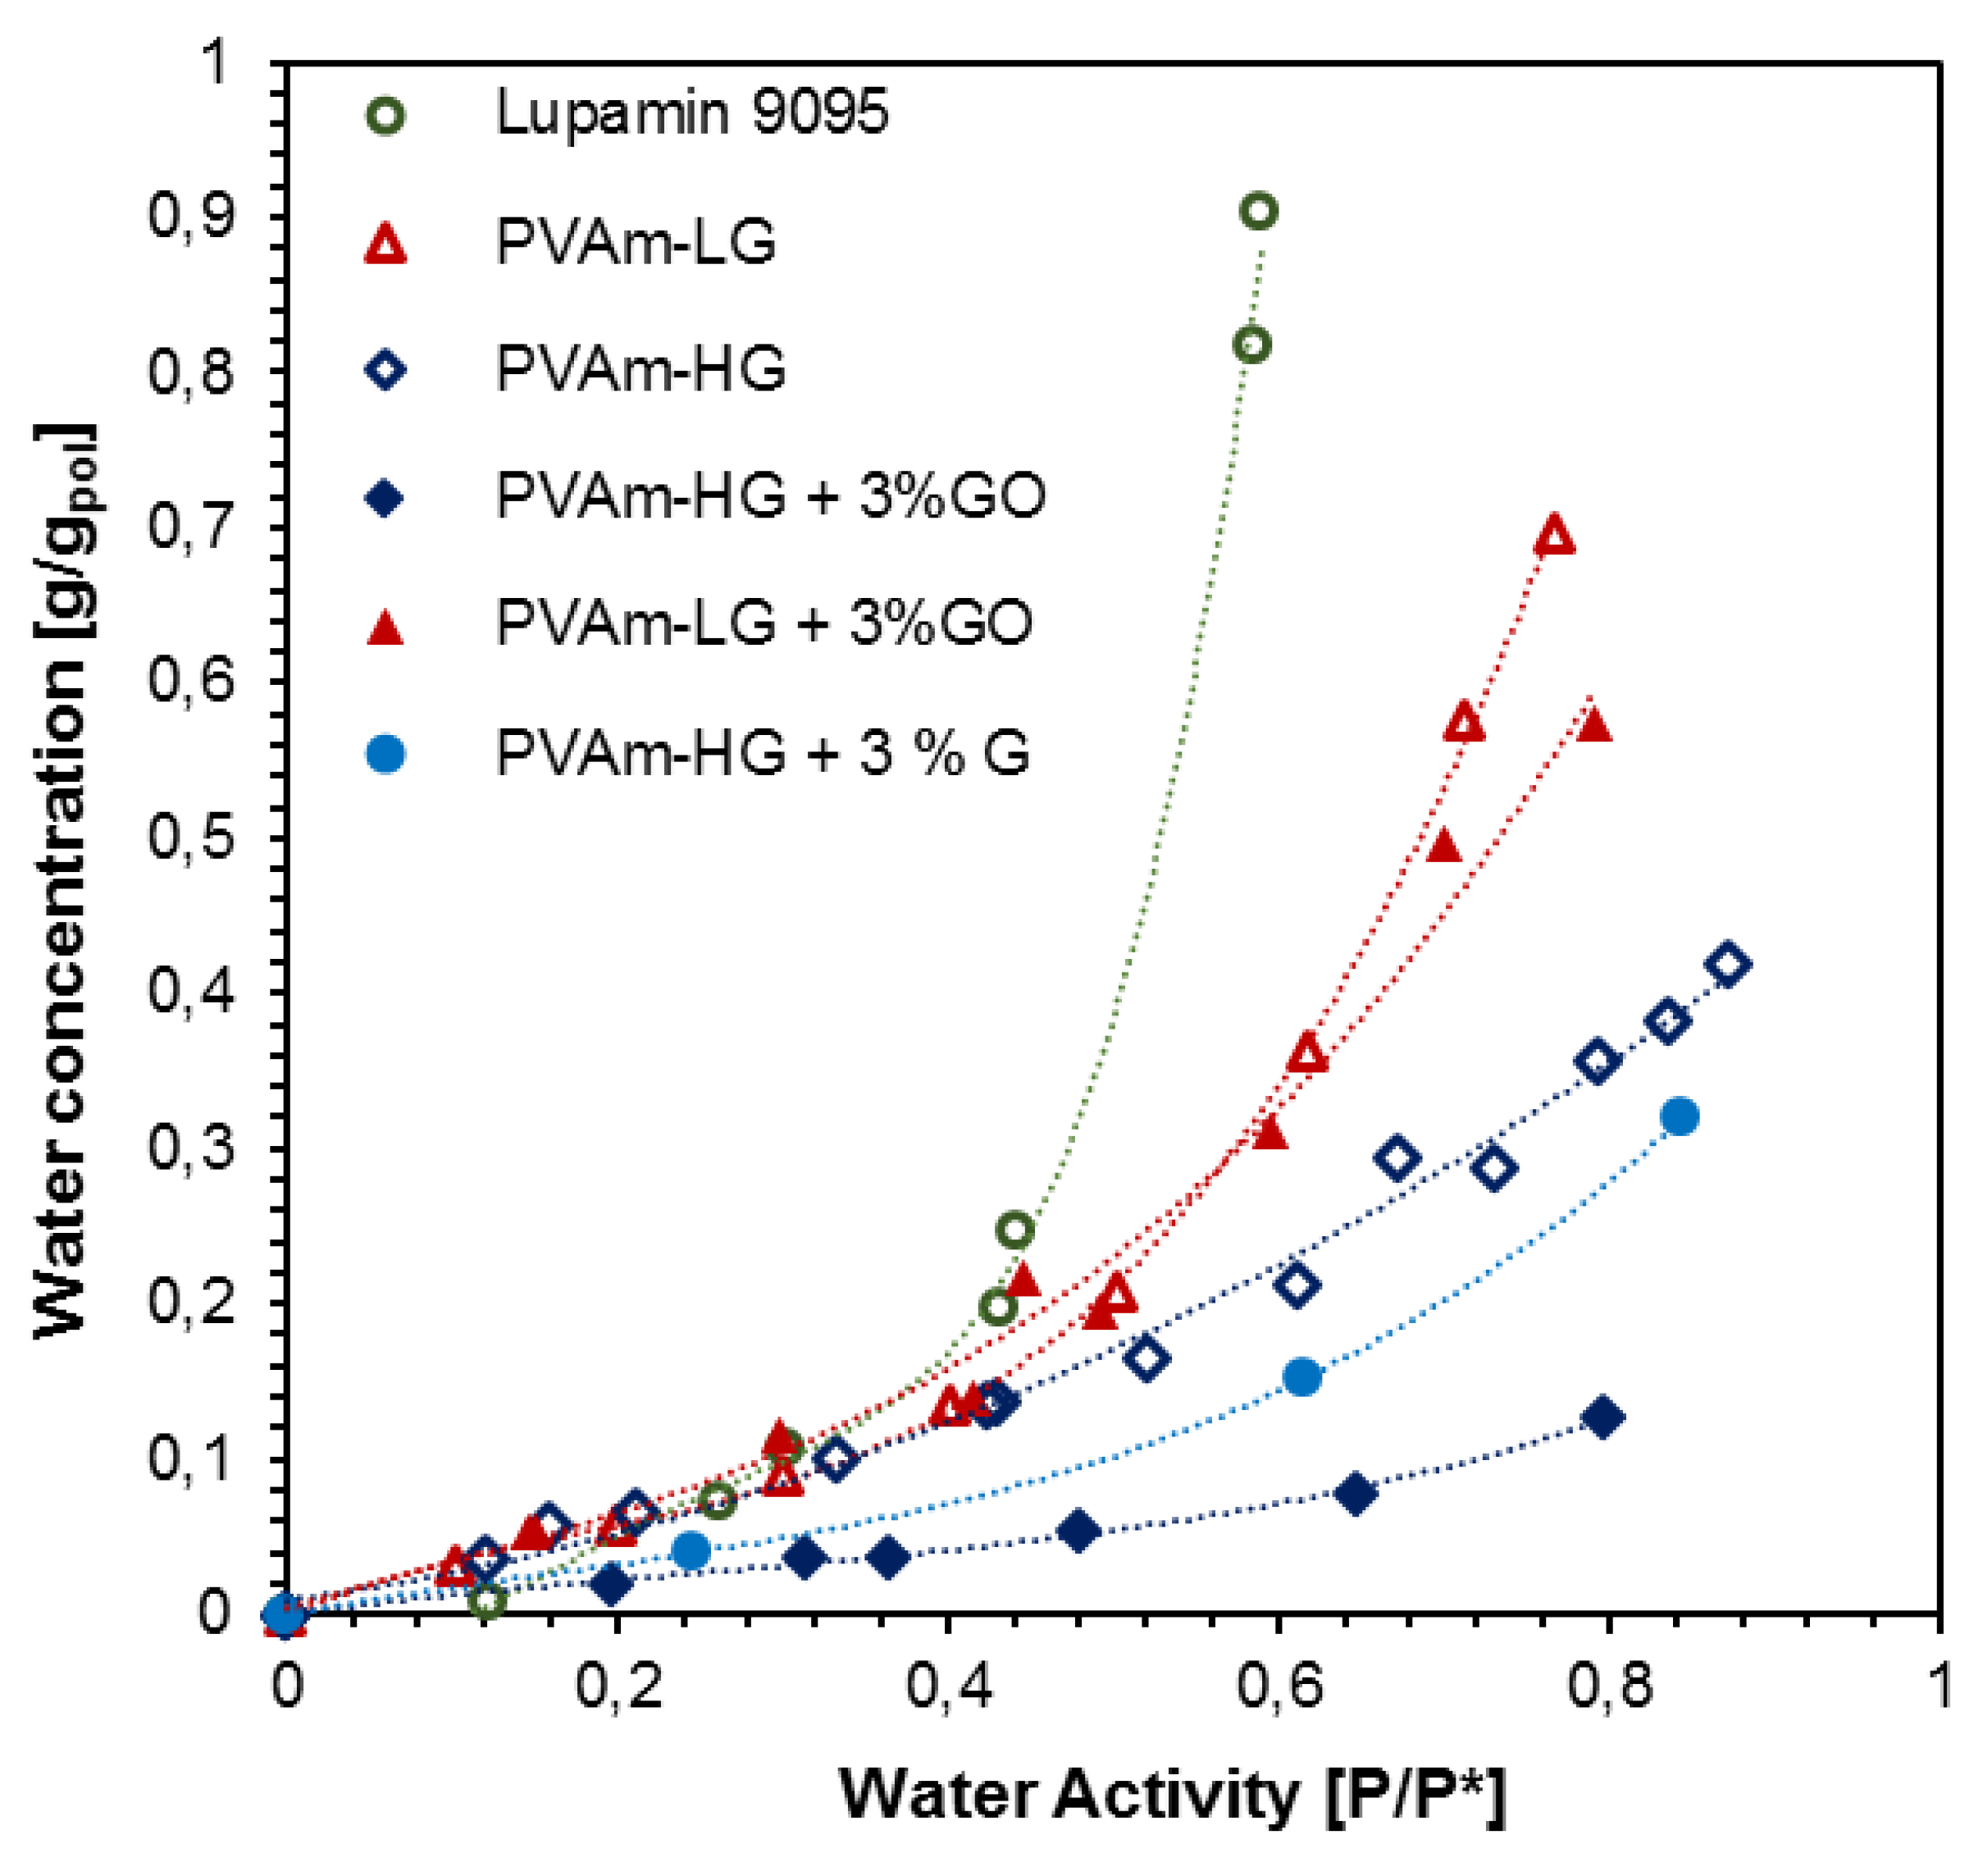
3.1.4. Water Sorption Results
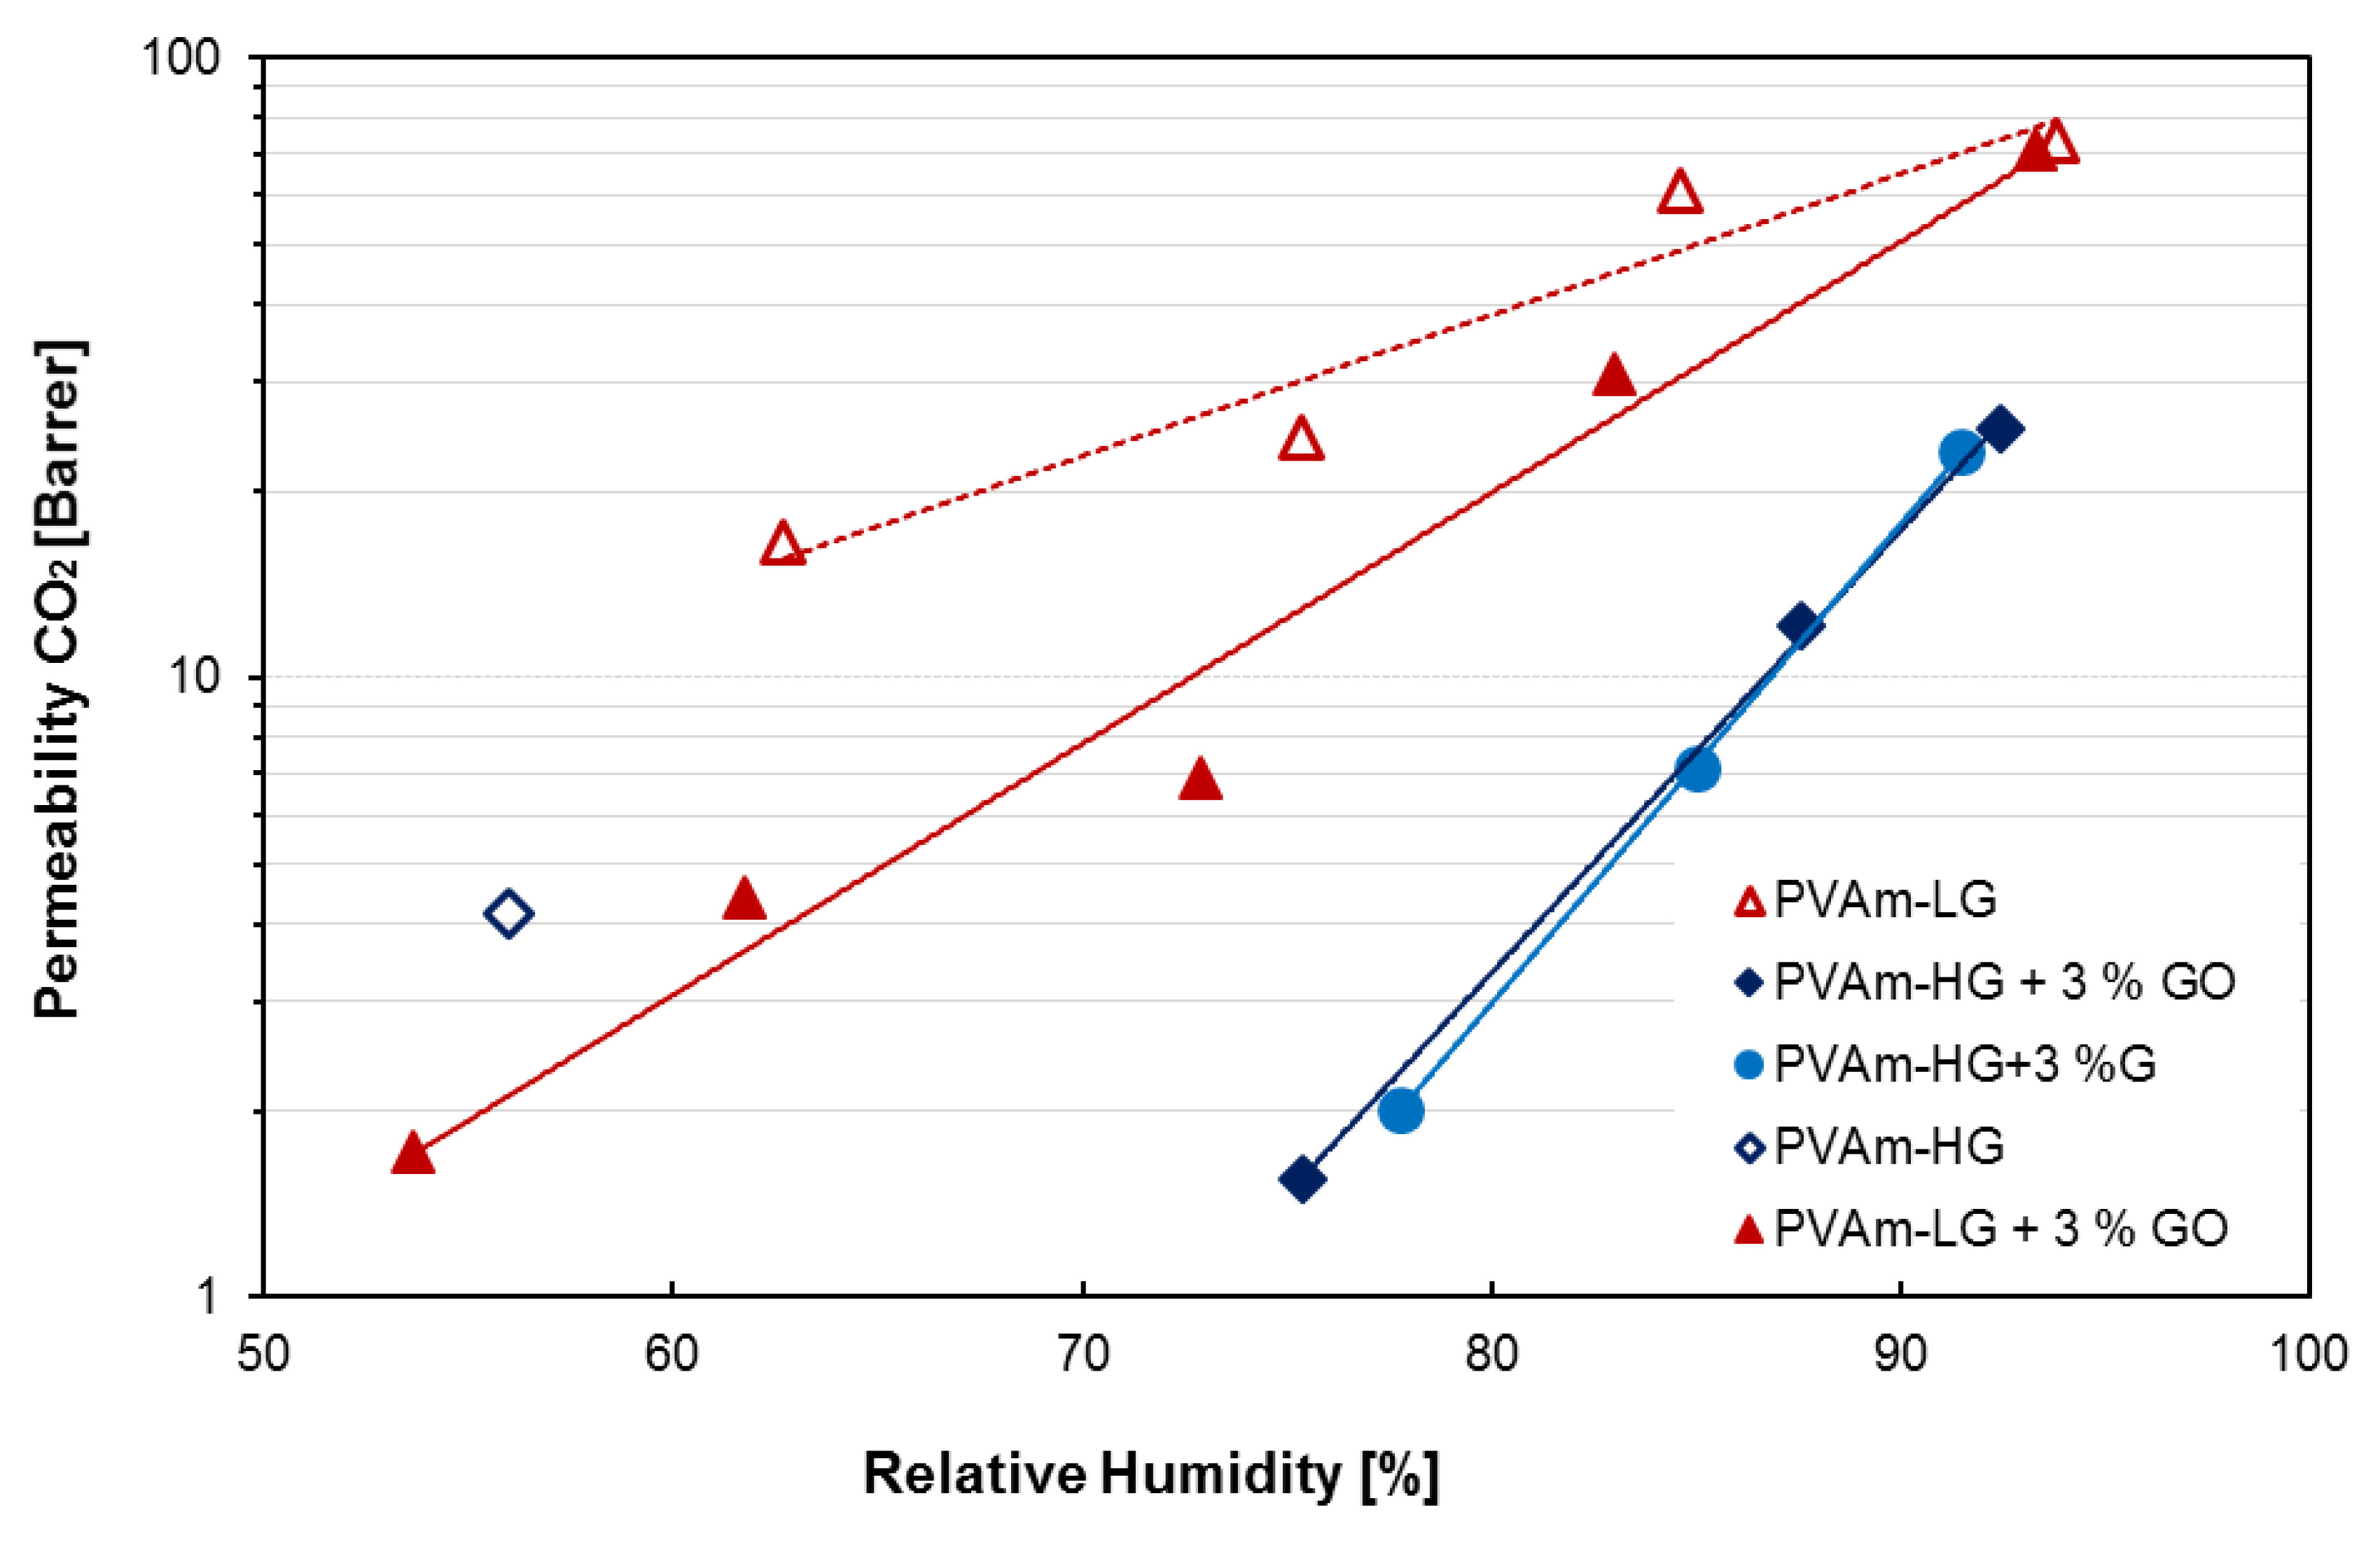
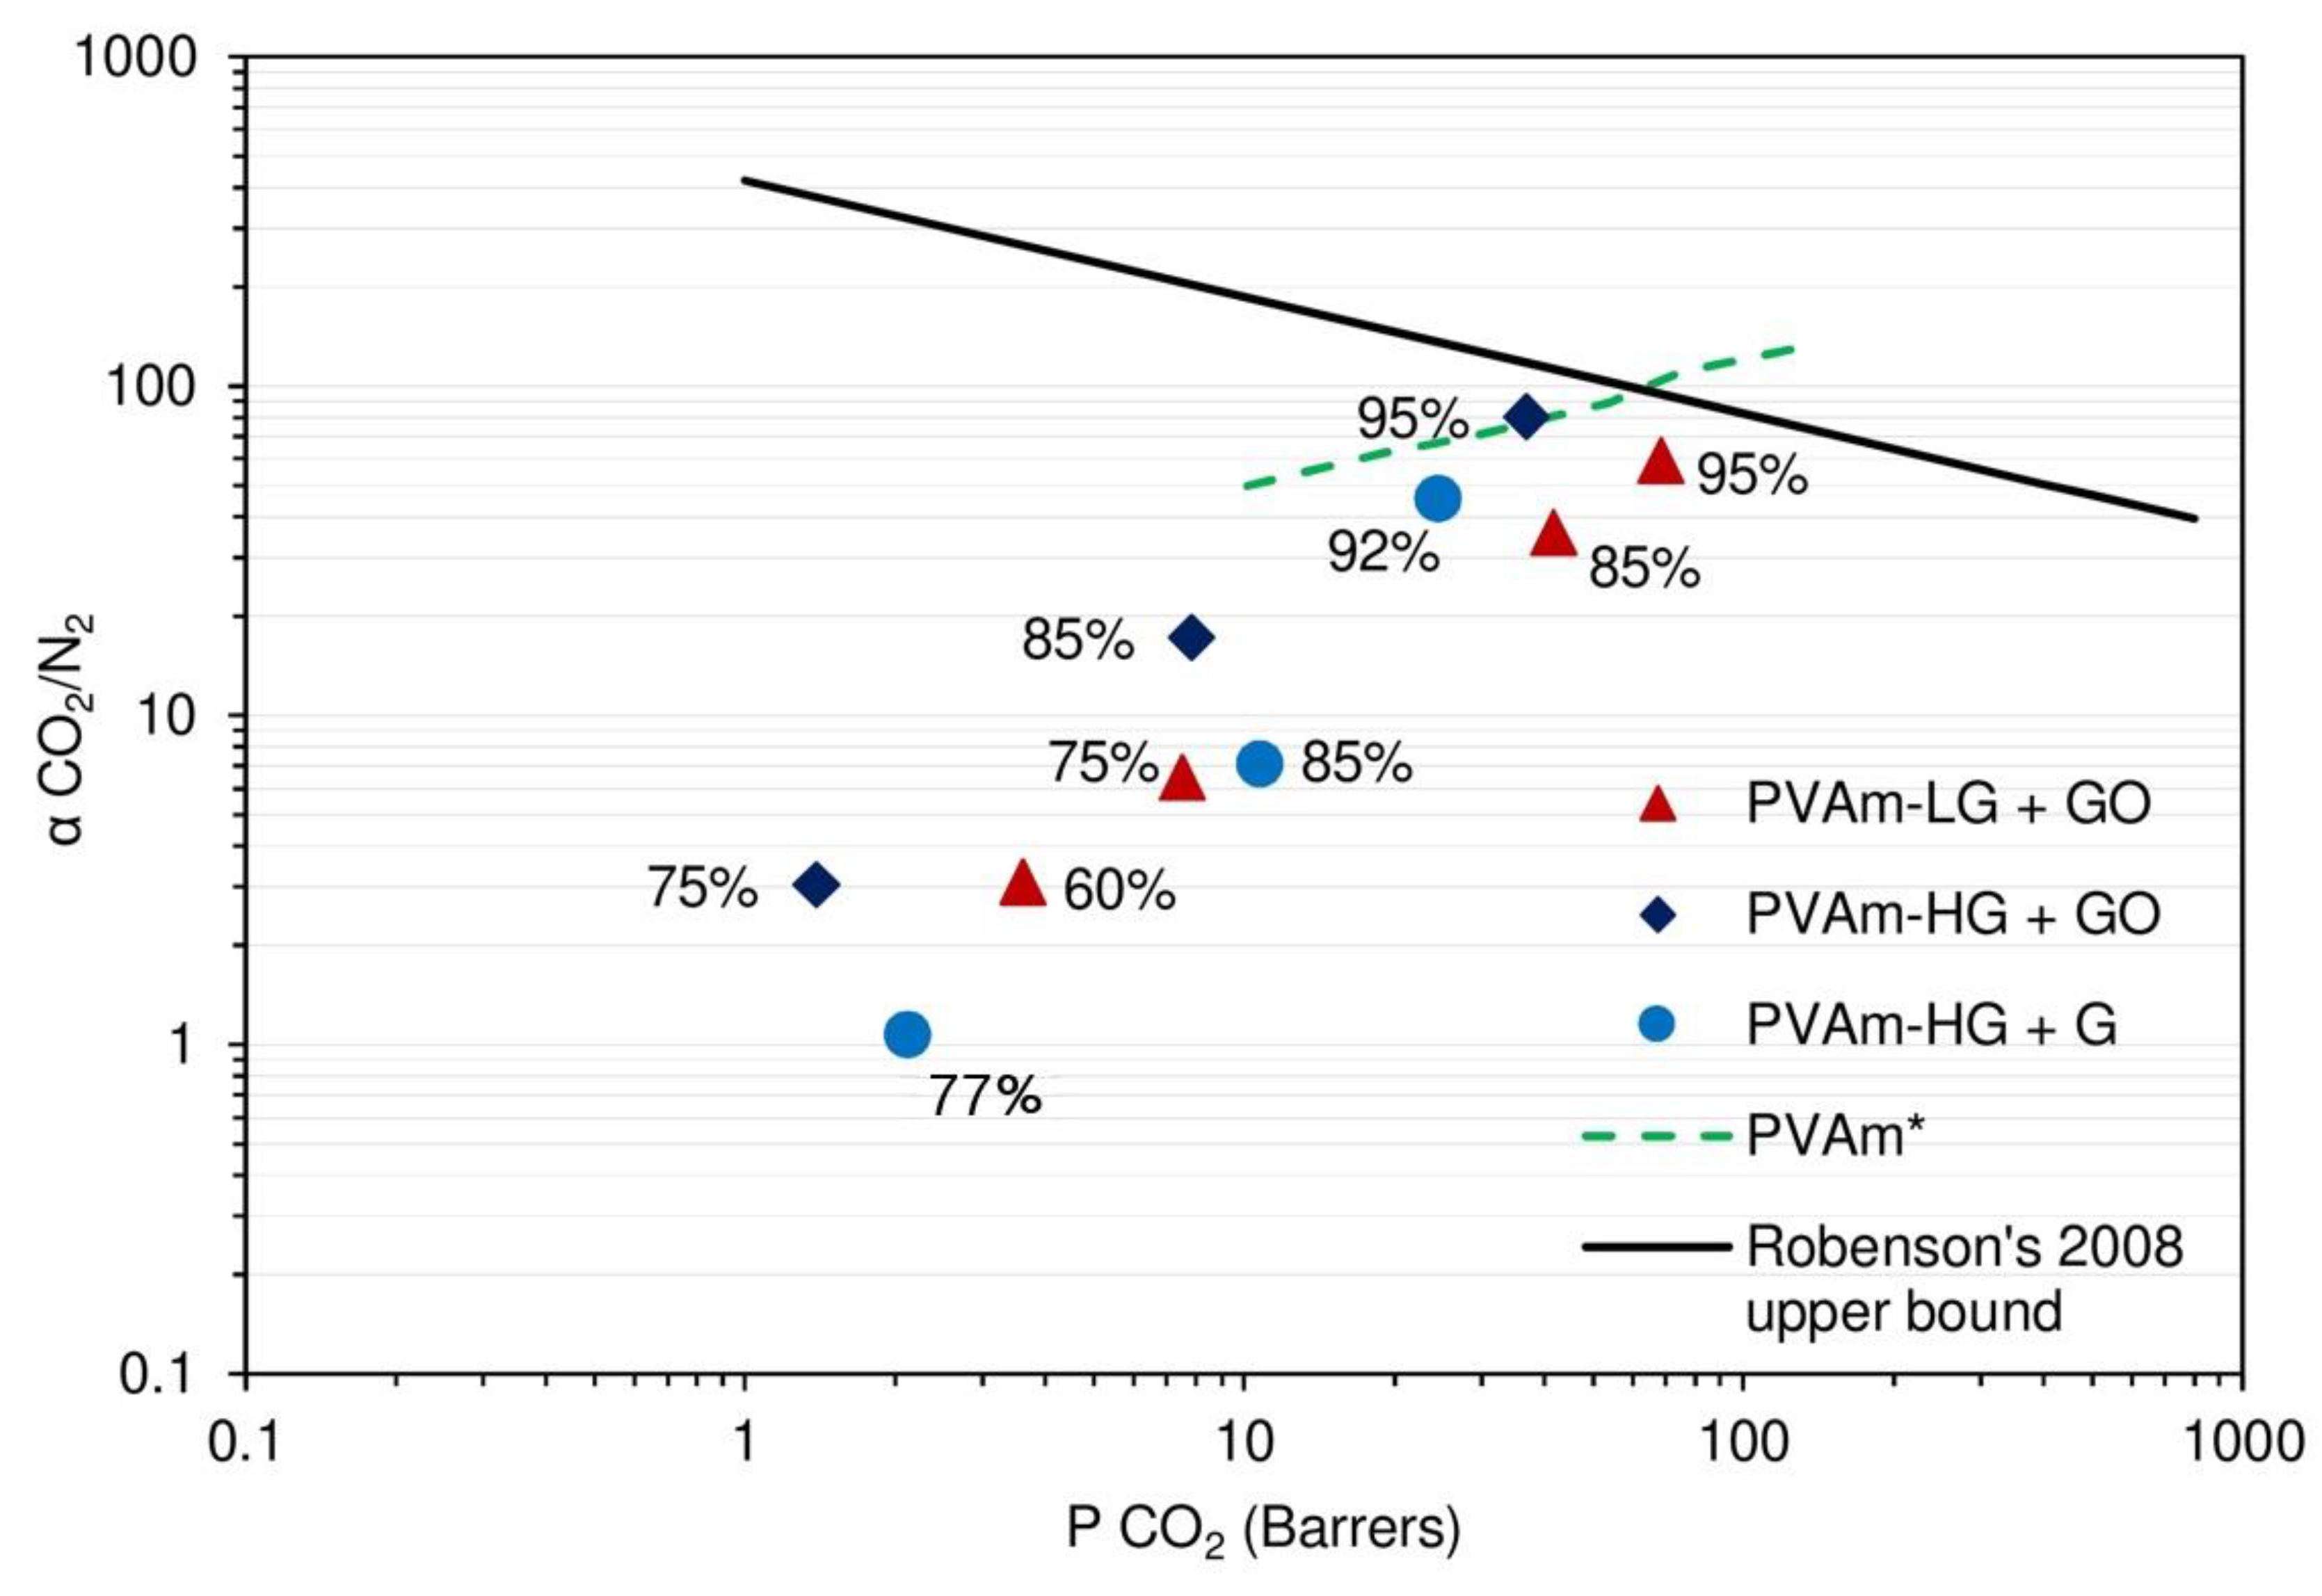
3.2. Permeation Results
4. Conclusions
Author Contributions
Funding
Conflicts of Interest
References
- Intergovernmental Panel on Climate Change. Fifth Assessment Report, Synthesis Report 2015. Available online: https://www.ipcc.ch/assessment-report/ar5/ (accessed on 11 September 2019).
- Intergovernmental Panel on Climate Change. Climate Change 2014: Mitigation of Climate Change; Cambridge University Press: New York, NY, USA, 2014; Available online: https://www.ipcc.ch/report/ar5/wg3/ (accessed on 11 September 2019).
- Shafter, H. NASA Global Temperature Data. Available online: https://climate.nasa.gov/vital-signs/global-temperature (accessed on 30 August 2019).
- Shahbazi, A.; Rezaei Nasab, B. Carbon Capture and Storage (CCS) and its Impacts on Climate Change and Global Warming. J. Pet. Environ. Biotechnol. 2016, 7, 9. [Google Scholar] [CrossRef]
- Rubin, E.S.; Mantripragada, H.; Marks, A.; Versteeg, P.; Kitchin, J. The outlook for improved carbon capture technology. Prog. Energy Combust. Sci. 2012, 38, 630–671. [Google Scholar] [CrossRef]
- Leung, D.Y.C.; Caramanna, G.; Maroto-Valer, M.M. An overview of current status of carbon dioxide capture and storage technologies. Renew. Sustain. Energy Rev. 2014, 39, 426–443. [Google Scholar] [CrossRef] [Green Version]
- Sreedhar, I.; Nahar, T.; Venugopal, A.; Srinivas, B. Carbon capture by absorption—Path covered and ahead. Renew. Sustain. Energy Rev. 2017, 76, 1080–1107. [Google Scholar] [CrossRef]
- Siqueira, R.M.; Freitas, G.R.; Peixoto, H.R.; Nascimento, J.F.D.; Musse, A.P.S.; Torres, A.E.B.; Azevedo, D.C.S.; Bastos-Neto, M. Carbon Dioxide Capture by Pressure Swing Adsorption. Energy Procedia 2017, 114, 2182–2192. [Google Scholar] [CrossRef]
- Khalilpour, R.; Mumford, K.; Zhai, H.; Abbas, A.; Stevens, G.; Rubin, E.S. Membrane-Based carbon capture from flue gas: A review. J. Clean. Prod. 2015, 103, 286–300. [Google Scholar] [CrossRef]
- Sreedhar, I.; Vaidhiswaran, R.; Kamani, B.M.; Venugopal, A. Process and engineering trends in membrane based carbon capture. Renew. Sustain. Energy Rev. 2017, 68, 659–684. [Google Scholar] [CrossRef]
- Xie, H.; Liang, B.; Yue, H.; Wang, Y. Carbon Dioxide Capture by Electrochemical Mineralization. Chem 2018, 4, 24–26. [Google Scholar] [CrossRef]
- Benhelal, E.; Rashid, M.I.; Rayson, M.S.; Prigge, J.D.; Molloy, S.; Brent, G.F.; Cote, A.; Stockenhuber, M.; Kennedy, E.M. Study on mineral carbonation of heat activated lizardite at pilot and laboratory scale. J. CO2 Util. 2018, 26, 230–238. [Google Scholar] [CrossRef]
- Knapik, E.; Kosowski, P.; Stopa, J. Cryogenic liquefaction and separation of CO2 using nitrogen removal unit cold energy. Chem. Eng. Res. Des. 2018, 131, 66–79. [Google Scholar] [CrossRef]
- Swisher, J.A.; Bhown, A.S. Analysis and optimal design of membrane-Based CO2 capture processes for coal and natural gas-Derived flue gas. Energy Procedia 2014, 63, 225–234. [Google Scholar] [CrossRef]
- Hussain, A.; Hägg, M.B. A feasibility study of CO2 capture from flue gas by a facilitated transport membrane. J. Membr. Sci. 2010, 359, 140–148. [Google Scholar] [CrossRef]
- Robeson, L.M. The upper bound revisited. J. Membr. Sci. 2008, 320, 390–400. [Google Scholar] [CrossRef]
- Wang, M.; Wang, Z.; Zhao, S.; Wang, J.; Wang, S. Recent advances on mixed matrix membranes for CO2 separation. Chin. J. Chem. Eng. 2017, 25, 1581–1597. [Google Scholar] [CrossRef]
- Janakiram, S.; Ahmadi, M.; Dai, Z.; Ansaloni, L.; Deng, L. Performance of nanocomposite membranes containing 0D to 2D nanofillers for CO2 separation: A review. Membranes 2018, 8, 24. [Google Scholar] [CrossRef] [PubMed]
- Ebadi, A.; Mashhadikhan, S.; Sanaeepur, H. Progress in Materials Science Substantial breakthroughs on function-Led design of advanced materials used in mixed matrix membranes (MMMs): A new horizon for efficient CO2 separation. Prog. Mater. Sci. 2019, 102, 222–295. [Google Scholar] [CrossRef]
- Ying, Y.; Cheng, Y.; Peh, S.B.; Liu, G.; Shah, B.B. Plasticization Resistance-Enhanced CO2 Separation at Elevated Pressures by Mixed Matrix Membranes Containing Flexible Metal-Organic Framework Fillers. J. Membr. Sci. 2019, 582, 103–110. [Google Scholar] [CrossRef]
- Chuah, C.Y.; Goh, K.; Yang, Y.; Gong, H.; Li, W.; Karahan, H.E.; Guiver, M.D.; Wang, R.; Bae, T.H. Harnessing filler materials for enhancing biogas separation membranes. Chem. Rev. 2018, 118, 8655–8769. [Google Scholar] [CrossRef]
- Dai, Z.; Noble, R.D.; Gin, D.L.; Zhang, X.; Deng, L. Combination of ionic liquids with membrane technology: A new approach for CO2 separation. J. Membr. Sci. 2016, 497, 1–20. [Google Scholar] [CrossRef]
- Aghaie, M.; Rezaei, N.; Zendehboudi, S. A systematic review on CO2 capture with ionic liquids: Current status and future prospects. Renew. Sustain. Energy Rev. 2018, 96, 502–525. [Google Scholar] [CrossRef]
- Sasikumar, B.; Arthanareeswaran, G.; Ismail, A.F. Recent progress in ionic liquid membranes for gas separation. J. Mol. Liq. 2018, 266, 330–341. [Google Scholar] [CrossRef]
- Yup, J.; Hun, J.; Su, M.; Kim, J.; Hak, J. Hybrid membranes based on ionic-Liquid-Functionalized poly (vinyl benzene chloride) beads for CO2 capture. J. Membr. Sci. 2019, 572, 365–373. [Google Scholar]
- Rafiq, S.; Deng, L.; Hägg, M.B. Role of Facilitated Transport Membranes and Composite Membranes for Efficient CO2 Capture—A review. ChemBioEng Rev. 2016, 3, 68–85. [Google Scholar] [CrossRef]
- Tong, Z.; Ho, W.S.W. New sterically hindered polyvinylamine membranes for CO2 separation and capture. J. Membr. Sci. 2017, 543, 202–211. [Google Scholar] [CrossRef]
- Zhang, H.; Tian, H.; Zhang, J.; Guo, R.; Li, X. Facilitated transport membranes with an amino acid salt for highly efficient CO2 separation. Int. J. Greenh. Gas Control 2018, 78, 85–93. [Google Scholar] [CrossRef]
- Chen, Y.; Ho, W.S.W. High-Molecular-Weight polyvinylamine/piperazine glycinate membranes for CO2 capture from flue gas. J. Membr. Sci. 2016, 514, 376–384. [Google Scholar] [CrossRef]
- Sandru, M.; Kim, T. High molecular fixed-Site-Carrier PVAm membrane for CO2 capture. Desalination 2009, 240, 298–300. [Google Scholar] [CrossRef]
- Hamouda, S.B.; Nguyen, Q.T.; Langevin, D.; Roudesli, S. Poly(vinylalcohol)/poly(ethyleneglycol)/poly(ethyleneimine) blend membranes—Structure and CO2 facilitated transport. Comptes Rendus Chim. 2010, 13, 372–379. [Google Scholar] [CrossRef]
- Deng, L.; Kim, T.J.; Hägg, M.B. Facilitated transport of CO2 in novel PVAm/PVA blend membrane. J. Membr. Sci. 2009, 340, 154–163. [Google Scholar] [CrossRef]
- Deng, L.; Hägg, M. Carbon nanotube reinforced PVAm/PVA blend FSC nanocomposite membrane for CO2 /CH4 separation. Int. J. Greenh. Gas Control 2014, 26, 127–134. [Google Scholar] [CrossRef]
- Li, Y.; Wang, S.; He, G.; Wu, H.; Pan, F.; Jiang, Z. Facilitated transport of small molecules and ions for energy-Efficient membranes. Chem. Soc. Rev. 2015, 44, 103–118. [Google Scholar] [CrossRef] [PubMed]
- Dou, H.; Jiang, B.; Xiao, X.; Xu, M.; Wang, B.; Hao, L.; Sun, Y.; Zhang, L. Ultra-Stable and cost-Efficient protic ionic liquid based facilitated transport membranes for highly selective olefin/paraffin separation. J. Membr. Sci. 2018, 557, 76–86. [Google Scholar] [CrossRef]
- Han, Y.; Wu, D.; Ho, W.S.W. Simultaneous effects of temperature and vacuum and feed pressures on facilitated transport membrane for CO2/N2 separation. J. Membr. Sci. 2019, 573, 476–484. [Google Scholar] [CrossRef]
- Kim, T.K.; Vralstad, H.; Sandru, M.; Hägg, M.B. Separation performance of PVAm composite membrane for CO2 capture at varius pH levels. J. Membr. Sci. 2012, 428, 218–224. [Google Scholar] [CrossRef]
- Prasad, B.; Mandal, B. Preparation and characterization of CO2-Selective facilitated transport membrane composed of chitosan and poly (allylamine) blend for CO2/N2 separation. J. Ind. Eng. Chem. 2018, 66, 419–429. [Google Scholar] [CrossRef]
- Ansaloni, L.; Salas-Gay, J.; Ligi, S.; Baschetti, M.G. Nanocellulose-Based membranes for CO2 capture. J. Membr. Sci. 2017, 522, 216–225. [Google Scholar] [CrossRef]
- Venturi, D.; Grupkovic, D.; Sisti, L.; Baschetti, M.G. Effect of humidity and nanocellulose content on Polyvinylamine-Nanocellulose hybrid membranes for CO2 capture. J. Membr. Sci. 2018, 548, 263–274. [Google Scholar] [CrossRef]
- Gierszewska, M.; Ostrowska-czubenko, J. Chitosan-Based membranes with different ionic crosslinking density for pharmaceutical and industrial applications. Carbohydr. Polym. 2016, 153, 501–511. [Google Scholar] [CrossRef]
- Han, Y.; Ho, W.S. Recent advances in polymeric membranes for CO2 capture. Chin. J. Chem. Eng. 2018, 26, 2238–2254. [Google Scholar] [CrossRef]
- Kim, T.J.; Vrålstad, H.; Sandru, M.; Hägg, M.B. The effect of pH on CO2-Separation from post combustion gas by polyvinylamine based composite membrane. Energy Procedia 2013, 37, 986–992. [Google Scholar] [CrossRef]
- Lin, Y.; Lin, Y.; Lee, C.; Lin, K.A.; Chung, T.; Tung, K. Synthesis of mechanically robust epoxy cross-Linked silica aerogel membranes for CO2 capture. J. Taiwan Inst. Chem. Eng. 2018, 87, 117–122. [Google Scholar] [CrossRef]
- Tomé, L.C.; Guerreiro, D.C.; Teodoro, R.M.; Alves, V.D.; Marrucho, I.M. Effect of polymer molecular weight on the physical properties and CO2/N2 separation of pyrrolidinium-Based poly (ionic liquid) membranes. J. Membr. Sci. 2018, 549, 267–274. [Google Scholar] [CrossRef]
- Ansaloni, L.; Zhao, Y.; Jung, B.T.; Ramasubramanian, K.; Baschetti, M.G.; Ho, W.S.W. Facilitated transport membranes containing amino-Functionalized multi-Walled carbon nanotubes for high-Pressure CO2 separations. J. Membr. Sci. 2015, 490, 18–28. [Google Scholar] [CrossRef]
- Papageorgiou, D.G.; Kinloch, I.A.; Young, R.J. Mechanical Properties of Graphene and Graphene-Based Nanocomposites. Prog. Mater. Sci. 2017, 90, 75–127. [Google Scholar] [CrossRef]
- Young, R.J.; Liu, M.; Kinloch, I.A.; Li, S.; Zhao, X.; Vall, C.; Papageorgiou, D.G. The mechanics of reinforcement of polymers by graphene nanoplatelets. Compos. Sci. Technol. J. 2018, 154, 110–116. [Google Scholar] [CrossRef]
- Maccaferri, E.; Mazzocchetti, L.; Benelli, T.; Zucchelli, A. Morphology, thermal, mechanical properties and ageing of nylon 6,6/graphene nano fi bers as Nano2 materials. Compos. Part B 2019, 166, 120–129. [Google Scholar] [CrossRef]
- Mazzocchetti, L.; Benelli, T.; D’Angelo, E.; Ligi, S.; Minak, G.; Poodts, E.; Tarterini, F.; Palermo, V.; Giorgini, L. Managing heat phenomena in epoxy composites production via graphenic derivatives: Synthesis, properties and industrial production simulation of graphene and graphene oxide containing composites. 2D Mater. 2017, 4, 15. [Google Scholar] [CrossRef]
- Kuilla, T.; Bhadra, S.; Yao, D.H.; Kim, N.H.; Bose, S.; Lee, J.H. Recent advances in graphene based polymer composites. Prog. Polym. Sci. 2010, 35, 1350–1375. [Google Scholar] [CrossRef]
- Potts, J.R.; Dreyer, D.R.; Bielawski, C.W.; Ruoff, R.S. Graphene-Based polymer nanocomposites. Polymer 2011, 52, 5–25. [Google Scholar] [CrossRef]
- Yoo, B.M.; Shin, J.E.; Lee, H.D.; Park, H.B. Graphene and graphene oxide membranes for gas separation applications. Curr. Opin. Chem. Eng. 2017, 16, 39–47. [Google Scholar] [CrossRef]
- Goh, K.; Karahan, H.E.; Yang, E.; Bae, T.H. Graphene-Based membranes for CO2/CH4 separation: Key challenges and perspectives. Appl. Sci. 2019, 9. [Google Scholar] [CrossRef]
- He, G.; Huang, S.; Villalobos, L.F.; Zhao, J.; Mensi, M.; Oveisi, E.; Rezaei, M.; Agrawal, K.V. High-Permeance polymer-Functionalized single-Layer graphene membranes that surpass the postcombustion carbon capture target. Energy Environ. Sci. 2019, 12–16. [Google Scholar] [CrossRef]
- Schmalen, A. Post Polymerization Modification of Poly (vinyl amine) with Functional Epoxides: Multifunctional, Antimicrobial, Protein-Like Polymers. Ph.D. Thesis, RWTH Aachen University, Aachen, Germany, 2014. [Google Scholar]
- Liu, M.; Liu, T.; Wu, W.; Zhang, X.; Zhang, R. A novel and efficient approach to prepare few-Layer graphene with high quality. Mater. Lett. 2018, 228, 183–186. [Google Scholar] [CrossRef]
- Zhou, L.; Fox, L.; Magdalena, W.; Islas, L.; Slastanova, A.; Robles, E.; Bikondoa, O.; Harniman, R.; Fox, N.; Cattelan, M.; et al. Surface structure of few layer graphene. Carbon 2018, 136, 255–261. [Google Scholar] [CrossRef]
- Liscio, A.; Kouroupis-Agalou, K.; Betriu, X.D.; Kovtun, A.; Treossi, E.; Pugno, N.M.; De Luca, G.; Giorgini, L.; Palermo, V. Evolution of the size and shape of 2D nanosheets during ultrasonic fragmentation. 2D Mater. 2017, 4, 025017. [Google Scholar] [CrossRef]
- Zhao, H.; Li, Q.; Xu, W.; Huang, F. Study on synthesis and thermal property of polyvinylamine. Adv. Mater. Res. 2011, 150–151, 1500–1503. [Google Scholar] [CrossRef]
- Piccinini, E.; Giacinti Baschetti, M.; Sarti, G.C. Use of an automated spring balance for the simultaneous measurement of sorption and swelling in polymeric films. J. Membr. Sci. 2004, 234, 95–100. [Google Scholar] [CrossRef]
- Venturi, D.; Ansaloni, L.; Baschetti, M.G. Nanocellulose based facilitated transport membranes for CO2 separation. Chem. Eng. Trans. 2016, 47, 349–354. [Google Scholar]
- Catalano, J.; Myezwa, T.; Angelis, D.; Giacinti Baschetti, M.; Sarti, G.C. The effect of relative humidity on the gas permeability and swelling in PFSI membranes. Int. J. Hydrog. Energy 2012, 37, 6308–6316. [Google Scholar] [CrossRef]
- NIST—National Institute of Standards and Technology. Formic Acid Sodium Salt IR Spectrum. Available online: http://webbook.nist.gov/cgi/cbook.cgi?ID=B6010183&Mask=80 (accessed on 5 August 2019).
- Infrared Spectroscopy Absorption Table. Available online: https://chem.libretexts.org/Ancillary_Materials/Reference/Reference_Tables/Spectroscopic_Parameters/Infrared_Spectroscopy_Absorption_Table (accessed on 5 August 2019).
- Annenkov, V.V.; Danilovtseva, E.N.; Pal’shin, V.A.; Aseyev, V.O.; Petrov, A.K.; Kozlov, A.S.; Patwardhan, S.V.; Perry, C.C. Poly (vinyl amine)-Silica composite nanoparticles: Models of the silicic acid cytoplasmic pool and as a silica precursor for composite materials formation. Biomacromolecules 2011, 12, 1772–1780. [Google Scholar] [CrossRef]
- Olivieri, L.; Aboukeila, H.; Giacinti Baschetti, M.; Pizzi, D.; Merlo, L.; Sarti, G.C. Humid permeation of CO2 and hydrocarbons in Aquivion® perfluorosulfonic acid ionomer membranes, experimental and modeling. J. Membr. Sci. 2017, 542, 367–377. [Google Scholar] [CrossRef]
- Zhao, S.; Cao, X.; Ma, Z.; Wang, Z.; Qiao, Z.; Wang, J.; Wang, S. Mixed-Matrix Membranes for CO2/N2 Separation Comprising a Poly(vinylamine) Matrix and Metal-Organic Frameworks. Ind. Eng. Chem. Res. 2015, 54, 5139–5148. [Google Scholar] [CrossRef]

| Sample | First Degradation Step | Second Degradation Step | Tg (°C) | ||
|---|---|---|---|---|---|
| Onset T (°C) | Weight Loss (%) | Onset T (°C) | Weight Loss (%) | ||
| Lupamin 9095 | 190 | ~14 | 305 | ~32 | 123 |
| PVAm-LG | 190 | ~21 | 315 | ~48 | 113 |
| PVAm-LG + 3% GO | 195 | ~25 | 320 | ~48 | 116 |
| PVAm-HG | 210 | ~24 | 315 | ~60 | 103 |
| PVAm-HG + 3% GO | 220 | ~21 | 315 | ~65 | 125 |
| PVAm-HG + 3% G | 210 | ~30 | 310 | ~51 | 126 |
| Membranes | RH % | CO2 Permeability (Barrer) | CO2/N2 Selectivity |
|---|---|---|---|
| PVAm-Hg | 56 | 4.2 | n.d. |
| PVAm-LG | 63 | 16.5 | n.d. |
| 75 | 24.4 | n.d. | |
| 85 | 61.2 | n.d. | |
| 93 | 73.8 | n.d. | |
| PVAm-LG + 3% GO | 53 | 1.7 | 0.1 |
| 62 | 4.4 | 3.1 | |
| 73 | 6.9 | 6.5 | |
| 83 | 31.0 | 36.1 | |
| 93 | 71.0 | 59.0 | |
| PVAm-HG + 3% GO | 75 | 1.6 | 3.0 |
| 87 | 12.0 | 17.4 | |
| 93 | 25.1 | 80.6 | |
| PVAm-HG + 3% G | 77 | 2.0 | 1.1 |
| 85 | 7.1 | 7.04 | |
| 92 | 23.1 | 45.2 |
© 2019 by the authors. Licensee MDPI, Basel, Switzerland. This article is an open access article distributed under the terms and conditions of the Creative Commons Attribution (CC BY) license (http://creativecommons.org/licenses/by/4.0/).
Share and Cite
Casadei, R.; Venturi, D.; Giacinti Baschetti, M.; Giorgini, L.; Maccaferri, E.; Ligi, S. Polyvinylamine Membranes Containing Graphene-Based Nanofillers for Carbon Capture Applications. Membranes 2019, 9, 119. https://doi.org/10.3390/membranes9090119
Casadei R, Venturi D, Giacinti Baschetti M, Giorgini L, Maccaferri E, Ligi S. Polyvinylamine Membranes Containing Graphene-Based Nanofillers for Carbon Capture Applications. Membranes. 2019; 9(9):119. https://doi.org/10.3390/membranes9090119
Chicago/Turabian StyleCasadei, Riccardo, Davide Venturi, Marco Giacinti Baschetti, Loris Giorgini, Emanuele Maccaferri, and Simone Ligi. 2019. "Polyvinylamine Membranes Containing Graphene-Based Nanofillers for Carbon Capture Applications" Membranes 9, no. 9: 119. https://doi.org/10.3390/membranes9090119