3.1. Performance Characterization with Tap Water
In order to evaluate and compare the performance of the new module type with the help of KPIs defined in the previous section, measurements and parameter variations with tap water were carried out. The influence of NaCl–H
2O solution on the performance is presented in
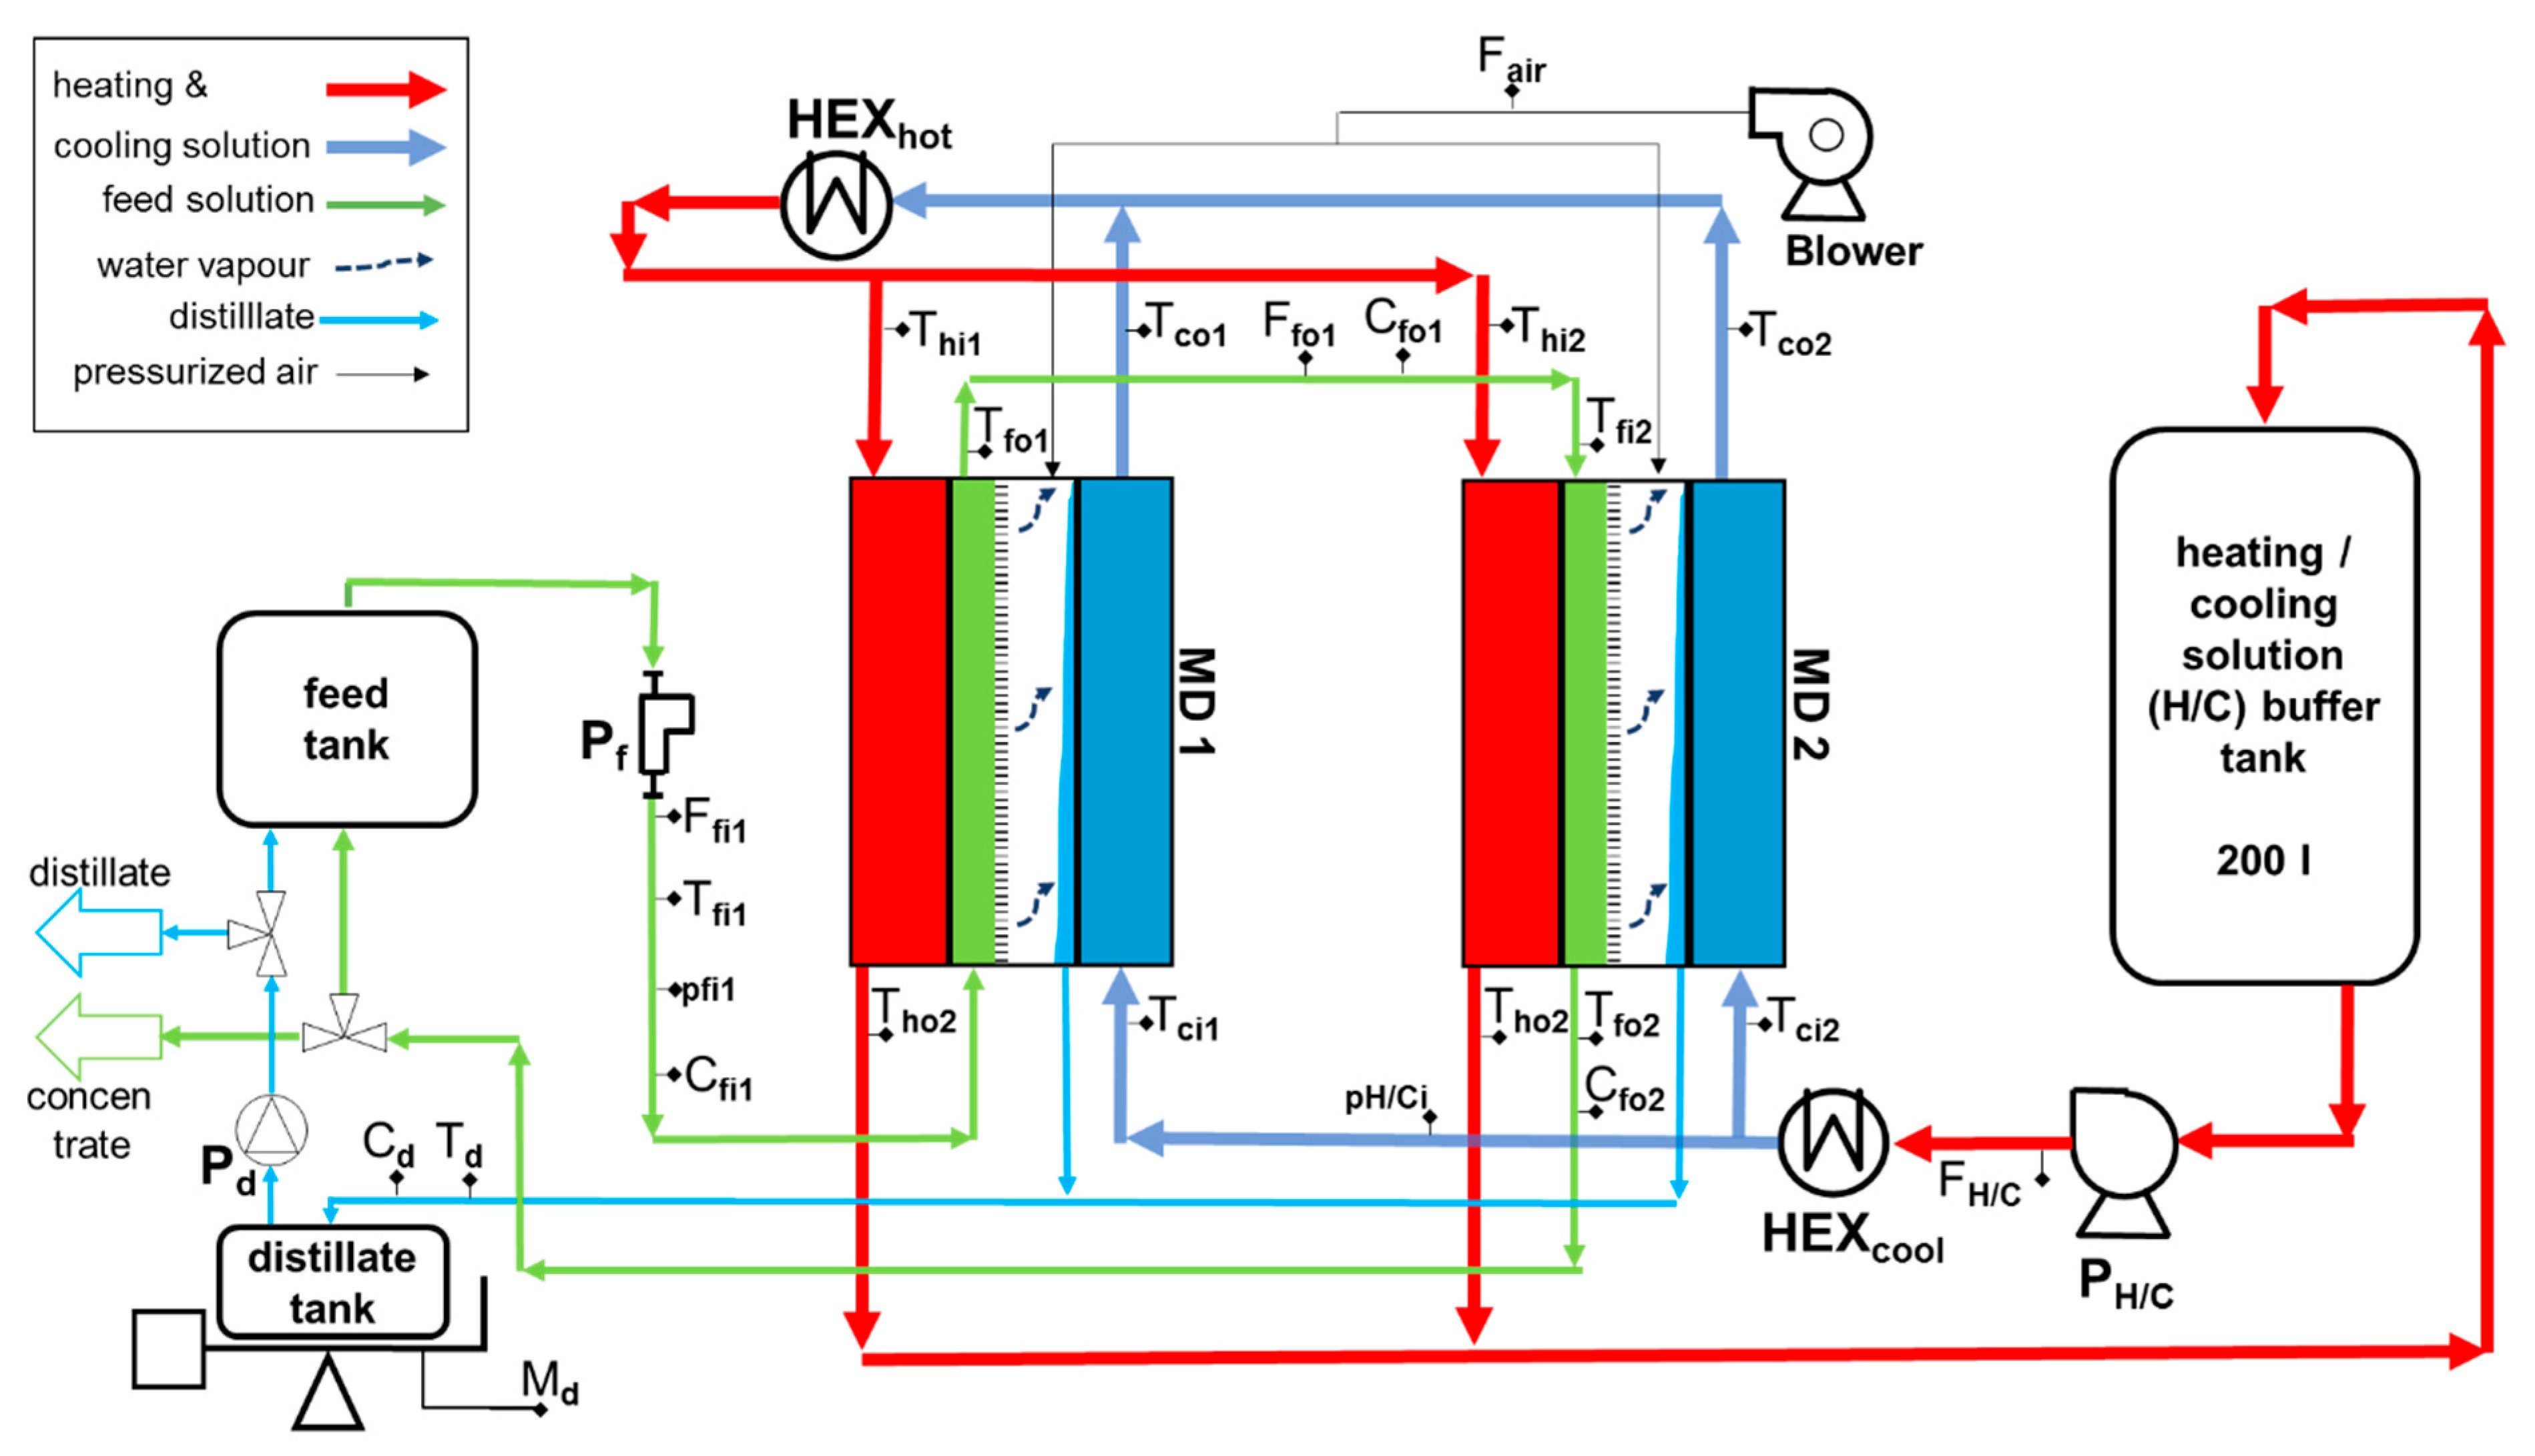
Section 3.2. The coupling of the module pair, with respect to the serial connection of the feed channels, leads to different performance and temperature profiles in MD 1 and MD 2. The main reason for this is the introduction of additional heat into MD 2, transported by the preheated feed leaving MD 1. Thus, the individual module performance profiles will be analyzed at the beginning of this section, but subsequent evaluation will be carried out for MD 1 and MD 2 combined as a pair, displaying mean values. Volume flow of the heating and cooling loop is given in L/h since it is tap water in all cases and the physical properties, especially density, can be assumed to be constant and equal to 1 kg/L. Regarding the feed flow values, mass flow values were derived from the measured volume flows using physical properties of NaCl solution [
60]. The conductivity of the distillate produced was below 19 µS/cm during the entire testing regime with tap water. The pilot system was operated for a total of ~21 weeks with interruptions for the moving of the system from the first pilot site in Berlin to the second site in Freiburg, Germany.
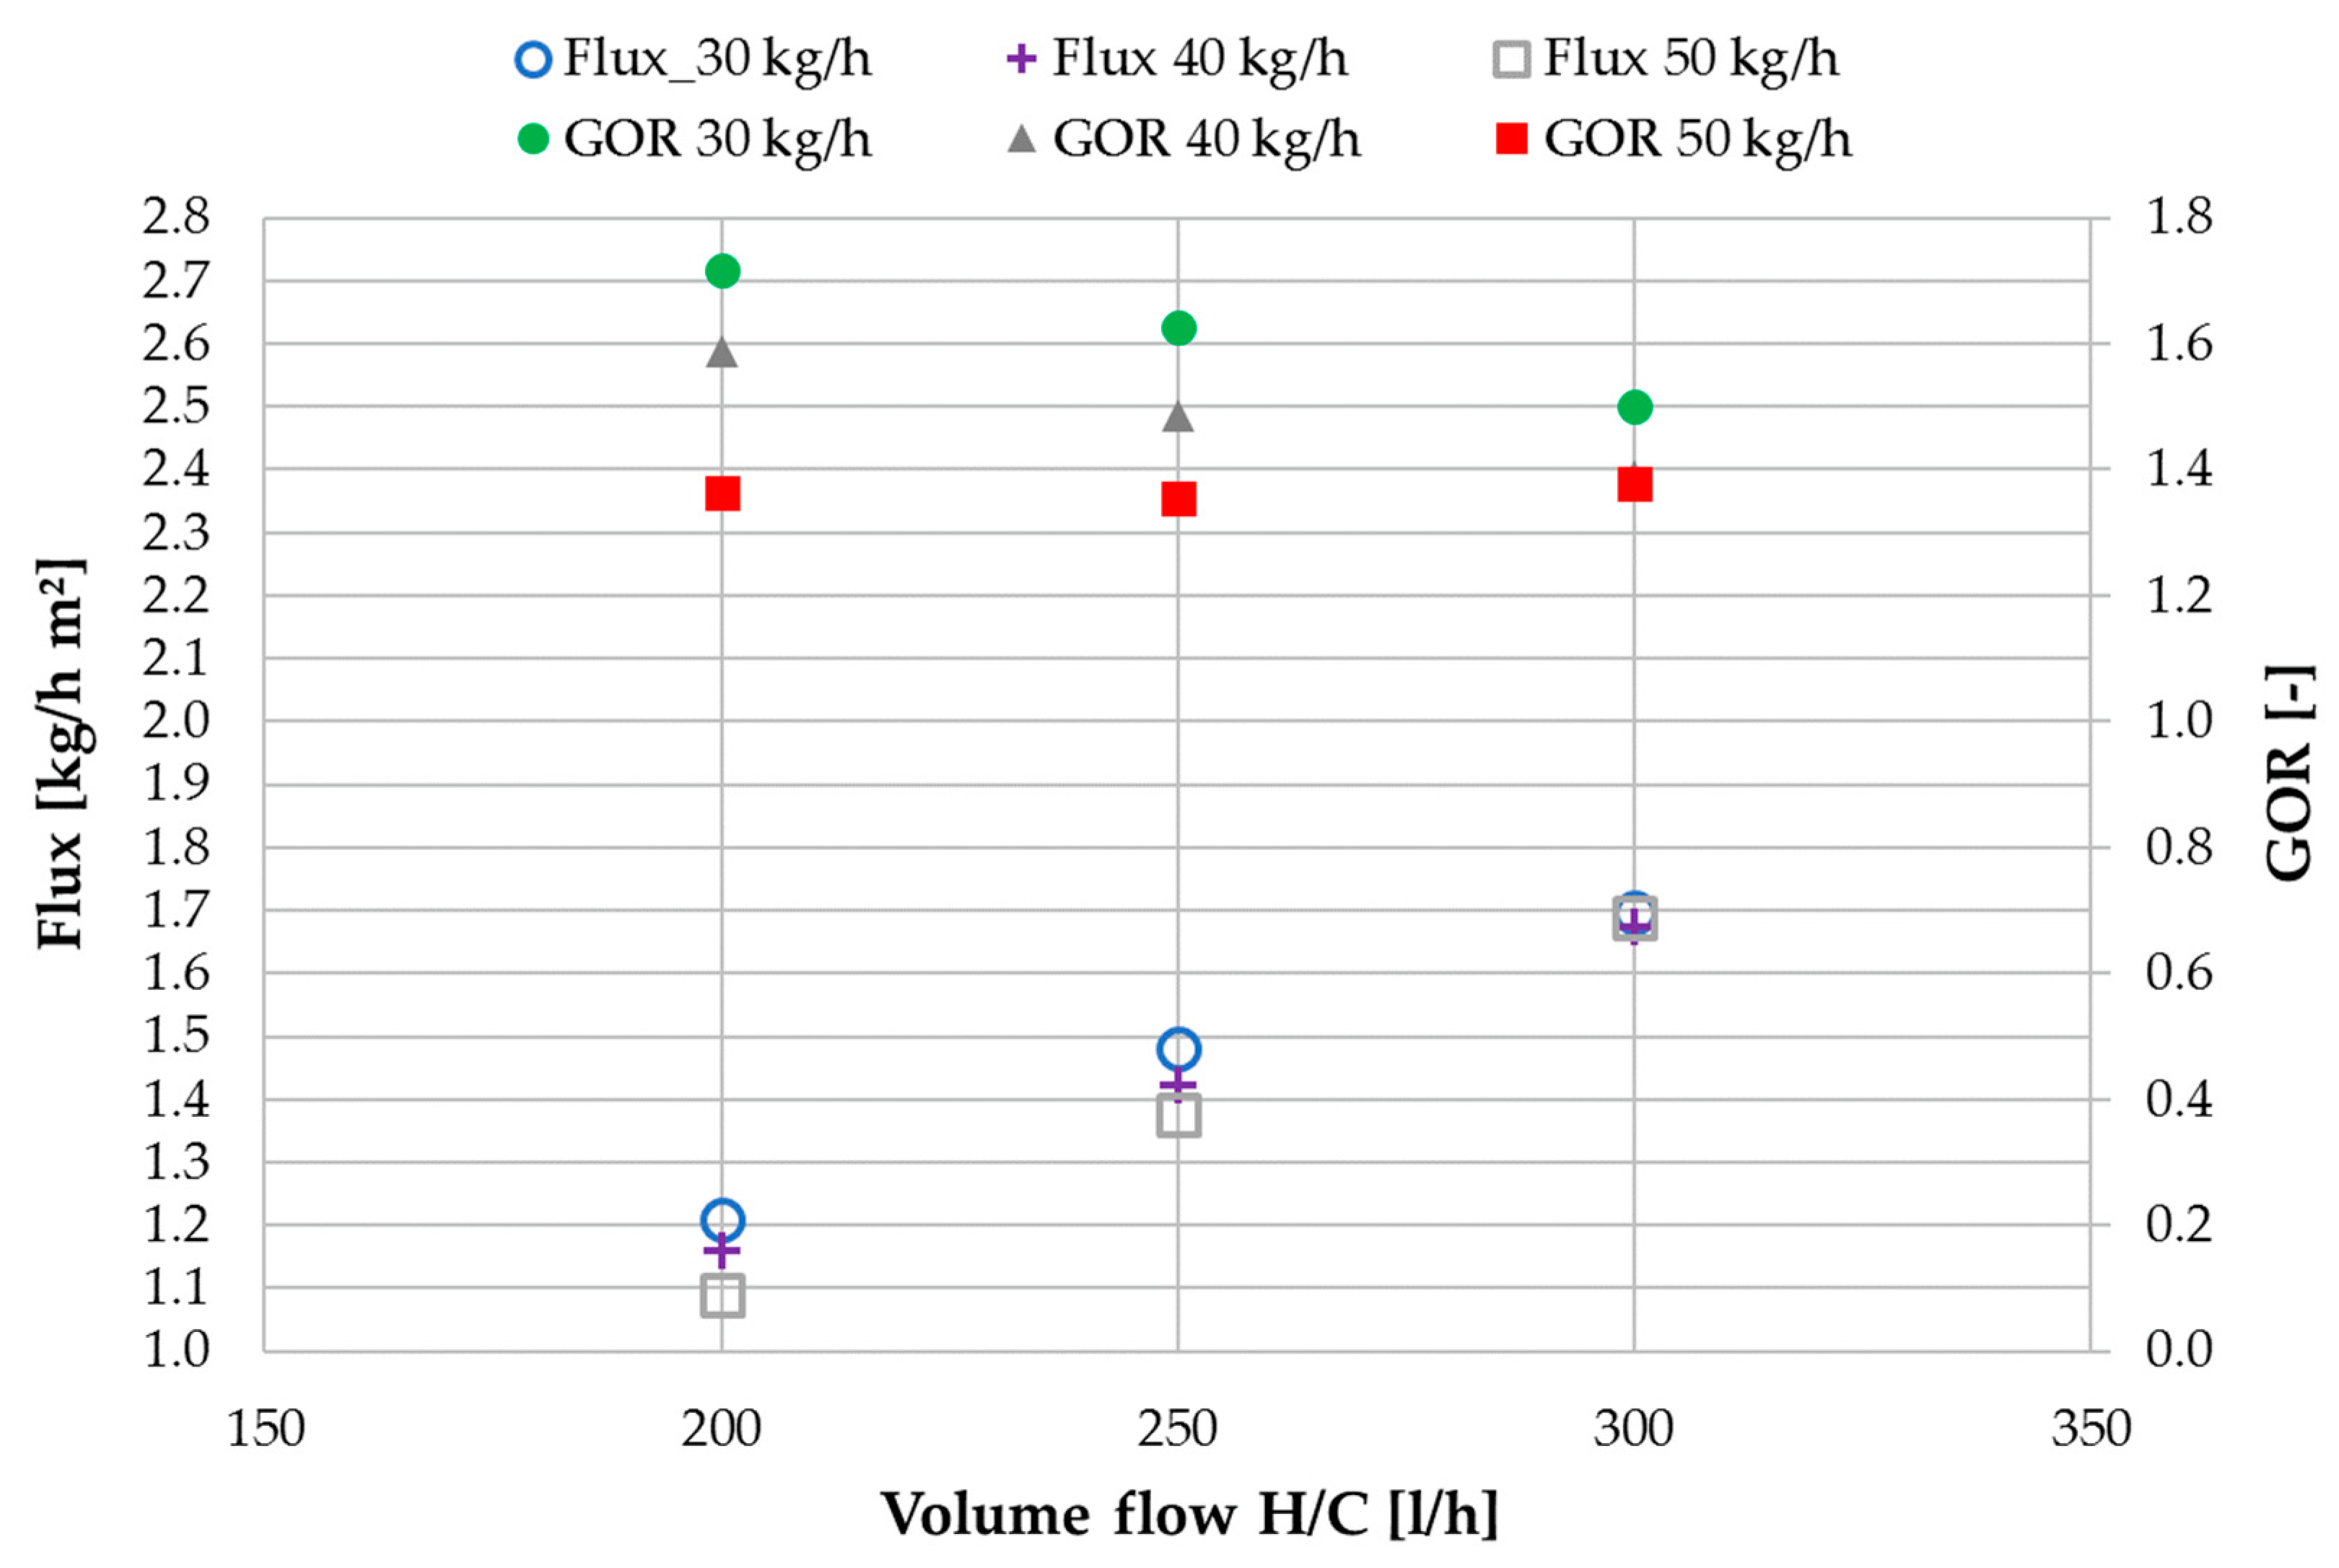
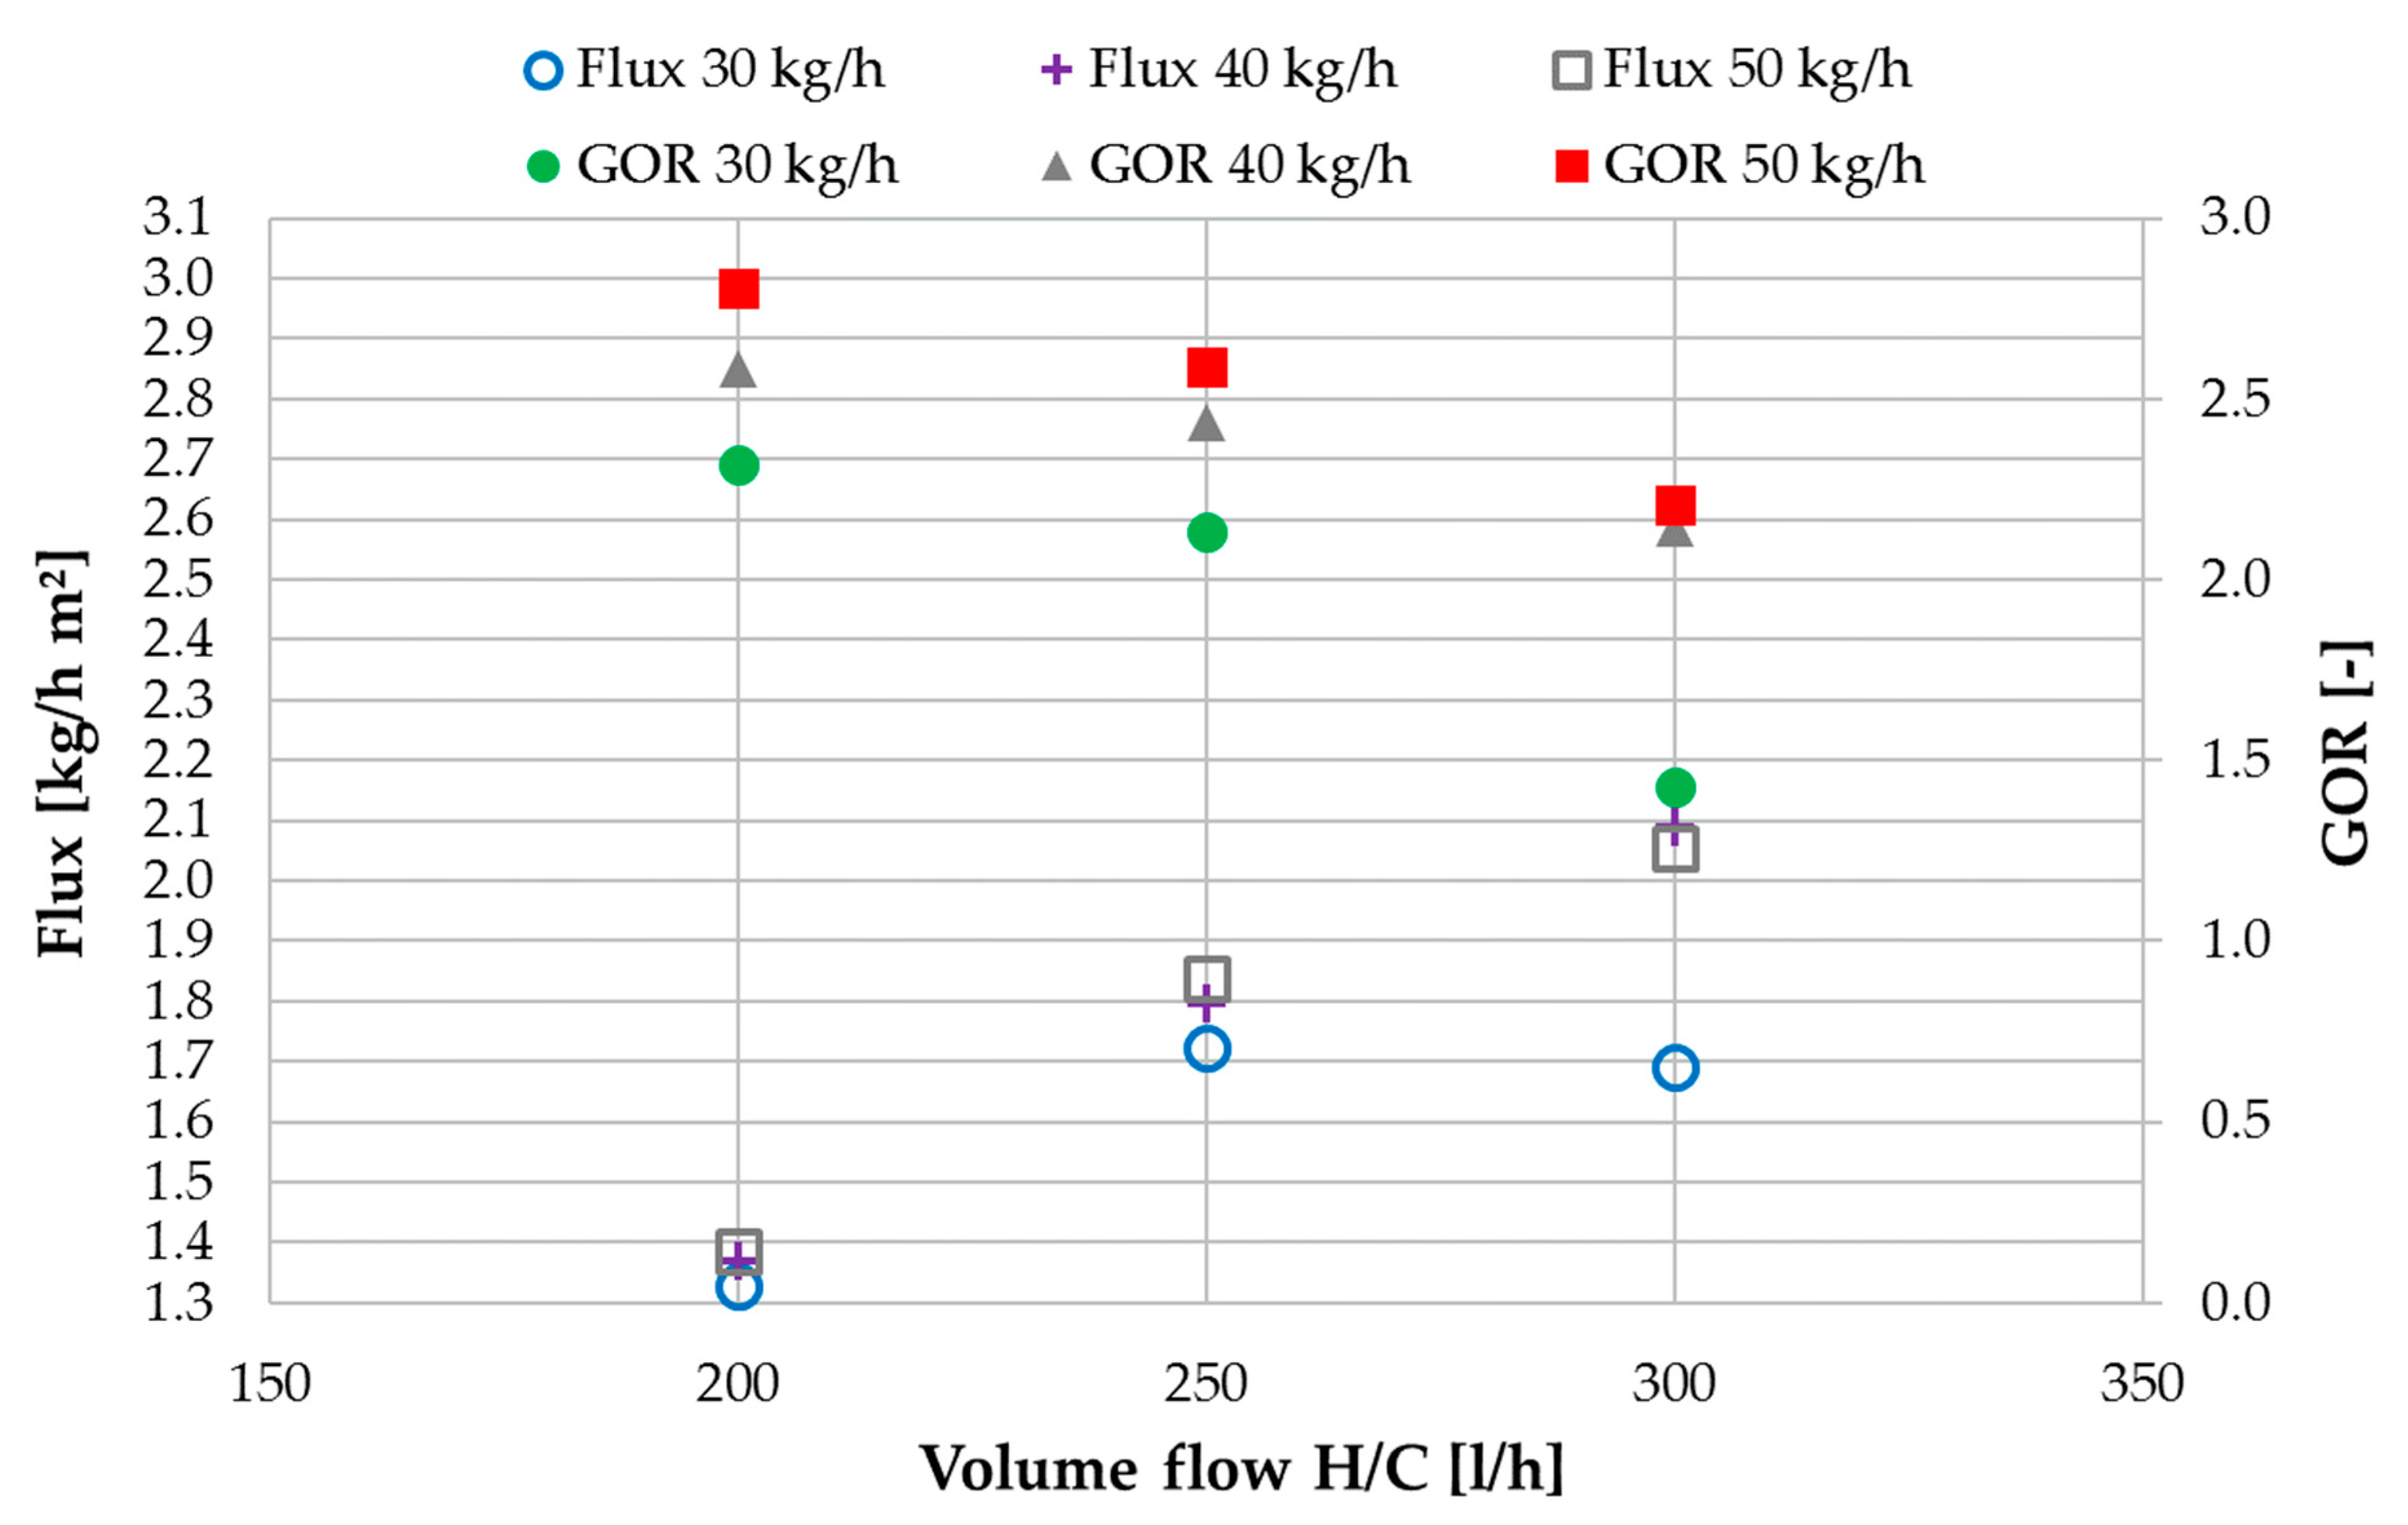
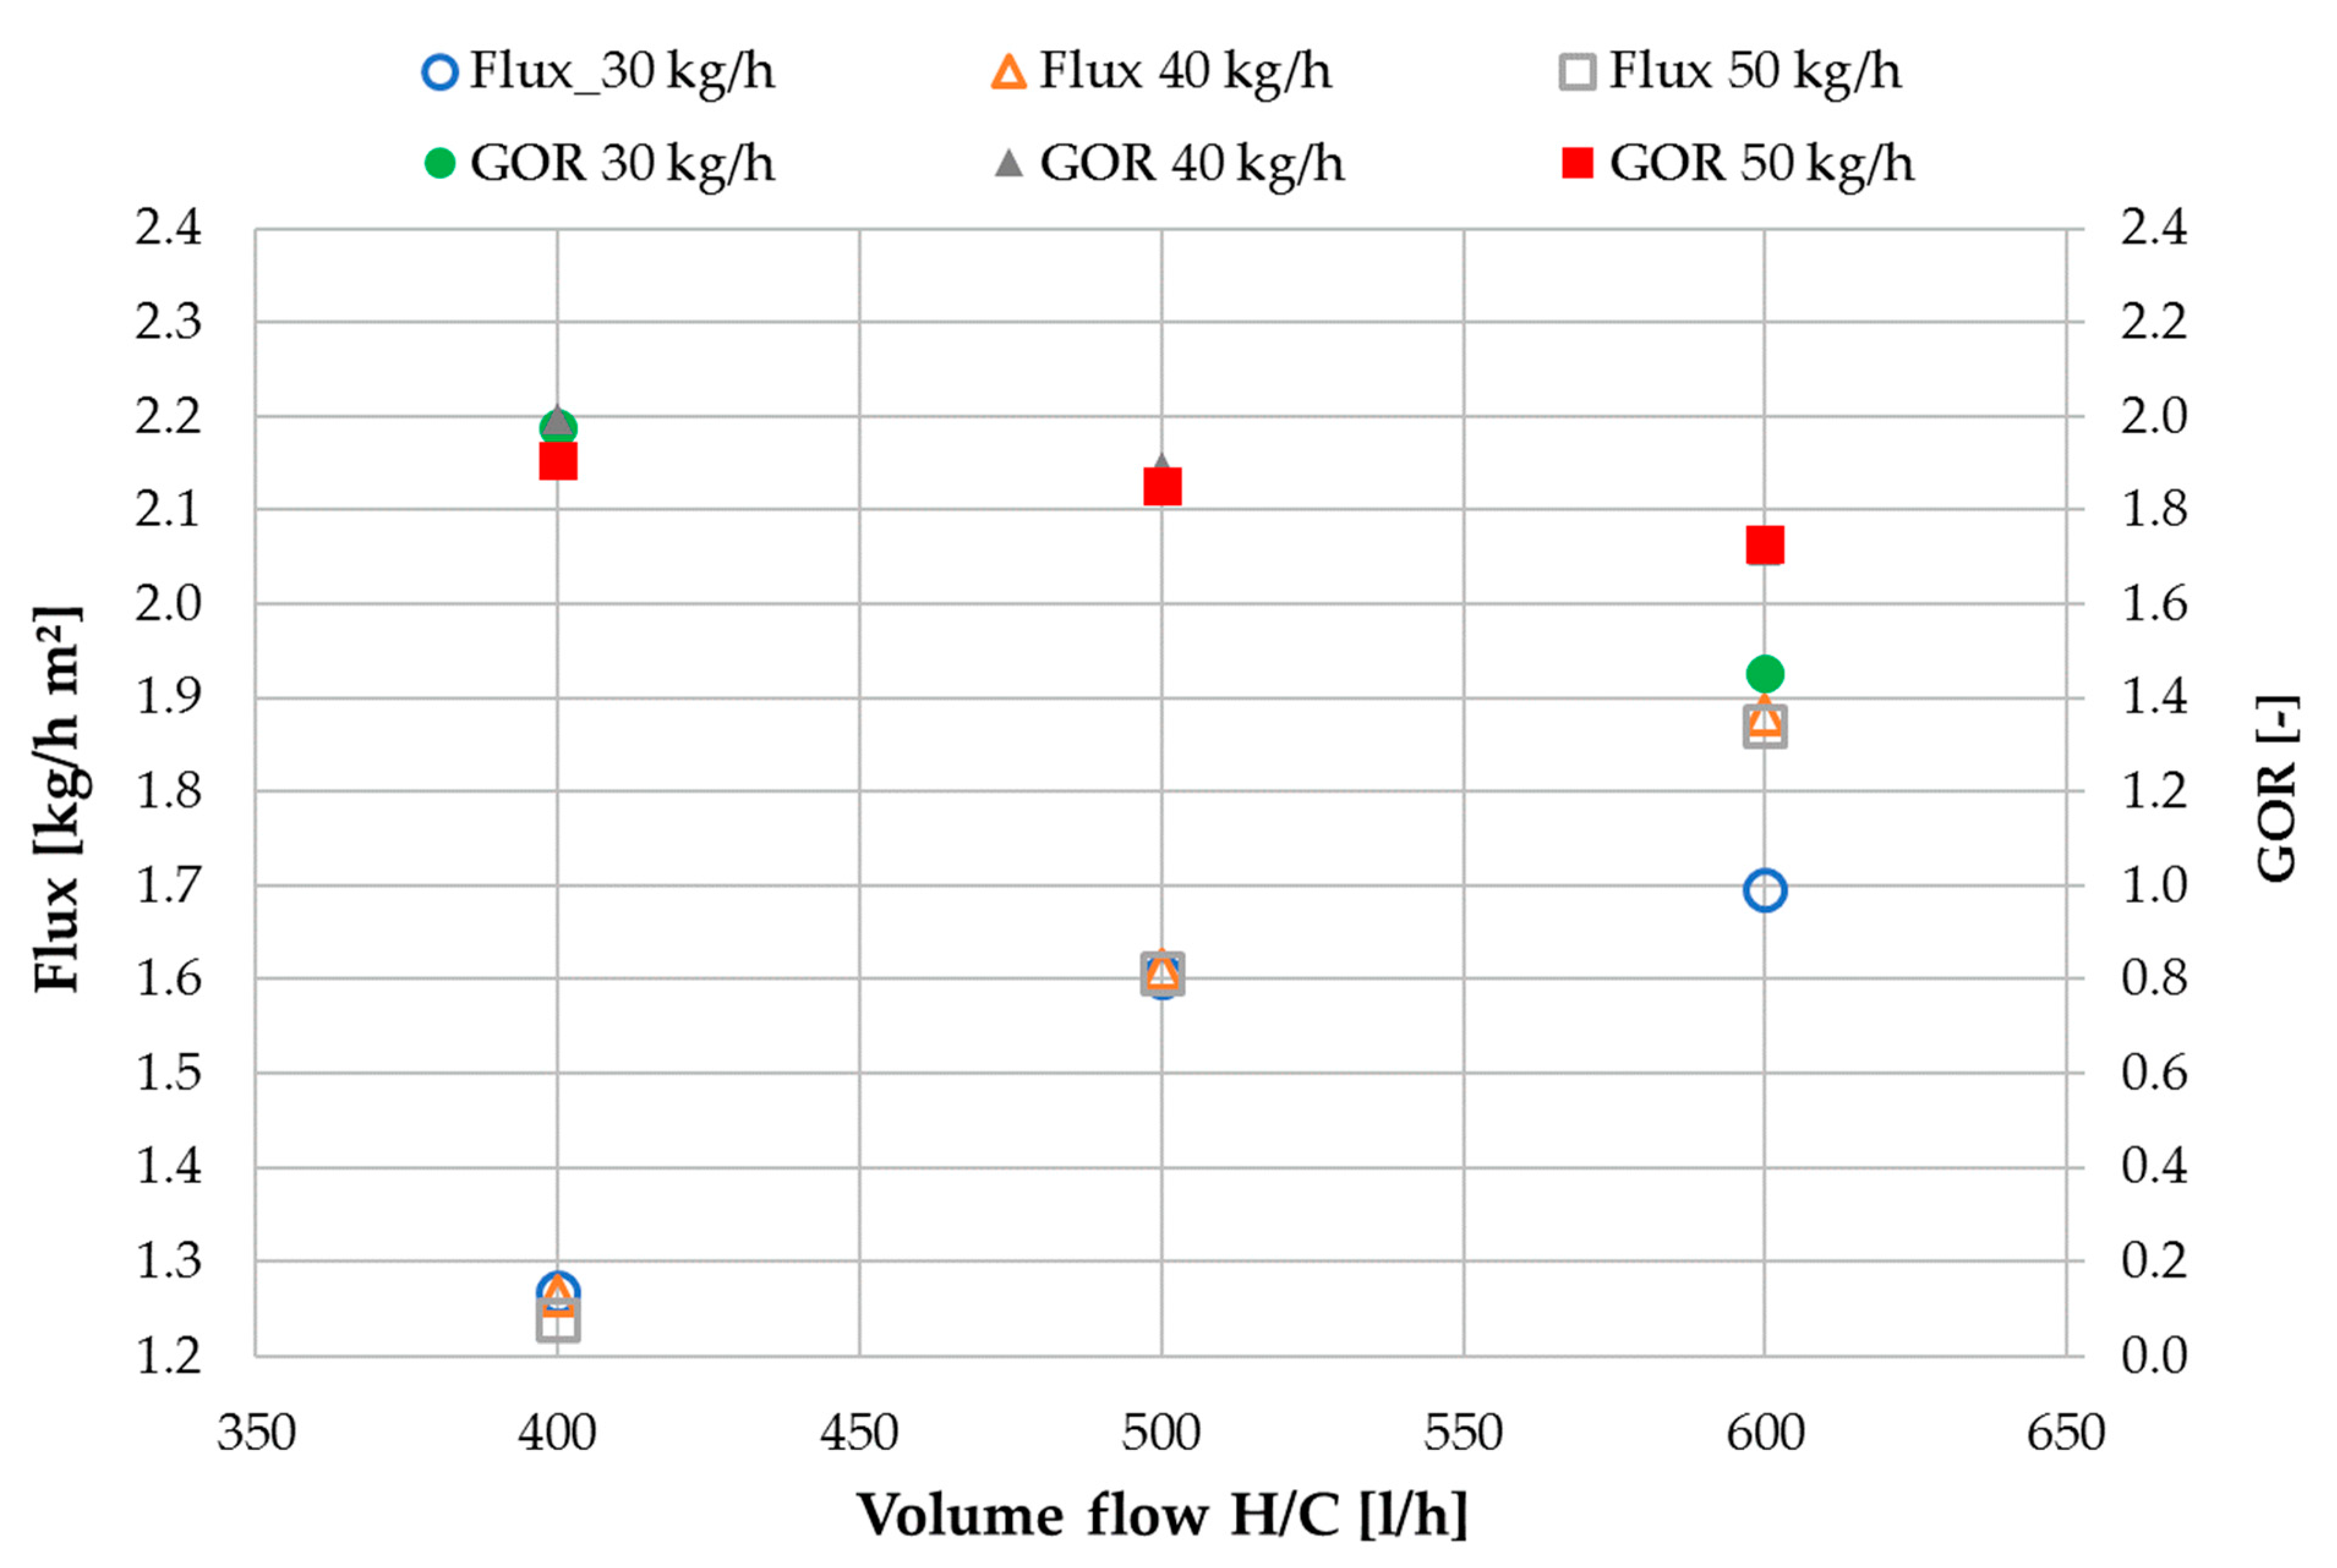
Figure 7 shows the influence of heating and cooling volume flow on flux and GOR in MD 1. For better legibility, flux is depicted on the left and GOR on the right y-axis. Flux increases proportionally with the increase in H/C volume for all three feed mass flows as a result of the higher thermal energy input into the system and subsequent increase in bulk temperature difference. This correlation is a well-known characteristic of the membrane distillation process. The flux values are not very sensitive towards the variation of feed mass flow. However, a certain impact can be observed at 200 and 250 L/h H/C volume flow. When increasing the feed flow, more heat is lost for MD 1 through the heated feed stream. Thus, at lower H/C flow rates at which the overall driving force is lower, the impact of that effect is higher, resulting in lower flux for higher feed mass flow. GOR values for 40 and 50 kg/h of feed follow the well- known trend of reducing with increased H/C volume flow. This is due to that fact, that the increase in driving force temperature difference is not completely compensated by the increase in flux. For a feed mass flow of 50 kg/h the succession of GOR values show that the driving force has been reduced over proportionally by the additional heat requirement to heat the entering feed flow. At 300 L/h H/C flow, the GOR untypically increases slightly due to the now sufficient driving force supplied by the H/C loop. At this point it could be deducted that the feed flow rate should be as low as possible, in order to maximize efficiency. For a single module set up, this conclusion would be valid as long as the saturation level of the feed is not reached within the channel after distillate extraction. As mentioned earlier, in a double module set-up the heat exiting MD 1 with the feed, is recovered in MD 2 by introducing it into the hot side of the module. The feed stream exits MD 1 at approximately the mean temperature between
Thi1 and
Tco1 (~69–71 °C) depending on the respective flow profile. Small losses occur through the piping between the two modules. Feed temperature was ~68–70 °C on entering MD 2. The total distillate output of MD 1 was ~10–14 kg/h depending on the flow profile. This corresponds with the flux multiplied by the membrane area of 8 m
2 per module.
Figure 7 shows flux and GOR values for MD 2. It must be pointed out, that the feed mass flows entering MD 2 are lower than indicated in the naming 30, 40 and 50 kg/h. These values indicate the mass flow at the inlet of MD 1. Due to the distillate extracted in MD 1, they reach MD 2 reduced by the respective output for each operation point.
Table 3 shows the feed gap mass flow values for each H/C flow and FG flow combination tested within the tap water characterization measurements.
There are some major differences in the flux and GOR values of MD 2 which are shown in
Figure 8. To begin with, the overall higher flux values, are a direct result of the additional thermal energy being supplied to MD 2 through the preheated feed coming from the outlet MD 1. In MD 2 the flux is largely insensitive to variations of the feed flow with exception of 30 kg/h. At 300 L/h H/C flow and 30 kg/h FG inlet flow, the flux is only 1.7 kg/h m² which is equal to the value at a 250 L/h H/C flow. This phenomenon can be explained as follows: In this case the distillate output is limited by the available feed mass flow entering MD 2. Since the flux is the highest at 300 L/h H/C flow and 30 kg/h FG flow in MD 1, not enough feed is transferred to MD 2 for the total possible flux to be produced. As shown in
Table 3, 16.3 kg/h are fed to MD 2 which is the lowest FG in MD 2 value overall. Only 2.7 kg/h of feed leave MD 2. Since this phenomenon does not occur at a FG inlet flow of 40 kg/h, it can be concluded that the optimal feed flow for maximized flux at an H/C flow of 600 L/h lies in between 30 and 40 kg/h. The corresponding GOR value is also significantly reduced for that specific operational point since GOR is calculated in relation to the mass of distillate produced.
In opposition to MD 1, in MD 2 the GOR values are the highest for the highest feed flow of 50 kg/h in addition to be being overall higher than the values in MD 1. At a feed flow of 50 kg/h, the GOR is ~3 in MD 2 and ~2 in MD 1 at the same H/C flow of 200 L/h. In analogy to the increased flux, the reason lies in the additional heat supply entering MD 2 through the preheated feed from MD 1. It increases the cooling flow outlet temperature Tco2, thus decreasing the delta T (dTh) on the hot side of MD 2. In correspondence with Equation (4) a higher flux or output in the numerator and a lower temperature difference between Thi and Tco in the denominator will lead to a higher GOR. This effect increases, the higher the feed flow to MD 2 is, due to the increase in thermal capacity of the flow.
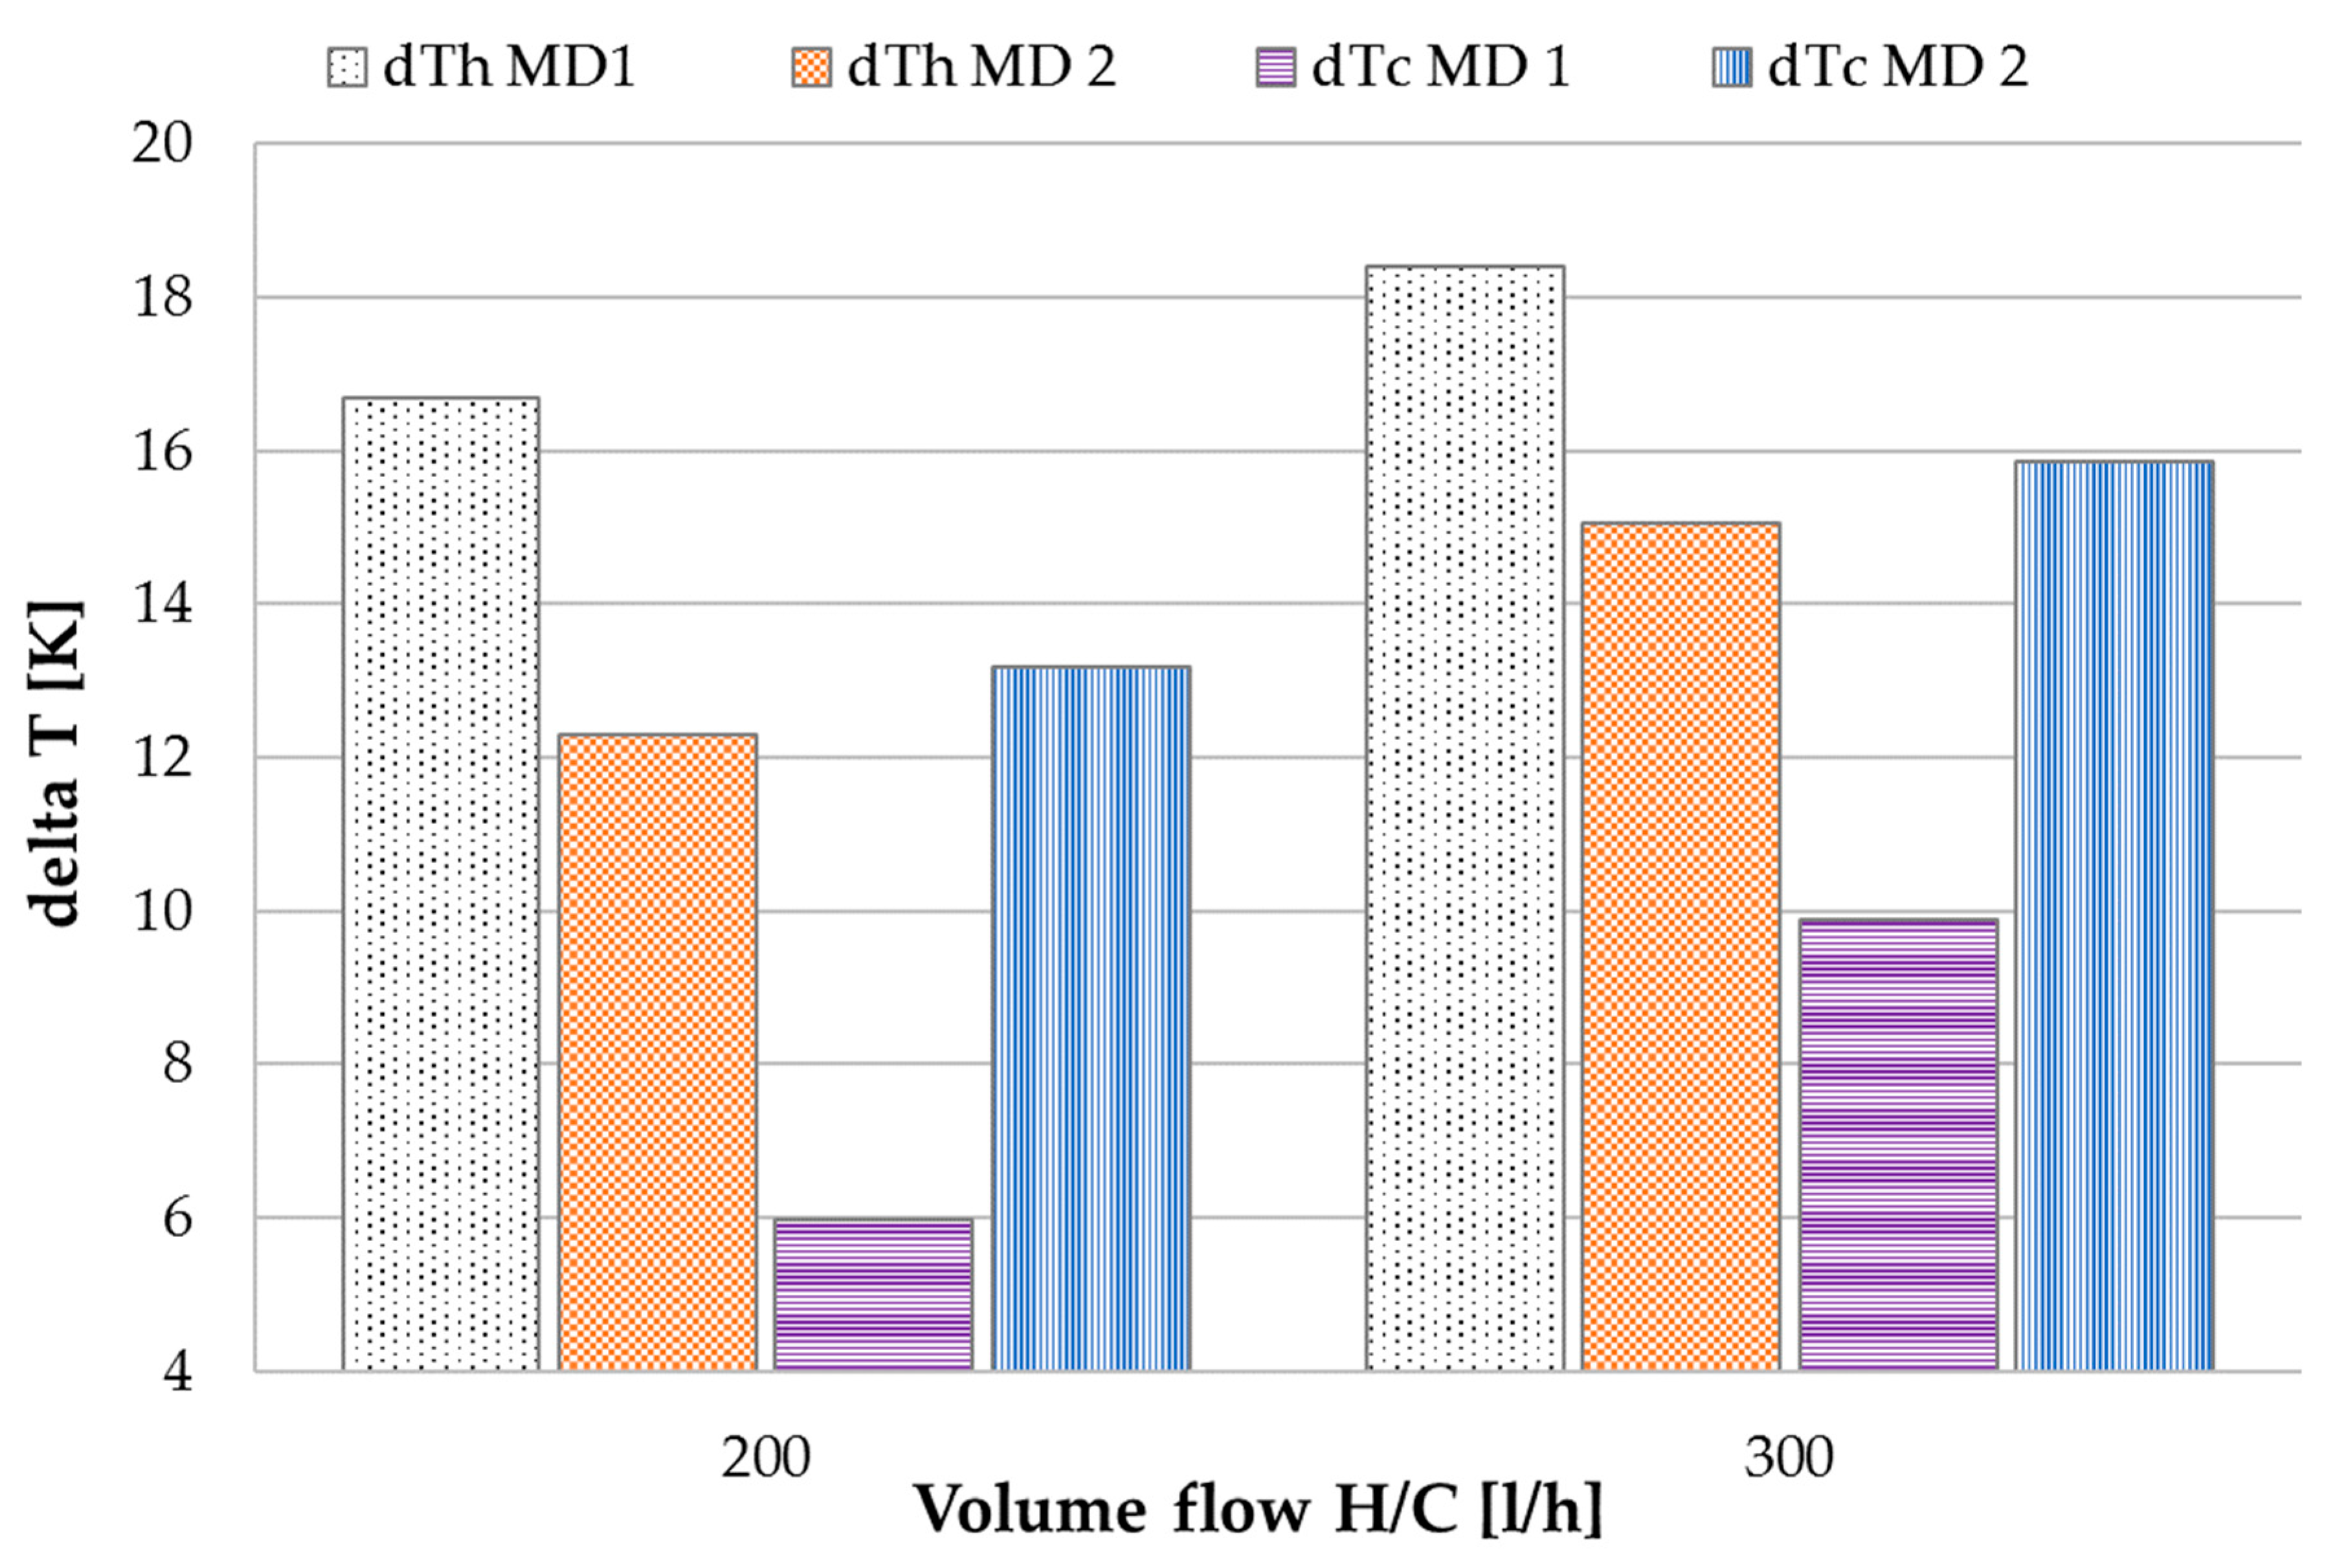
It has been mentioned that the temperature profiles of MD 1 and MD 2 are affected by the feed flow in different degrees.
Figure 9 shows the temperature differences dTh on the hot and dTc on the cold side of MD 1 and MD 2 at different H/C volume flows. dTc is the difference between
Tho and
Tci of the respective module.
Thi ½ was set at 80 °C and
Tci ½ at 25 °C. The comparison of dT values in
Figure 9 is carried out for a feed inlet flow of 40 kg/h. The dTh MD 1 values are higher than then dTc MD 2 values for both the given flow rates. Heat leaves the system with the feed outlet on the hot side of MD 1 leading to a decrease in heat recovery in the module and subsequently a lower
Tco1. Thus, dTh MD 1 is higher than dT MD 2 in which that heat is added to the thermal energy supply coming from the heat exchanger HEX
hot.
Tco2 increases, resulting in the lower dTh MD 2 values depicted in the bar chart. Since the heating inlet temperature
Thi is set at 80 °C, the generally increased delta T hot values at 300 L/h are result of decrease in cooling outlet temperature
Tco. The hot side delta T ratio of MD 1–MD 2 decreases from 4.4 to 3.3 K. Because a higher flux is generated at this flow rate, the feed flow reaching MD 2 is lower than at 200 L/h. This results in a disproportional relation of the hot side delta Ts to one another when the H/C flow rate is increased at the same feed inlet mass flow rate. Opposite effects can be observed regarding the cold side delta Ts. dTc is much lower in MD 1 than in MD 2. On the cold side of the module,
Tho1 is decreased by the additional thermal capacity of the feed entering MD 1 at approximately the same temperature as
Tci. By the time the feed has reached the outlet of MD 2, the mass flow has so far reduced, that the impact on
Tho2 is low. This is shown by the fact that dTh MD 2 and dTc MD 2 are very similar as could be expected e.g., in a counter current heat exchanger. dTh MD 2 is 0.9 K lower than dTc MD 2 at 200 L/h and 0.8 K lower at 300 L/h H/C flow. It has been shown by [
38] that a symmetrical temperature profile along the flow channels of MD modules will have a beneficial effect on process efficiency. This can be achieved by synchronizing the mass flow capacities in the flow channels. In this new channel configuration however, complexity is added by the mass flow capacity of the feed-baring channel. In MD 1, the capacity of the feed channel ads to that of the cooling channel due to their co-current flow relation. In MD 2 however, the feed flows co-current to the heating channel making the temperature profiles in MD 1 and MD 2 not only asymmetrical but also unequal, however, with a much lower impact in MD 2 due to the lower feed mass flow. A reduction in process efficiency must be expected in comparison to a configuration with parallelized temperature profiles as a trade-off for the advantages of being able to establish a one- step process design.
Figure 10 shows mean flux and GOR values for MD 1 and MD 2 combined. Total output was recorded and then divided by the total membrane area of both modules to derive flux. Similarly, GOR was calculated by taking into account the total output and the total heat used for both modules. Total H/C flow for both modules is depicted on the x-axis. It can be observed, that when considering MD 1 and MD 2 as a joined concept, the difference between 40 and 50 kg/h feed flow rate is no longer visible since all sensible heat leaving MD 1 with the feed flow is recovered in MD 2. This is however not valid for 30 kg/h for reasons explained in conjunction with
Figure 8. All of the following graphs show combined values for MD 1 and MD 2.
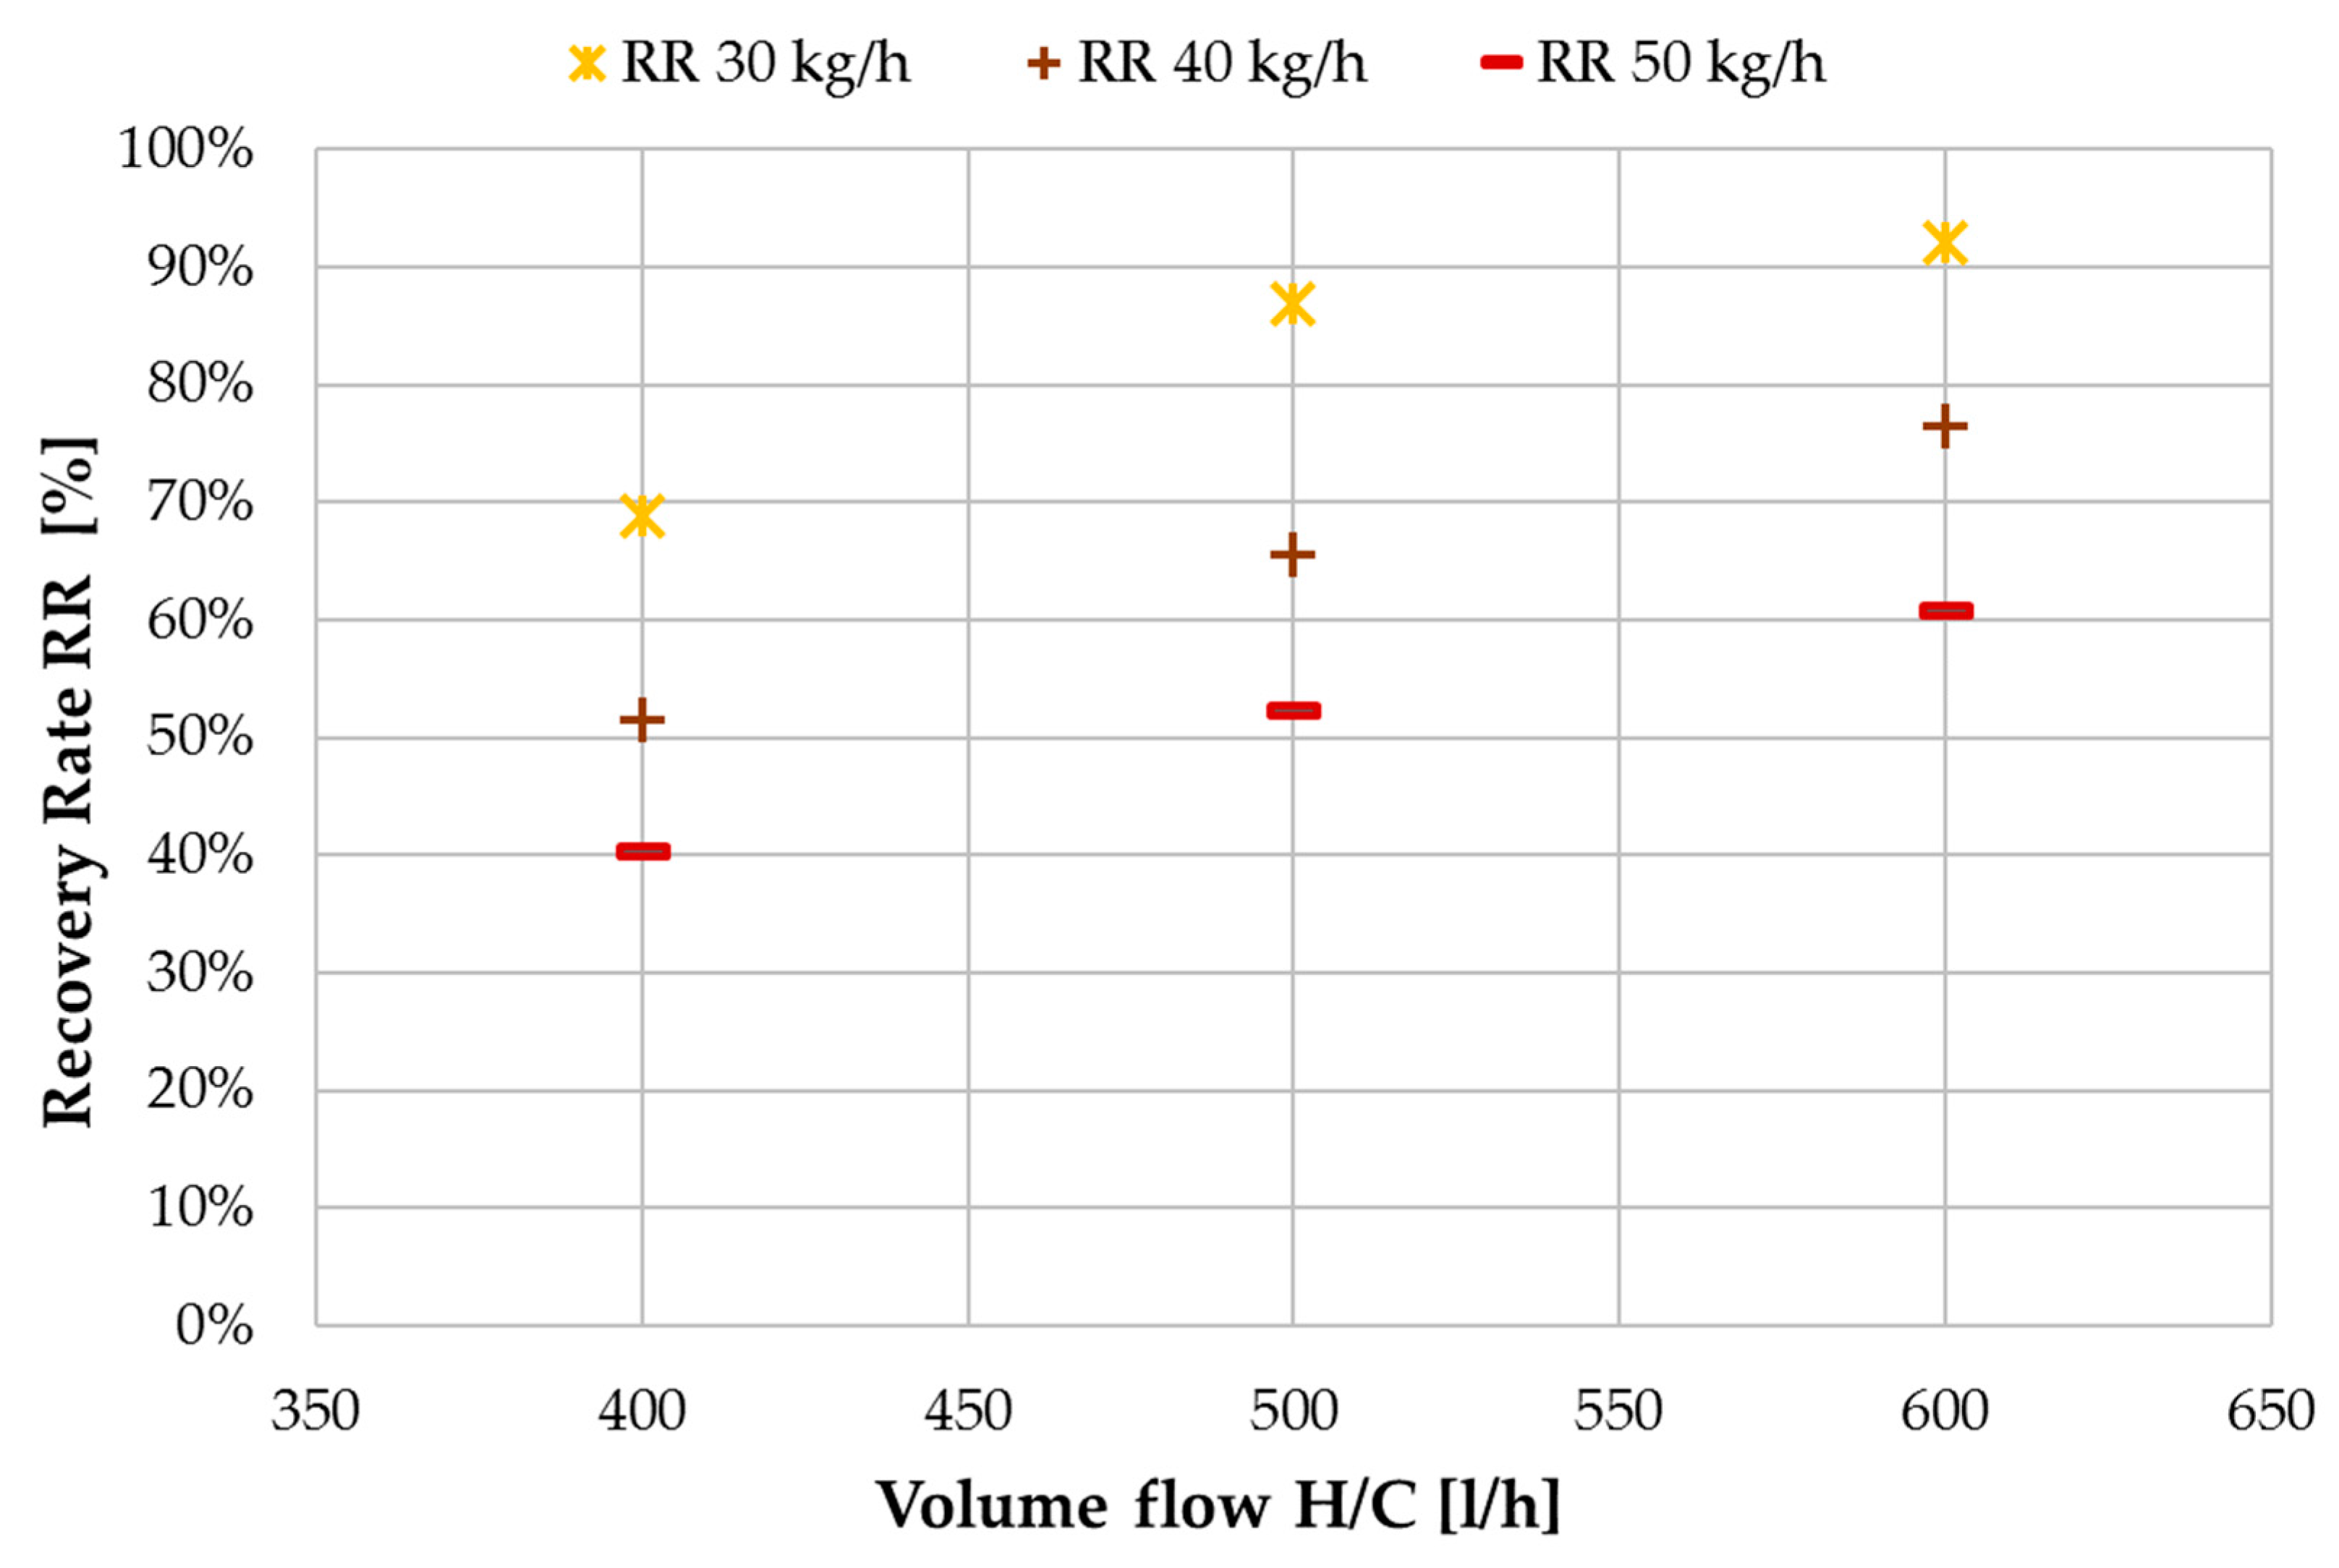
One of the main reasons for separating the heating and cooling flow from the feed flow, is the possibility of controlling the recovery ratio of the module independently of the energy supply.
Figure 11 shows the achieved recovery ratios with tap water as feed. Since the recovery ratio RR is a ratio of distillate output to feed input (Equation (8)), more distillate production from the same feed flow rate will result in a higher RR. Thus, with increase of H/C flow the RR values also increase. As shown in
Figure 10, the distillate flux does not change significantly with changes in feed flow rate. This results in a reduction of RR for increasing feed mass flow. It should be pointed out, that the highest value of 93% RR was achieved at a H/C flow rate of 600 L/h and feed flow of 30 kg/h. This value might even be exceedable if the aforementioned limitations regarding distillate production in MD 2 had not occurred.
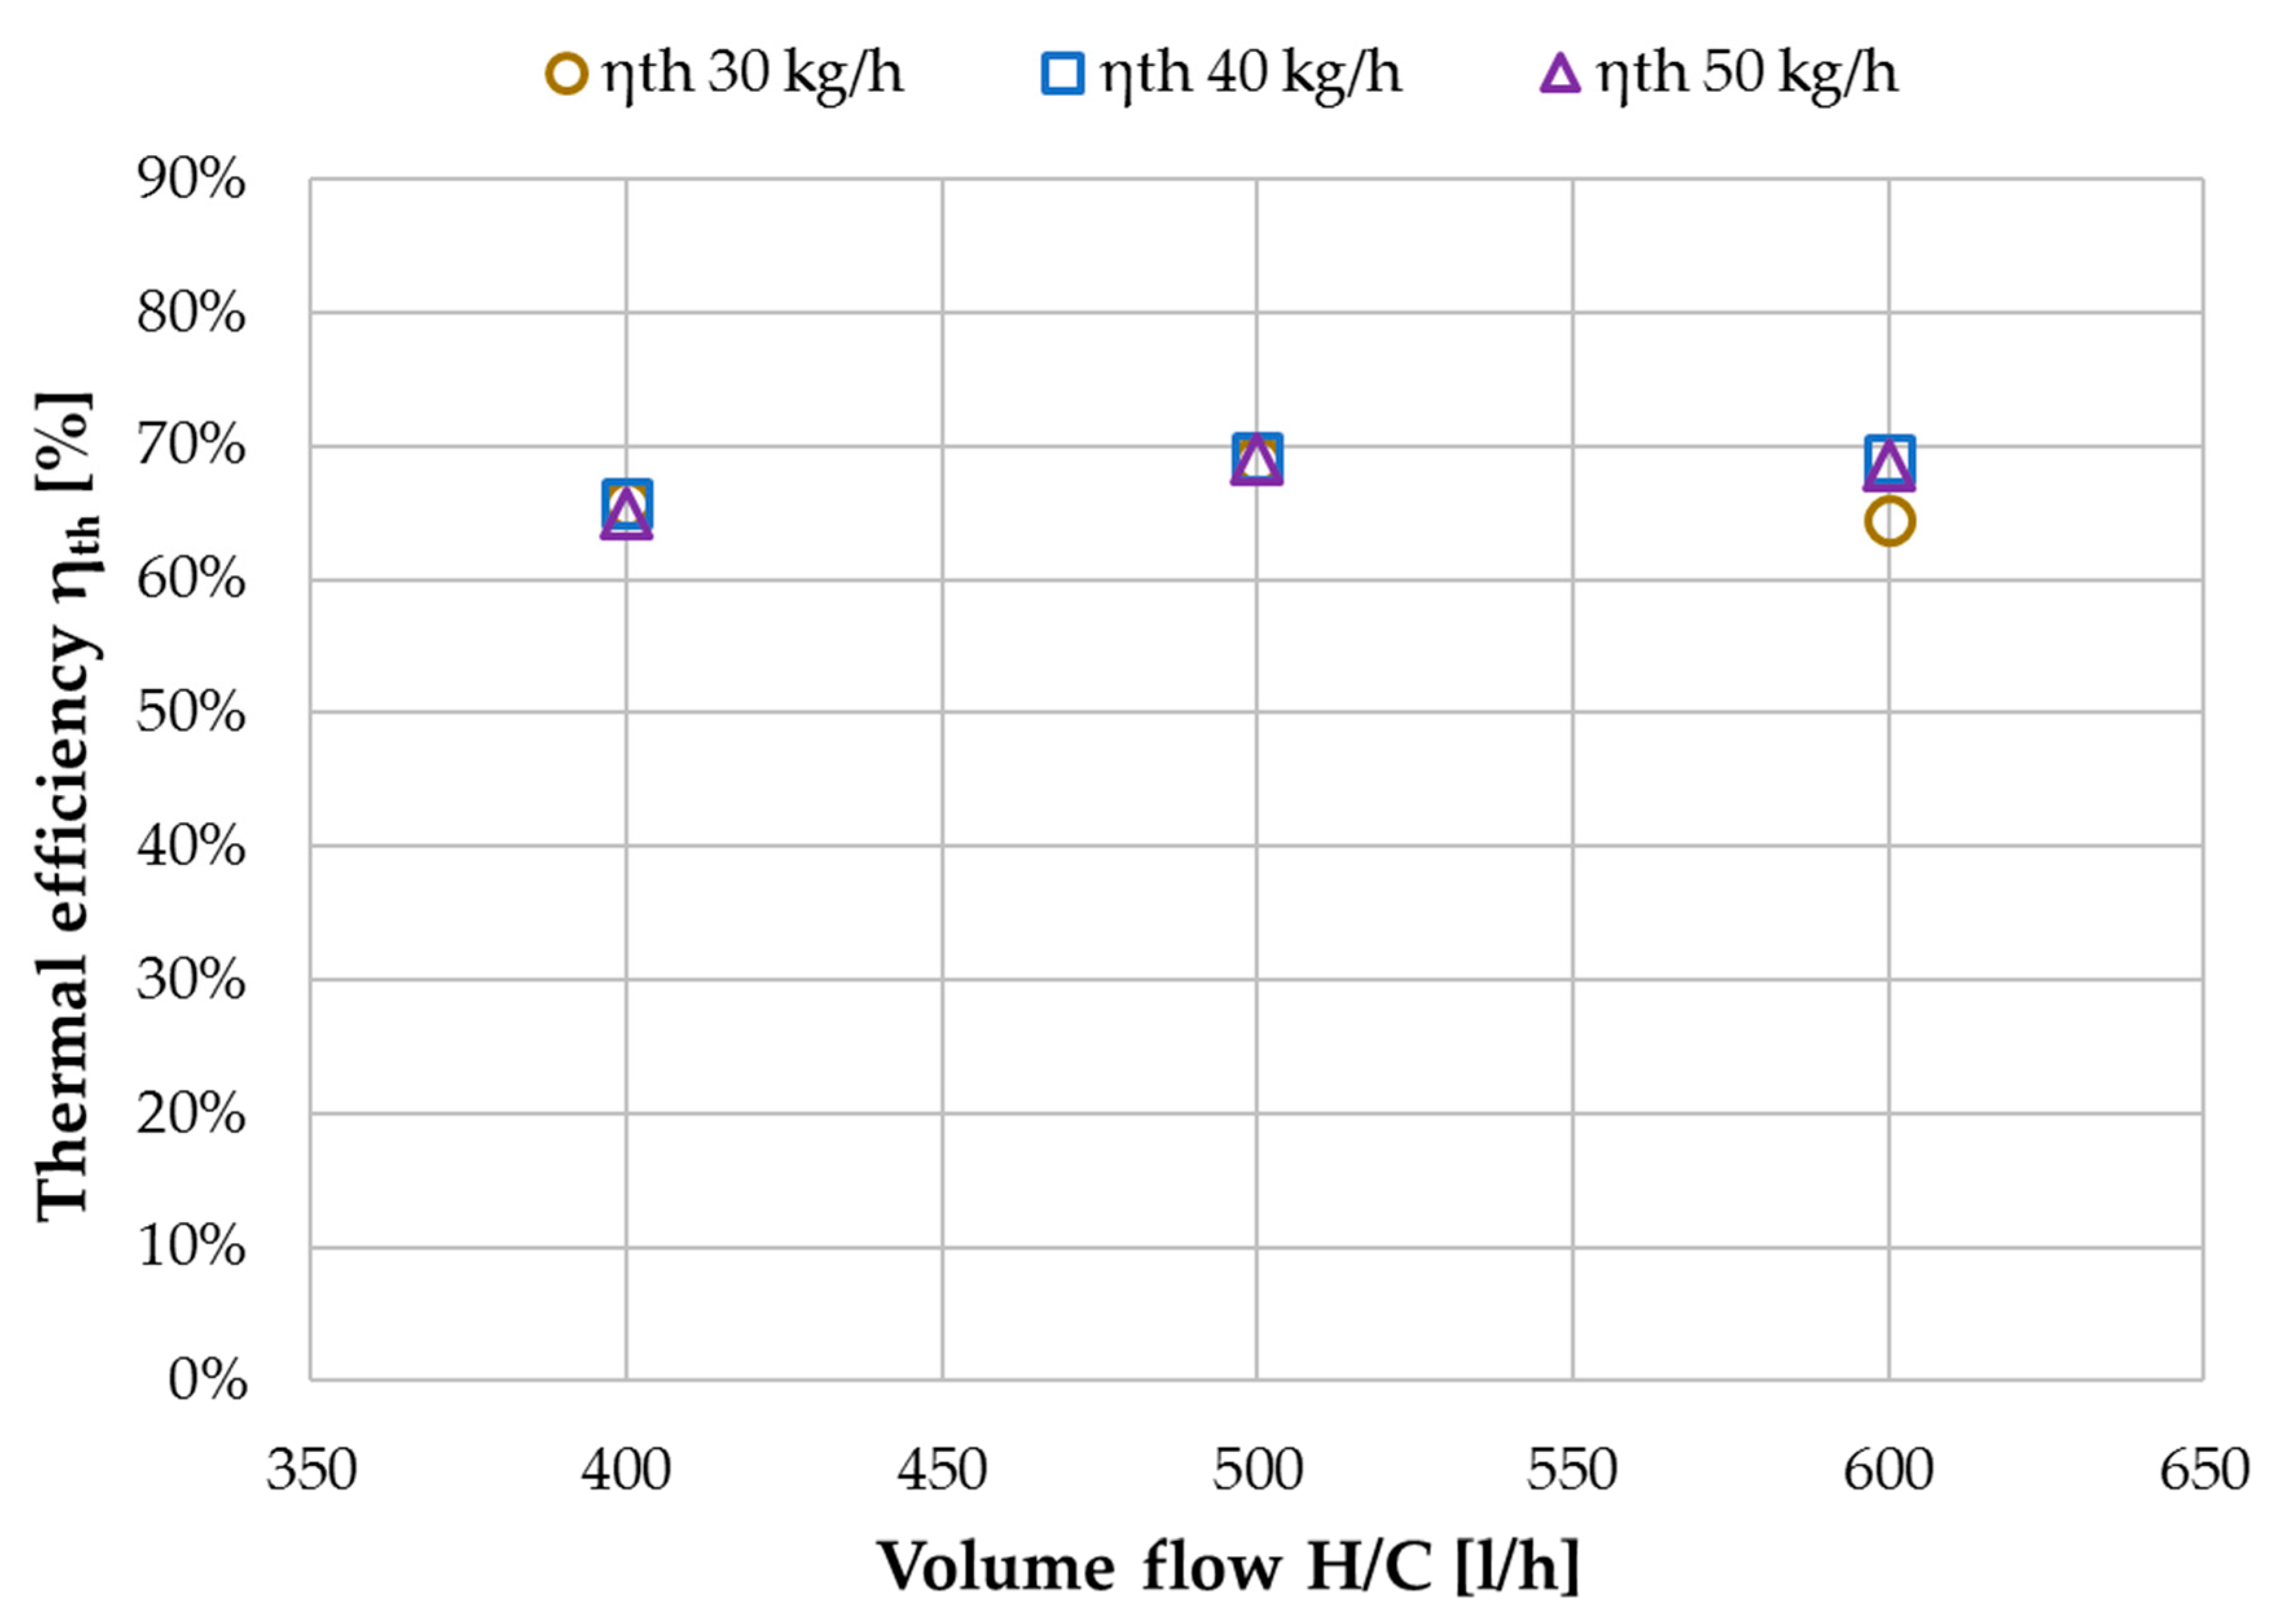
Thermal efficiency η
th (Equation (7)) indicates the fraction of latent heat in relation to the total heat transported through the membrane. Since the increase in flux is proportionate to the increase in H/C flow, the η
th values presented in
Figure 12 remain approximately constant for H/C flow variation. η
th will serve as a KPI in the comparison with a previously analyzed spiral wound module in
Section 3.4. Since
Figure 12 shows mean values for both modules, it is worth mentioning that the individual values were not identical but within ~10% of each other. The tap water characterization presented within this section has shown, that the proposed concept of a FGAGMD channel configuration with a double module strategy provided the desired operational behavior. In the new concept, the basic KPIs flux GOR, recovery ratio RR and thermal efficiency η
th. showed the same dependencies as expected in membrane distillation with a very high increase in achievable recovery rate.
3.2. Performance Characterization with NaCl Solution
Membrane distillation is capable of concentrating solutions to near saturation, provided that crystal formation does not occur. Being an ambient pressure process, limitations due to e.g., a high osmotic potential of the solution are not an issue. In MD, however, thermal energy is required to bring about the evaporation of the feed solution. With an increasing amount of salt ions in the feed solution, the required energy to evaporate the same amount of distillate increases, due to the decrease in vapour pressure of the solution. For a given MD system with defined channel geometry and fixed operation conditions, this means that flux and GOR will decrease continuously, the more salt ions are present in the feed solution. It is challenging to achieve a high GOR in hypersaline brine concentration with MD. Published data with full-scale modules is scarce but of highest importance for assessment of the real performance of MD technology. Testing and piloting result such as those presented in this work cannot and should not be compared to results achieved with tap water or measured in small scale lab equipment.
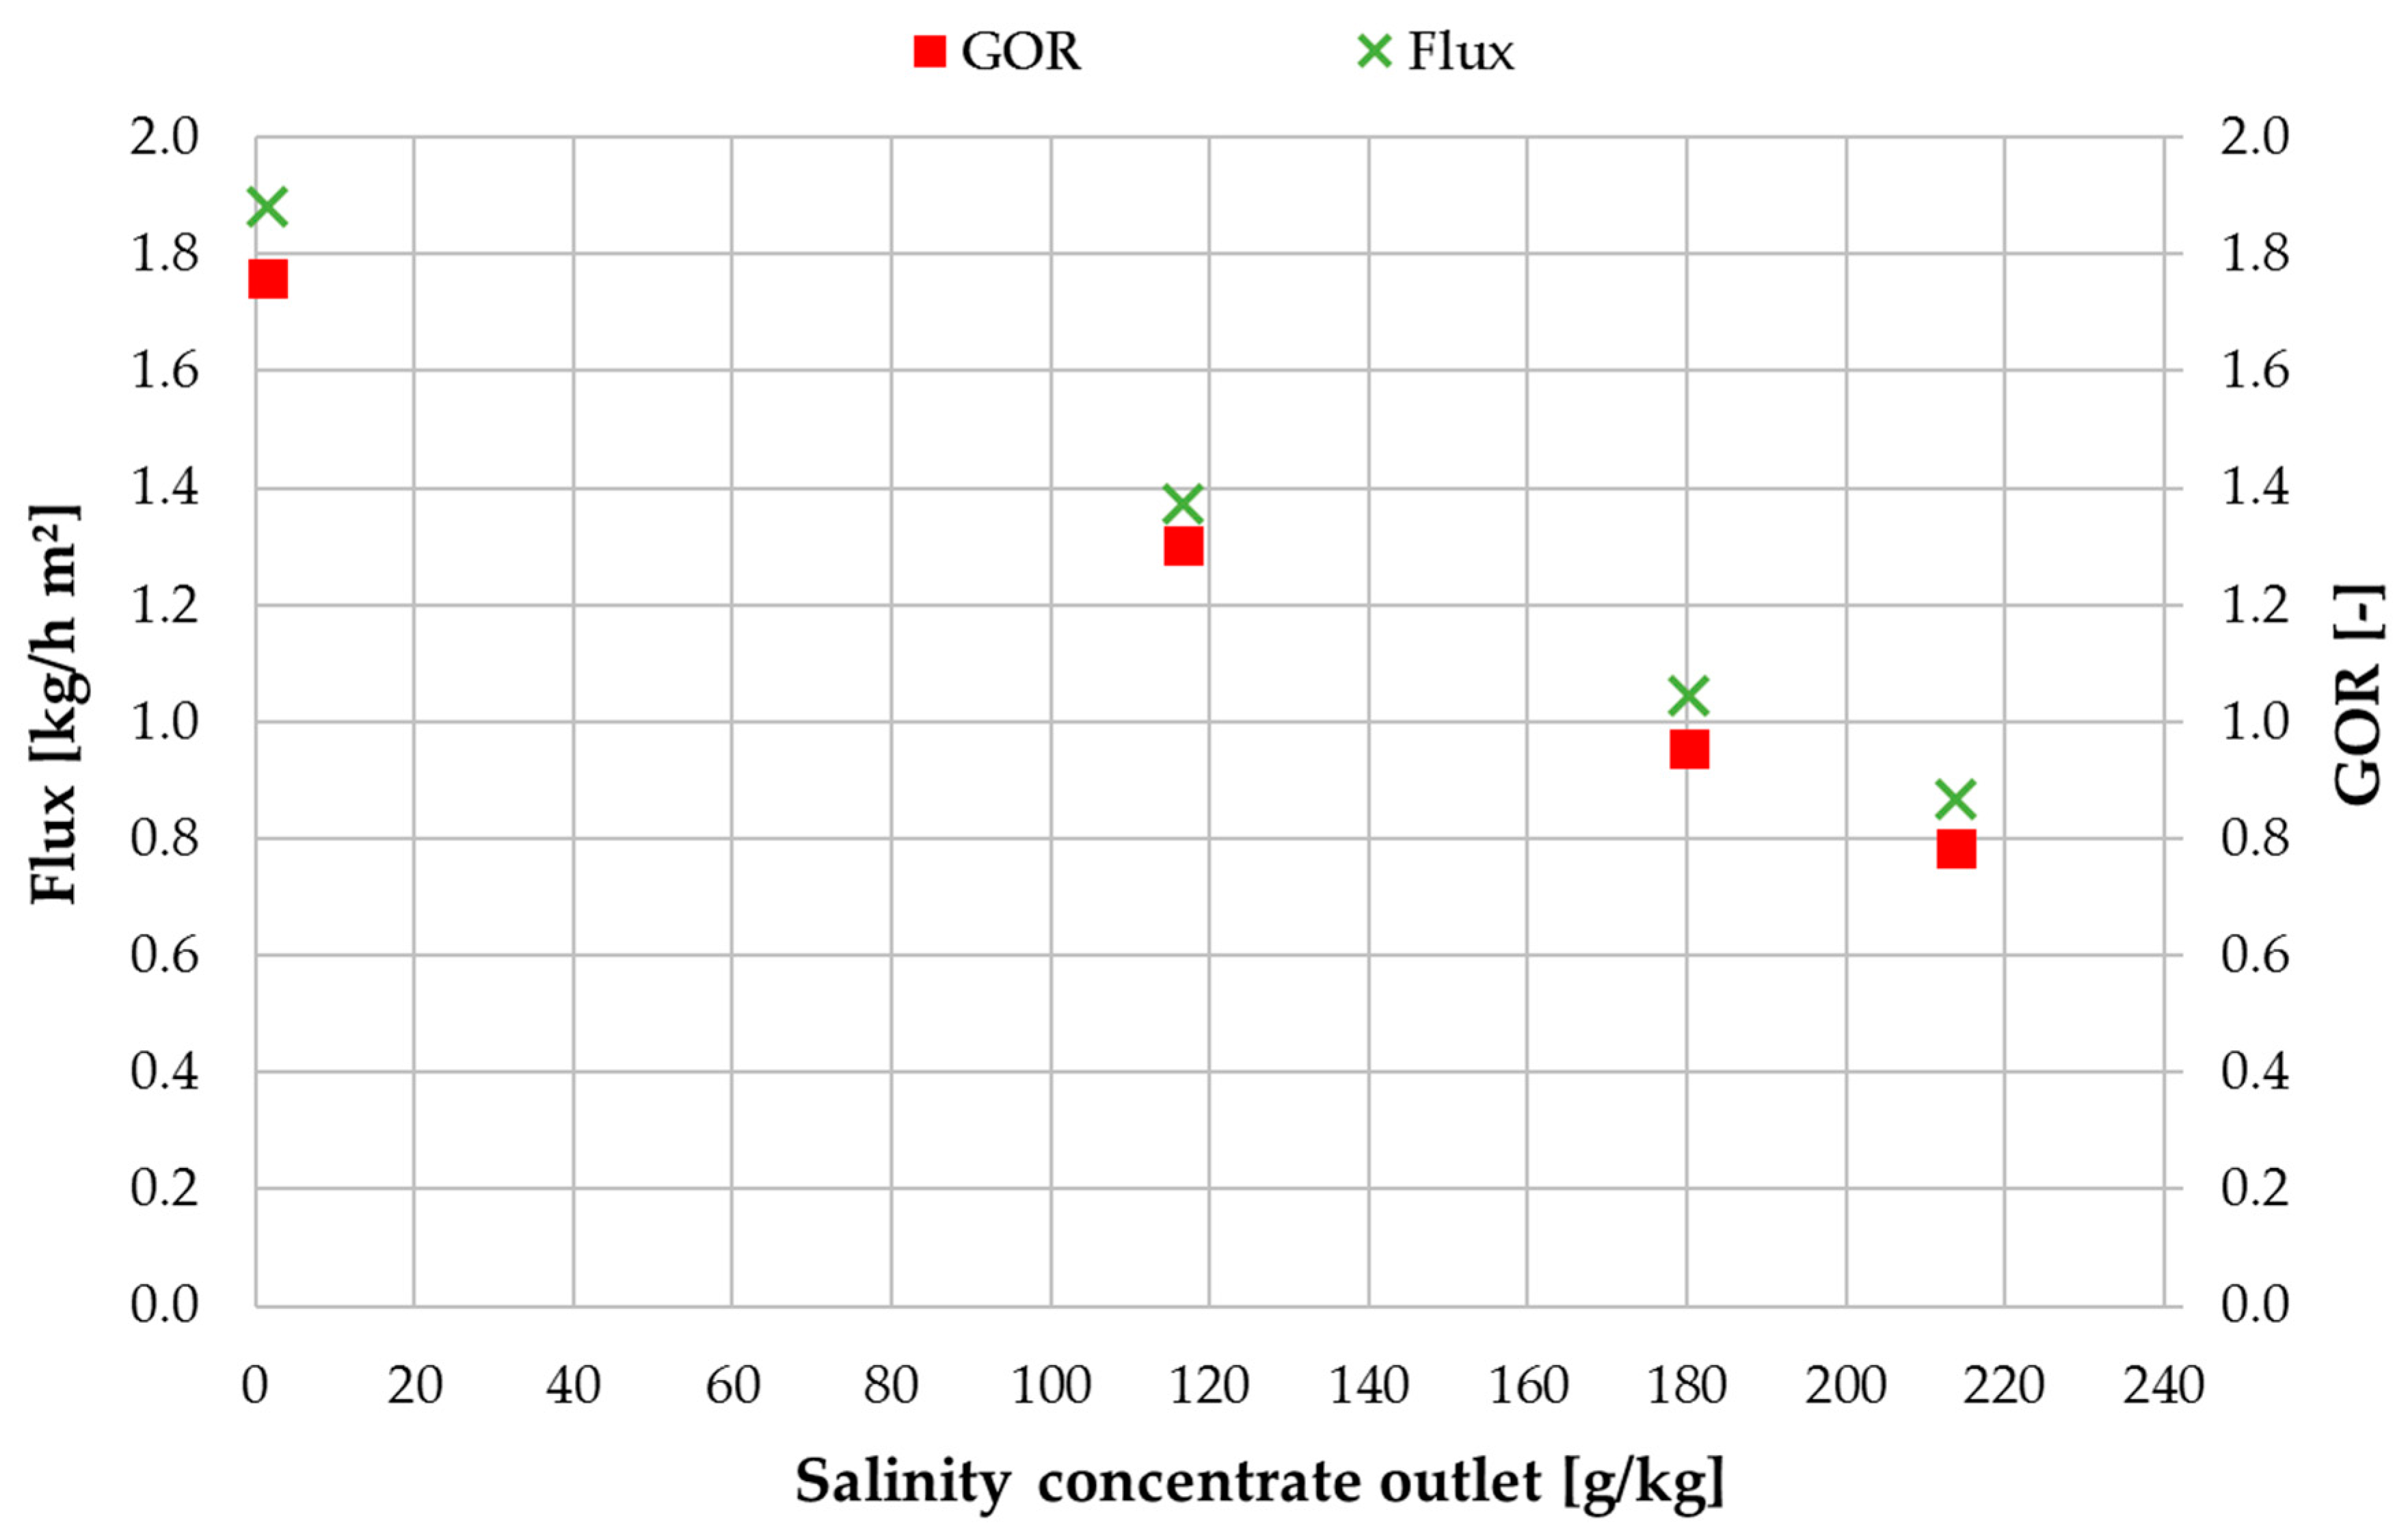
Figure 13 shows the value trend of flux in correlation with concentrate salinity at an H/C flow rate of 600 L/h and an inlet feed flow rate of 40 kg/h. The salinity of the concentrate at the outlet of MD 2 was selected for depiction on the x-axis, flux and GOR are shown on the left and right y-axis respectively. During these experiments the blower, indicated in
Figure 5, was operated continuously at an avg. air volume flowrate of 17 L/h. It has been shown by [
49] in a study with an AGMD module, that when operating with salt solutions, the benefit of optimal draining of the distillate in the air gap channel has a significant positive impact on the distillate quality. A low-pressure air blower is an efficient method of improving the draining. The distillate conductivity was below an avg. of 1 mS/cm during all the salt solution measurements. The well-known impact of vapour pressure reduction [
39] can be observed distinctly in
Figure 13. Beginning at ~1.9 kg/h for the lowest salinity, flux reduces to 0.87 kg/h for the highest outlet salinity of 214 g NaCl/kg. The succession of GOR values is corresponding to this and provides a range of 1.76–0.78 depending on the concentrate salinity.
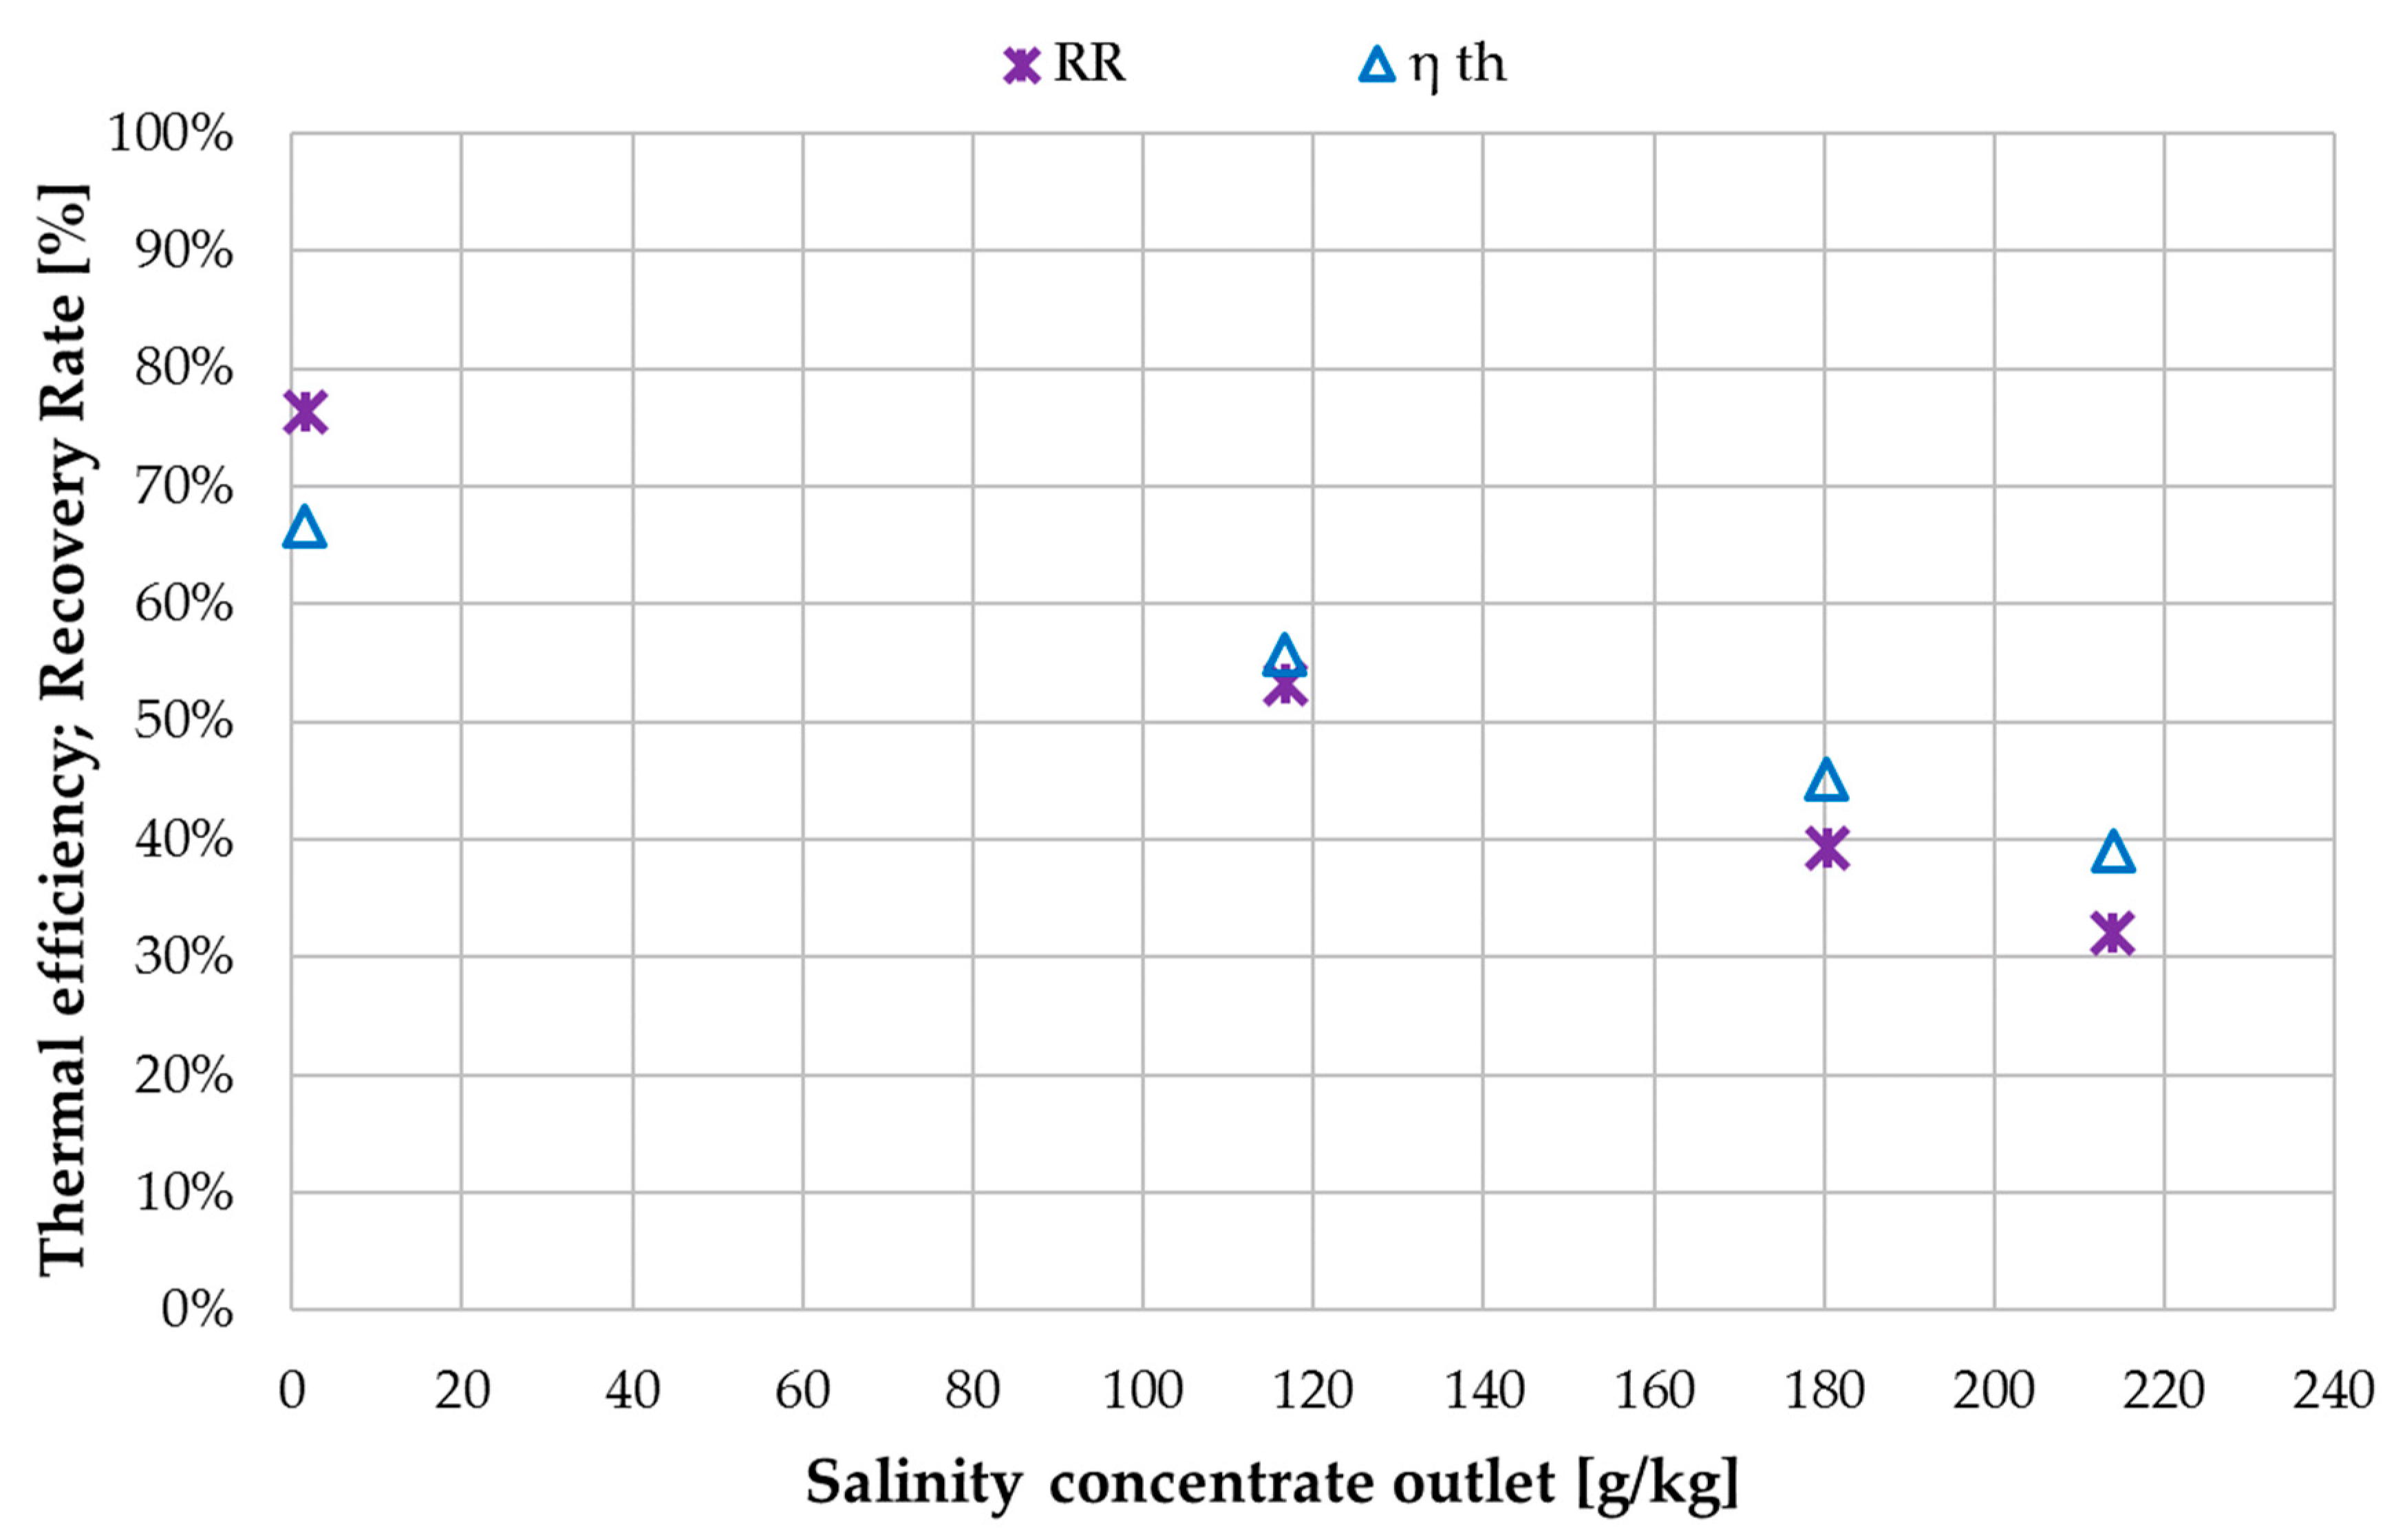
The decrease in thermal efficiency ηth over salinity is shown in
Figure 14. The reduction in vapour pressure caused by the increase in dissolved ions in the solution reduces the effective driving force for evaporation. Thus, the ratio of heat used for actual phase change in relation to the total heat transferred through the membrane and air gap shifts with increasing feed salinity. With tap water, 67% of the total heat is being used for evaporation. At 214 g NaCl/kg this fraction is reduced to 39%. The recovery ratio is furthermore affected by the reduction in flux. At the lowest salinity of 1 g NaCl/kg, 76% of the feed going into the inlet of MD 1 is extracted as distillate. This means that 9.6 kg/h exits MD 2 out of the 40 kg/h which entered MD 1. At 214 g NaCl/kg, the recovery ratio RR reduced to 32% as a result of the reduced flux.
3.3. Ratio of H/C Solution Flow to Feed Flow
For a deeper understanding of the benefits of the overall module and system concept some key facts should be elaborated more closely. The goal of the concept is to achieve the desired increase in feed solution concentration in a single pass process. This was not achieved in this particular prototype system due to a restriction in the systems operation. The H/C flowrate was limited to 600 L/h, due to the capacity of pump
PH/C. As established by the evaluation of the tap water characterization measurements, the ratio of heating and cooling flow rate to feed flow rate has a high impact on the recovery ratio. The effect is connected to the proportionally higher flux production out of the same amount of feed flow when increasing the H/C flow rate. Thus, a new ratio
RF is established (Equation (9)), which describes the quotient of H/C mass flow
to feed mass flow
.
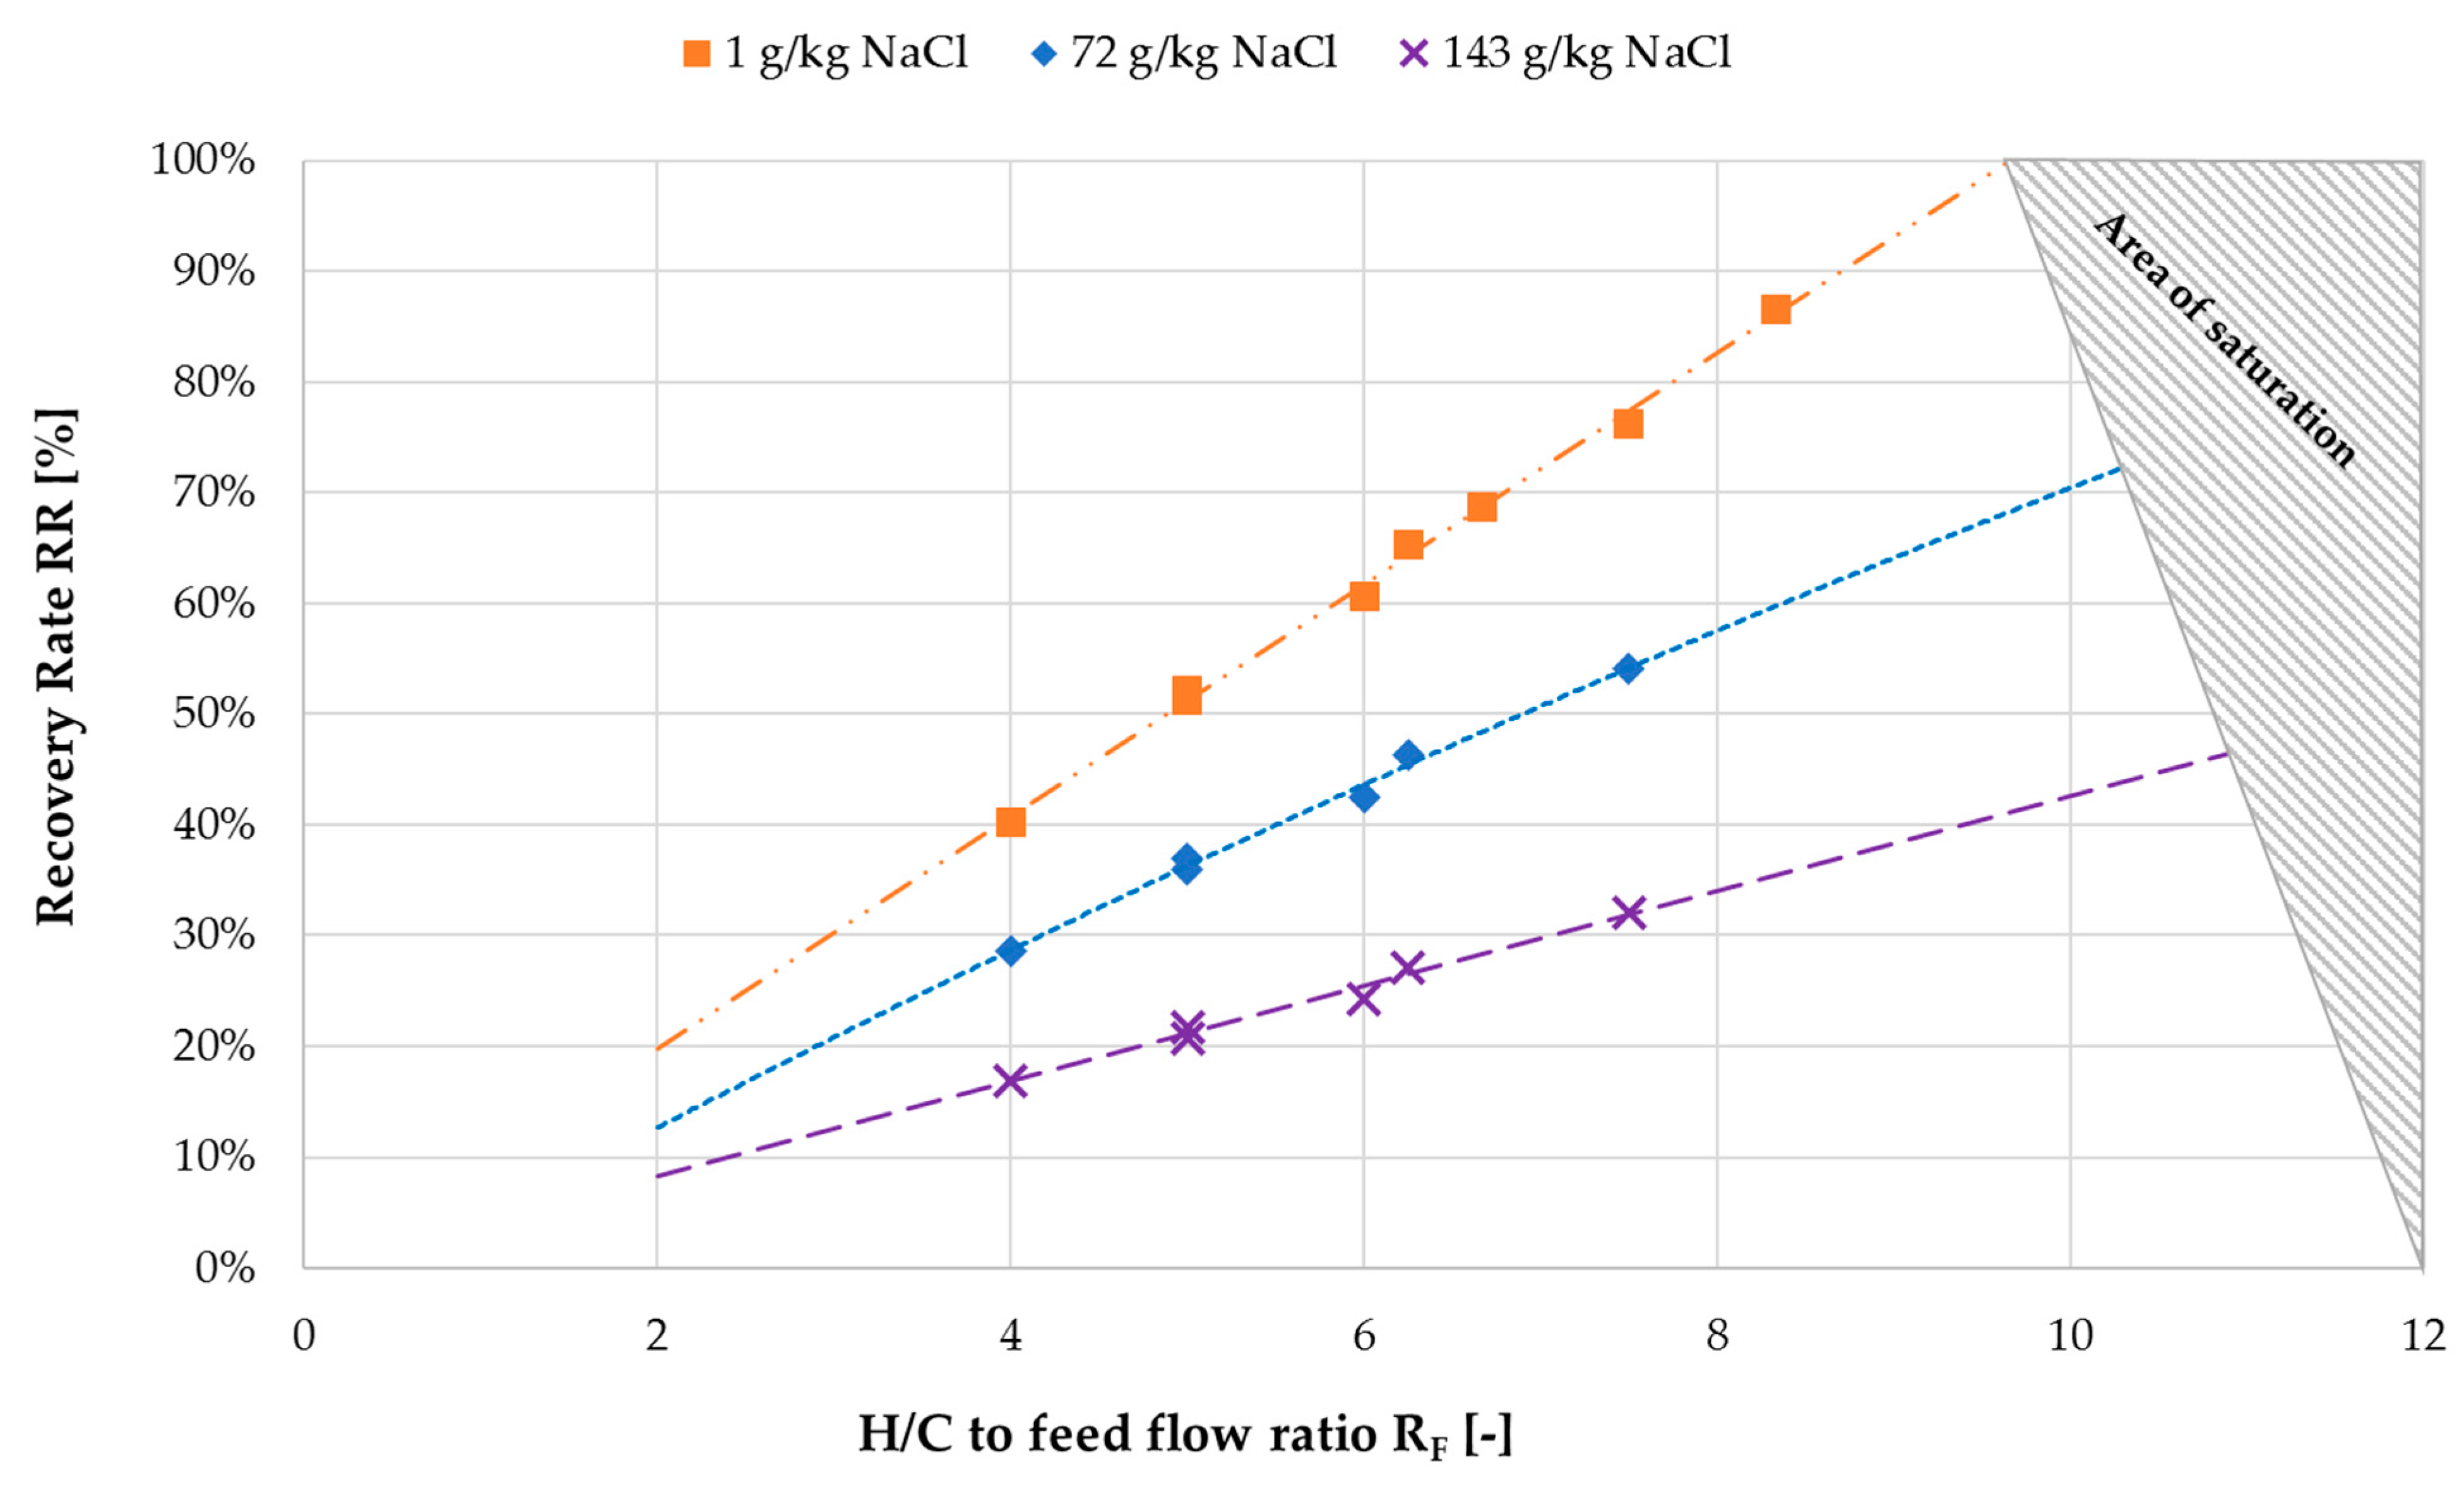
Figure 15 depicts the influence of
RF on recovery ratio RR for three different feed salinity levels. The impact of both
RF and salinity on recovery ratio can now be observed. Linear fit curves are used to show the progression of the recovery ratio with increasing
RF. The required
RF for a desired recovery ratio increases with increasing feed salinity. For example, for a required RR of 50% in a single pass process at an inlet feed concentration of 1 g NaCl/kg,
RF of ~5 would be sufficient according to the operating temperatures of the pilot system. At 143 g NaCl/kg inlet concentration however, the inclination of the values is much lower and a higher
RF would be required, taking into consideration that NaCl–H
2O solution is saturated at ~253 g NaCl/kg. These correlations are dependent on the module’s channel length and are only valid for this specific module. Nonetheless, the principles for future module and process design remain equal for any geometry. For a given inlet feed concentration and a desired final concentration,
RF must be determined in order to achieve the required recovery ratio. Certain boundary conditions must also be considered. In order to sustain overall efficiency, the feed flow cannot be lowered to a value that does not supply a sufficient amount of feed to MD 2. The negative effects on GOR and thermal efficiency were analyzed in
Section 3.1. In addition, a safety margin to prevent saturation of the solution in MD 2 should be added to the minimum feed flow rate.
The recommended procedure for selection of feed inlet flow rate and RF can be summarized as follows:
Determination of feed concentration;
Selection of desired outlet concentration;
Selection of required RF;
Determination of minimum feed flow;
Calculation of H/C flow rate according to RF.
Depending on the available heat supply, the channel length of the modules will be designed. Channel length selection is a key parameter in MD module design, both technologically as well as economically as explained in detail in [
22]. However, the GOR and flux are much more sensitive to channel length modification than the overall output of the module. In consequence,
RF ratios are not expected to change in a large magnitude for the same temperature profile and channel lengths within 4–9 m.
3.4. Comparison with Spiral Wound Air Gap Membrane Distillation (AGMD) Module
Within this work so far, a novel type of MD configuration was presented and analyzed. The analysis was based upon a first-generation prototype plate and frame module. A comparison with the previously studied spiral wound AGMD module type should nonetheless be conducted at this stage in order to identify any possible disadvantages of the overall concept. Even though the packaging of the modules is different, no significant differences in the influence of operational parameters on the KPIs of the process are expected. Materials and membrane types are identical.
The data used for comparison is extracted from a study with an AGMD spiral wound module and hypersaline brine which can be found with [
49]. The AGMD module had a 6 m channel length and was operated with the same flow of 300 L/h.
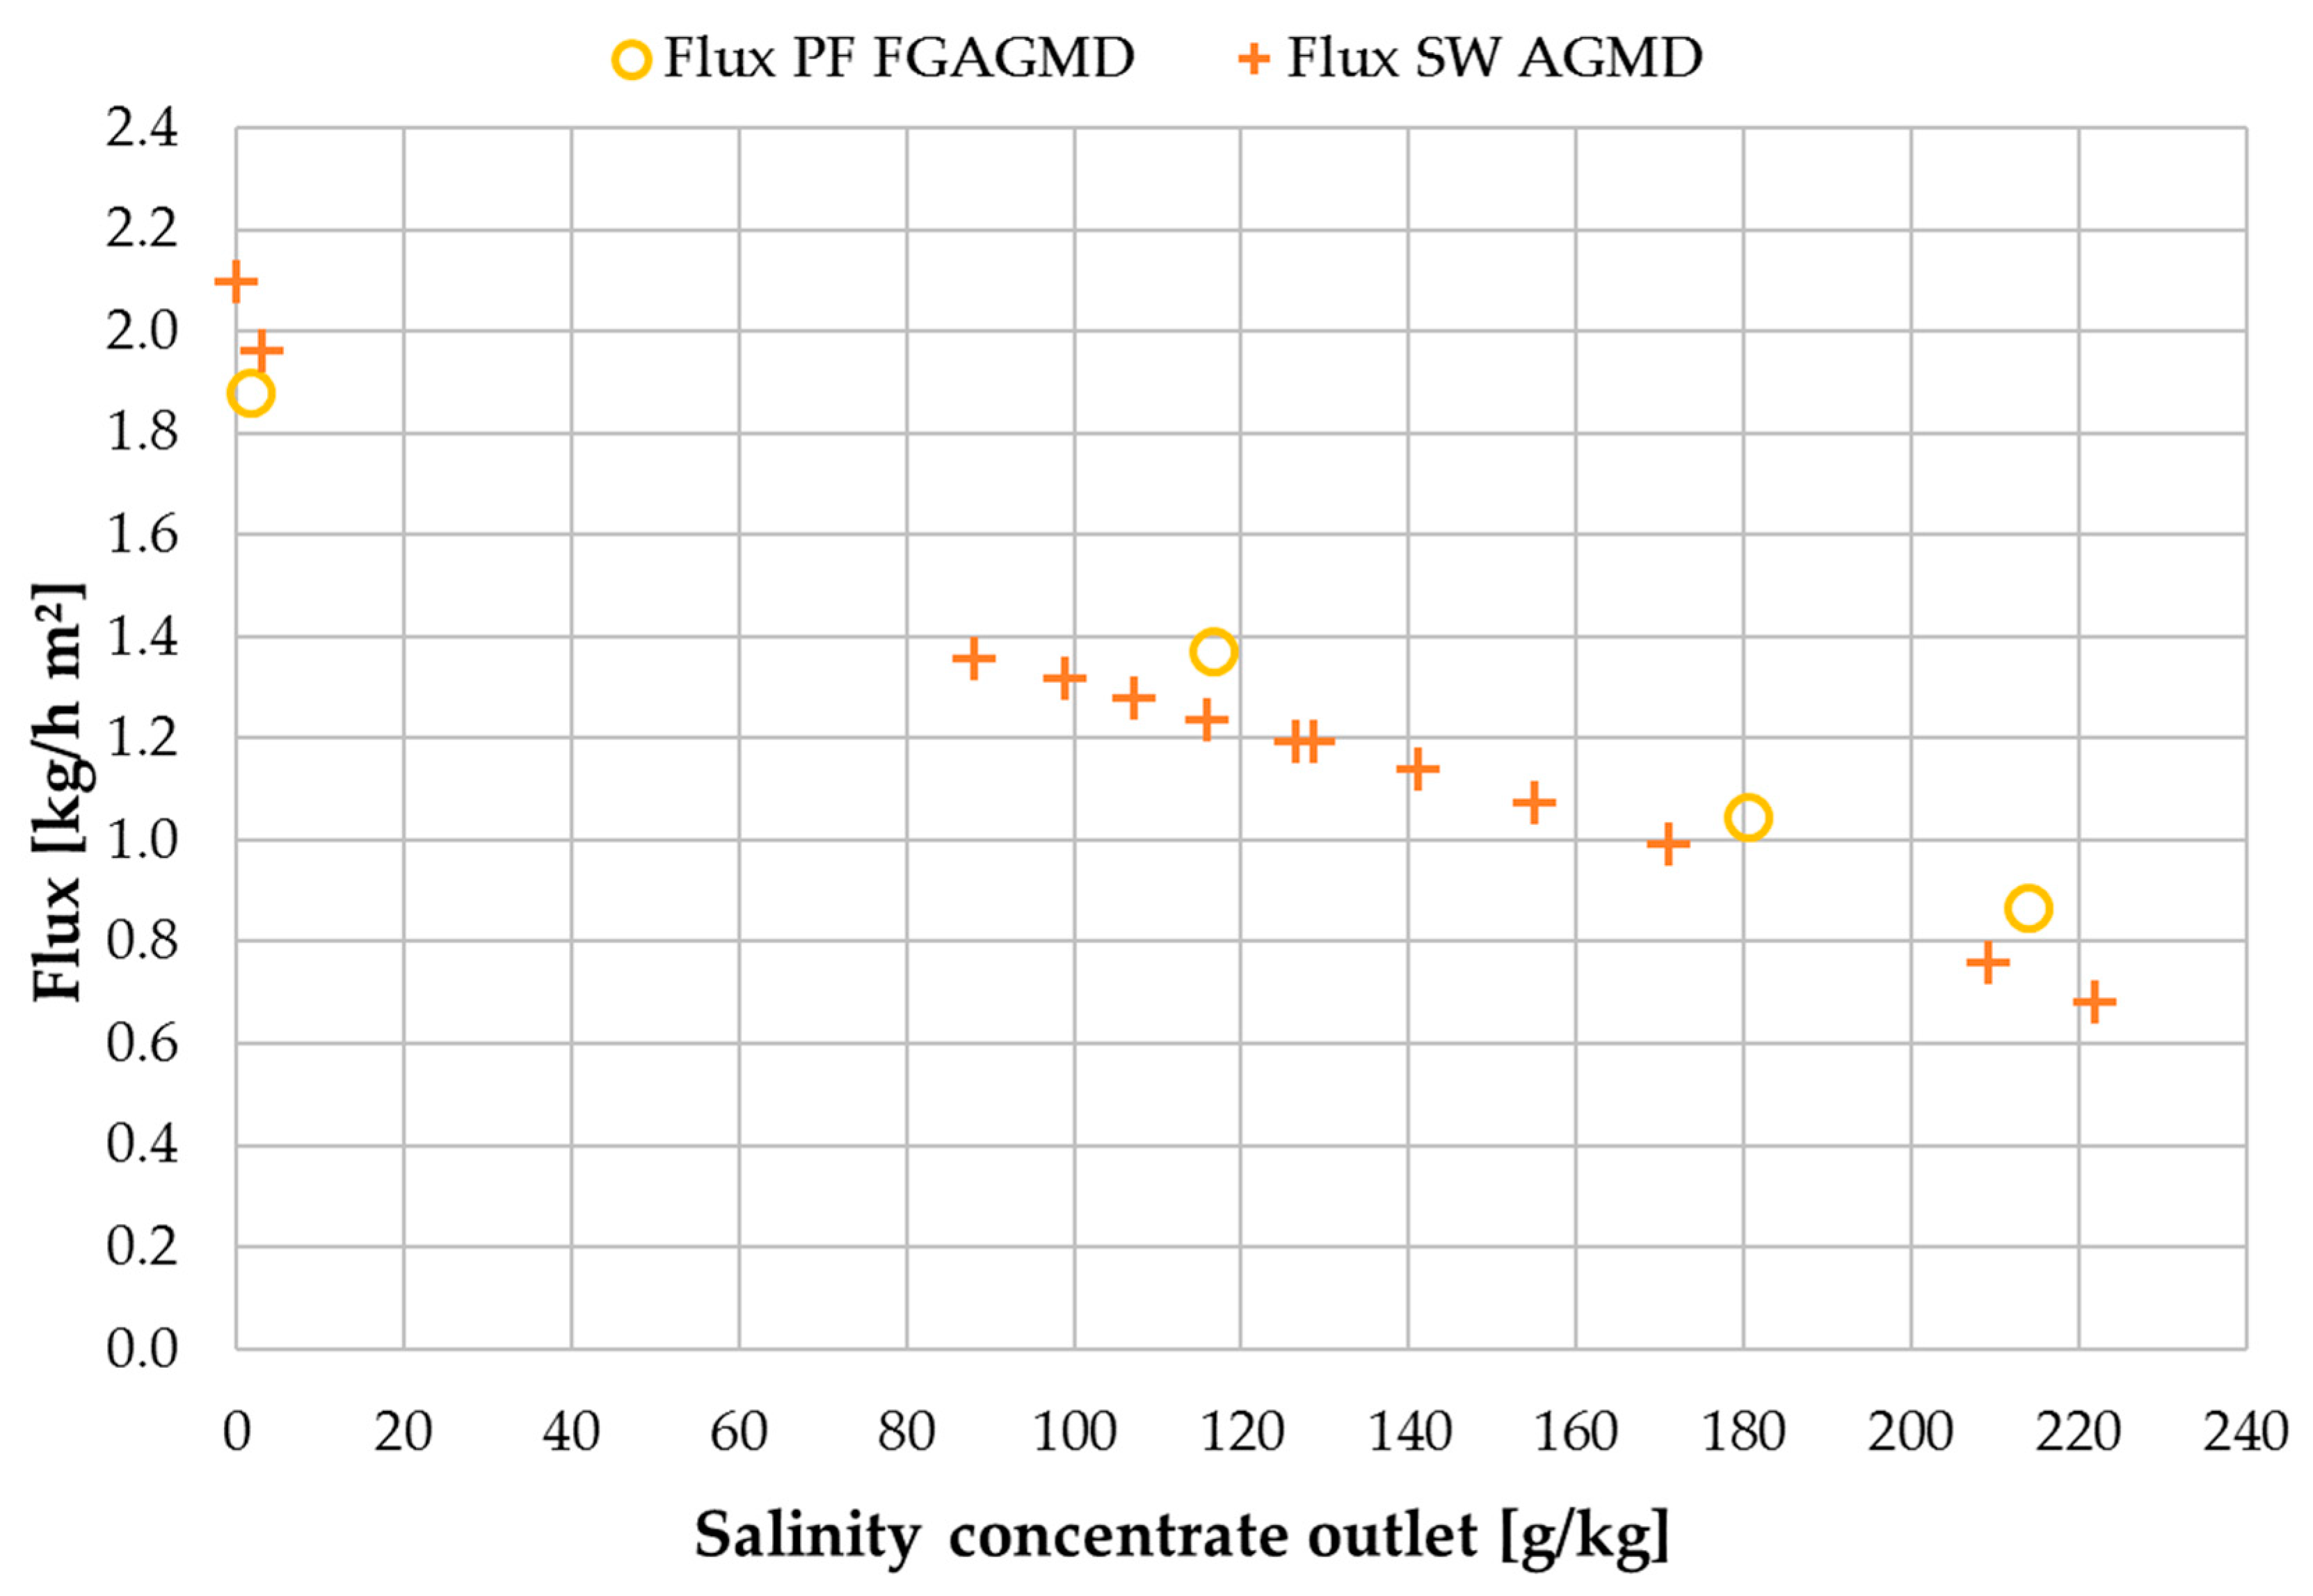
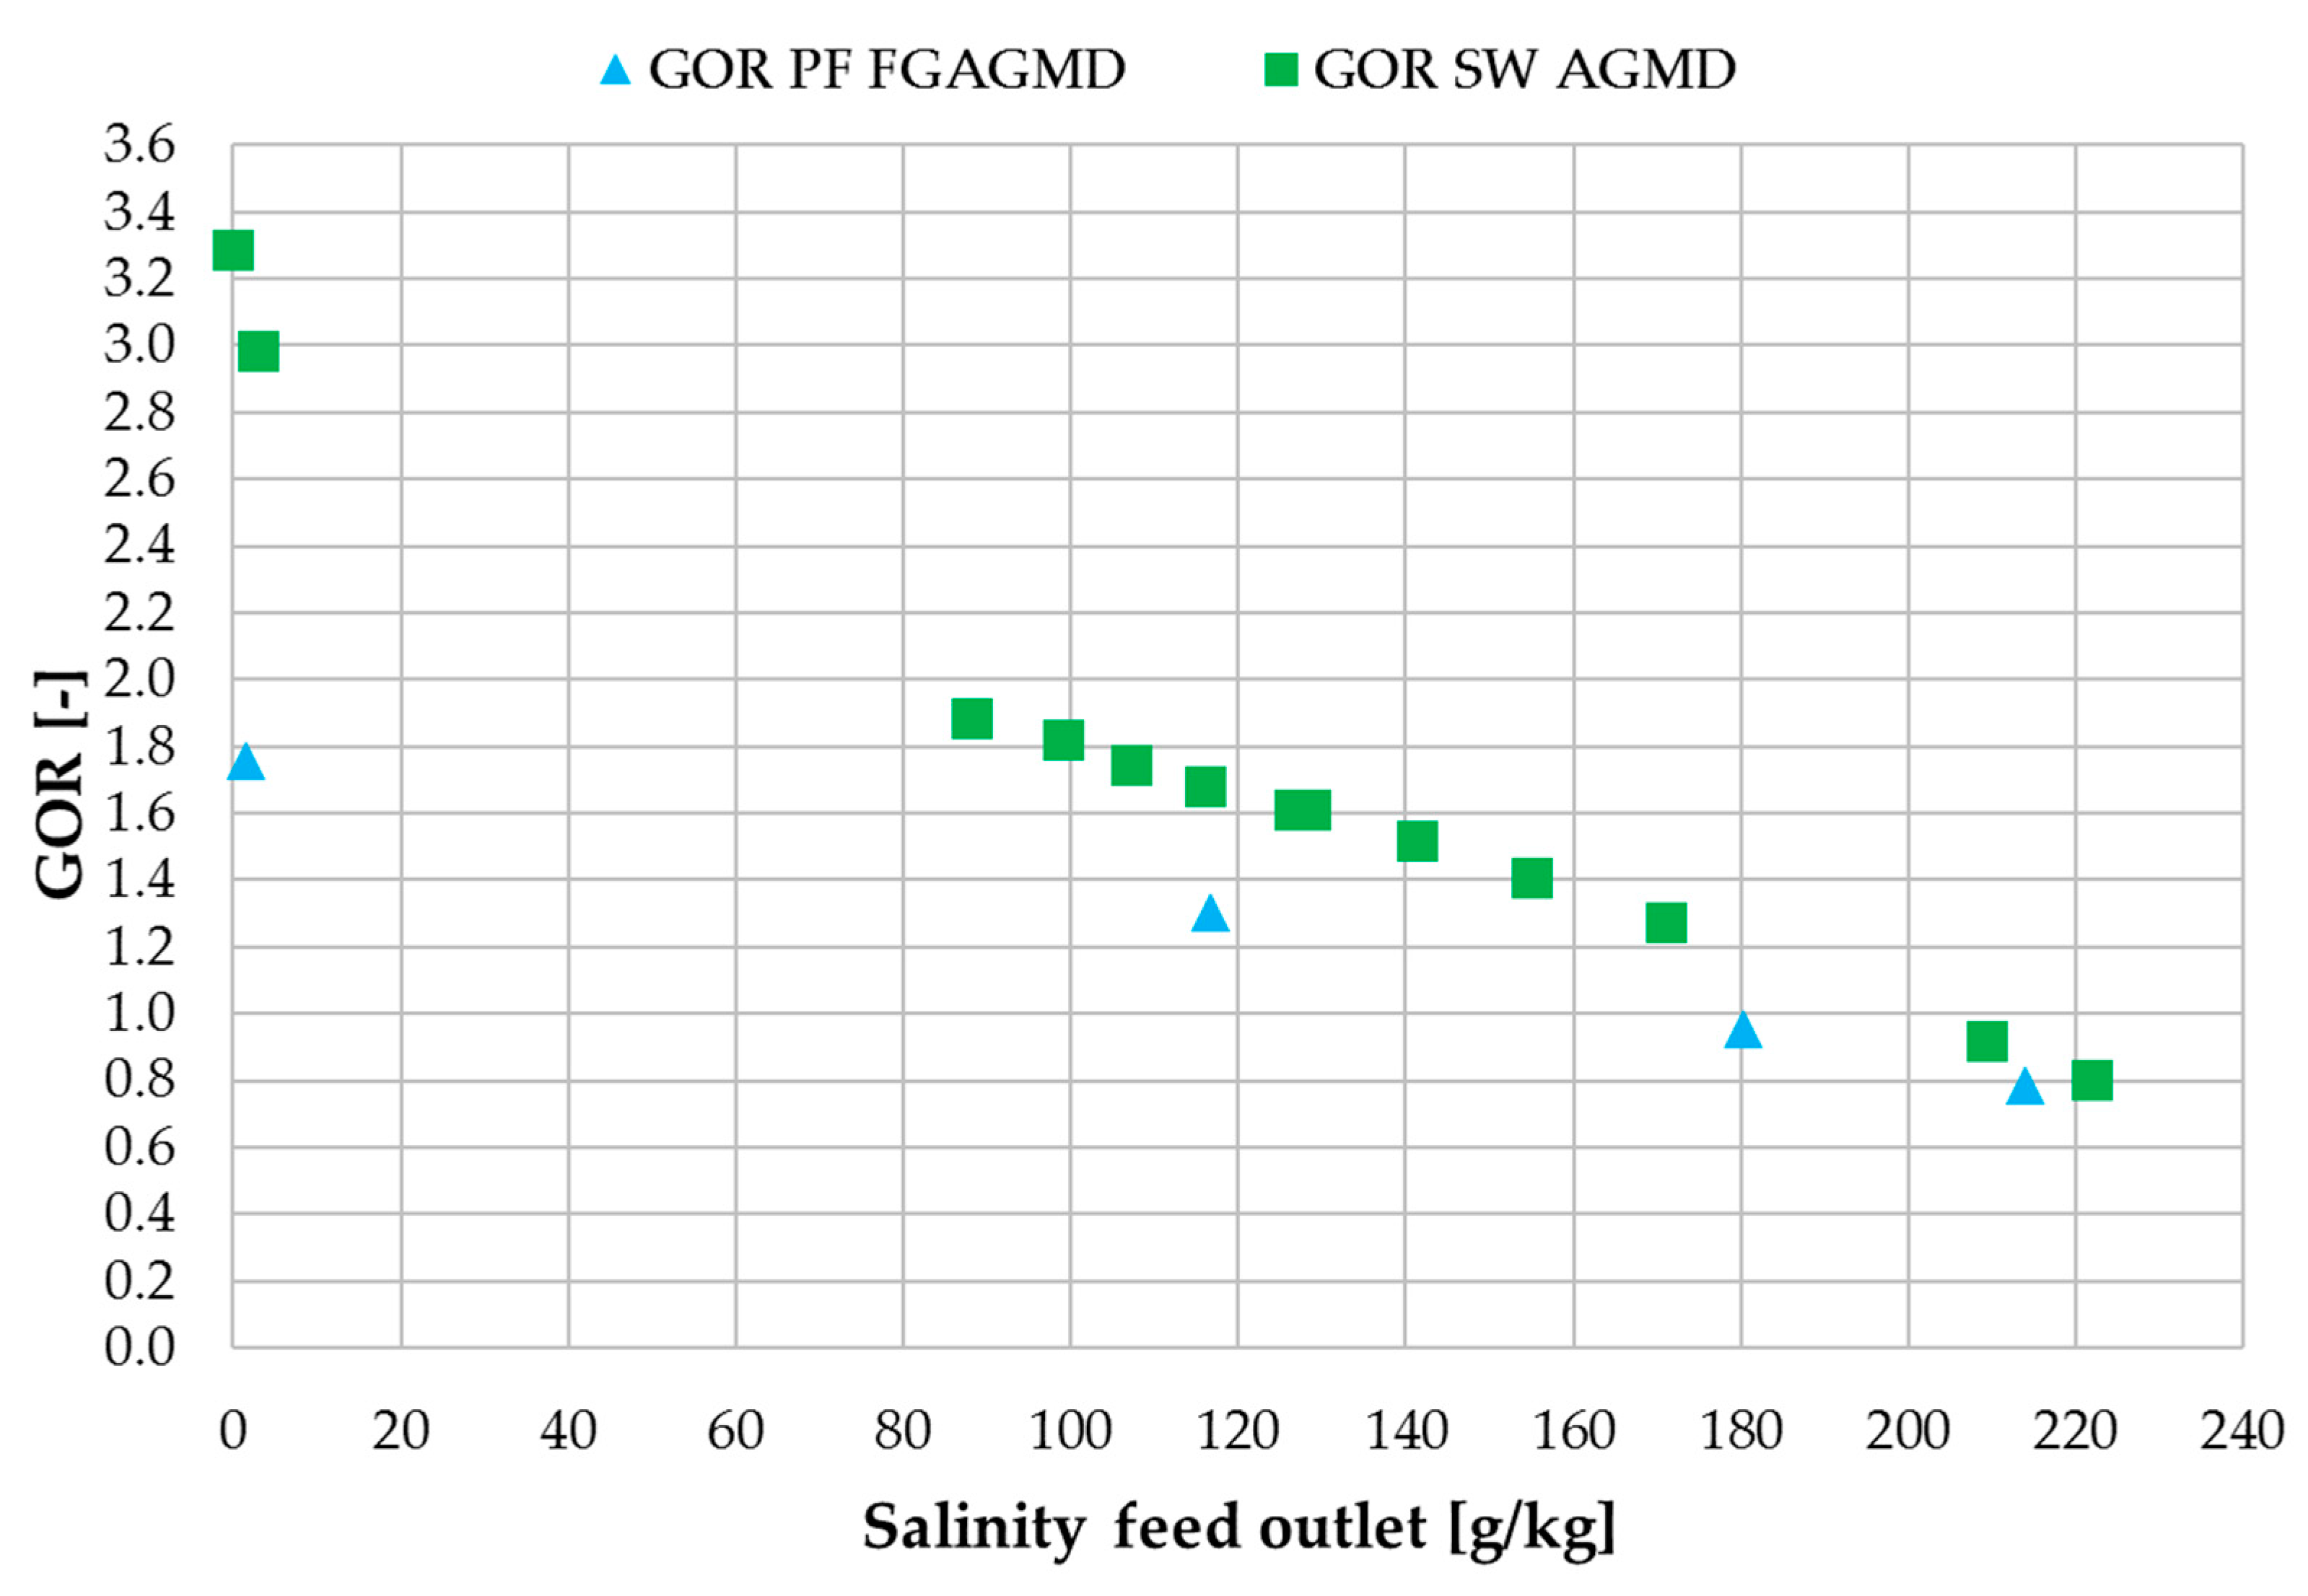
Figure 16 shows flux and
Figure 17 shows GOR values of both modules in direct comparison. Flux values for both module types are very similar but with slightly higher values for the spiral wound for tap water and slightly higher values for the plate and frame for at salinities above ~80 g NaCl/kg. This shows that for a similar channel length and under the same operating conditions regarding the heating and cooling flows, the flux is similar regardless of the module type. The internal heat recovery of the modules expressed as GOR, however, shows some differences especially at tap water salinity. This effect can be assigned to the additional heat-transfer resistance added by the feed gap in the plate and frame. In the low-salinity region where vapour pressure depreciation does not have an impact, the larger delta T caused by the additional thermal resistance leads to a higher energy requirement per mass unit of distillate which directly effects the GOR. At the same time, this higher effective delta T leads to advantages over the spiral wound module at higher conductivities since more net driving force is available after subtracting the fraction of driving force lost to the reduction in vapour pressure. The asymmetrical temperature profiles in the FGAGMD module shown in
Section 3.1. also account for a reduction in the overall GOR values of this module type.
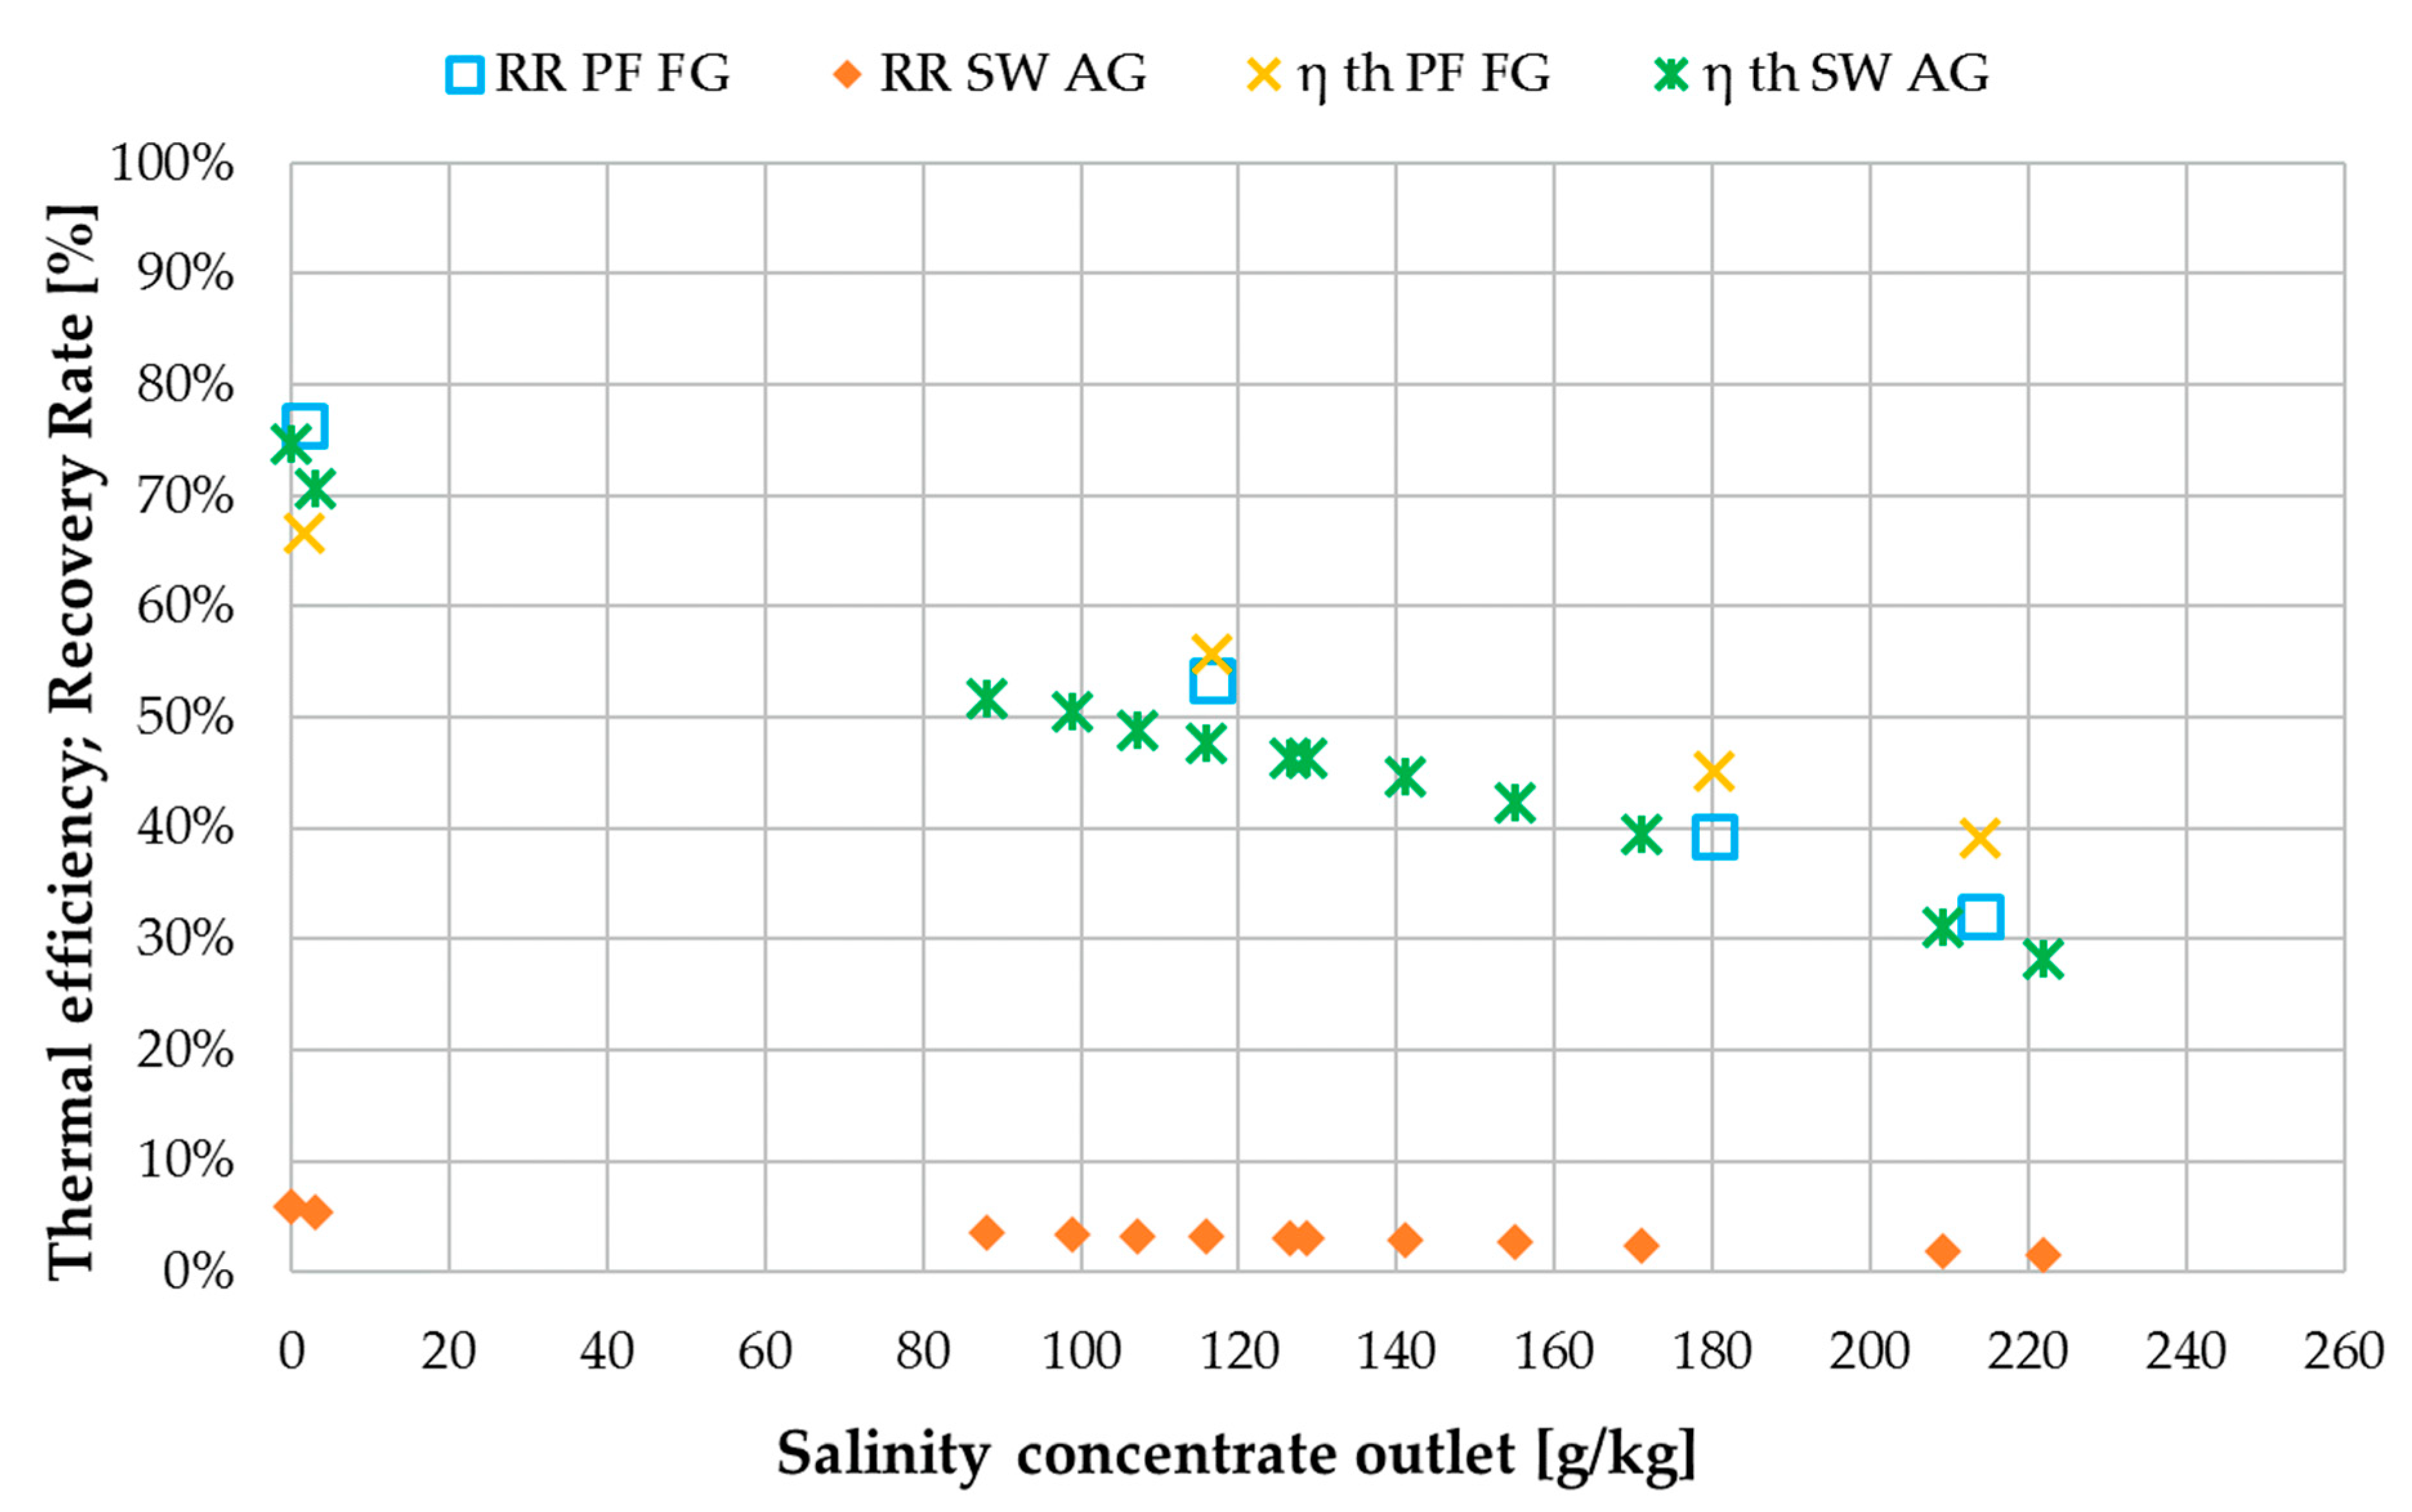
When comparing recovery ratio and thermal efficiency shown in
Figure 18, the most significant difference is in the recovery ratio. At tap water the difference is 70% and at 214 g NaCl/kg the difference is still approximately 30%. The enabling of such high recovery ratios was one of the core motivations for the implementation of the new FGAGMD channel configuration. As mentioned previously, the recovery ratio of the spiral wound AGMD module is not independently adjustable due to the coupling of heat supply and feed supply. Thermal efficiency values are similar for both modules with the largest differences at the low end of the salinity range. On average for the entire salinity range tested, however, η
th of the FGAGMD module was higher by approximately 4% compared to the spiral wound module.
From the direct comparison of the two module types, it can be deducted that even in this first prototype stage, the plate and frame (PF) FGAGMD module has a general advantage over the spiral wound (SW) AGMD module when implemented in high concentration applications. Under the assumption that e.g., a RO brine at a salinity 7 g NaCl/kg should be concentrated to 240 g NaCl/kg [
22], at the resulting avg. salinity of 155 g NaCl/kg the FGAGMD module is be superior in performance regarding flux, η
th and RR with only small drawbacks in GOR.
Table 4 provides a summary of KPIs at the mentioned avg. salinity of 155 g NaCl/kg.
Further potential for improvement on the plate and frame module design is definitely given, especially regarding flow distribution and channel geometry. It is expected that similar GOR values to the AGMD module will be possible after optimization of the inner components of the module. Furthermore, an increase in channel length can be considered in order to increase the GOR. This will, however, decrease the flux and require more membrane area. The application of vacuum to the air gap would have a significant positive effect on efficiency, though drawbacks in distillate quality are to be expected when implementing this option.

 ,
, 
