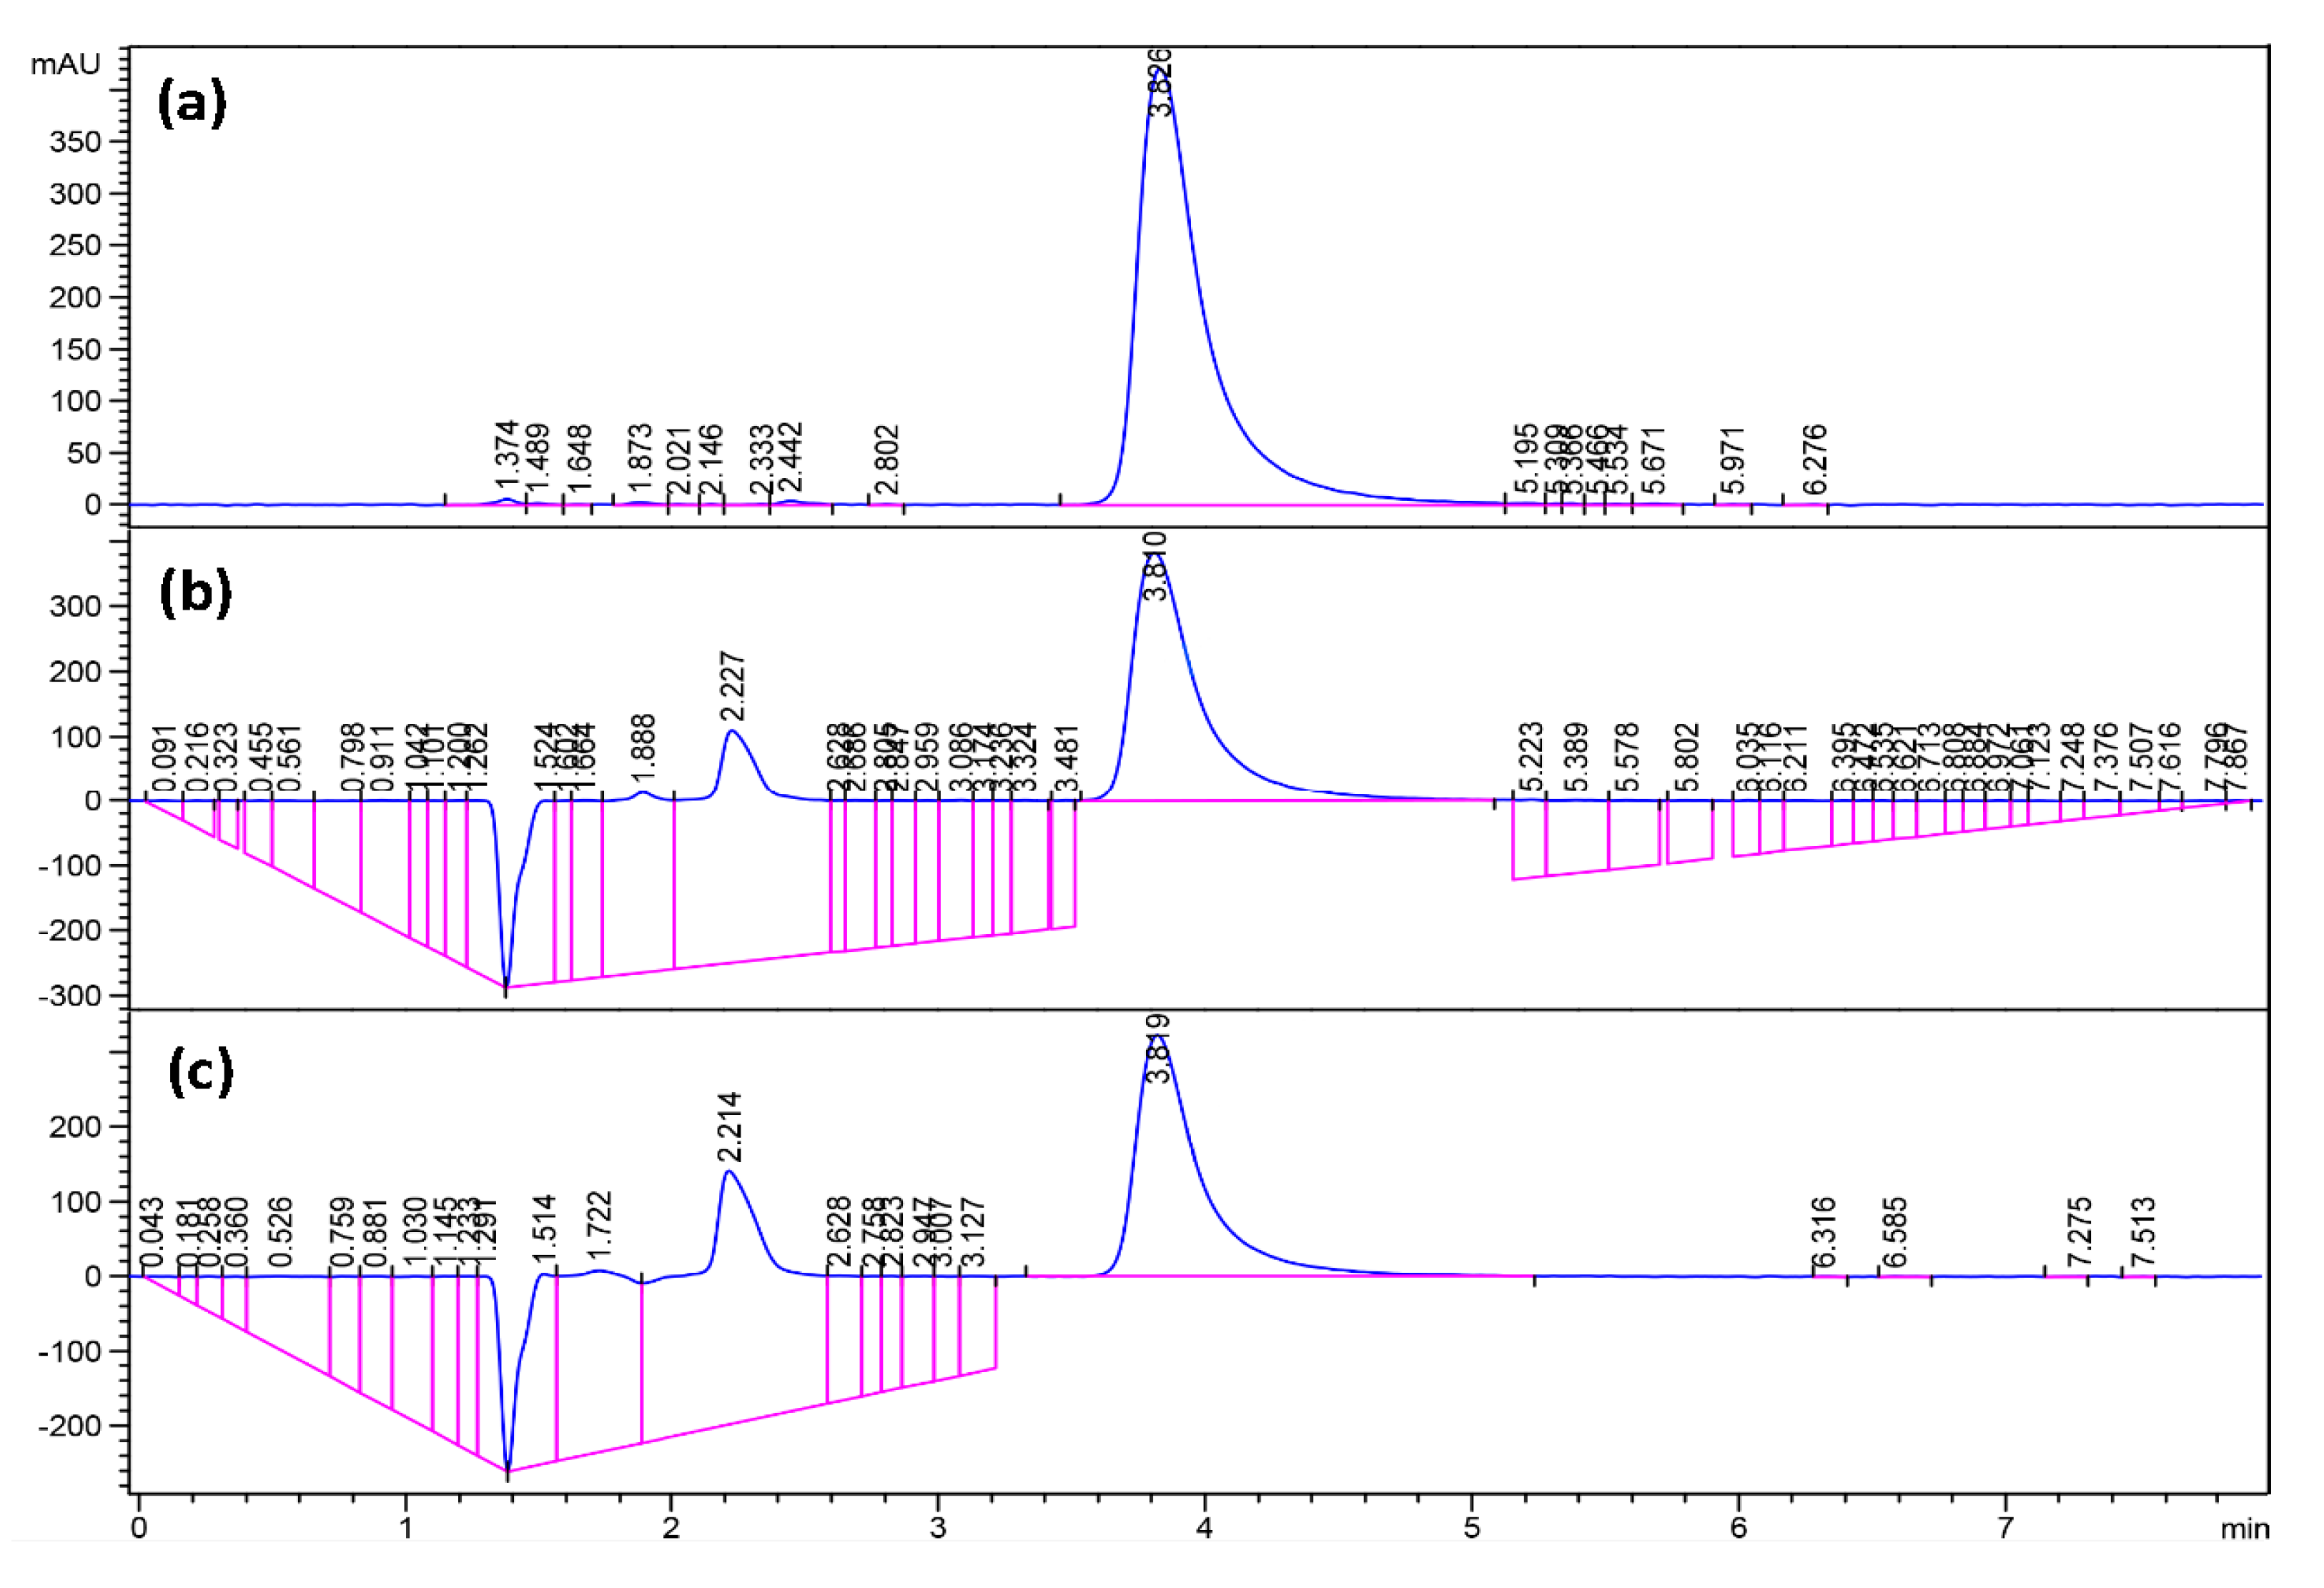
3.1. Polymer Characterization
Gel Permeation Chromatography (GPC) was used to determine the molecular weight, polydispersity index (M
w/M
n), and hydrophilic fractions (f) of the synthetized copolymers. GPC analysis was performed using an Agilent 1100 High-performance Liquid Chromatography (HPLC) System (Agilent Technologies, Santa Clara, CA, USA) equipped with a refractive index detector (G1362A). Analysis was performed on an Agilent PLgel MIXED-C column (Agilent Technologies, Santa Clara, CA, USA), 5 μm, temperature was 30 °C. Calibration was performed using polystyrene standards with a narrow molecular weight distribution (EasiVials PS-M, Agilent Technologies, Santa Clara, CA, USA). The results are listed in
Table 1 and include both number-average and weight-average values. Hydrophilic fraction is the average fraction of the hydrophilic block (PEG) in the copolymer.
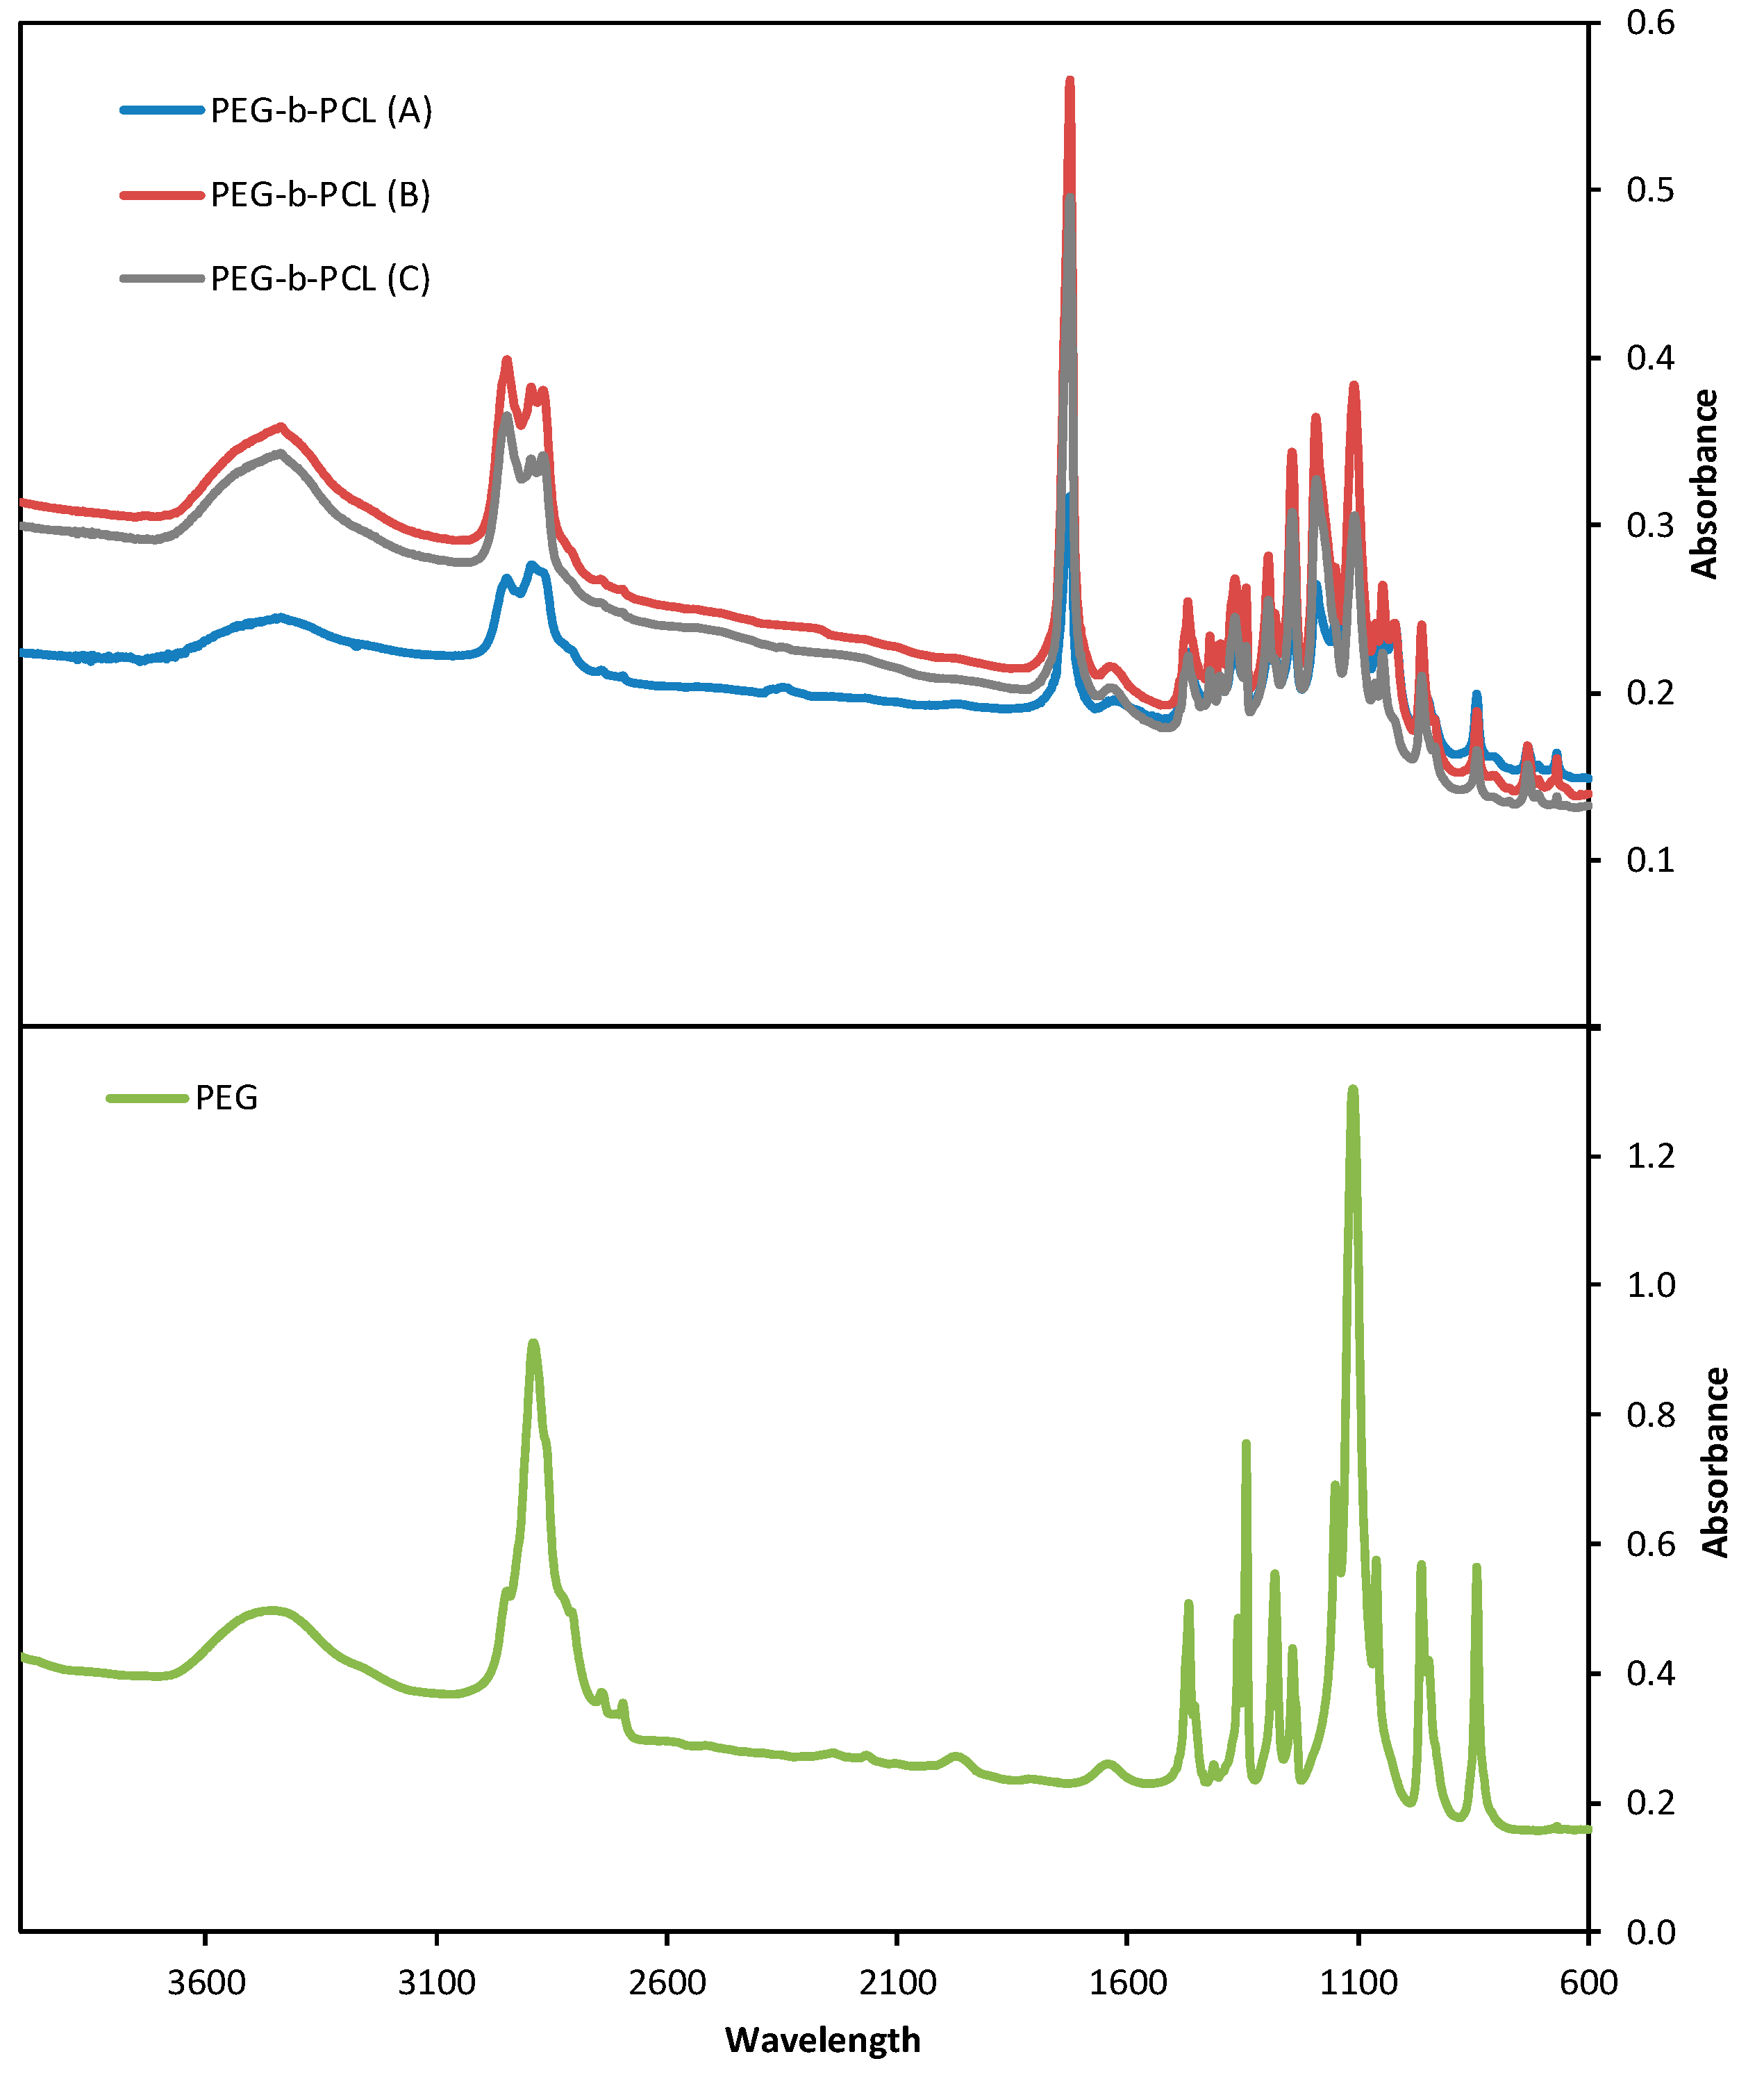
Fourier Transformed Infrared Spectroscopy (FTIR) spectra are shown in
Figure 3. FTIR spectra were obtained using a Shimadzu FTIR-8400S spectrometer. A small amount of each material was mixed with KBr and compressed to tablets. The IR spectra of these tablets were obtained in absorbance mode and in the spectral region of 600–4000 cm
−1 using a resolution of 4 cm
−1 and 64 co-added scans. All materials show characteristic absorptions for PEG, the C-O-C etheric bond bending vibration at 1109 cm
−1 and the absorptions at 842 and 1333 cm
−1, attributed to PEG crystalline regions. On the PEG-
b-PCL spectra, new absorptions emerge: one at 1724 cm
−1 is attributed to stretching of the esteric carbonyl, while the two at 2935 and 729 cm
−1 are due to C-H bond stretching in the PCL block. Absorptions attributed to the PCL block increase in intensity from PEG-
b-PCL (A) to PEG-
b-PCL (C) to PEG-
b-PCL (B), as the molecular weight of the hydrophobic block increases, respectively.
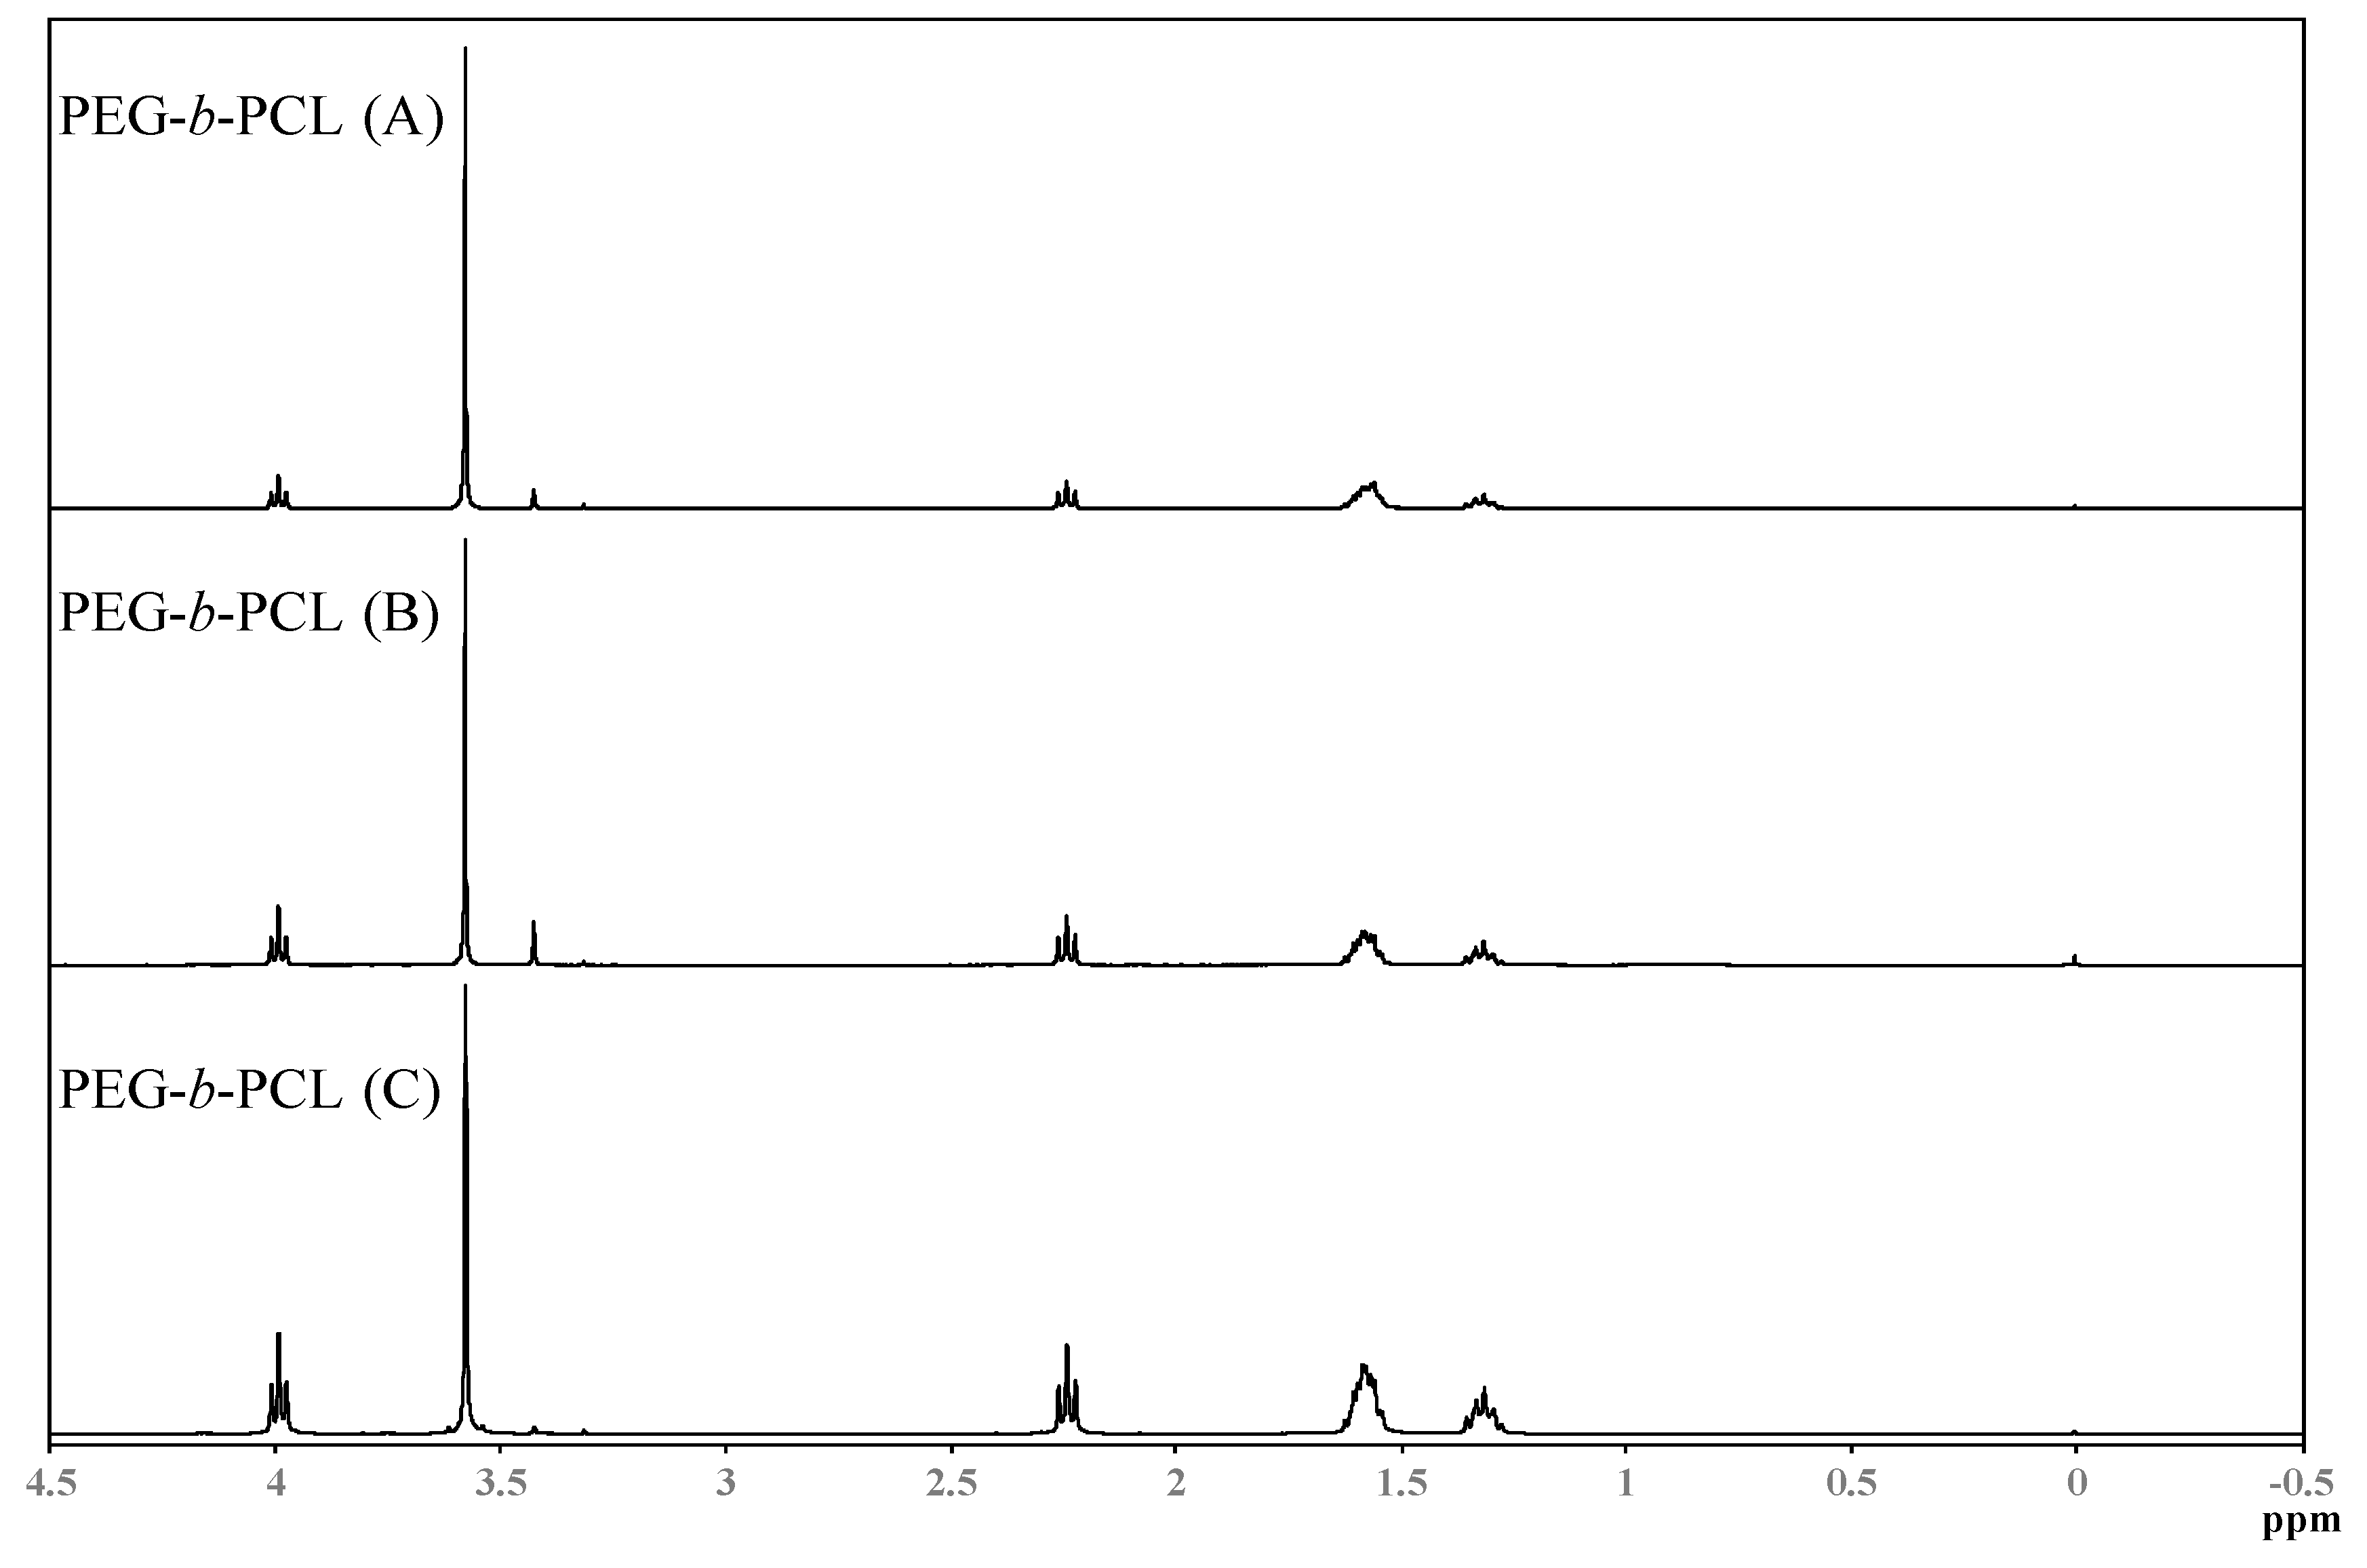
Spectra from Nuclear Magnetic Resonance Spectroscopy (1H-NMR) are shown in
Figure 4. NMR spectra were obtained on a JEOL-ECS-400 NMR spectrometer operating at 400.13 MHz for protons, employing a 5 mm high-resolution broad-band gradients probe. Spectra were recorded using the “single-pulse” pulse program with P90 = 10.4 μs covering a sweep width 25.0 ppm (8278 Hz) with 32,000 time domain data points giving an acquisition time of 3.95 s, Fourier transformed using 64,000 data points and referenced to an internal TMS standard at 0.0 ppm. Absorbencies at 4.0 and 2.3 ppm are due to protons in the PCL block, while the absorbance at 3.3 ppm is due to the three protons in the methoxy terminal-group of PEG. The absorbance of the PCL block increases in intensity when the hydrophobic block increases, respectively.
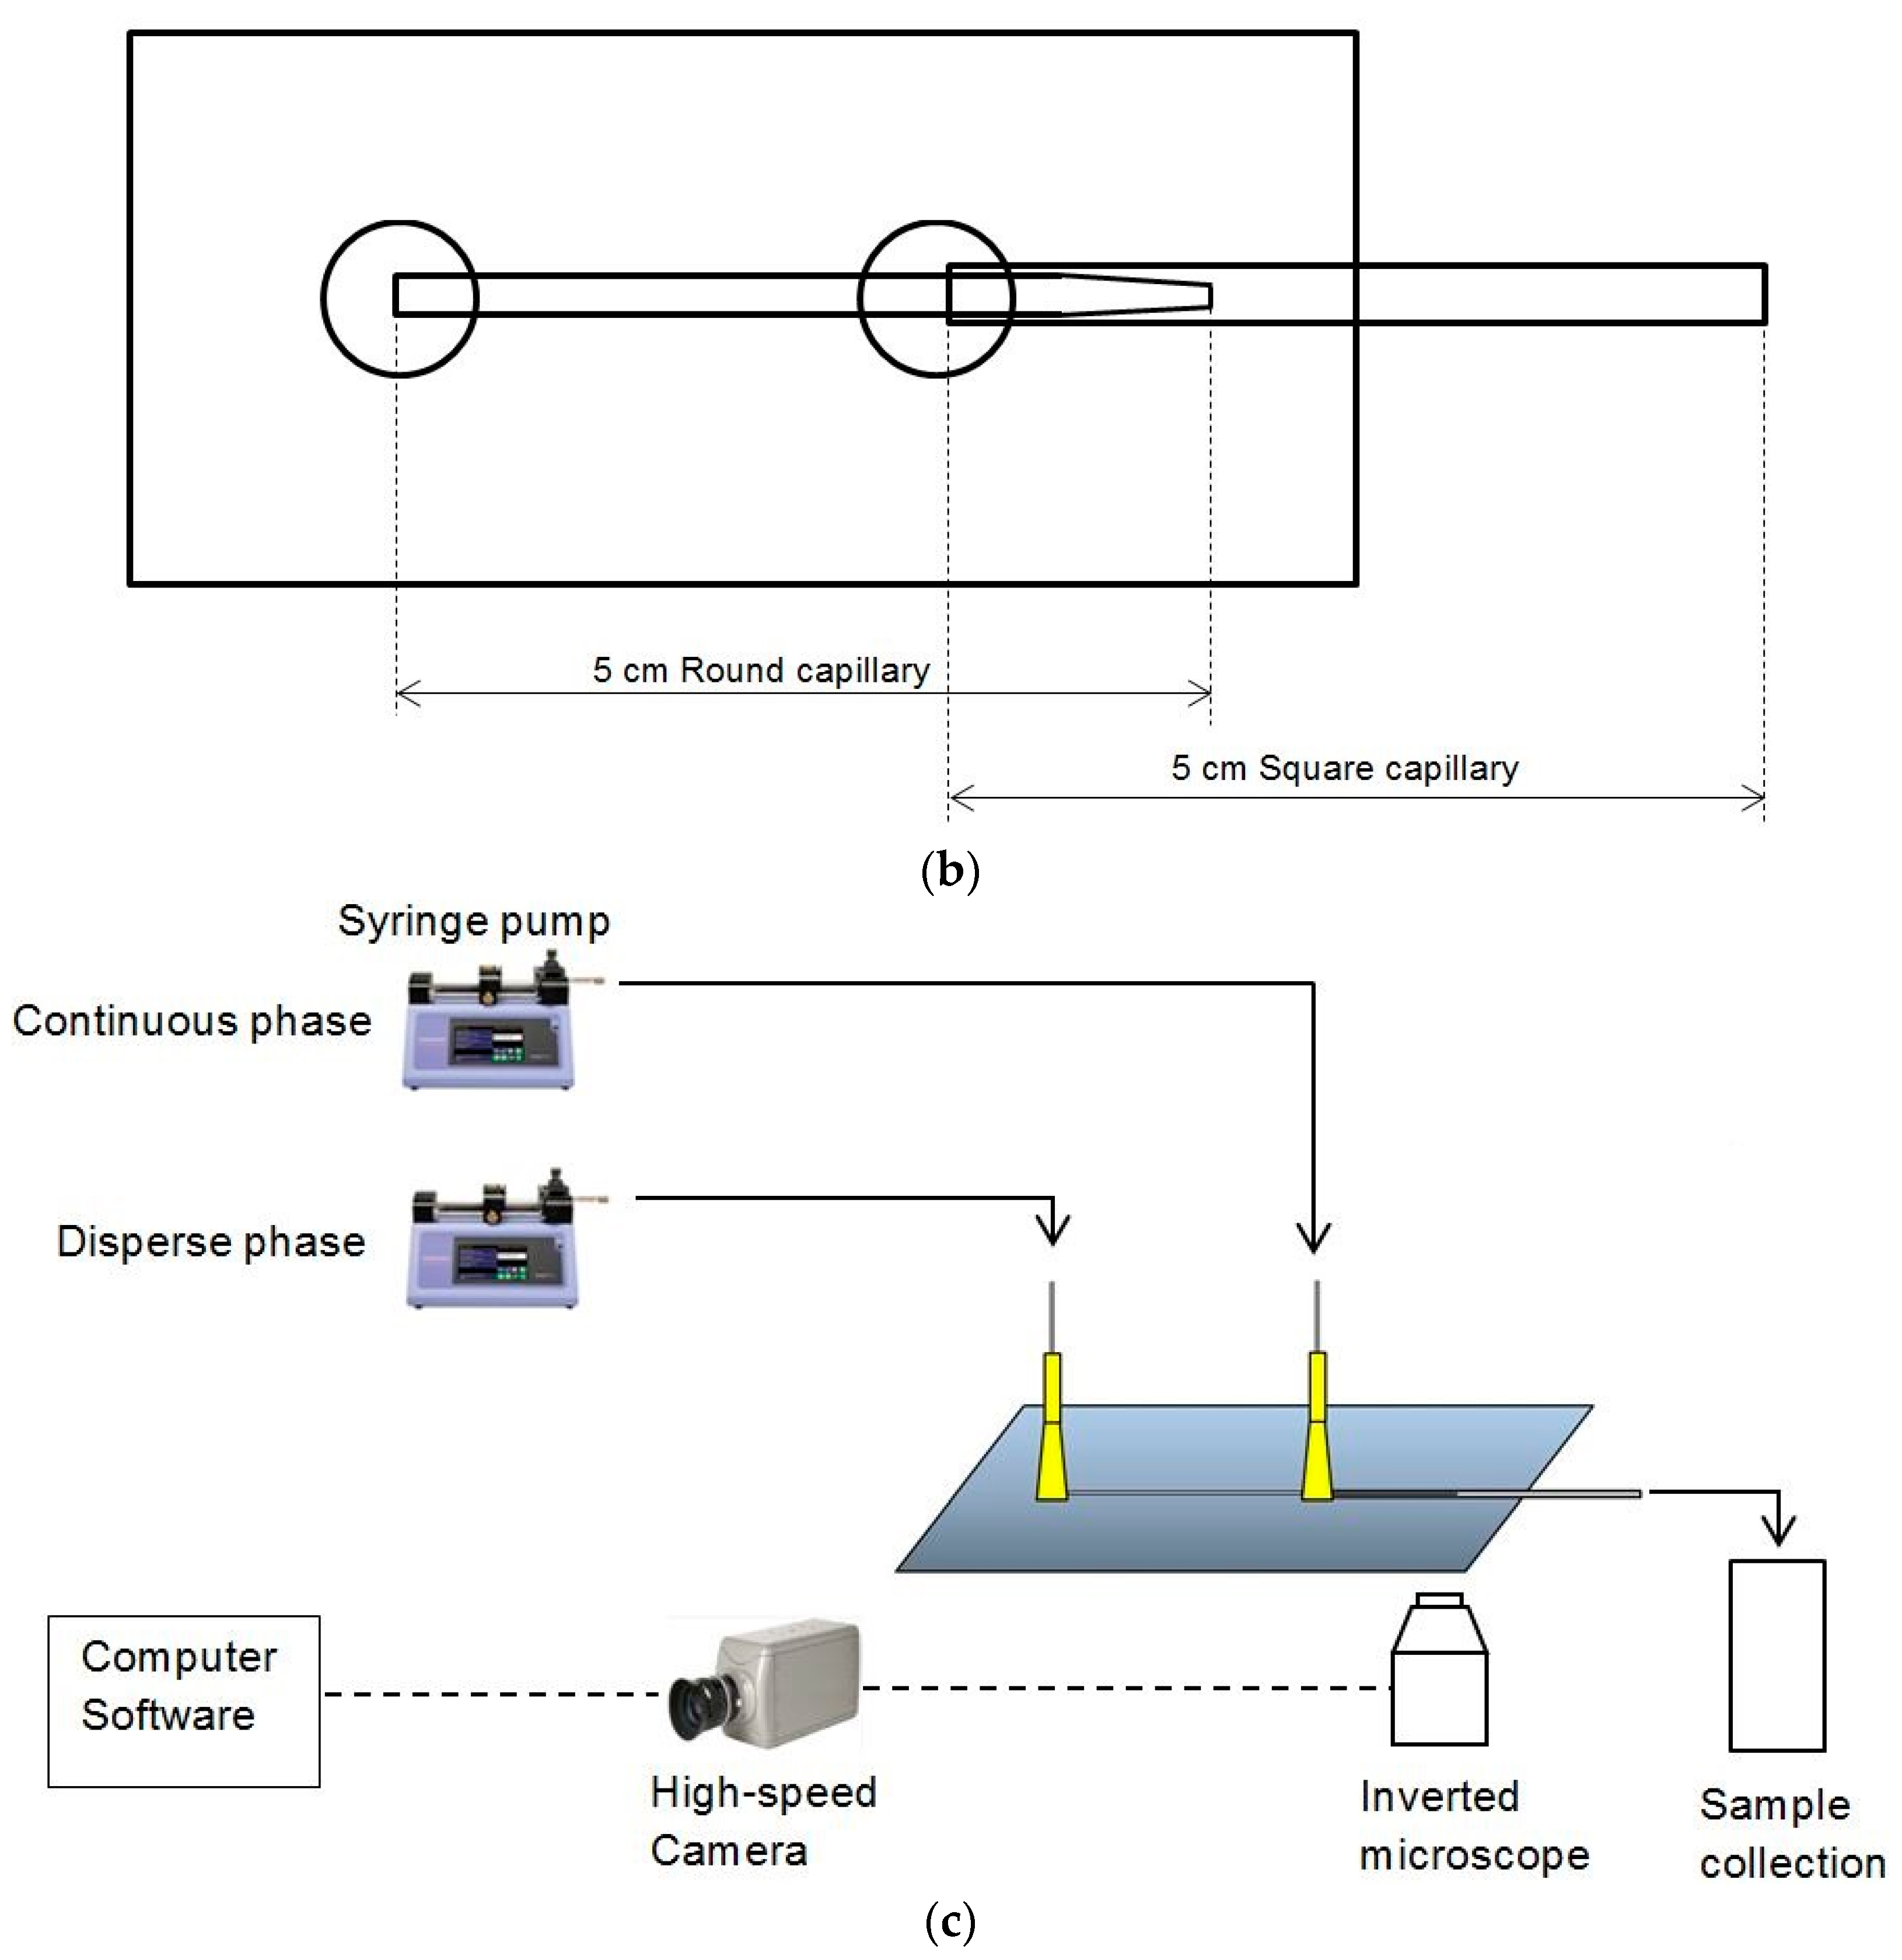
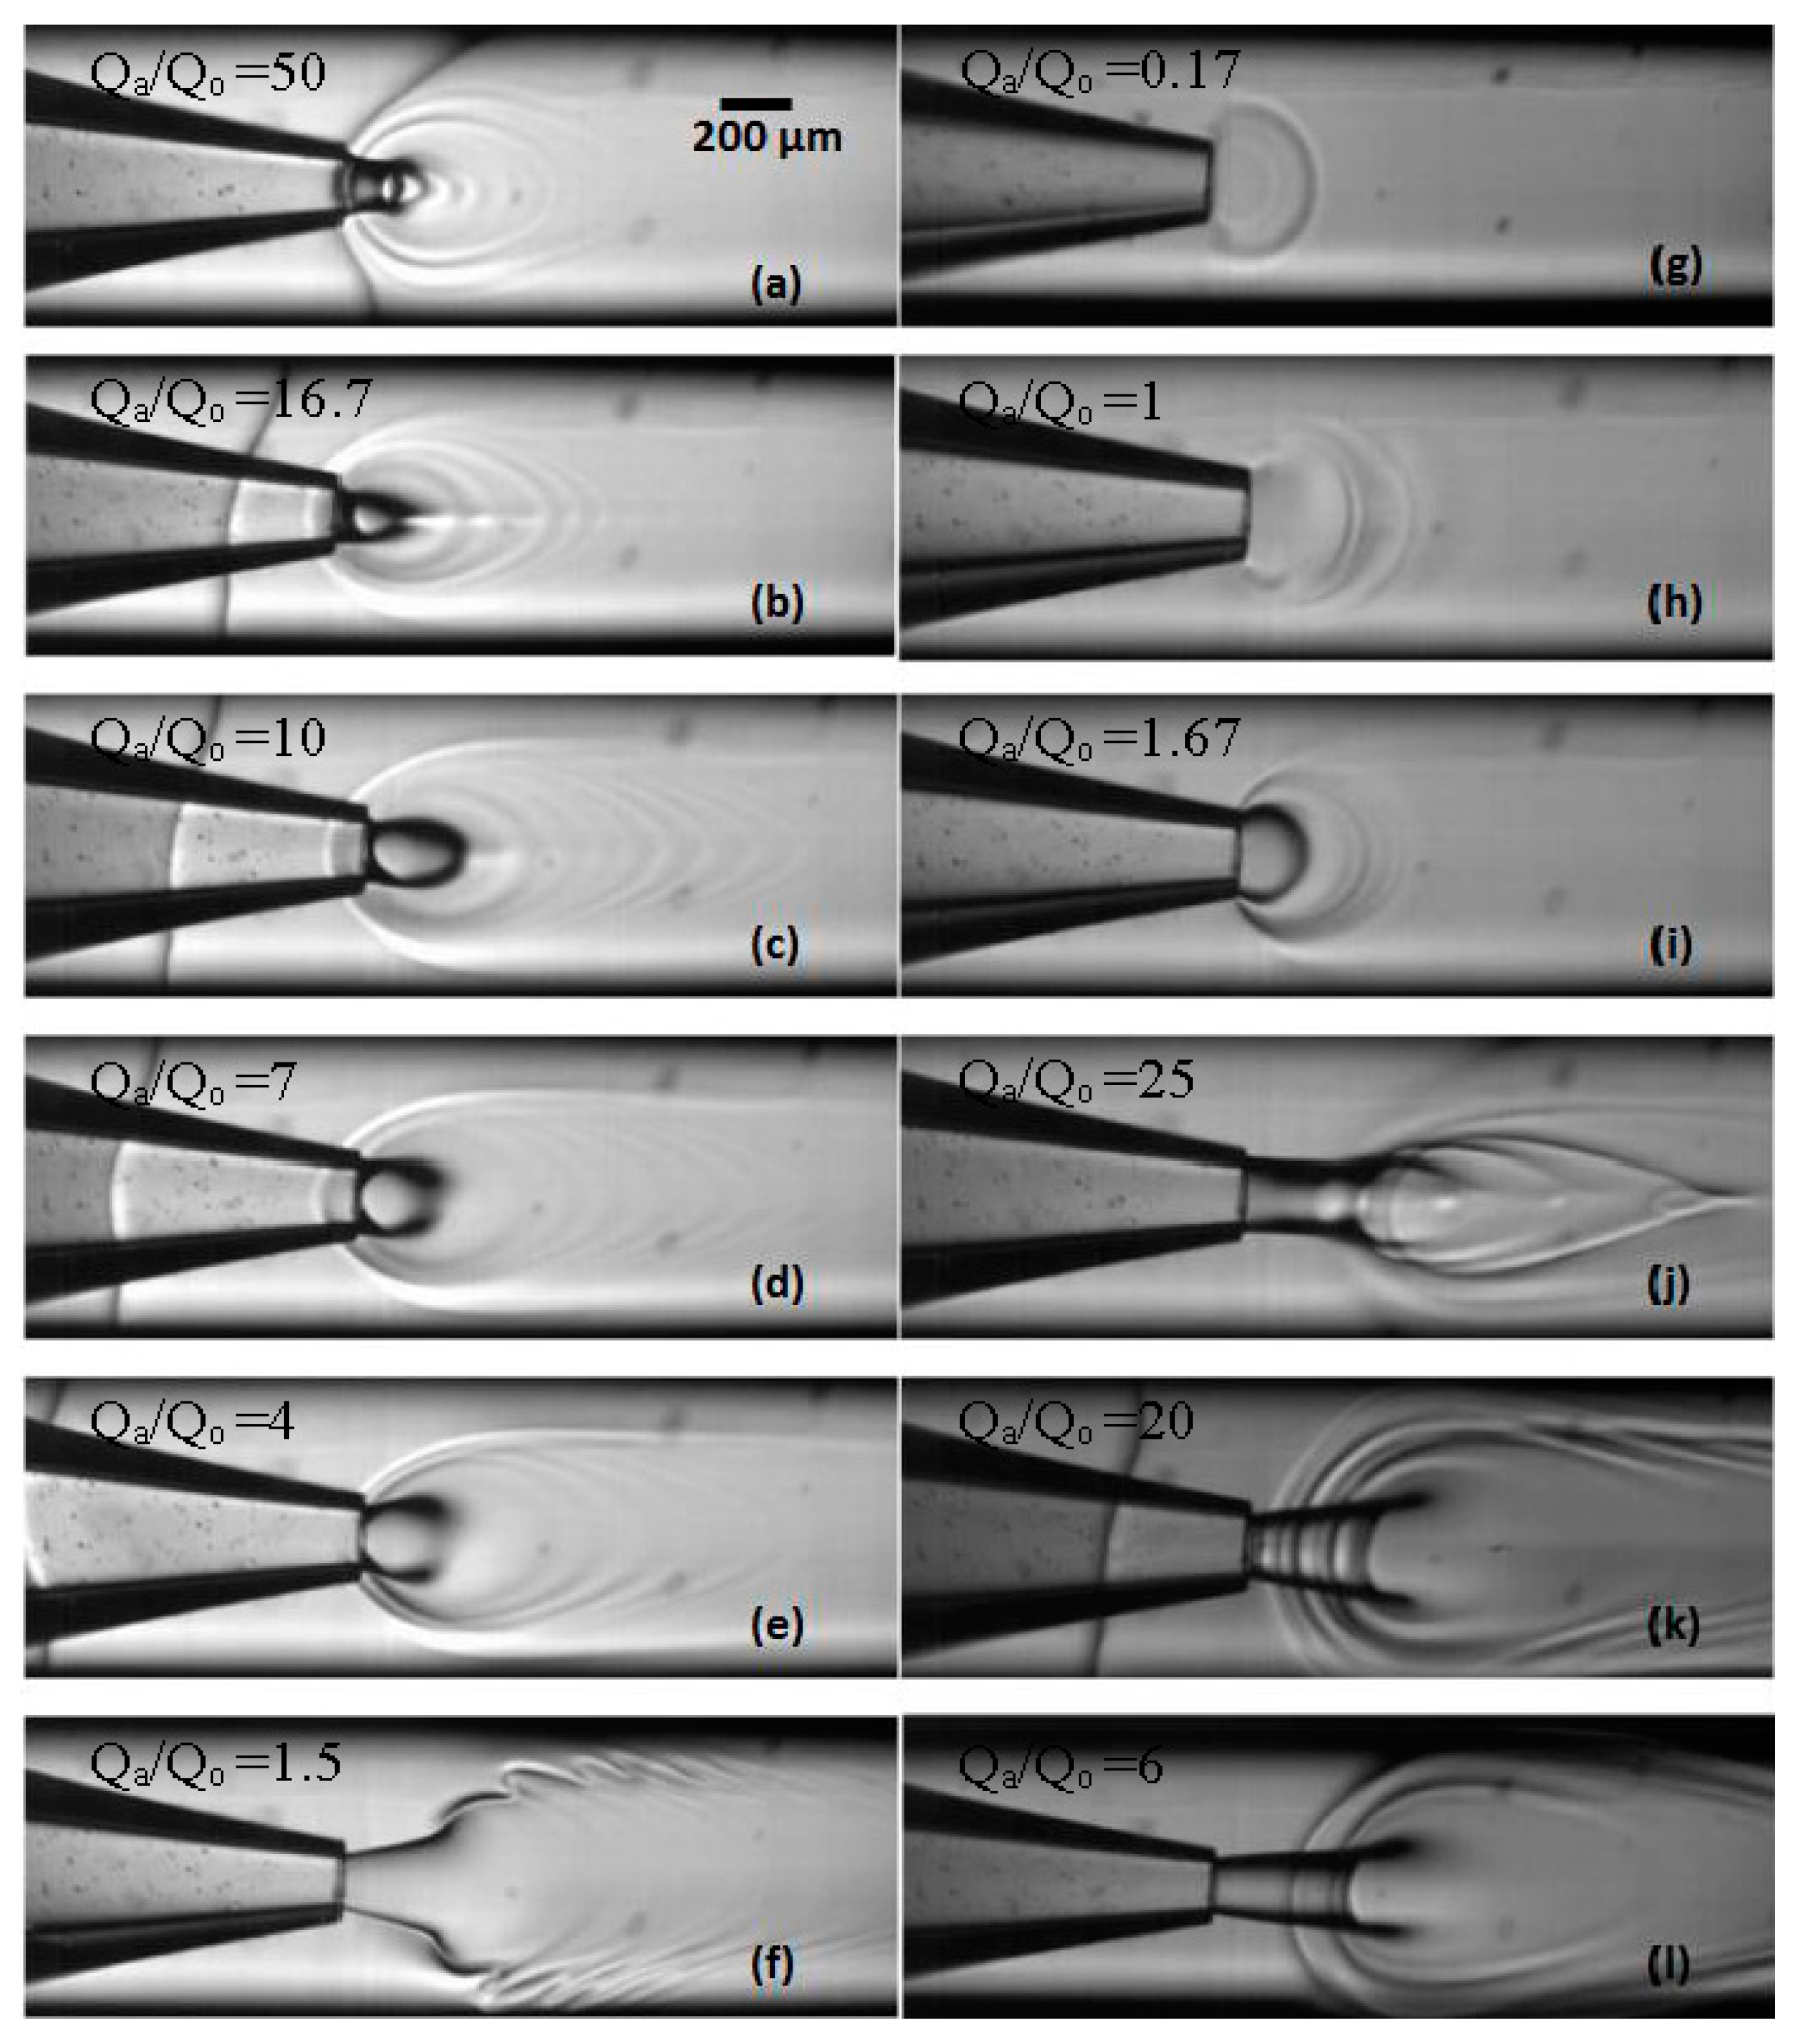
3.2. Experimental Images from Microfluidic Device
Live images were recorded by the high speed camera and analyzed by the computer software Image J (v1.46).
Figure 5 shows the images recorded under different phase flow rates of the aqueous (water) and organic phase. From
Figure 5a–f, the volumetric flow rate of aqueous phase Q
a was fixed to 5 mL·h
−1 and Q
o varied from 0.1 to 3.33 mL·h
−1 to give Q
a/Q
o values of 50, 16.67, 10, 7, 4 and 1.5, respectively. From
Figure 5g–j, Q
o was fixed to 0.6 mL·h
−1 and Q
a varied from 0.1 to 15 mL·h
−1 to give Q
a/Q
o values of 0.17, 1, 1.67 and 25, respectively. In both
Figure 5k,l, Q
o was set to 3.33 mL·h
−1 and Q
a was 10 or 20 mL·h
−1 to achieve Q
a/Q
o values of 3 or 6. The shape of organic/aqueous interface strongly depends on the flow rates of the two phases. At low flow rates, the interface is hemispherical and resembles the shape observed during generation of droplets in the dripping regime [
17,
18]. In droplet microfluidics, however, the organic phase eventually detaches from the tip and forms an isolated droplet in the aqueous phase, whereas in this case, the droplet does not grow on the tip, since THF and water are miscible in all proportions and the rate of transfer of THF to the interface by the pump is in equilibrium with the rate of transfer of THF away from the interface due to diffusion into the aqueous phase. The existence of curved interface is a result of the transient interfacial tension, the Korteweg stress, which occurs when two miscible fluids are suddenly put into contact [
19]. The transient interfacial tension is given by:
, where
is the change in concentration over the transition zone between two miscible fluids,
is the thickness of the transition zone, and
is the proportionality constant. If the organic phase is not injected continuously, the transient tension would decrease rapidly in proportion to
, where
is the diffusion coefficient and
is the interfacial age. However, because both liquids flow continuously, the Korteweg stress maintains a constant value over time at any location on the interface.
At low organic phase flow rates,
Figure 5a–c, the liquid–liquid interface is sharp over the whole jet boundary, but at higher organic phase flow rates, it becomes blurry (
Figure 5e) or even completely disappears (
Figure 5g–i) on the front side of the jet. It can be explained by high THF concentration in the central region of the capillary, predicted by numerical modeling [
11], which leads to low concentration gradient,
, and negligible Korteweg stress on the front side of the jet. In most cases, the formed micelles are concentrically clustered around the interface (see
Figure 5a–e), due to capillary waves formed on the surface of a drop under the influence of external fluid flow [
20]. “Viscous fingering” can be seen in
Figure 5f, which occurs due to non-uniform penetration arising when a less viscous fluid is injected at high relative velocity into a more viscous one. At 293 K, the viscosities of THF and water are 0.63 and 1 mPas, respectively, supporting this assumption. Viscous fingering did not occur in
Figure 5k,l, although the flow rate of the organic phase was exactly the same as in
Figure 5f, probably because Q
a was higher than in
Figure 5f, and the difference in velocity between the two streams was not sufficiently high.
Due to the 3D geometry of the capillaries, the aqueous phase fully surrounds the organic phase and de-wets it from the walls of the outer capillary. Since the micelles are formed at the liquid–liquid interface, which is displaced from the walls, the deposition of the micelles onto the walls should be less pronounced compared with 2D polydimethylsiloxane microfluidic devices. However, a limited amount of deposited nanoparticles are visible in
Figure 5a–d,k.
By increasing the water flow rate from 1 to 15 mL·h
−1 at a constant organic phase flow rate of 0.6 mL·h
−1, the interface is stretched from a hemisphere (
Figure 5i) to an extended cylinder (
Figure 5j), because the shear force acting on the interface from the surrounding aqueous stream overcomes the transient interfacial tension. It is interesting to note that the interface has entirely different shapes in
Figure 5f,i, although the flow rate ratio was very similar. However, when the flow rates of both fluids are increased at constant flow rate ratio, it has more impact on the injection velocity of the organic phase than on the aqueous phase velocity. As a result, in
Figure 5f the velocity of the organic phase in the orifice significantly surpasses the velocity of the aqueous phase and in
Figure 5i both streams have a similar velocity.
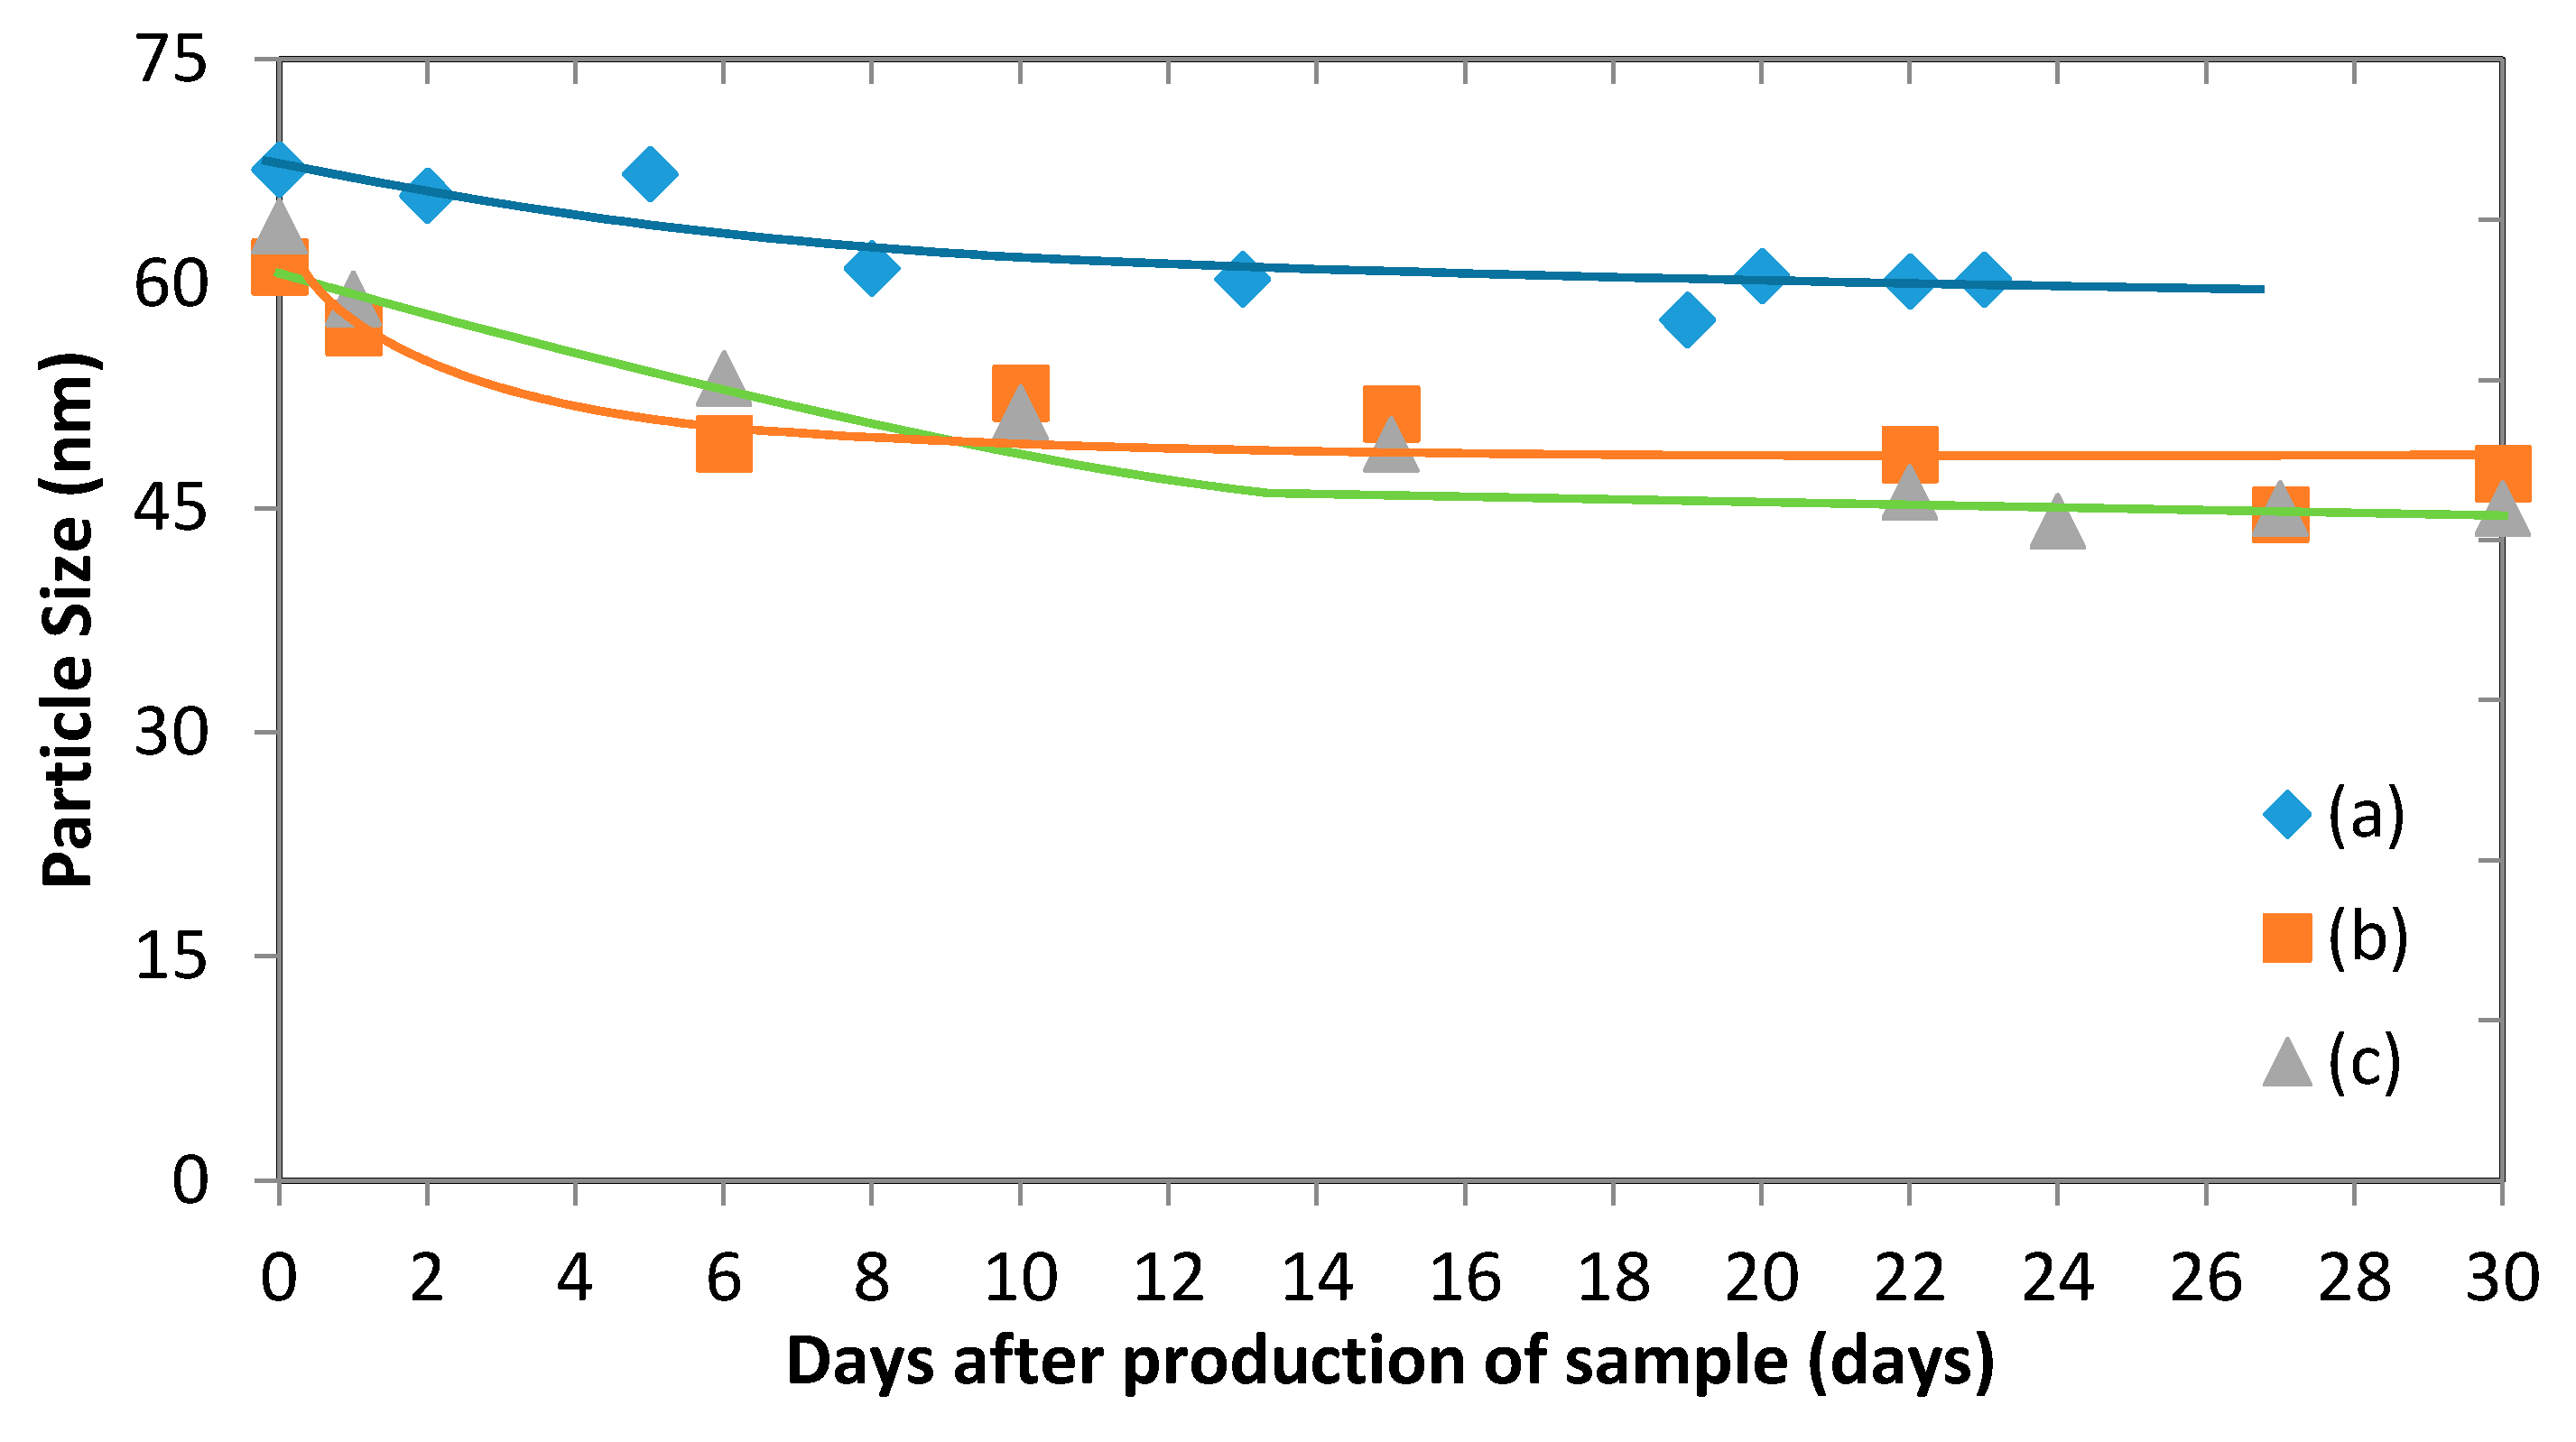
3.5. Micelles Stability
The stability of polymeric micelles is one of the most challenging obstacles of applying them in drug delivery systems since they are still a physically assembled structure.
Figure 11 illustrates the change of the average particle size of drug-loaded and empty micelles, which occurs during storage. It shows that while there is an initial drop in the micelle size, it tends to remain steady after just over a week. The stability of polymeric micelles is affected by many factors such as polymer type, concentration, and molecular weight [
25]. Kim
et al. [
25] stated that the micelle stability depends on the polymer concentration, which should be higher than the CMC to ensure the micelles are not disintegrated into unimers. The stability of micelles can be directly linked to
Ebend, which is the elastic energy of the membrane interface of micelles [
26]. Two models of calculating
Ebend were proposed: Helfrich model [
27] and Hyde model [
28] (the surfactant parameter model). In Hyde’s model,
Ebend is expressed depending on the surfactant parameter of the amphiphilic molecule (p), which depends on the polar head area, the volume and the effective length of the hydrocarbon chain of the amphiphilic chain, and the characteristic value of p in absence of bending stresses (p
0). Here, no evidence has shown that the micelles began to disintegrate to unimers during the testing period. It is likely that the initial drop in size can be attributed to solvent that remains in the micelle after vacuum evaporation. Indeed, small amounts of THF and acetone can remain in the sample and evaporate over time, causing the micelles to shrink. In the case of empty micelles, the initial drop is less significant than with drug-loaded micelles. This suggests that there might be a combined effect of evaporation of solvent and release of fluconazole into the bulk liquid [
29].
Zeta Potential
Zeta potential is a measure of the electrical potential between the bulk fluid and the interface of a particle. A largely negative or positive value indicates high electrostatic forces leading to micelle stability [
30].
The zeta potential was measured for fluconazole-loaded and empty micelles produced from membrane experiments (
Table 6). The existence of a negative zeta potential can be associated to the carboxylic group contained on PLC chains [
21]. Given that good stability of the micelles was observed (
Figure 11), these low zeta potential values suggest a steric stability due to the PEG-
b-PCL copolymers. After loading fluconazole, a lower absolute zeta potential was observed. This can be attributed to some of the drug adsorbing to the surface of the micelle and shielding the negative charge. Given the relatively high stability of the micelles found in
Figure 11, it can be concluded once again that the micelles exhibit a strong steric stability despite the presence of a drug.


 ,
, 


