
Economic Evaluation of a Hybrid Desalination System Combining Forward and Reverse Osmosis


Abstract
:1. Introduction
2. Models
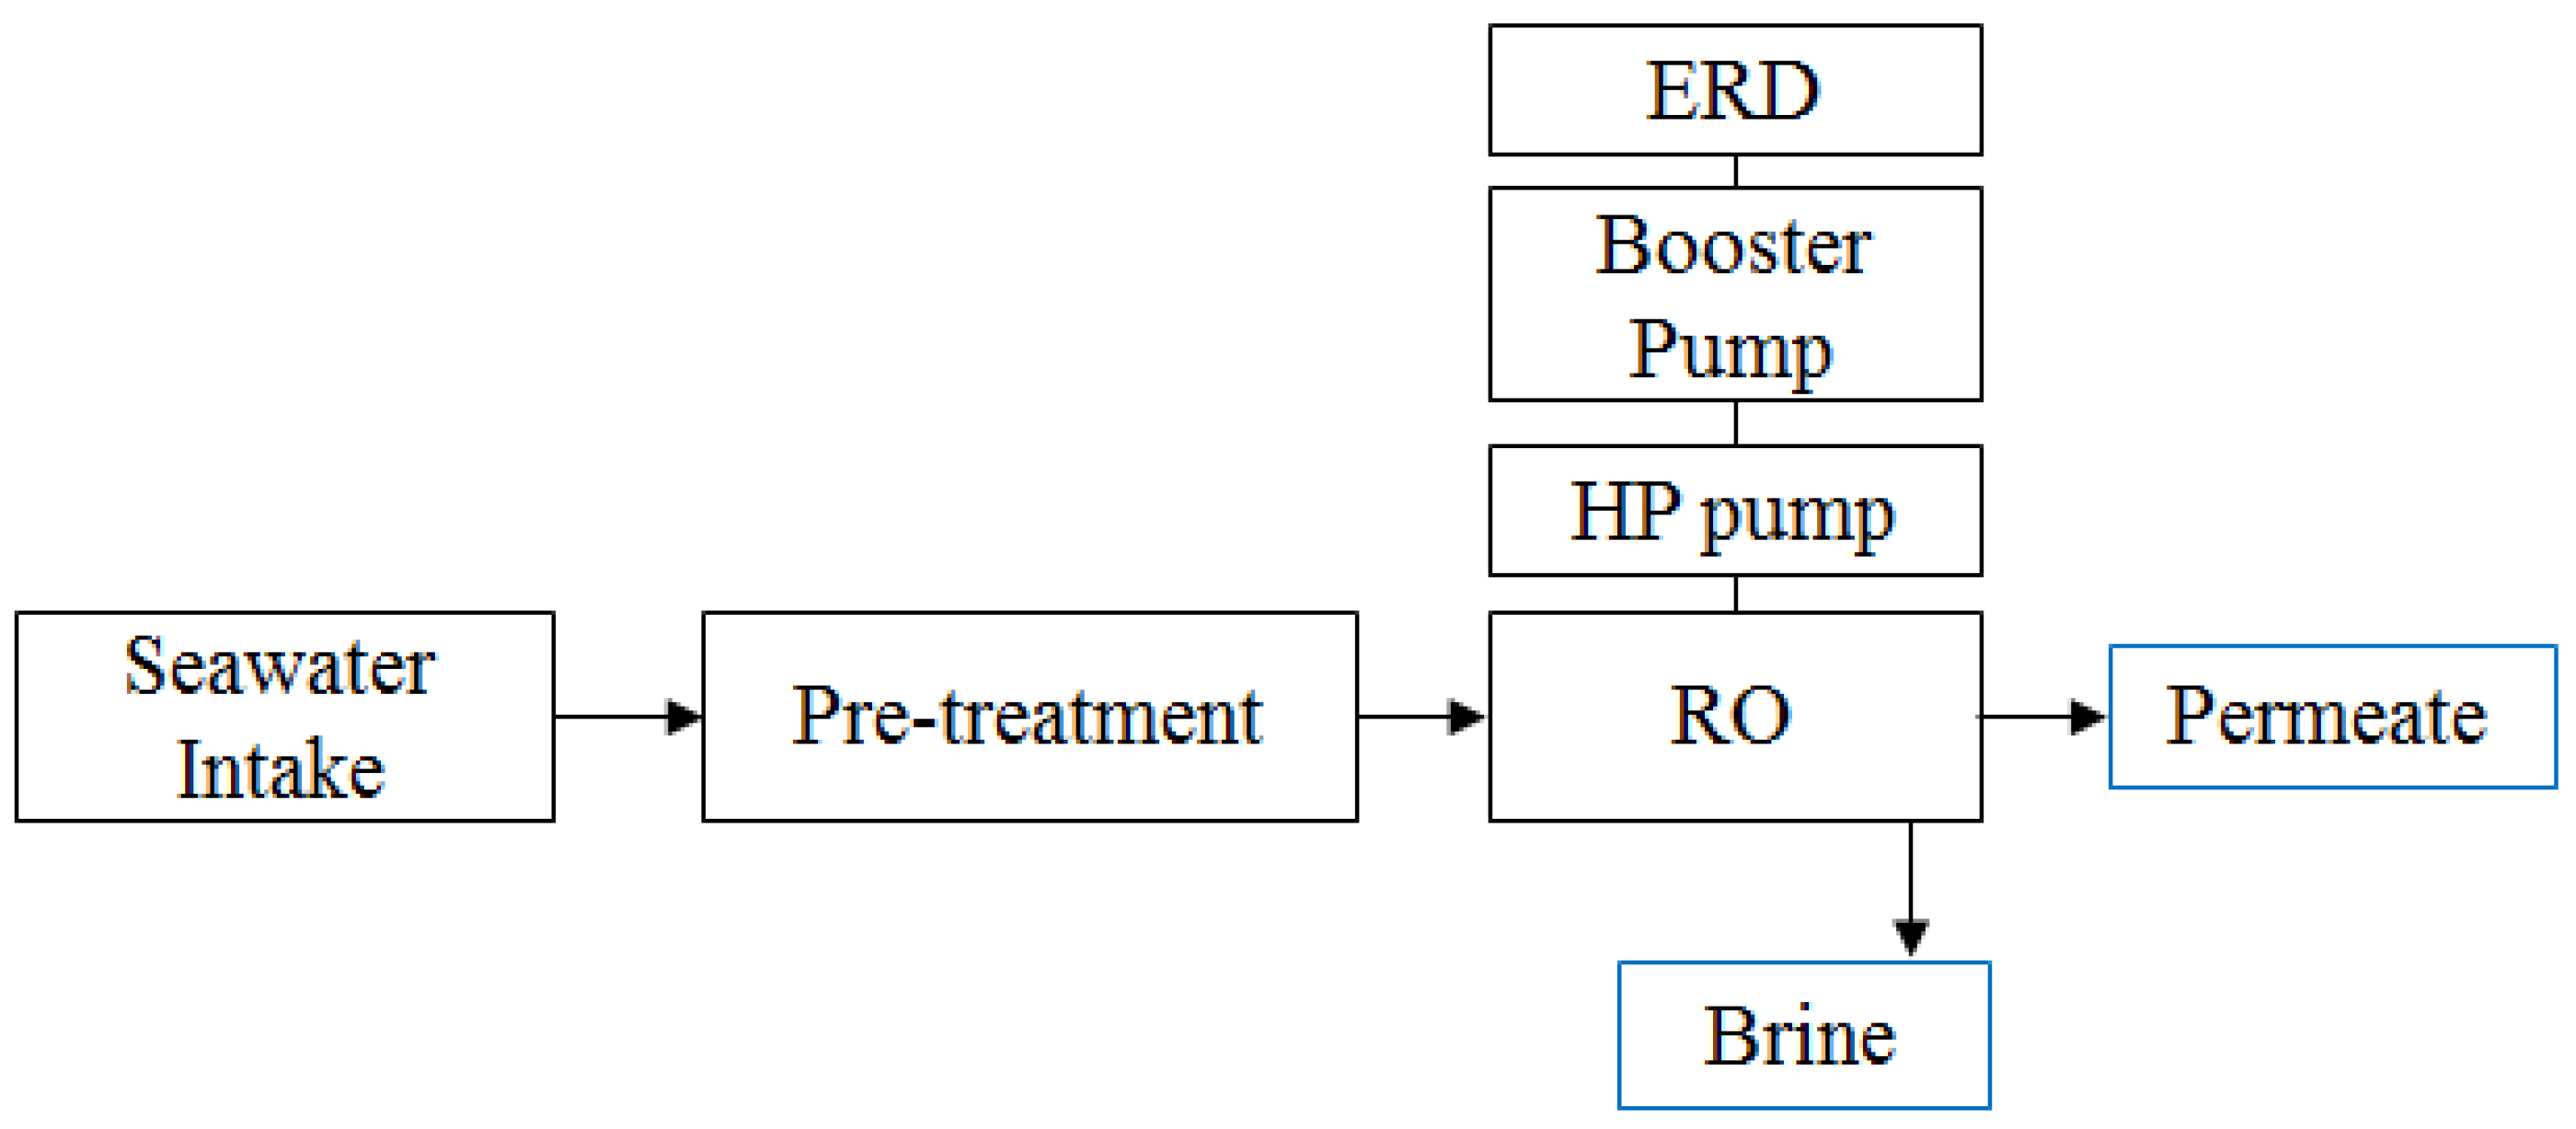
2.1. Reverse Osmosis Model

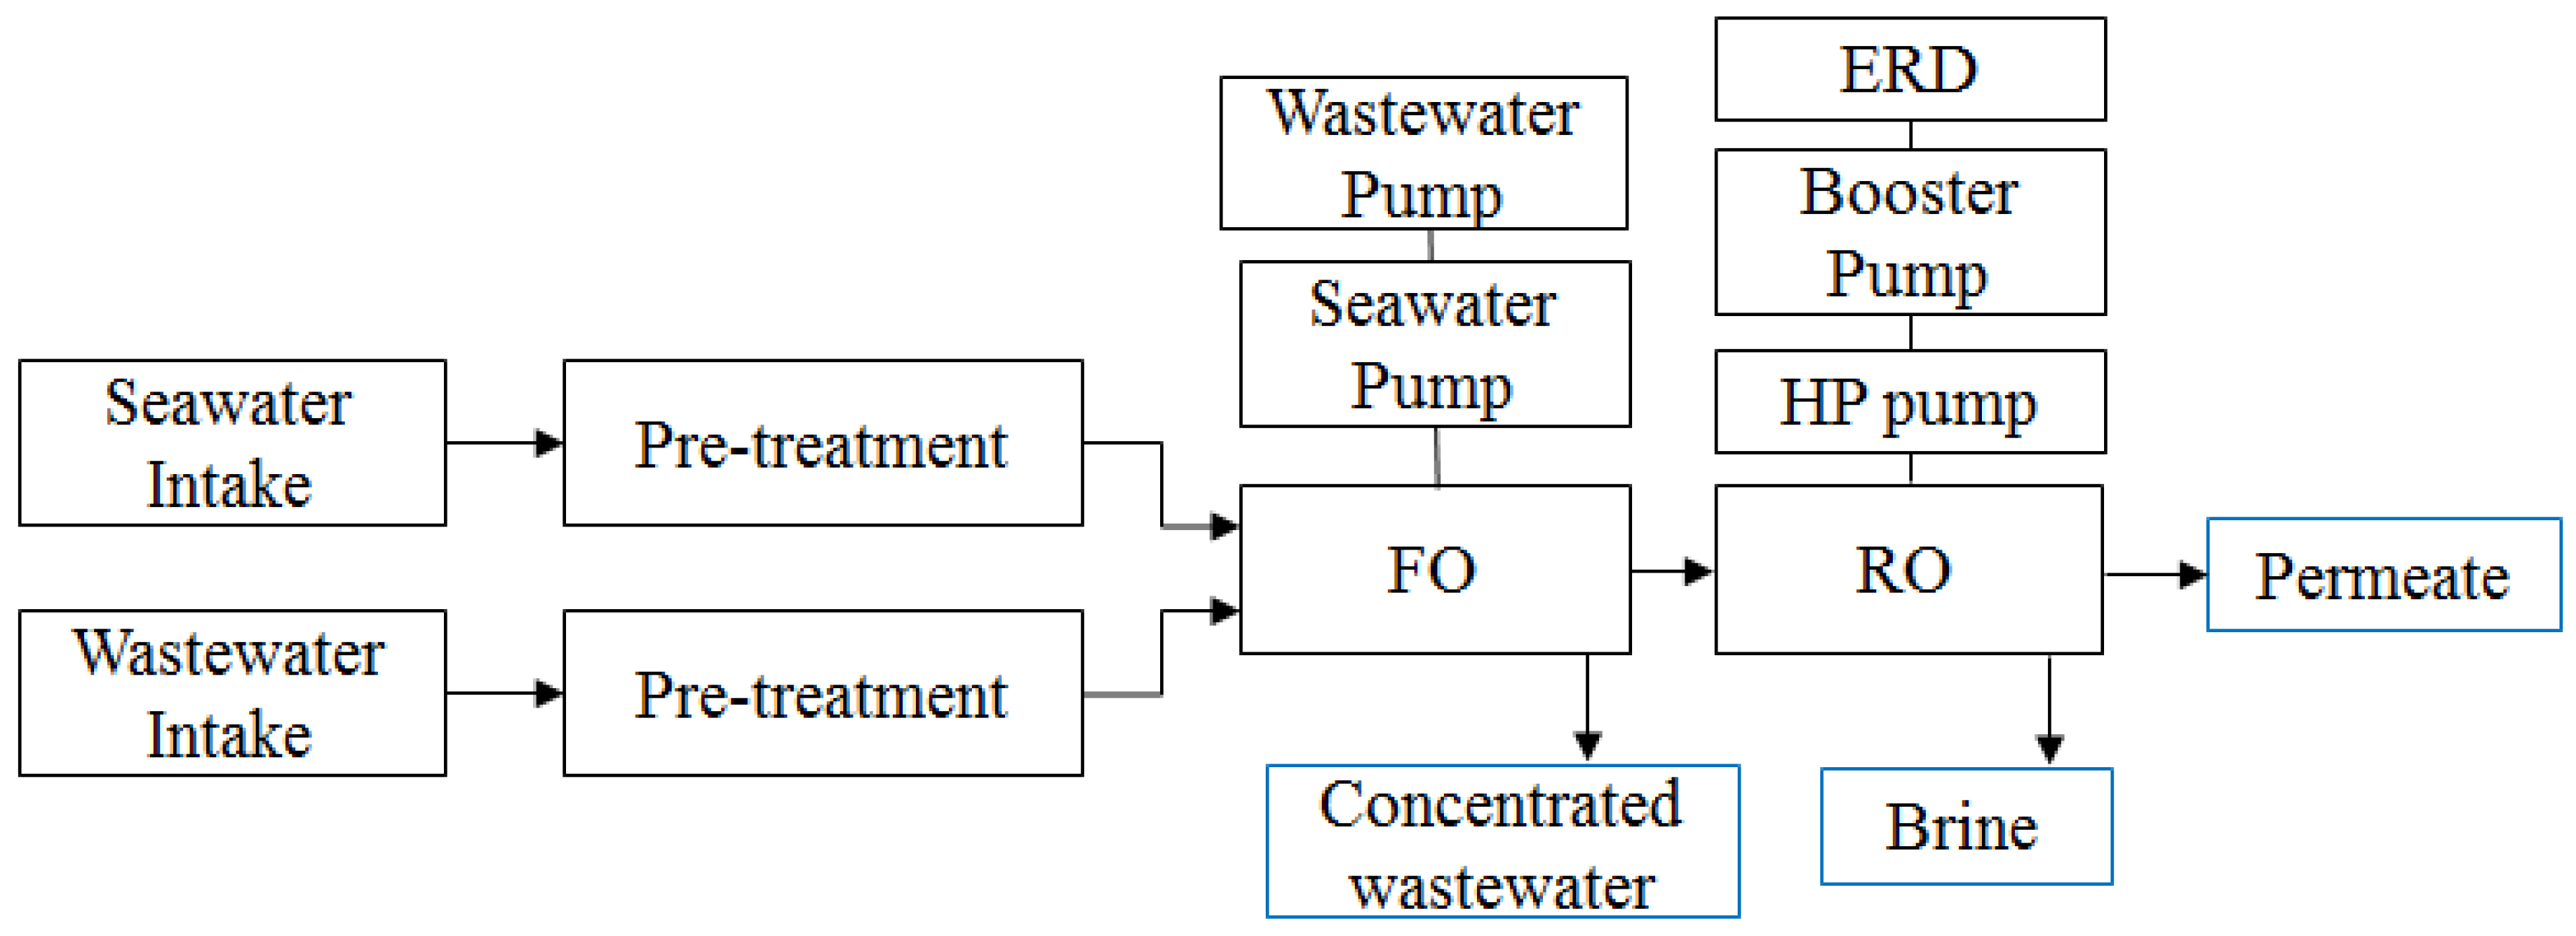
2.2. Forward Osmosis Model

3. Results and Discussion
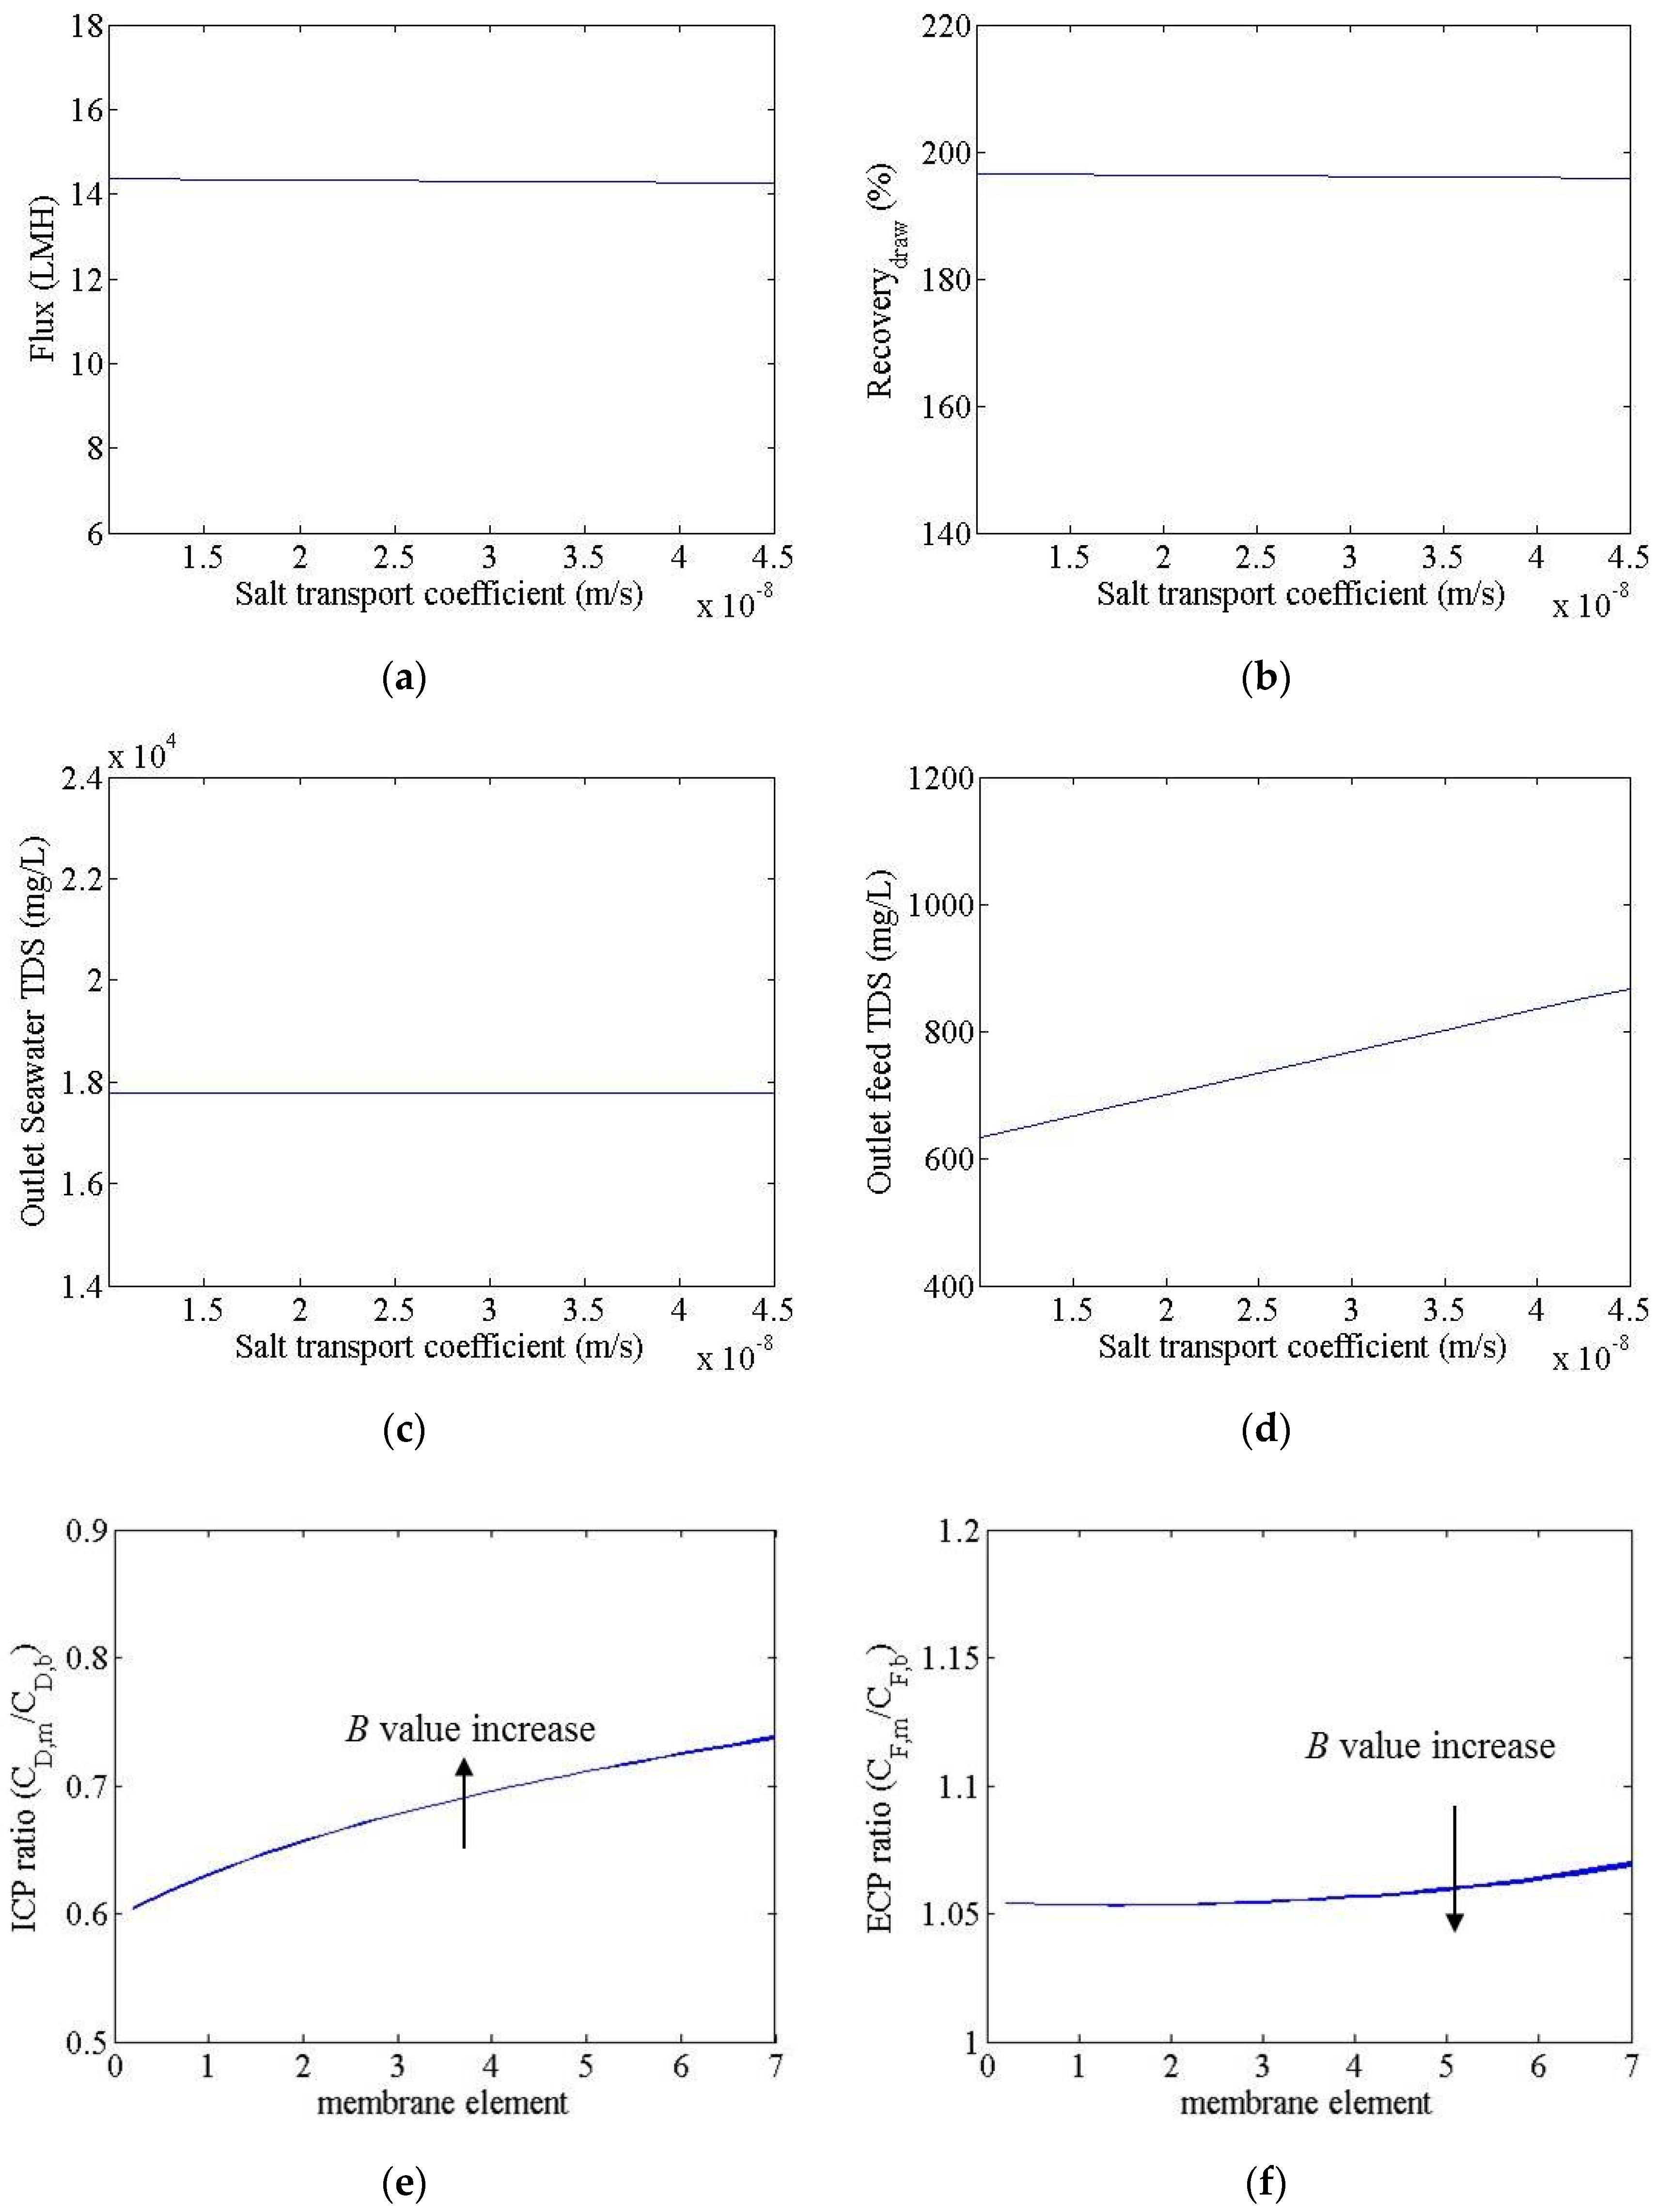
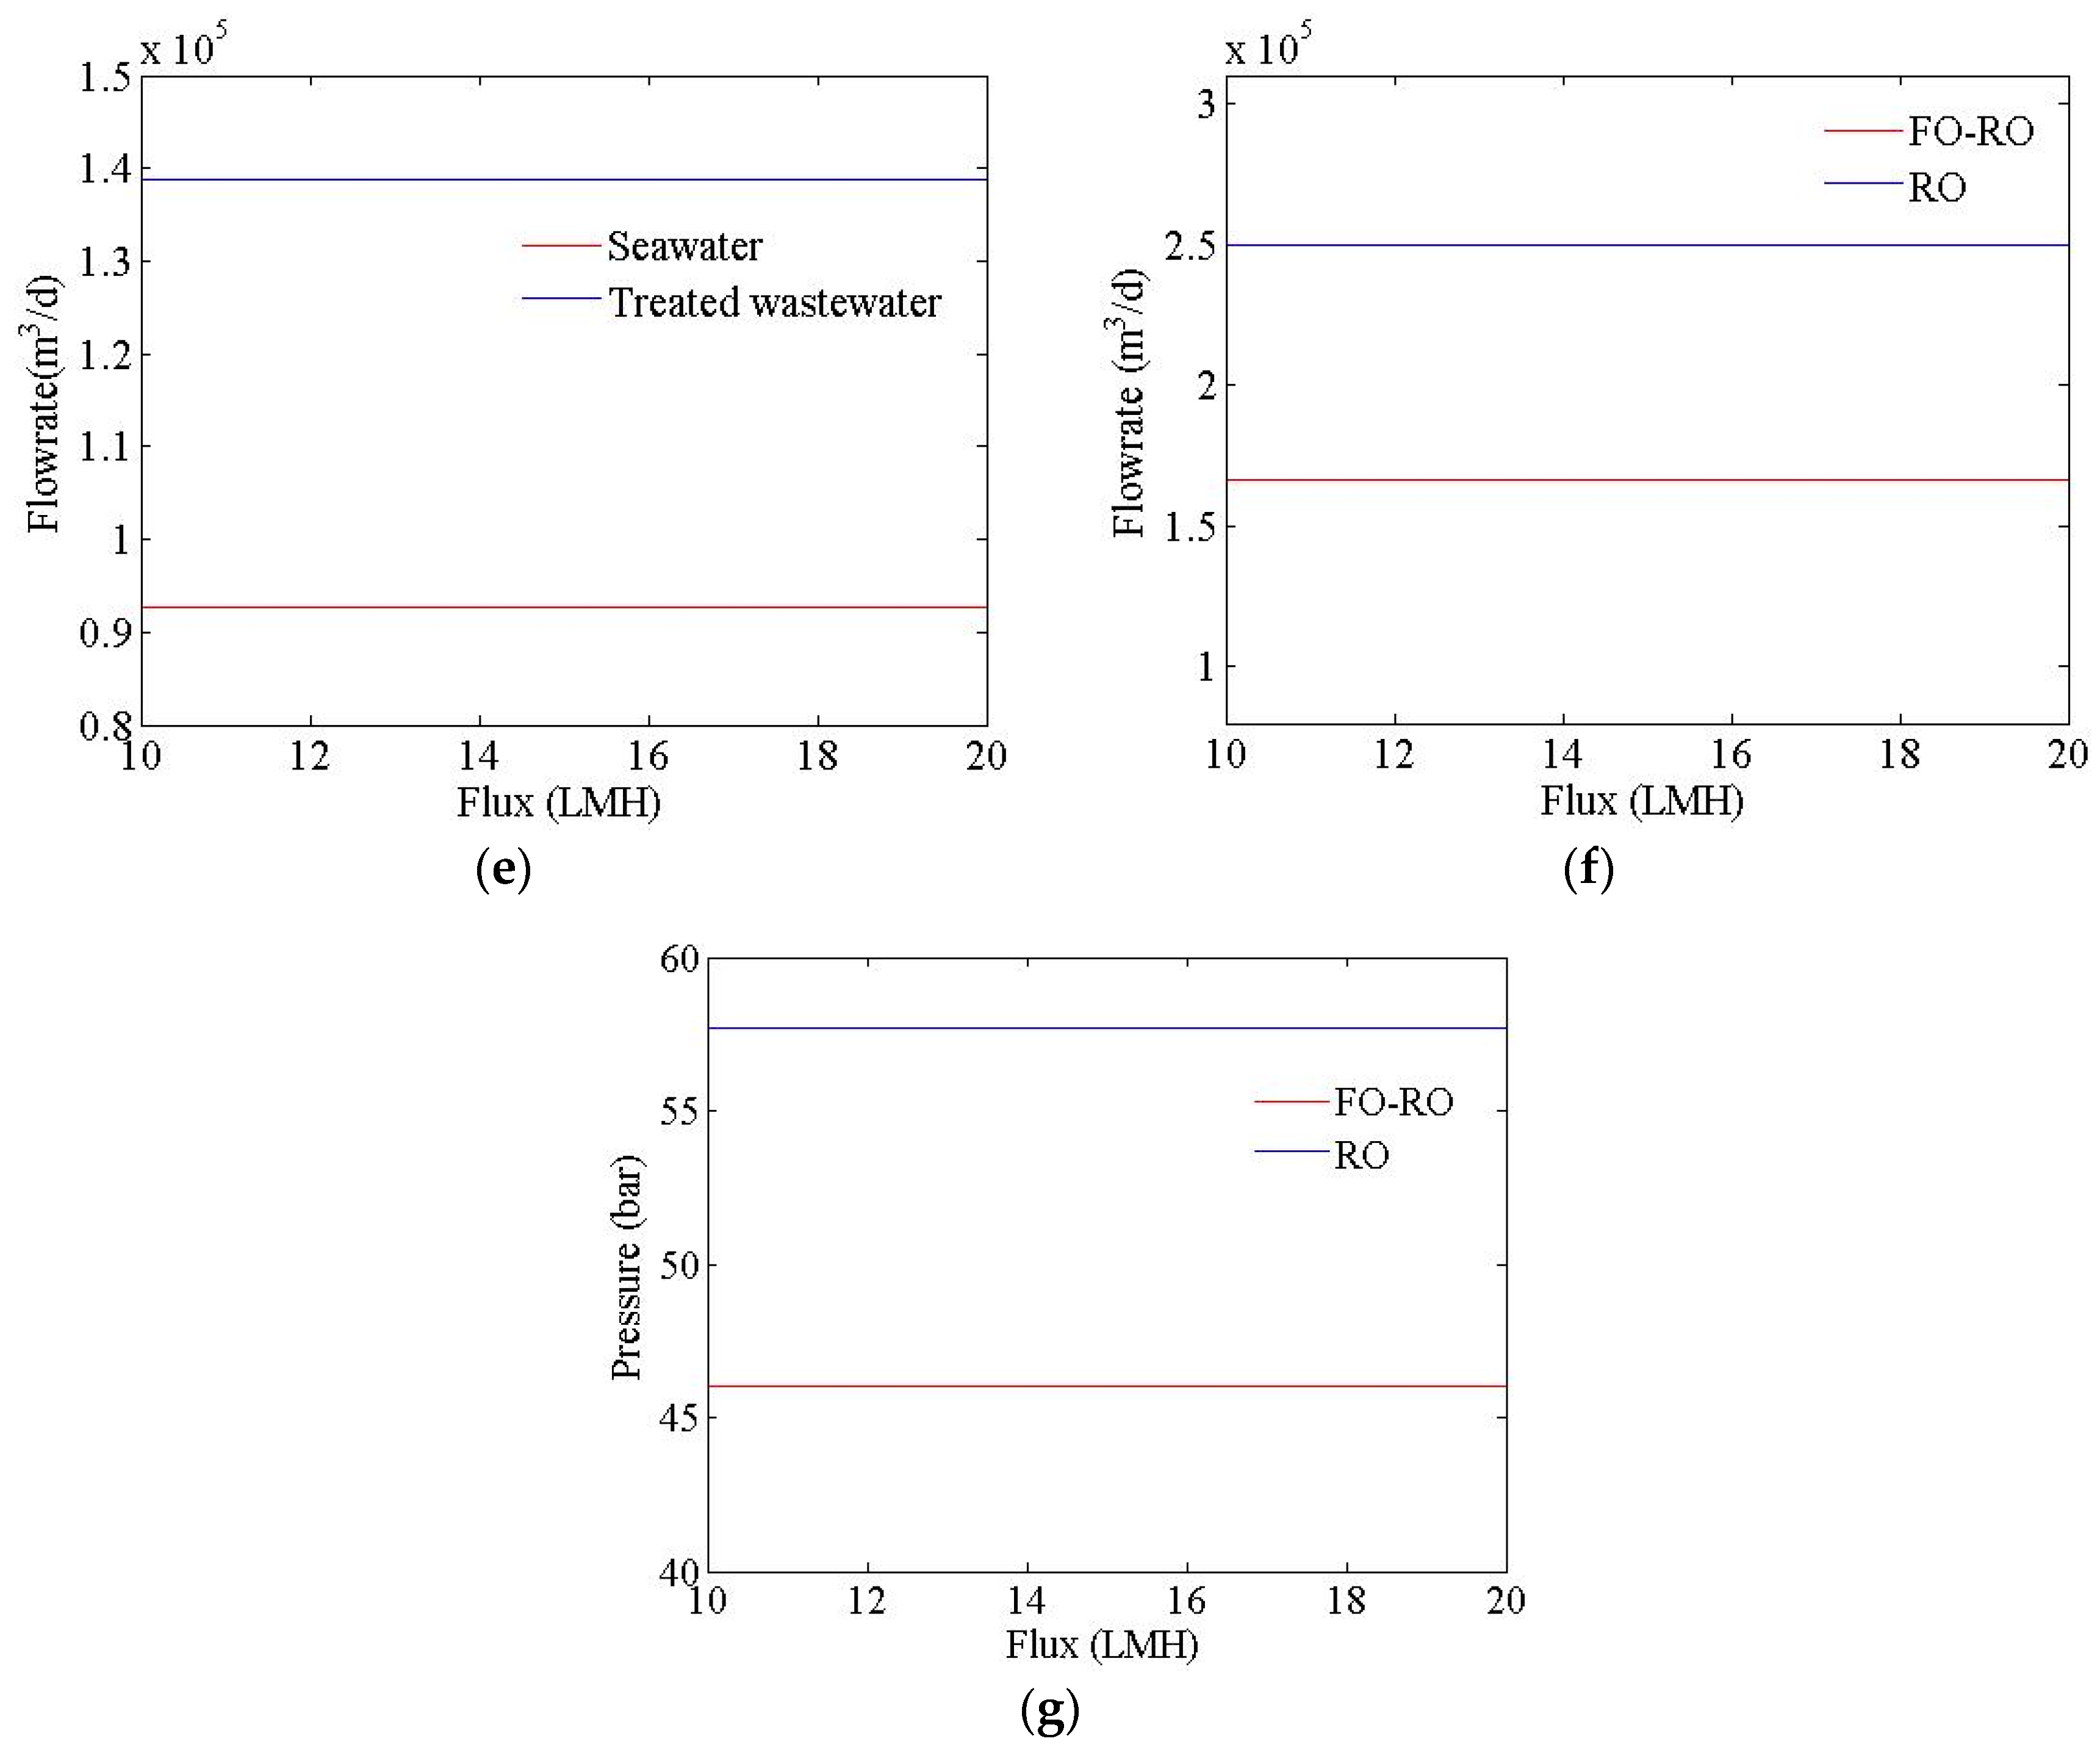
3.1. Performance Simulation of Forward Osmosis Process

| Parameter | Value |
|---|---|
| FO membrane | |
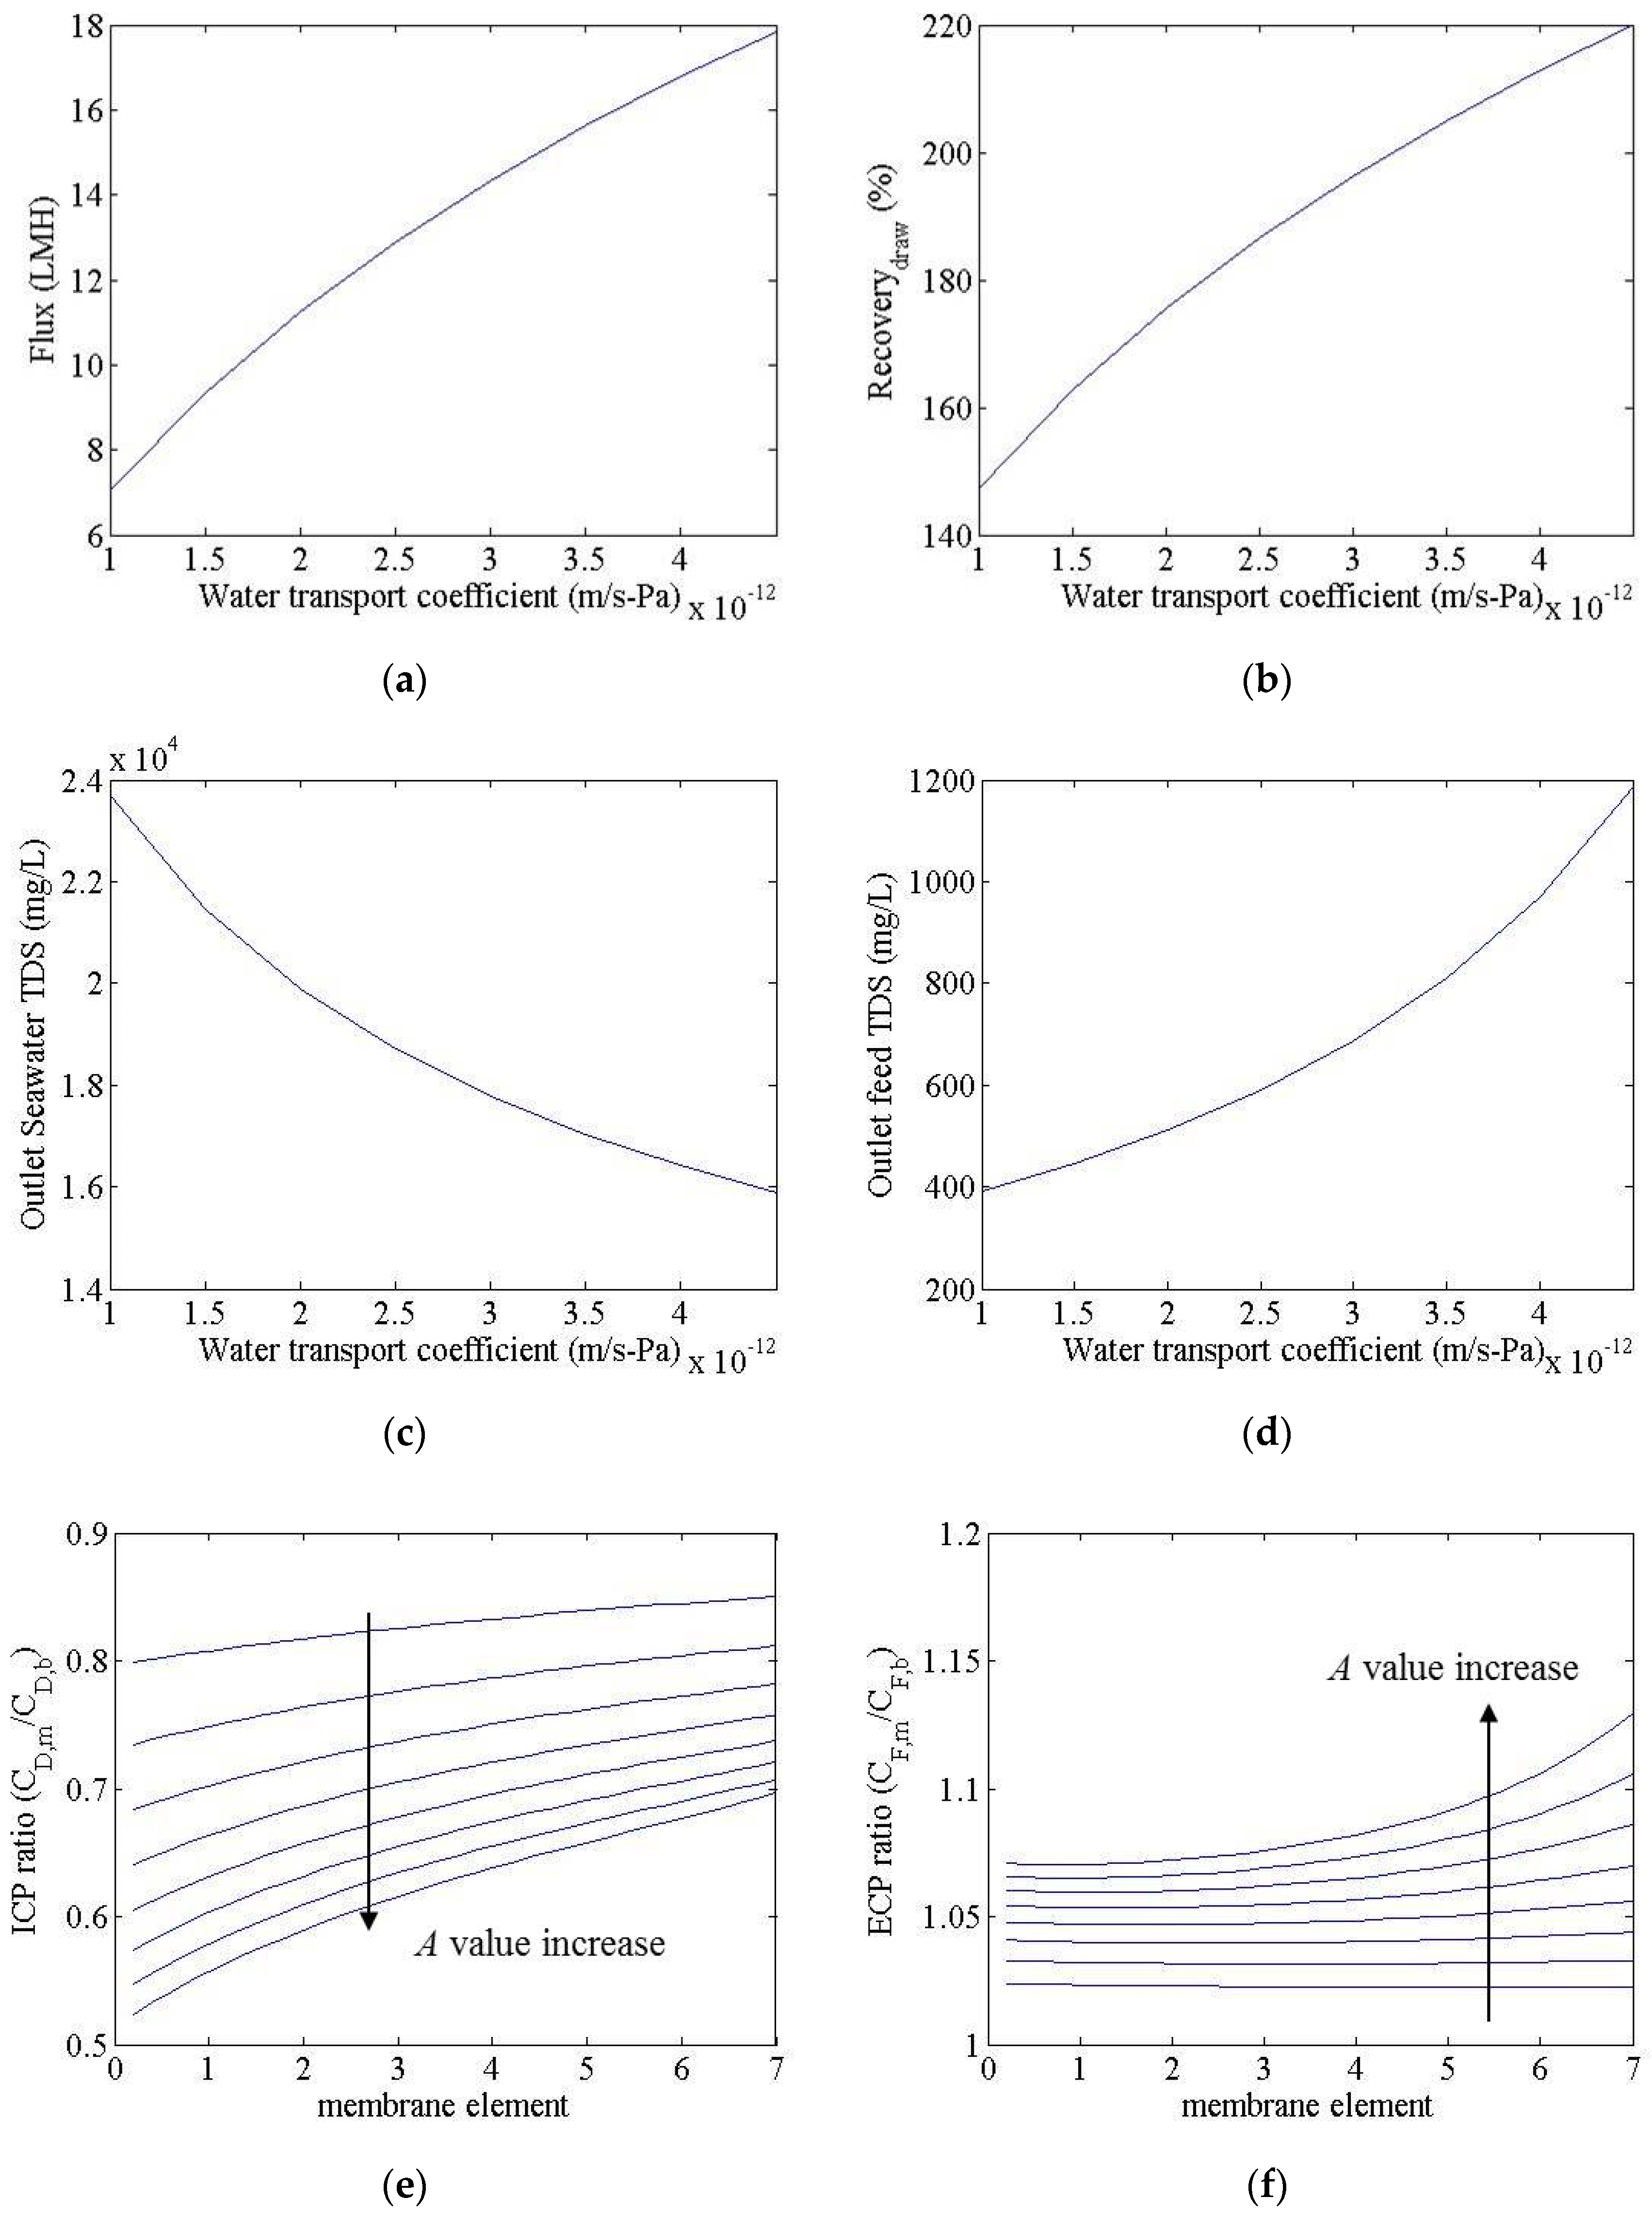
| A | 1.0~4.5 × 10⁻¹² m/s-Pa (3.0 × 10⁻¹² m/s-Pa) |
| B | 1.0~4.5 × 10⁻⁸ m/s (1.8 × 10⁻⁸ m/s) |
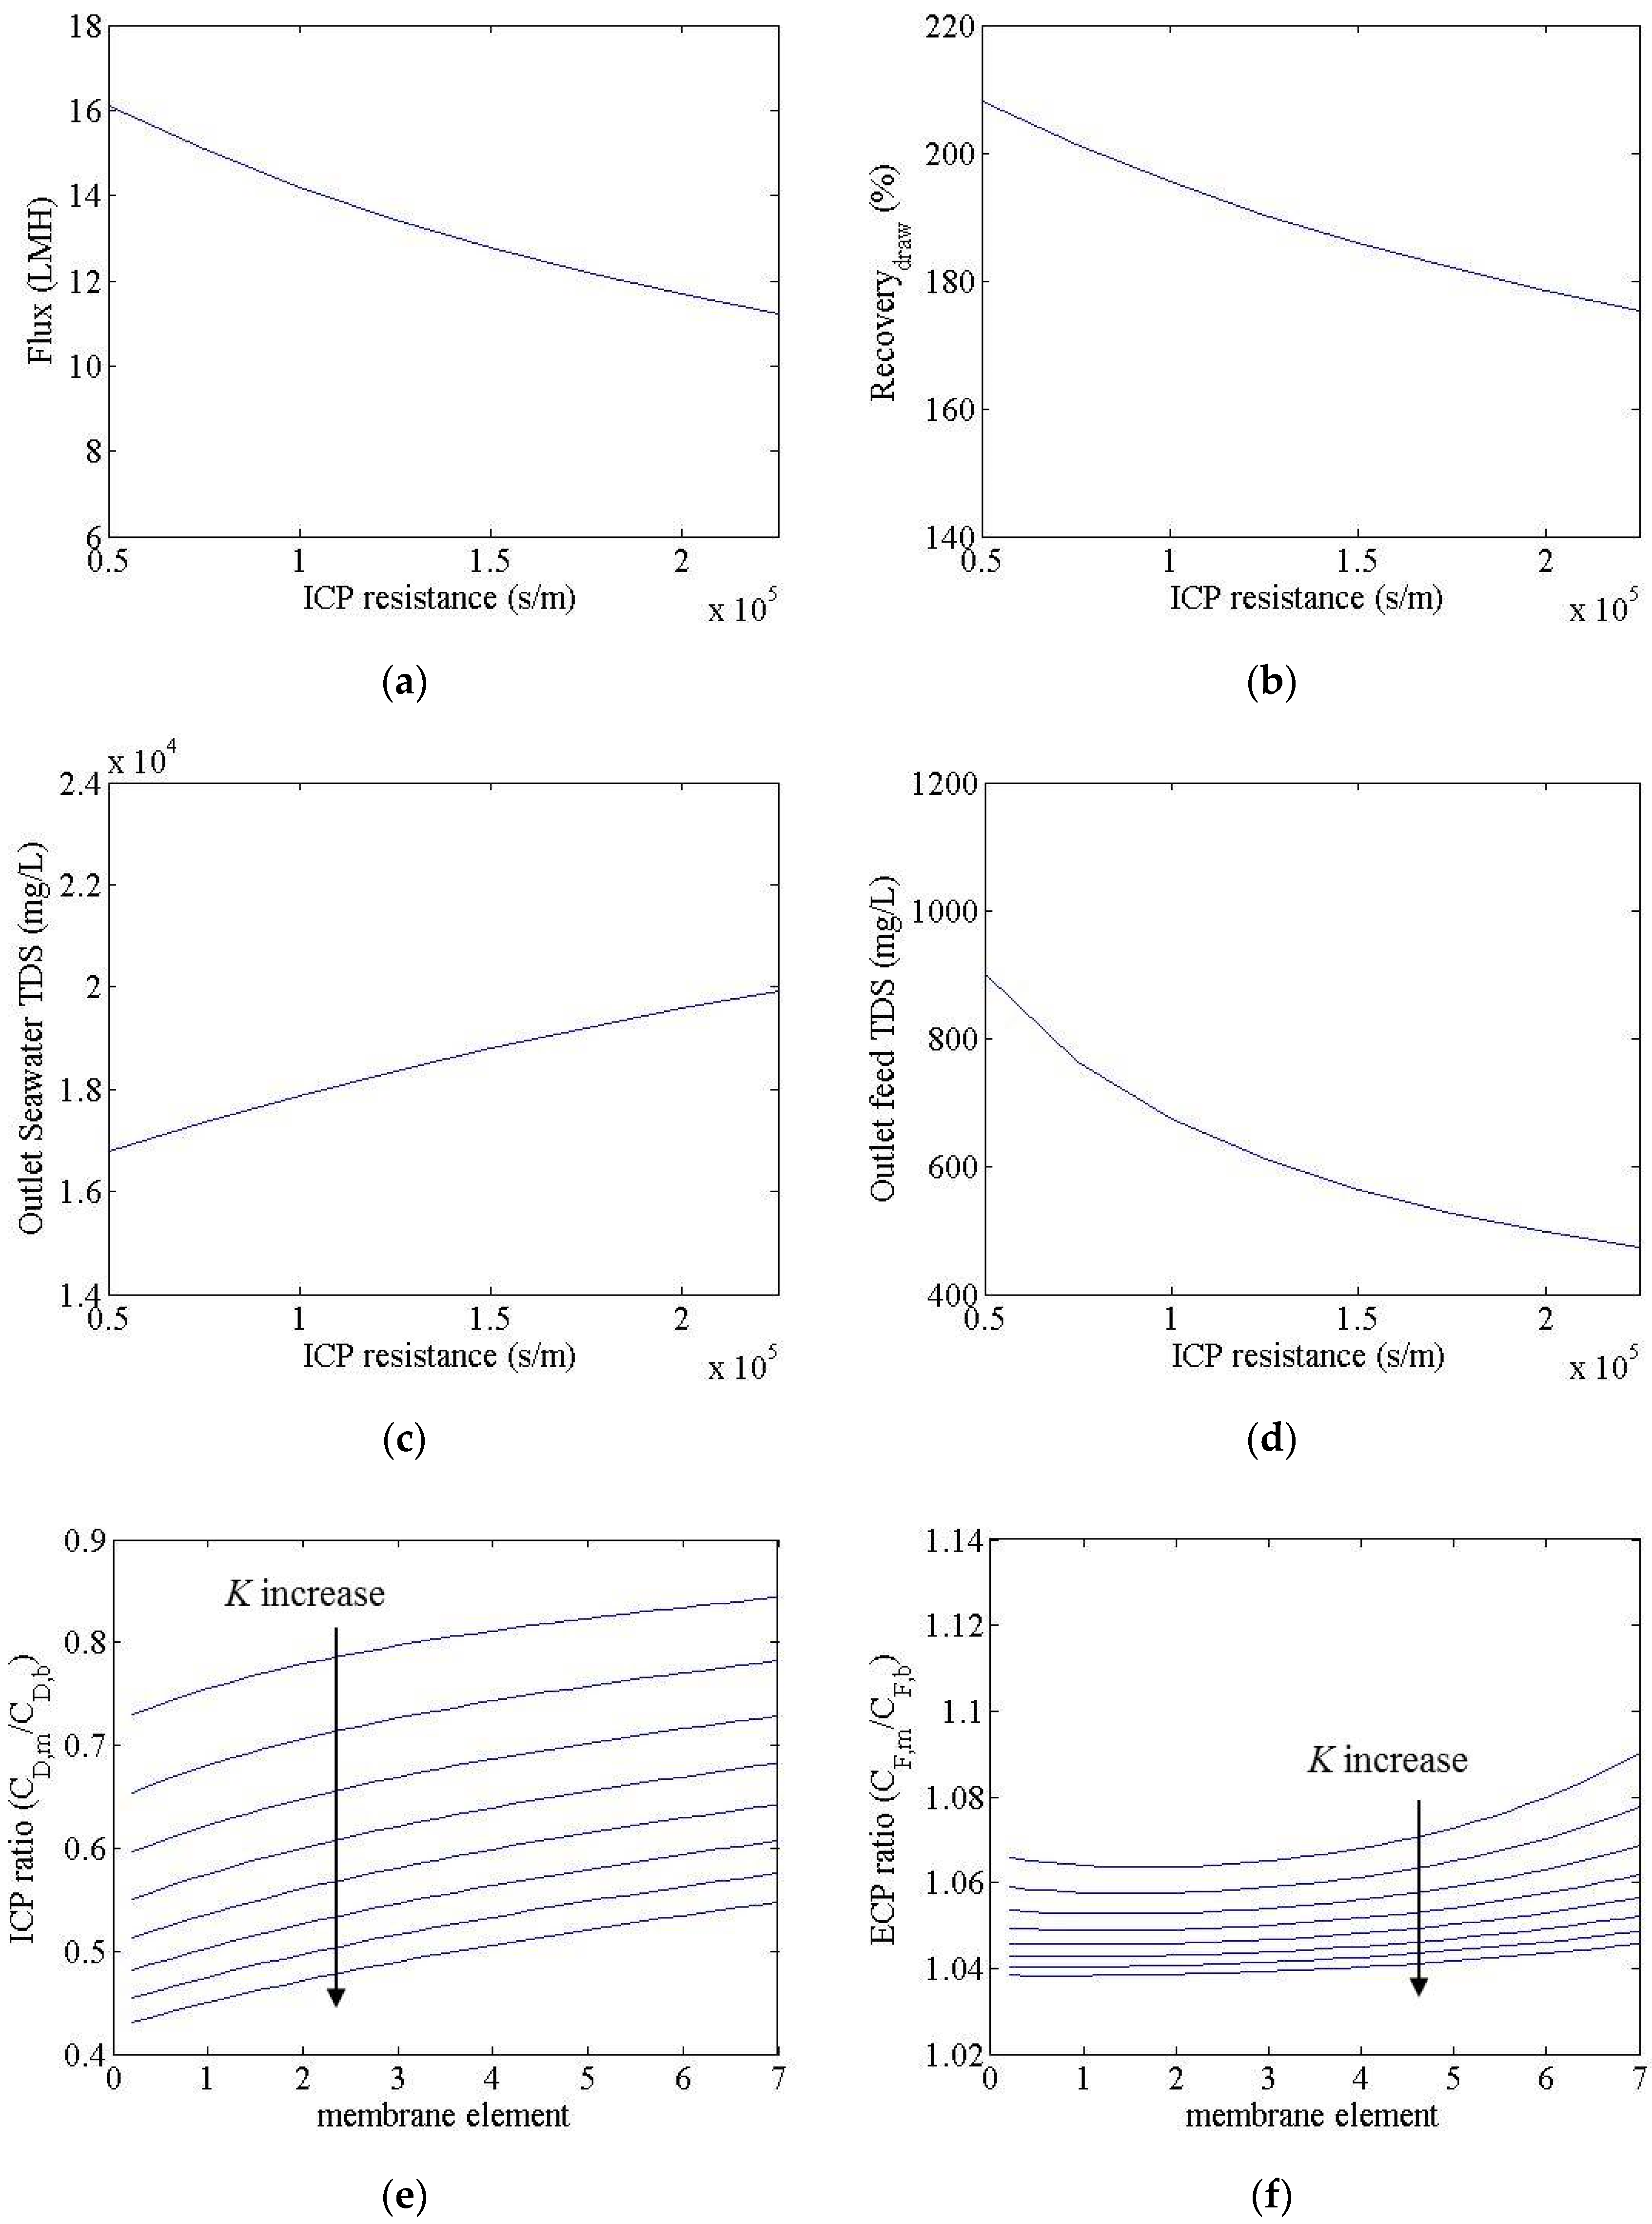
| K | 0.5~7 × 10⁵ s/m (0.96 × 10⁵ s/m) |
| Membrane area | 20 m2/module |
| Module configuration | Spiral wound (seven modules per vessel) |
| TDS | |
| Seawater | 35,000 mg/L |
| Treated wastewater | 200 mg/L |
| Flow rate | |
| Seawater | 100 m3/d per vessel |
| Treated wastewater | 150 m3/d per vessel |
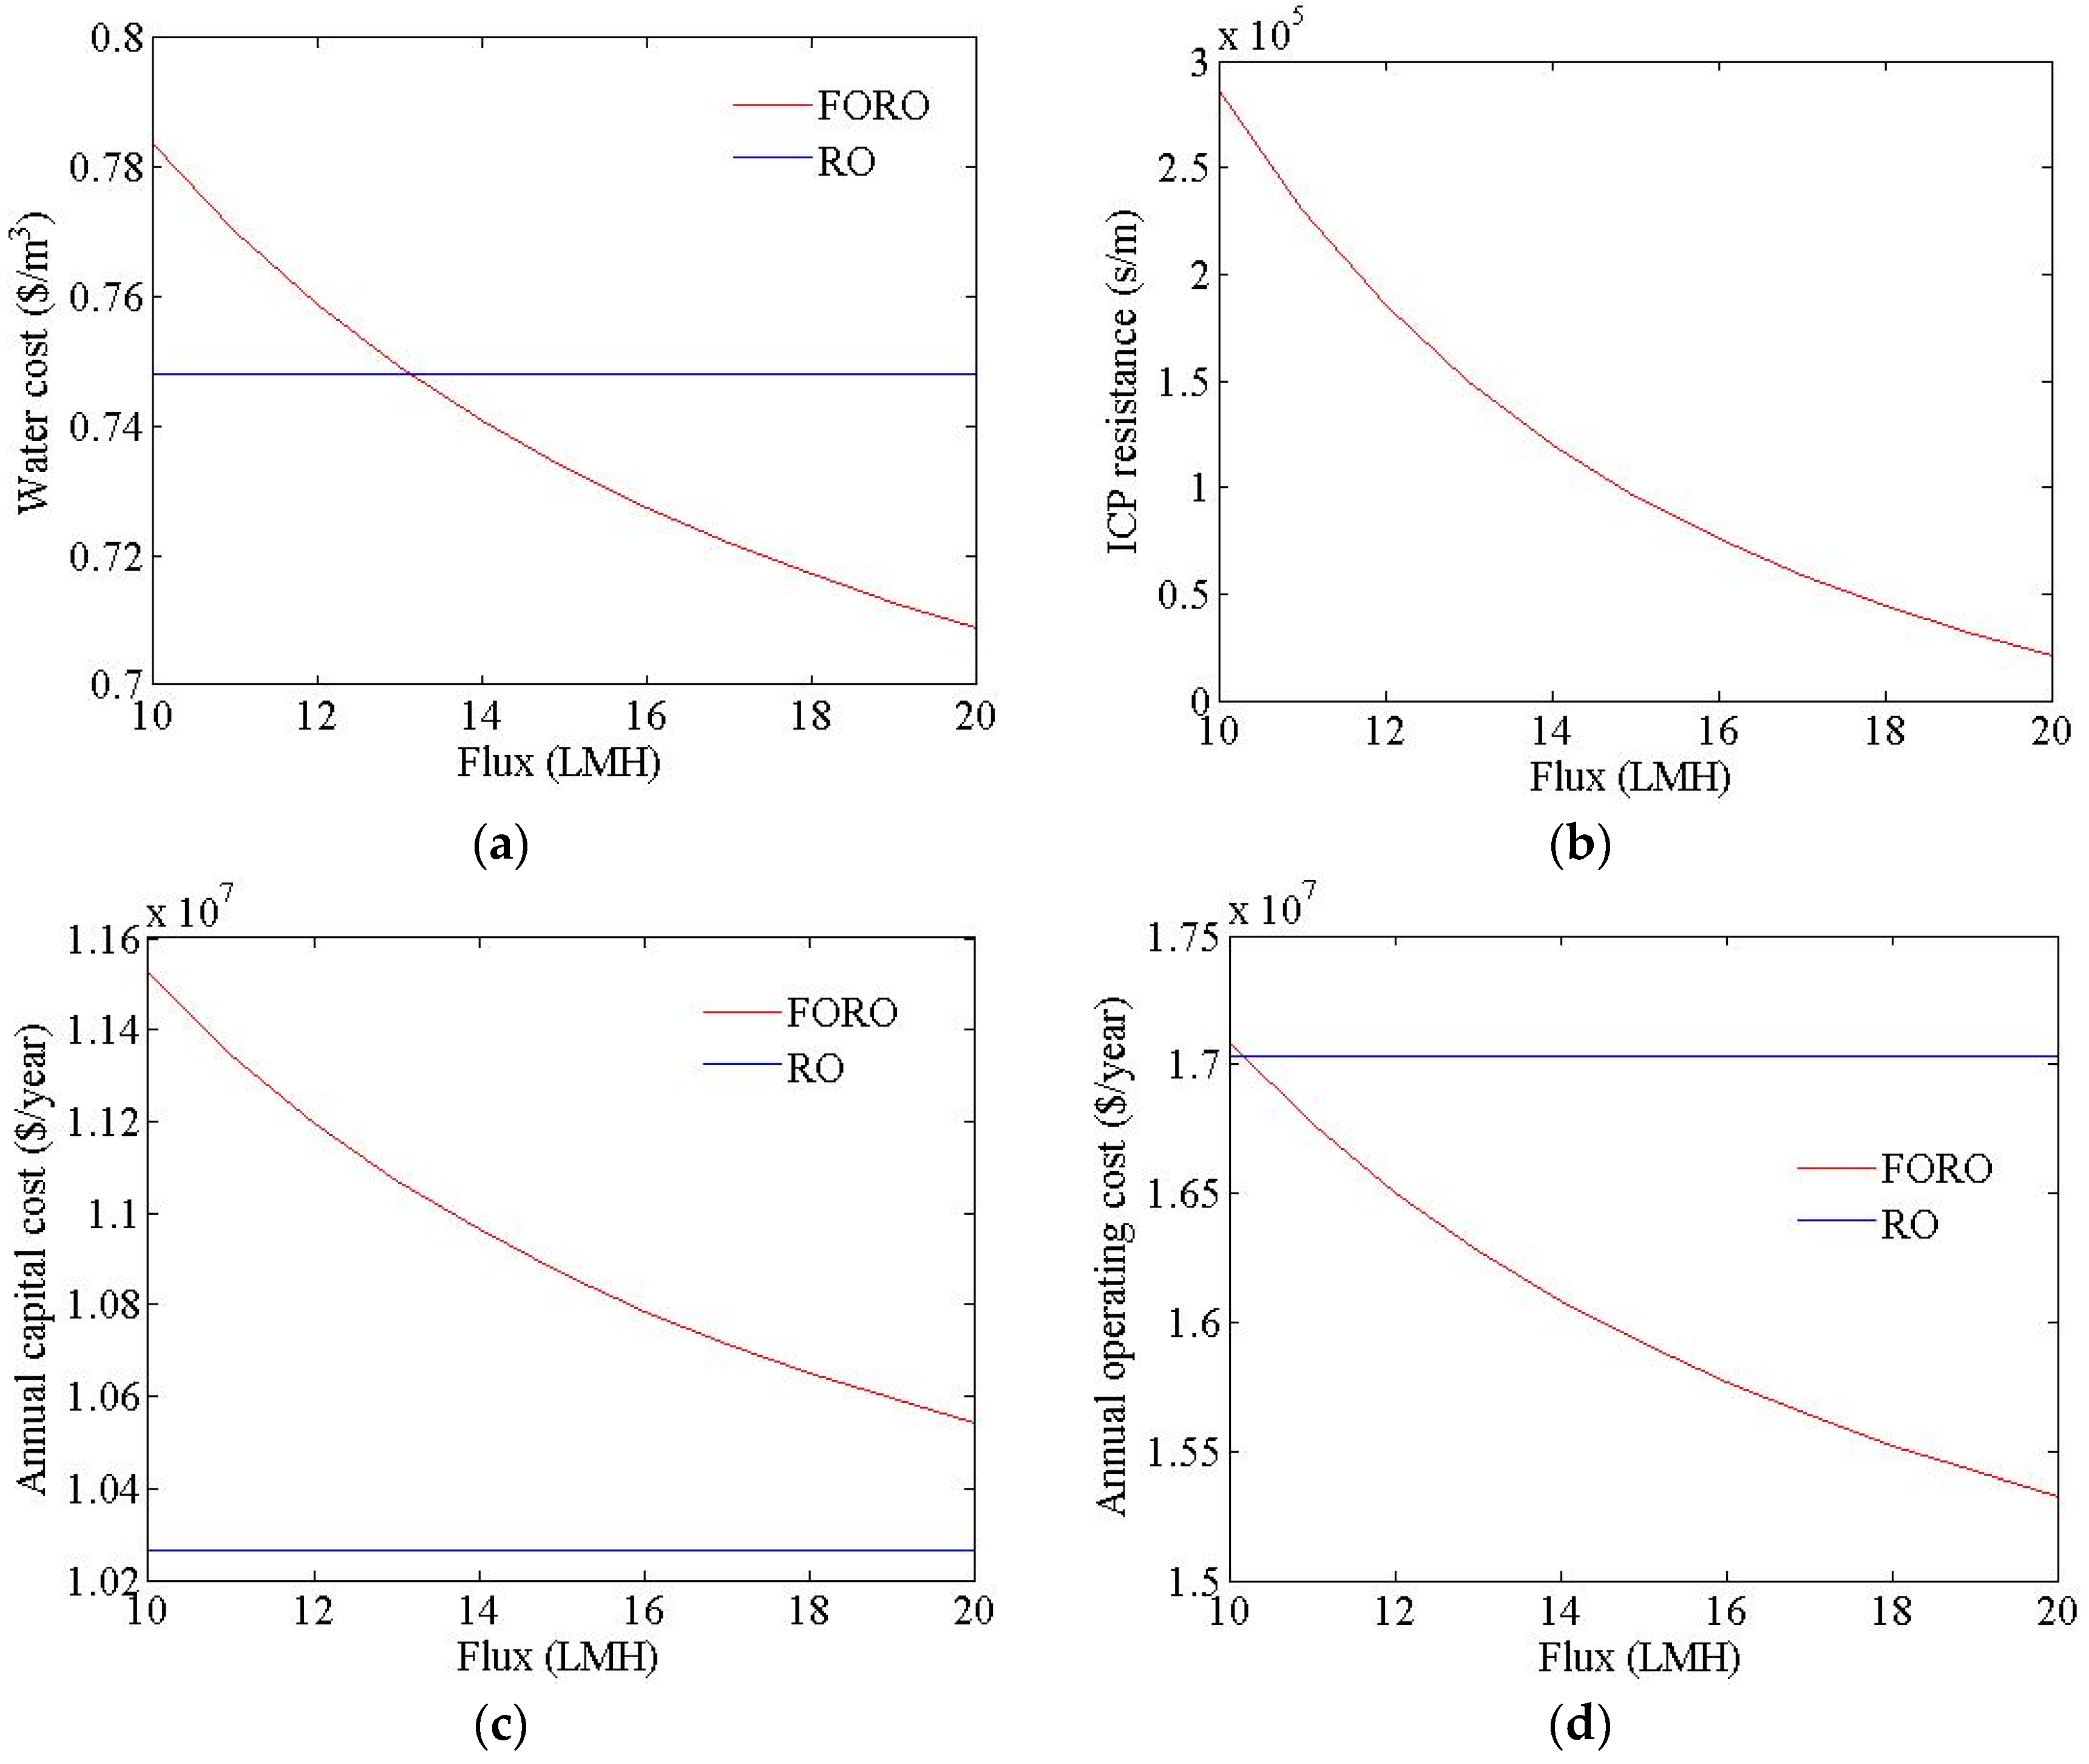
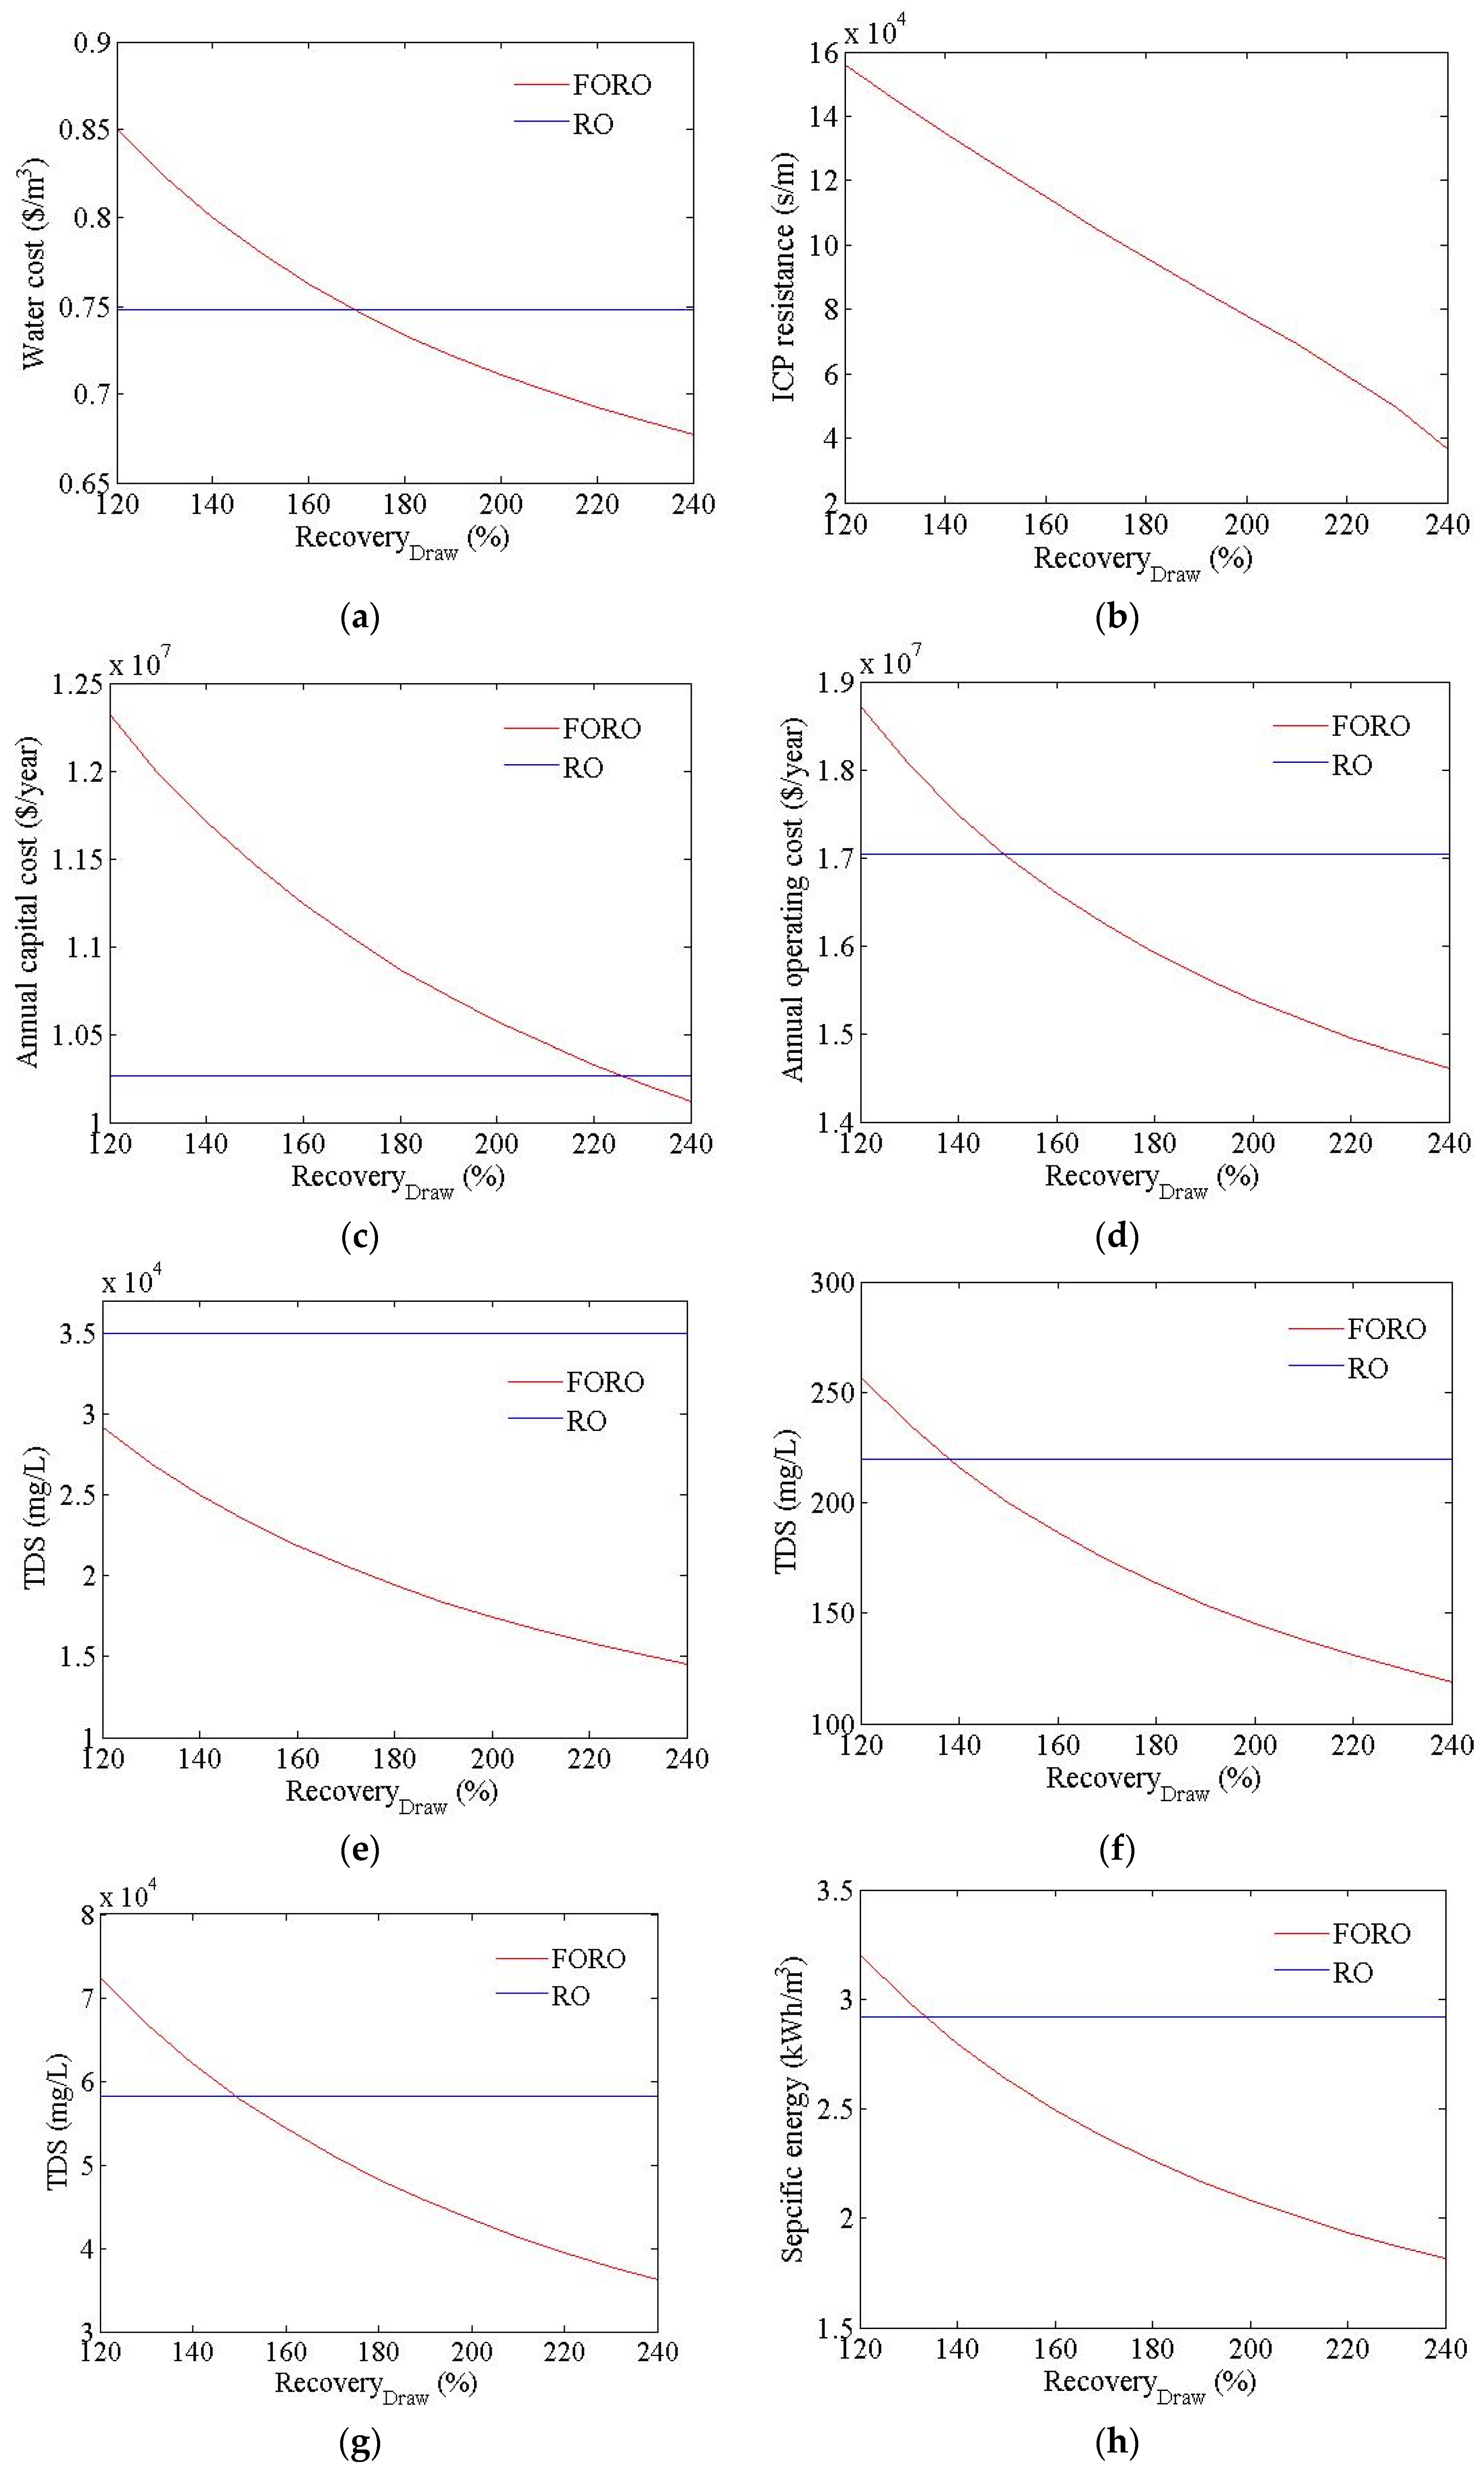
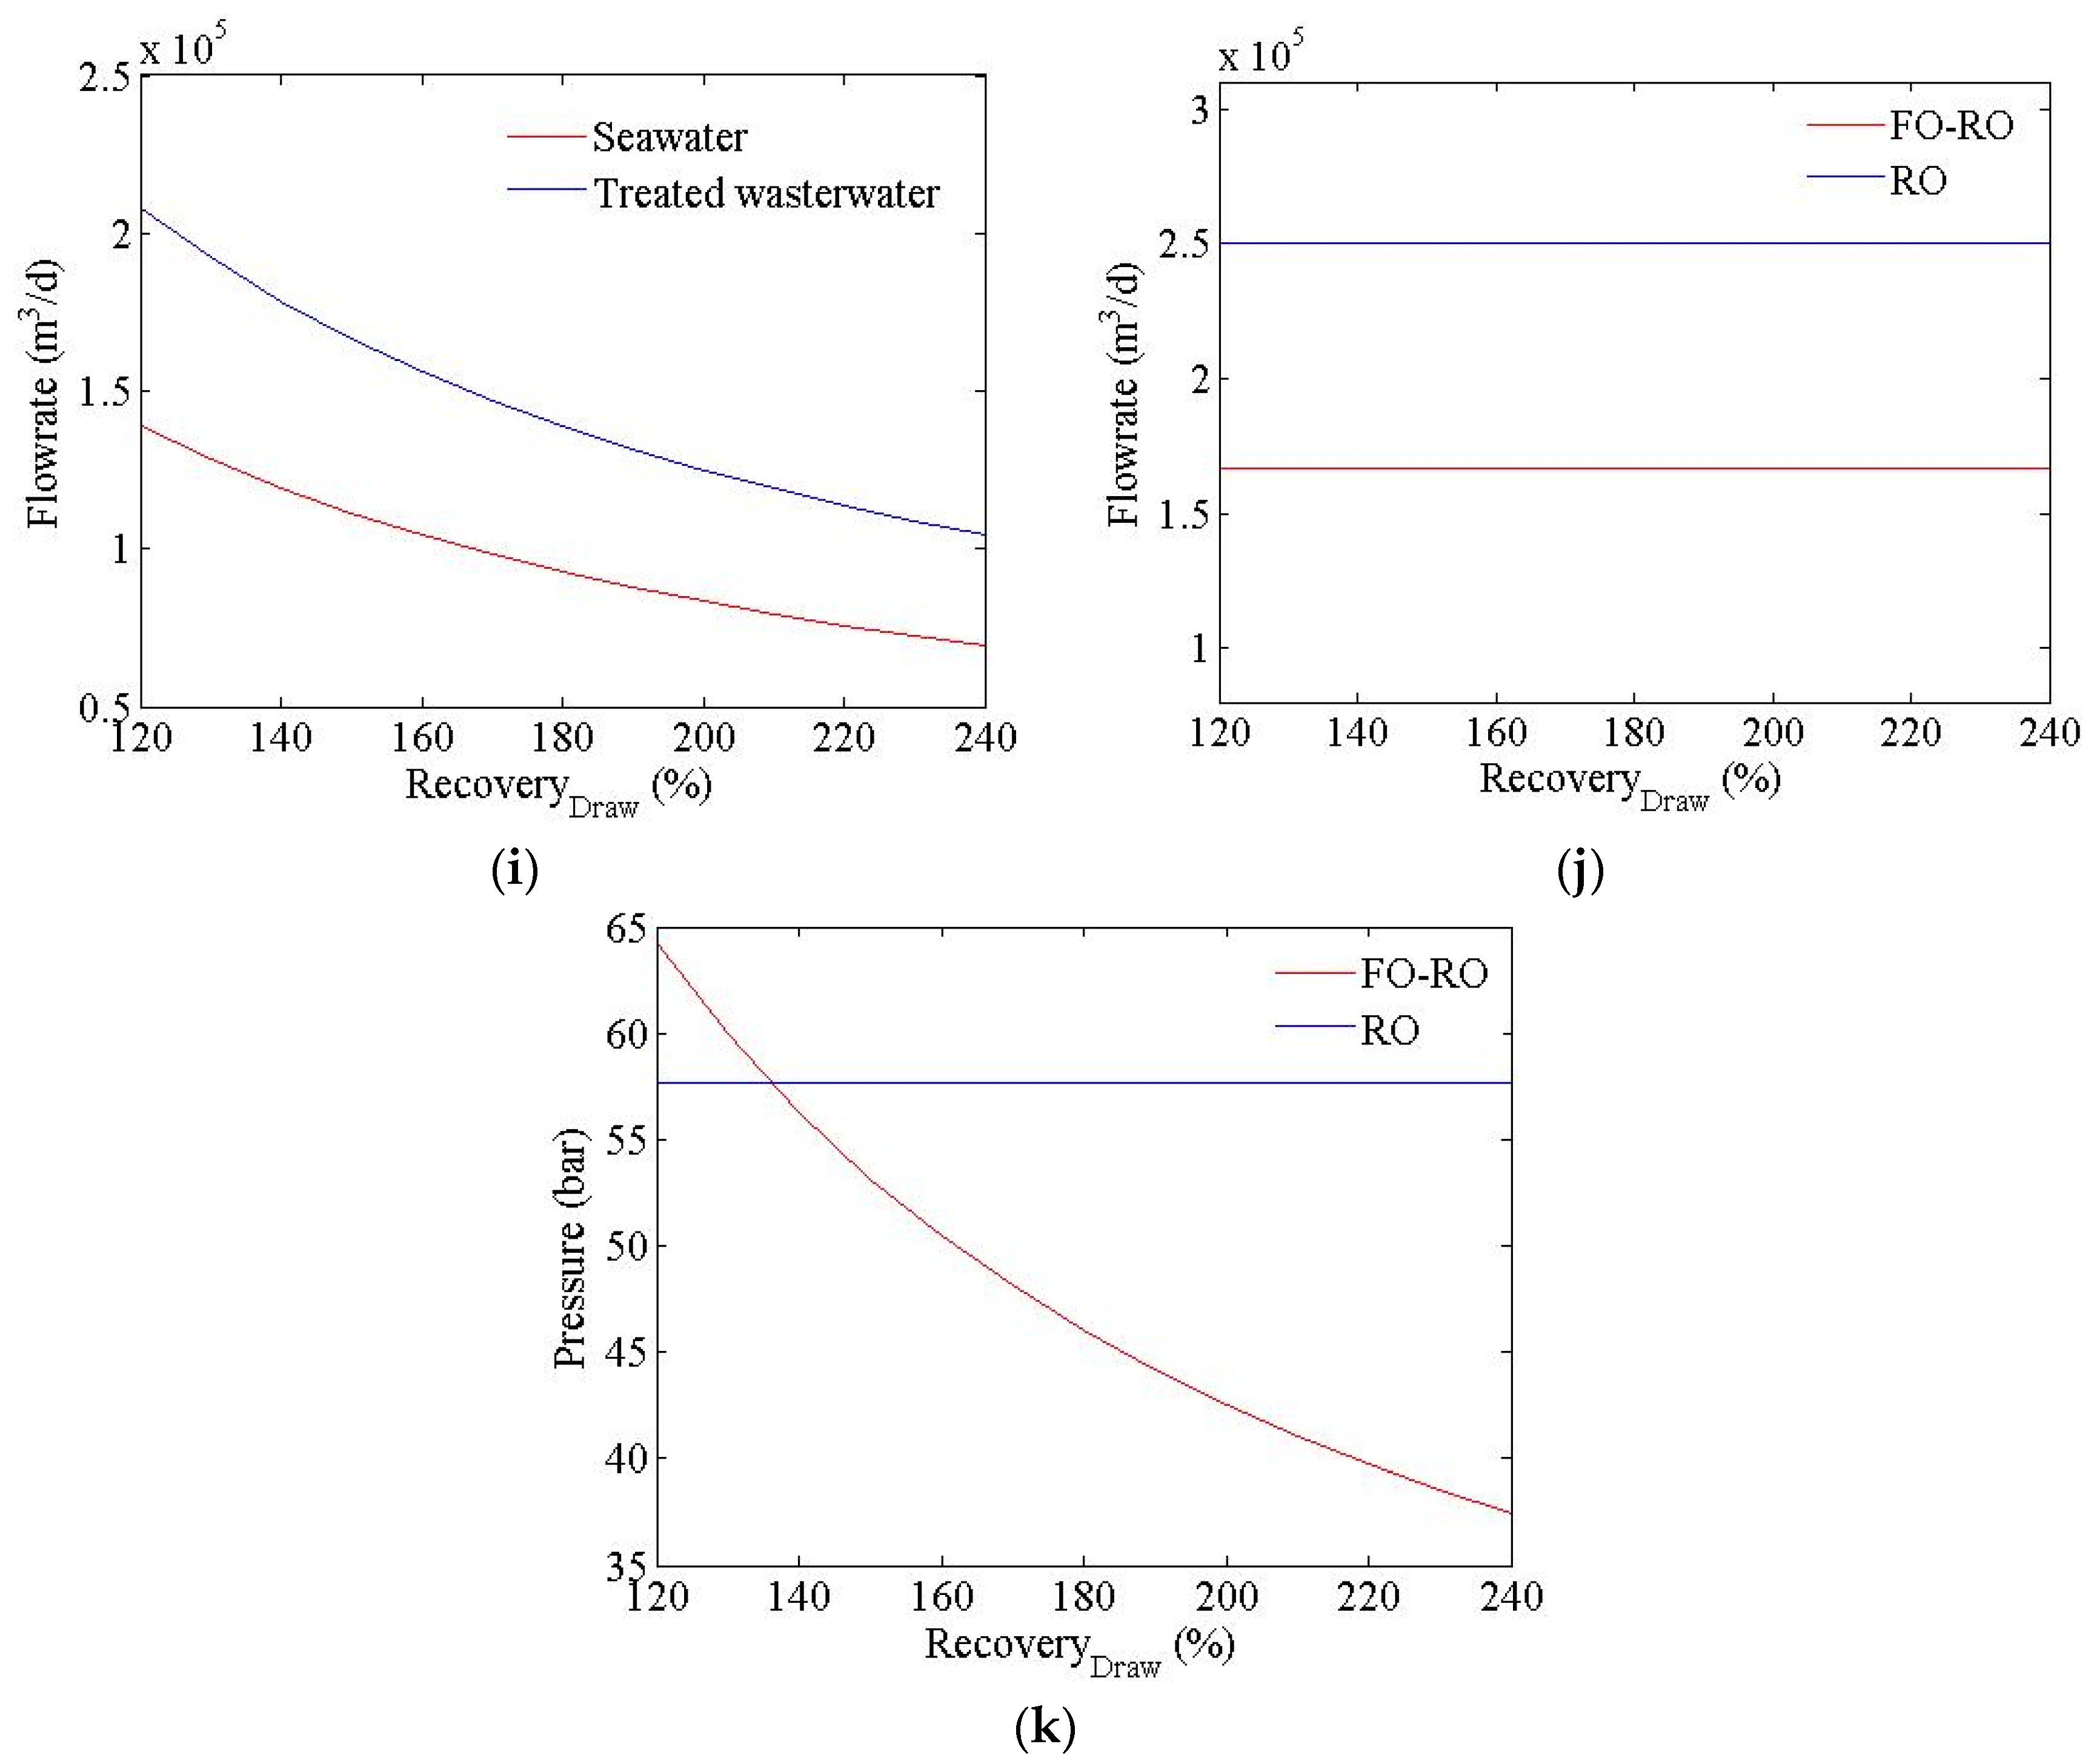
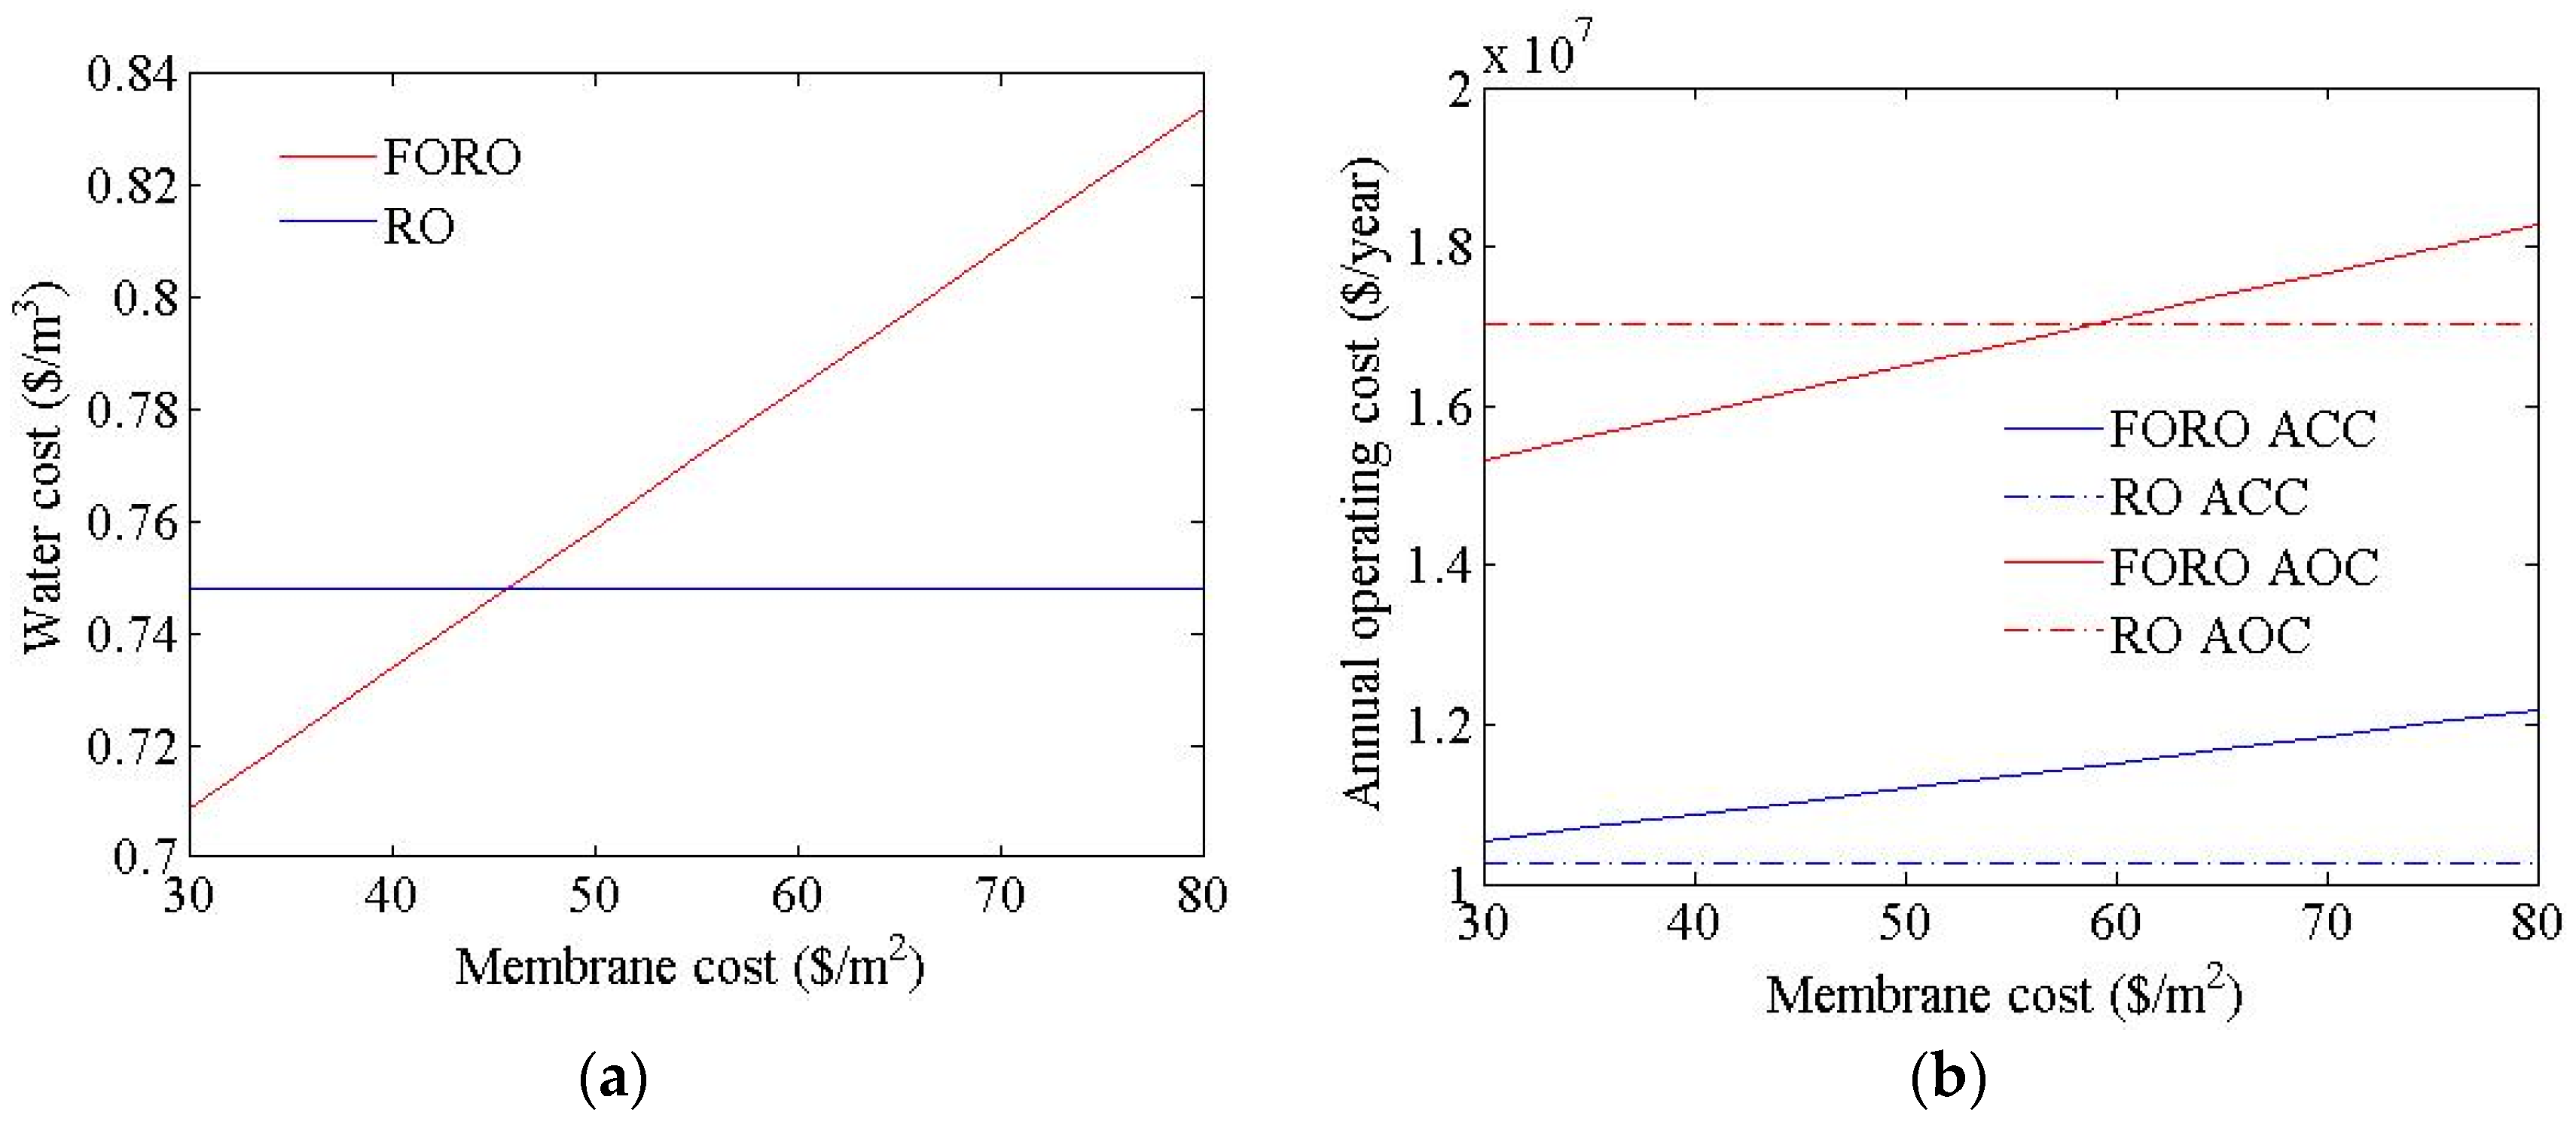
3.2. Cost Estimation of Reverse Osmosis and Forward Osmosis–Reverse Osmosis Hybrid Process
| Parameter | Value | Parameter | Value |
|---|---|---|---|
| RO | FO-RO | ||
| Membrane area | 40 m2 | Membrane area (FO/RO) | 40 m2/40 m2 |
| Permeate flux | 15 LMH | Permeate flux (FO/FO) | 15 LMH/15 LMH |
| Recovery | 40% | Recovery (FO/RO) | 180%/60% |
| Seawater TDS | 35,000 mg/L | Seawater TDS | 35,000 mg/L |
| Treated wastewater TDS | 200 mg/L | ||
| Efficiency | Efficiency | ||
| Pump | 75% | Pump | 75% |
| ERD | 95% | ERD | 95% |
| Cost | Cost | ||
| Electricity bill | USD 0.1/kWh | Electricity bill | USD 0.1/kWh |
| Membrane cost | USD 40/m2 | Membrane cost (FO-RO) | USD 40/USD 40 m2 |
| System load factor | 0.91 | System load factor | 0.91 |
| Interest rate | 0.08 | Interest rate | 0.08 |
| System life | 20 years | System life | 20 years |
| Parameter | Value |
|---|---|
| Energy Consumption | |
| Intake | 2140 kW |
| Pre-treatment | 430 kW |
| HP pump | 8900 kW |
| Booster pump | 1130 kW |
| Specific energy | 2.92 kWh/m3 |
| Water Quality | |
| Permeate TDS | 220 mg/L |
| Brine TDS | 58,200 mg/L |
| Capital Cost | |
| Intake | USD 10,532,000 |
| Pre-treatment | USD 12,287,000 |
| HP pump | USD 25,683,000 |
| Booster pump | USD 9,348,000 |
| Energy recovery device | USD 6,918,000 |
| Membrane | USD 11,121,000 |
| Site | USD 13,000,000 |
| Direct capital cost | USD 77,254,000 |
| Indirect capital cost | USD 23,257,000 |
| Capital cost | USD 100,511,000 |
| Annual capital cost | USD 10,265,000/year |
| Operating Cost | |
| Power cost | USD 9,700,000/year |
| Membrane replacement | USD 2,240,000/year |
| Labor, chemicals, and maintenance | USD 5,110,000/year |
| Annual operating cost | USD 17,050,000/year |
| Water cost | |
| Water cost | USD 0.75/m3 |


4. Conclusions
- In the FO process of an FO-RO hybrid system, membrane parameters such as the water transport coefficient and ICP resistance are very important factors that affect performance. On the other hand, the effect of the salt transport coefficient does not seem to be large.
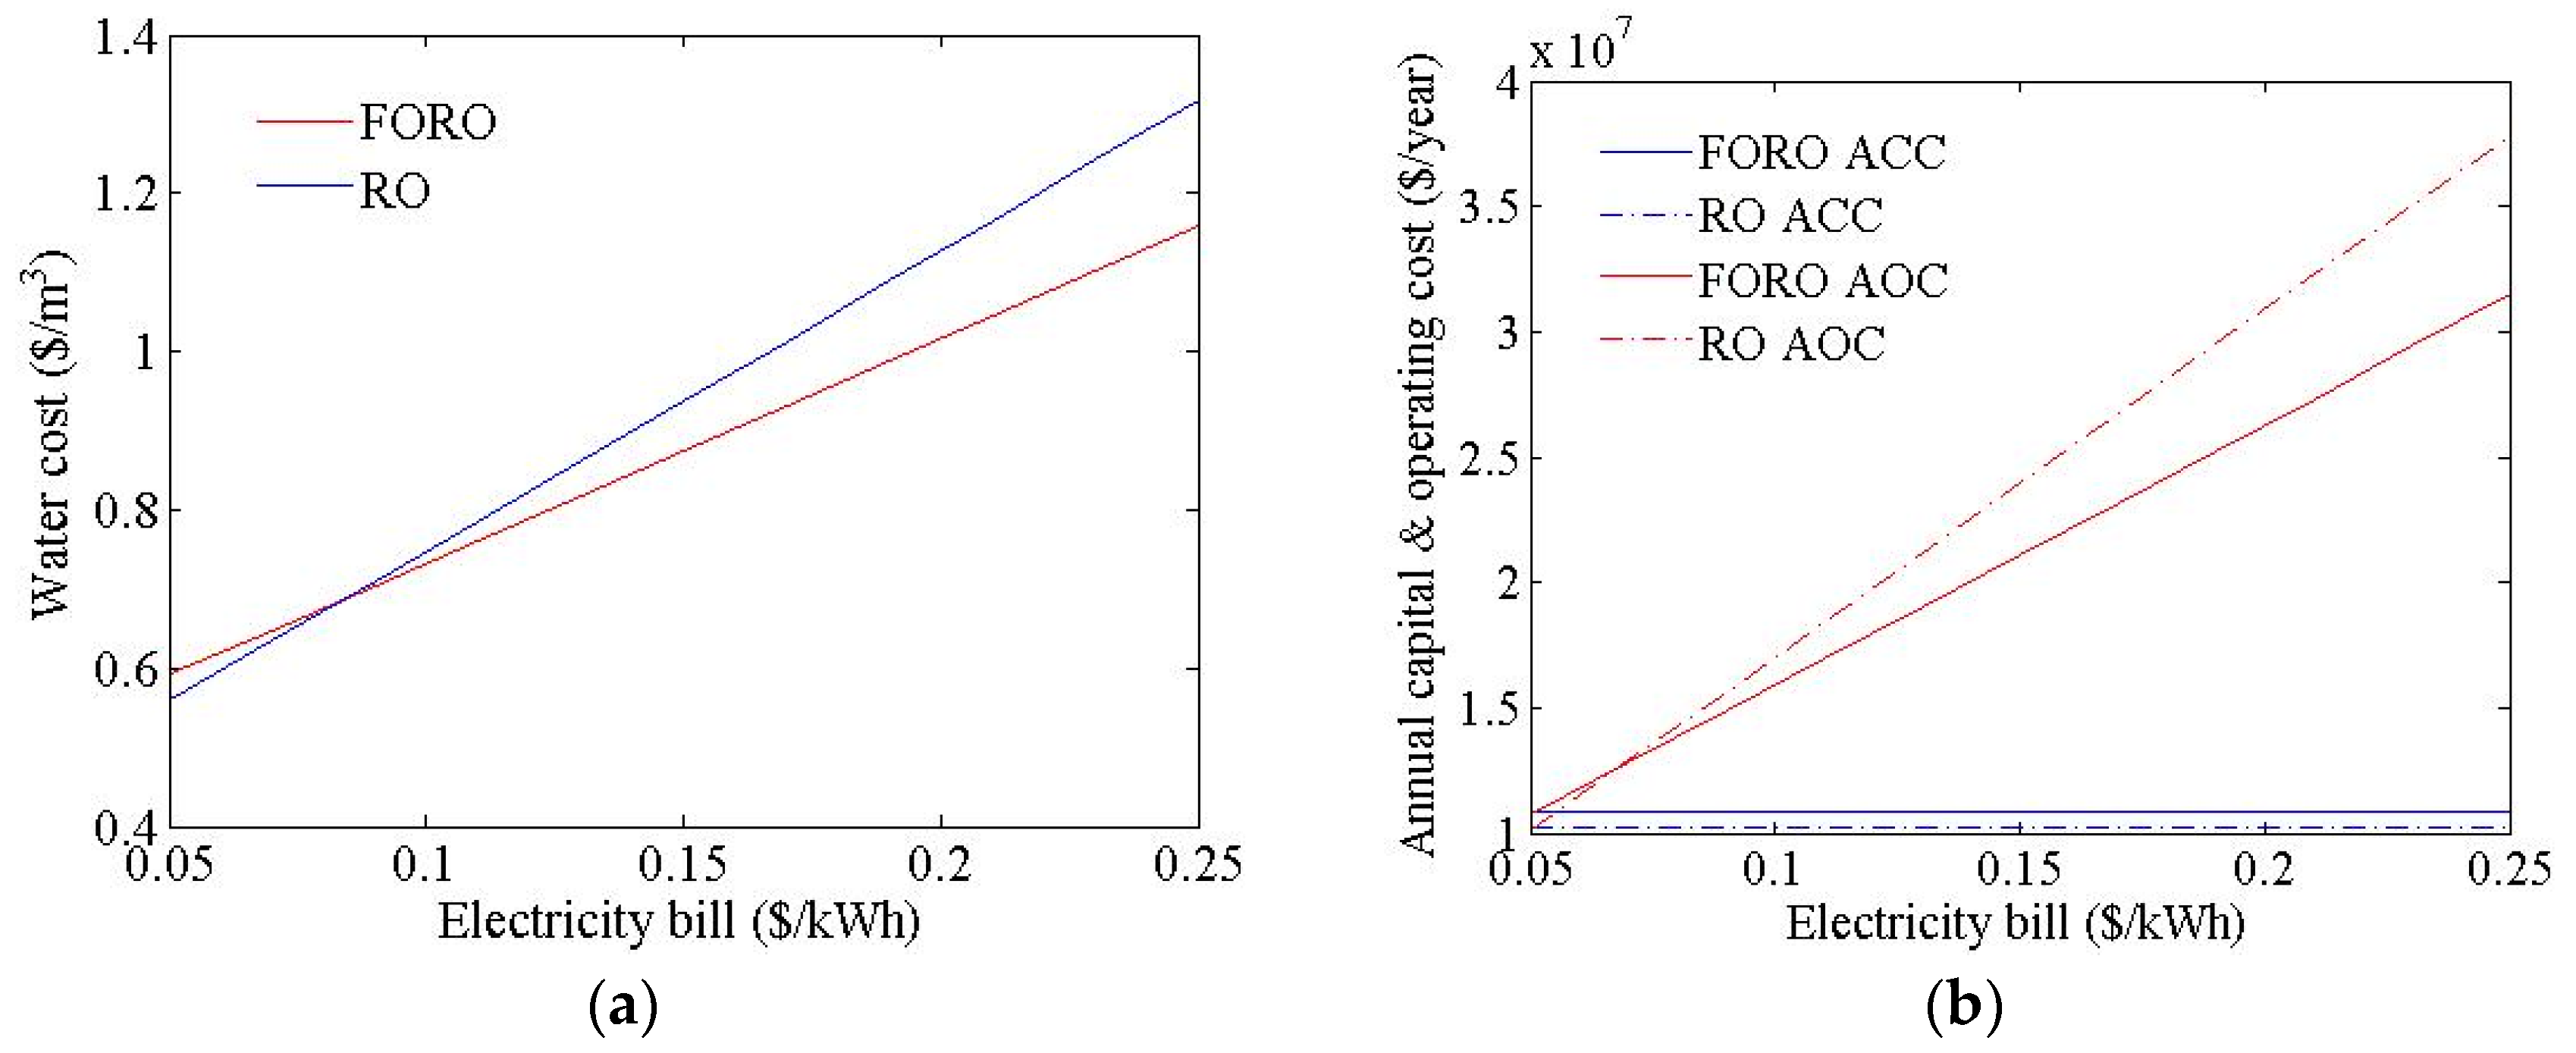
- The flux and recovery of the FO process, the FO membrane, and the electricity cost were found to be very important factors that influence the water cost of an FO-RO hybrid system.
- An FO-RO hybrid system can be price-competitive relative to an RO system when its recovery rate is very high, the flux and membrane cost of the FO are similar to those of RO, and the electricity cost is expensive.
- The most important consideration in commercializing the FO process is enhancing performance in terms of flux and the recovery of FO membranes.
- The use of a simple model can help us understand the characteristics of the FO process.
- Further research is required to determine the optimal FO and RO configurations for use in various applications.
Author Contributions
Conflicts of Interest
References
- Choi, J.-S.; Kim, H.; Lee, S.; Hwang, T.-M.; Oh, H.; Yang, D.R.; Kim, J.H. Theoretical investigation of hybrid desalination system combining reverse osmosis and forward osmosis. Desalin. Water Treat. 2010, 15, 114–120. [Google Scholar] [CrossRef]
- Matsuura, T. Progress in membrane science and technology for seawater desalination—A review. Desalination 2001, 134, 47–54. [Google Scholar] [CrossRef]
- Qin, J.J.; Lay, W.C.L.; Kekre, K.A. Recent developments and future challenges of forward osmosis for desalination: A review. Desalin. Water Treat. 2012, 39, 123–136. [Google Scholar] [CrossRef]
- Blandin, G.; Verliefde, A.R.D.; Tang, C.; Le-Clech, P. Opportunities to reach economic sustainability in forward osmosis–reverse osmosis hybrids for seawater desalination. Desalination 2015, 363, 26–36. [Google Scholar] [CrossRef]
- Cath, T.Y.; Childress, A.E.; Elimelech, M. Forward osmosis: Principles, applications, and recent developments. J. Membr. Sci. 2006, 281, 70–87. [Google Scholar] [CrossRef]
- McCutcheon, J.R.; McGinnis, R.L.; Elimelech, M. Desalination by ammonia–carbon dioxide forward osmosis: Influence of draw and feed solution concentrations on process performance. J. Membr. Sci. 2006, 278, 114–123. [Google Scholar] [CrossRef]
- Yokochia, A.; Zabarab, B.; Babaqib, A.S. Hybrid FO/RO desalination system: Preliminary assessment of osmotic energy recovery and designs of new FO membrane module configurations. Desalination 2011, 268, 163–169. [Google Scholar] [CrossRef]
- Cath, T.Y.; Drewes, J.E.; Lundin, C.D. A Novel Hybrid Forward Osmosis Process for Drinking Water Augmentation Using Impaired Water and Saline Water Sources; WERC Consortium for Environmental Education and Technology Development at New Mexico State University and Water Research Foundation; Water Research Foundation: Las Cruces, NM, USA, 2009. [Google Scholar]
- Cath, T.Y.; Hancock, N.T.; Lundin, C.D.; Hoppe-Jones, C.; Drewes, J.E. A multi-barrier osmotic dilution process for simultaneous desalination and purification of impaired water. J. Membr. Sci. 2010, 362, 417–426. [Google Scholar] [CrossRef]
- Yangali-Quintanilla, V.; Olesen, L.; Lorenzen, J.; Rasmussen, C.; Laursen, H.; Vestergaard, E.; Keiding, K. Lowering desalination costs by alternative desalination and water reuse scenarios. Desalin. Water Treat. 2015, 55, 2437–2445. [Google Scholar] [CrossRef]
- Darwish, M.A.; Abdel-Jawad, M.; Aly, G.S. Technical and economical comparison between large capacity multi-stage flash and reverse osmosis desalting system. Desalination 1989, 72, 367–379. [Google Scholar] [CrossRef]
- Dreyzin, Y. Ashkelon seawater desalination project-off-taker’s self costs, supplied water costs and benefits. Desalination 2006, 190, 104–116. [Google Scholar] [CrossRef]
- Sommariva, C. Desalination Management and Economics; Mott Mac Donald: Croydon, UK, 2004. [Google Scholar]
- Malek, A.; Hawlader, M.N.A.; Ho, J.C. Design and economics of RO seawater desalination. Desalination 1996, 105, 245–261. [Google Scholar] [CrossRef]
- Marian, M.G.; Pío, A.A.; Nicolás, J.S. Global optimal design of reverse osmosis networks for seawater desalination: modeling and algorithm. Desalination 2005, 184, 259–271. [Google Scholar] [CrossRef]
- François, V.; François, M.; Emmanuelle, A.; Philippe, B. Multi-objective optimization of RO desalination system. Desalination 2008, 222, 96–118. [Google Scholar] [CrossRef]
- Lee, S.; Lueptow, R.M. Membrane rejection of nitrogen compounds. Environ. Sci. Technol. 2001, 35, 3008–3018. [Google Scholar] [CrossRef] [PubMed]
- Cheryan, M. Ultrafiltration and Microfiltration Handbook; Technomic Publishing: Lancaster, PA, USA, 1998. [Google Scholar]
- Hua, Y.-D.; Zhangb, X.L.; Wua, L.Y.; Liua, Q.Z. Optimum design of reverse osmosis system under different feed concentration and product specification. J. Membr. Sci. 2007, 287, 219–229. [Google Scholar] [CrossRef]
- Loeb, S.; Titelman, L.; Korngold, E.; Freiman, J. Effect of porous support fabric on osmosis through a Loeb–Sourirajan type asymmetric membrane. J. Membr. Sci. 1997, 129, 243–249. [Google Scholar] [CrossRef]
- Tiraferri, A.; Yip, N.Y.; Phillip, W.A.; Schiffman, J.D.; Elimelech, M. Relating performance of thin-film composite forward osmosis membranes to support layer formation and structure. J. Membr. Sci. 2011, 367, 340–352. [Google Scholar] [CrossRef]
- Yip, N.Y.; Tiraferri, A.; Phillip, W.A.; Schiffman, J.D.; Elimelech, M. High performance thin-film composite forward osmosis membrane. Environ. Sci. Technol. 2010, 44, 3812–3818. [Google Scholar] [CrossRef] [PubMed]
- Su, J.; Chung, T.S. Sublayer structure and reflection coefficient and their effects on concentration polarization and membrane performance in FO processes. J. Membr. Sci. 2011, 376, 214–224. [Google Scholar] [CrossRef]
- Wei, J.; Qiu, C.; Tang, C.Y.; Wang, R.; Fane, A.G. Synthesis and characterization of flat-sheet thin film composite forward osmosis membranes. J. Membr. Sci. 2011, 372, 292–302. [Google Scholar] [CrossRef]
- Wang, R.; Shi, L.; Tang, C.Y.; Chou, S.; Qiu, C.; Fane, A.G. Characterization of novel forward osmosis hollow fiber membranes. J. Membr. Sci. 2010, 355, 158–167. [Google Scholar] [CrossRef]
- Shi, L.; Xhou, S.R.; Wang, R.; Fang, W.X.; Tang, C.Y.; Fang, A.G. Effect of substrate structure on the performance of thin-film composite forward osmosis hollow fiber membranes. J. Membr. Sci. 2011, 382, 116–123. [Google Scholar] [CrossRef]
- Puguan, J.M.C.; Kim, H.-S.; Lee, K.-J.; Kim, H. Low internal concentration polarization in forward osmosis membranes with hydrophilic crosslinked PVA nanofibers as porous support layer. Desalination 2014, 336, 24–31. [Google Scholar] [CrossRef]
- Bui, N.-N.; Lind, M.L.; Hoek, E.M.V.; McCutcheon, J.R. Electrospun nanofiber supported thin film composite membranes for engineered osmosis. J. Membr. Sci. 2011, 385–386, 10–19. [Google Scholar] [CrossRef]
© 2015 by the authors; licensee MDPI, Basel, Switzerland. This article is an open access article distributed under the terms and conditions of the Creative Commons by Attribution (CC-BY) license (http://creativecommons.org/licenses/by/4.0/).
Share and Cite
Choi, Y.; Cho, H.; Shin, Y.; Jang, Y.; Lee, S. Economic Evaluation of a Hybrid Desalination System Combining Forward and Reverse Osmosis. Membranes 2016, 6, 3. https://doi.org/10.3390/membranes6010003
Choi Y, Cho H, Shin Y, Jang Y, Lee S. Economic Evaluation of a Hybrid Desalination System Combining Forward and Reverse Osmosis. Membranes. 2016; 6(1):3. https://doi.org/10.3390/membranes6010003
Chicago/Turabian StyleChoi, Yongjun, Hyeongrak Cho, Yonghyun Shin, Yongsun Jang, and Sangho Lee. 2016. "Economic Evaluation of a Hybrid Desalination System Combining Forward and Reverse Osmosis" Membranes 6, no. 1: 3. https://doi.org/10.3390/membranes6010003
APA StyleChoi, Y., Cho, H., Shin, Y., Jang, Y., & Lee, S. (2016). Economic Evaluation of a Hybrid Desalination System Combining Forward and Reverse Osmosis. Membranes, 6(1), 3. https://doi.org/10.3390/membranes6010003