Study of the Effect of Nanoparticles and Surface Morphology on Reverse Osmosis and Nanofiltration Membrane Productivity

Abstract
:
1. Introduction

| Model | Equation | Assumption |
|---|---|---|
| Complete blocking filtration |  | Particles are not superimposed on one another, the blocked surface area is proportional to the permeate volume |
| Intermediate blocking filtration |  | Particles can overlap each other, not every deposited particle block the pores |
| Standard blocking filtration |  | Particles are small enough to enter the pores, the decrease of pore volume is proportional to the permeate volume |
| Cake filtration |  | Particles are big enough to not enter the pores, and therefore forms a cake layer on the surface |
2. Experimental Design
2.1. Preparation of Membrane and Nanoparticles
| Designation | Membrane type | Manufacturer | Polymer | * MWCO | Pressure, psi |
|---|---|---|---|---|---|
| BW30 | RO | Dow | Polyamide | 100D | 260 |
| XLE | RO | Dow | Polyamide | 100D | 130 |
| CK | NF | GE Osmonics | Cellulose Acetate | 2000 | 220 |
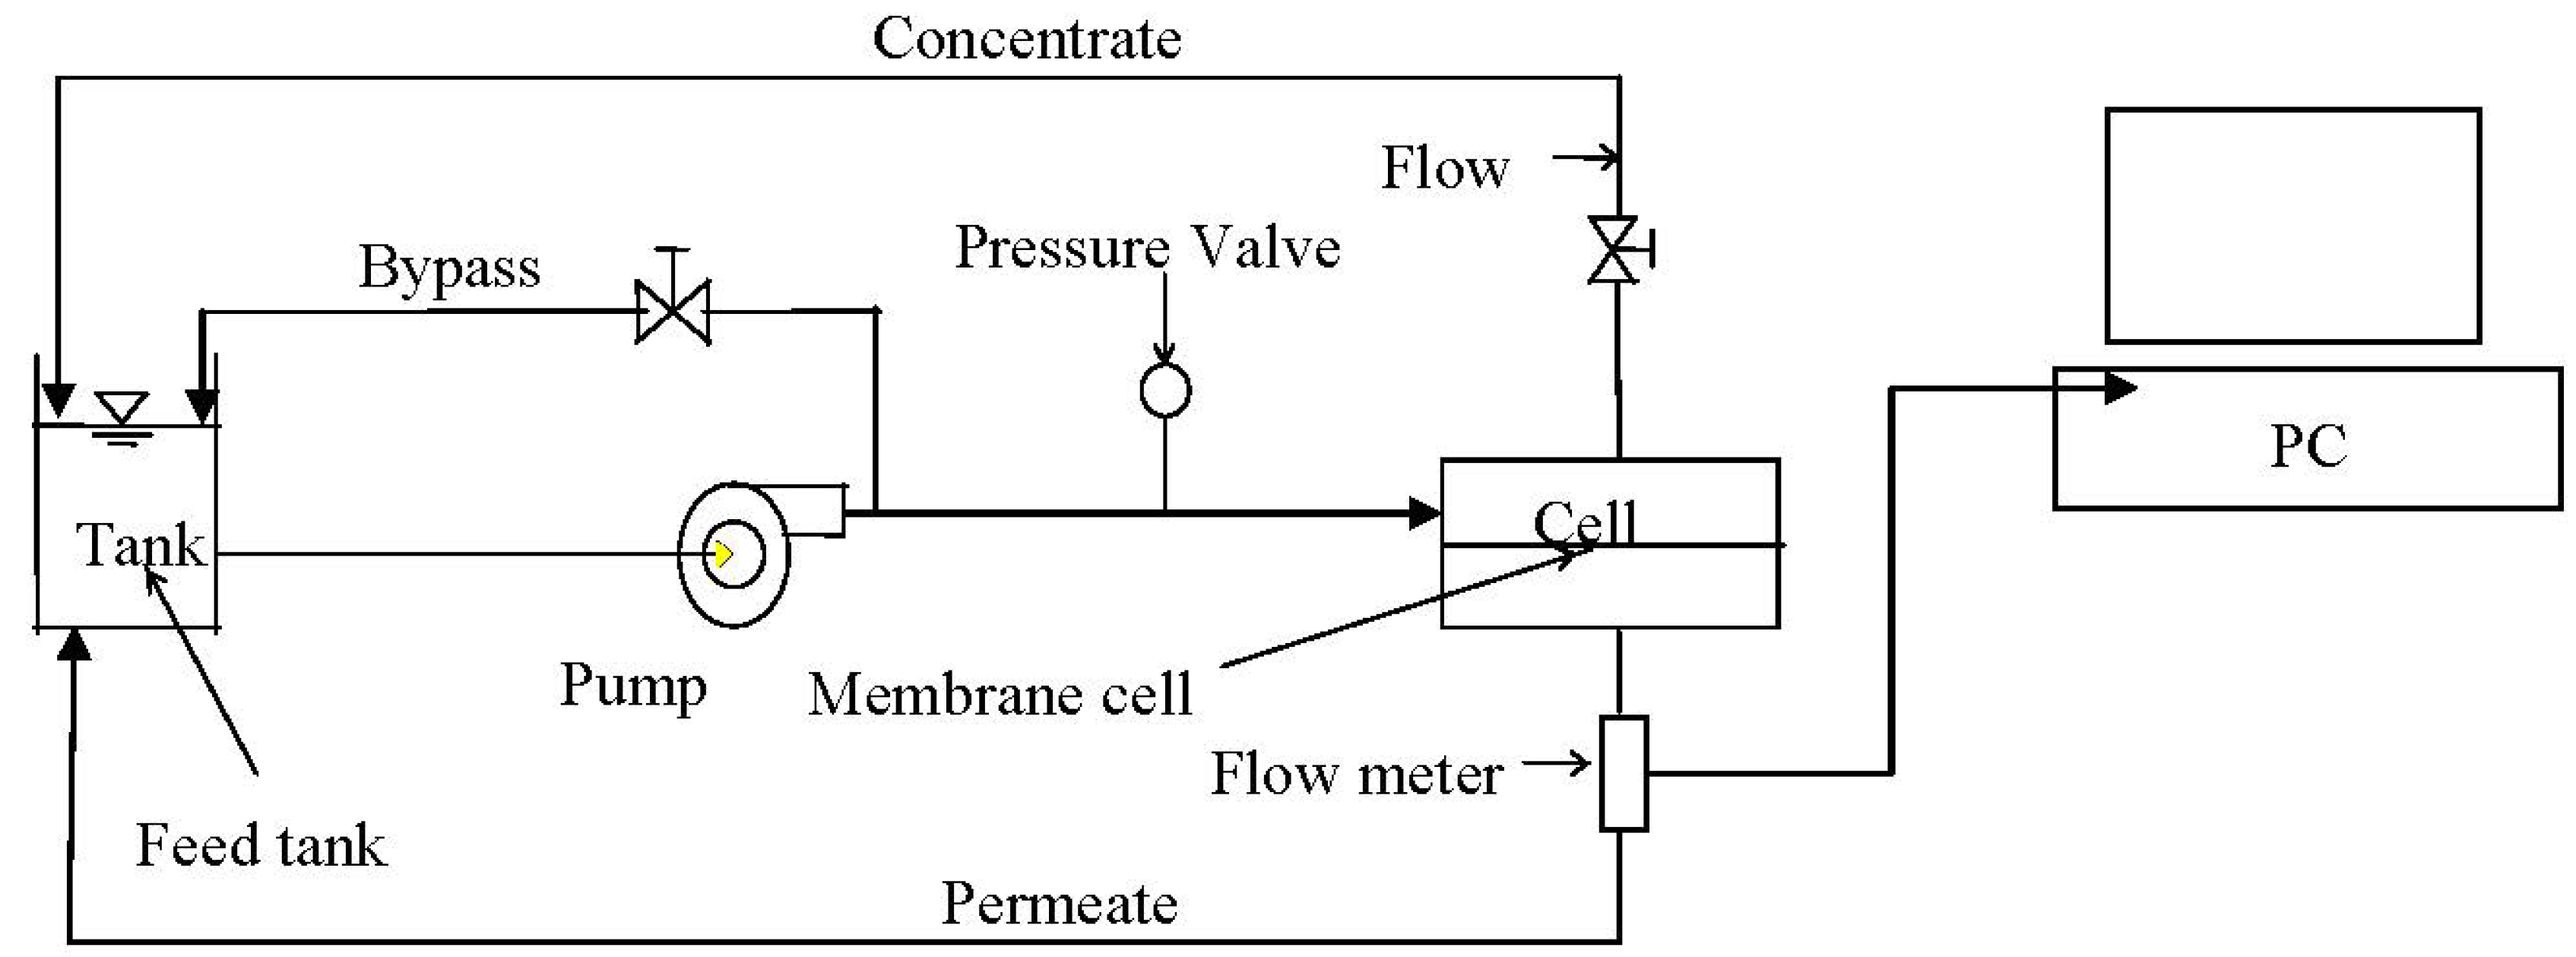
2.2. Membrane Performance Testing

2.3. Membrane Surface Properties
3. Results
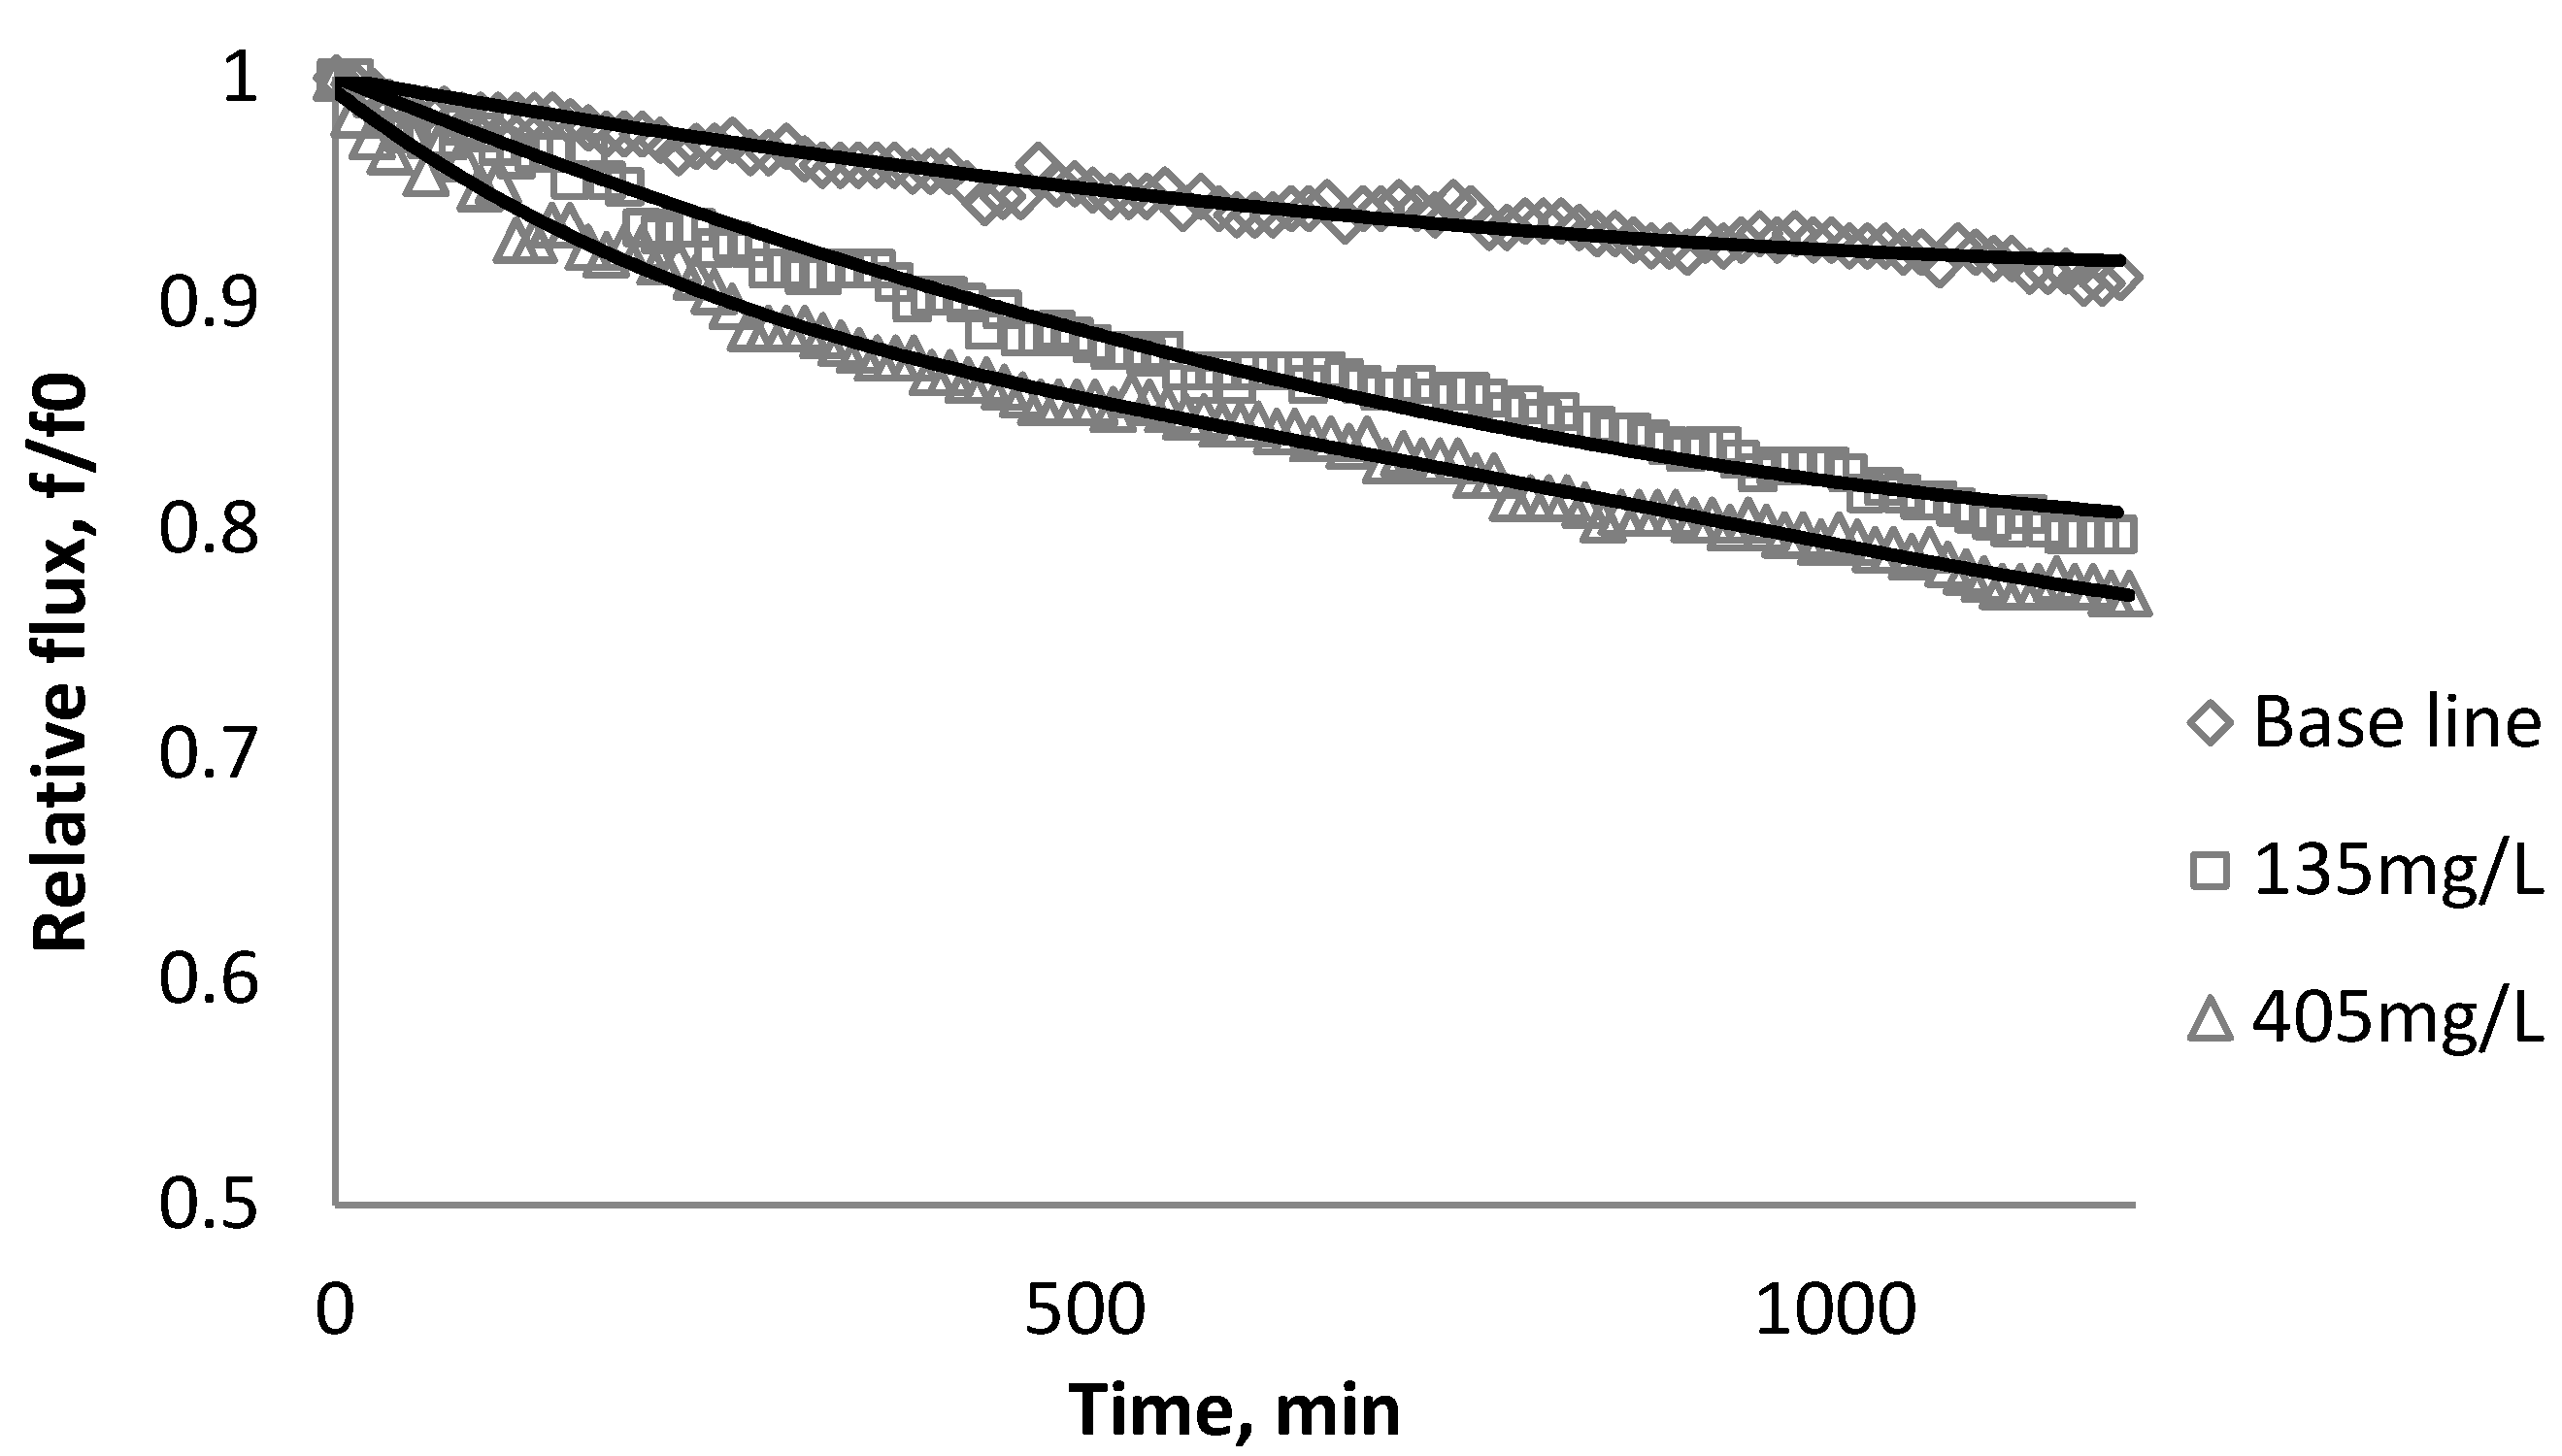
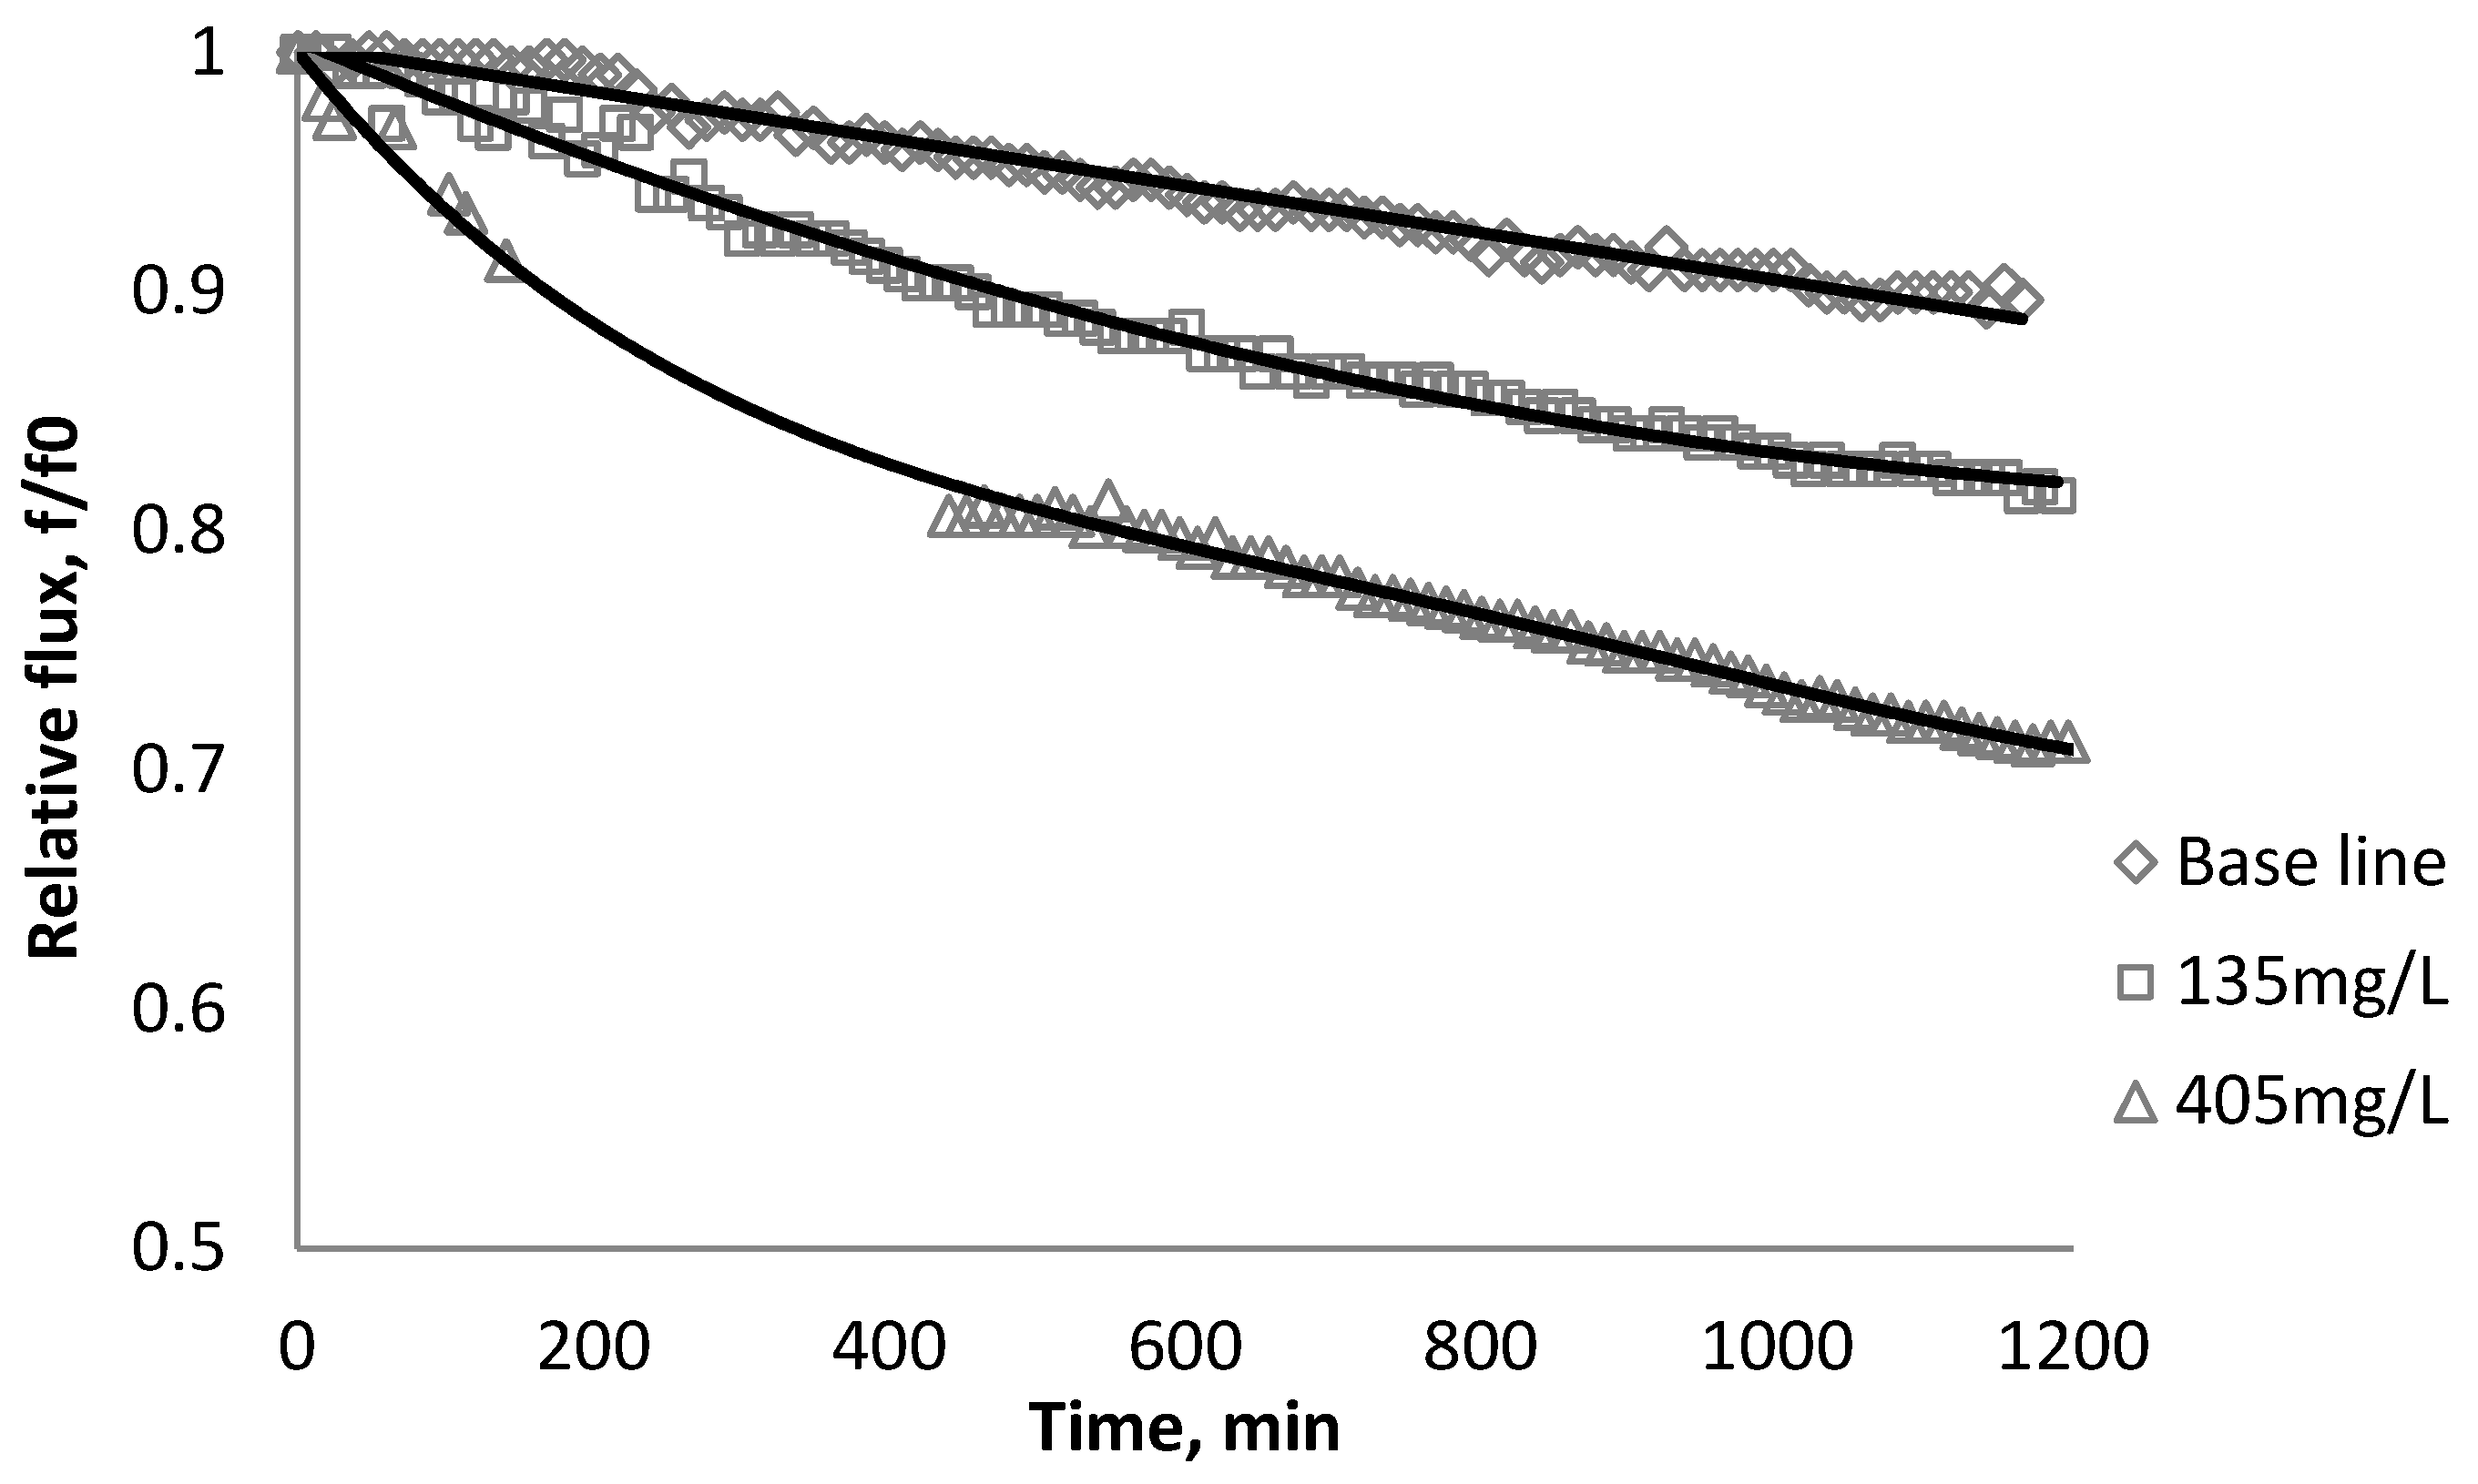
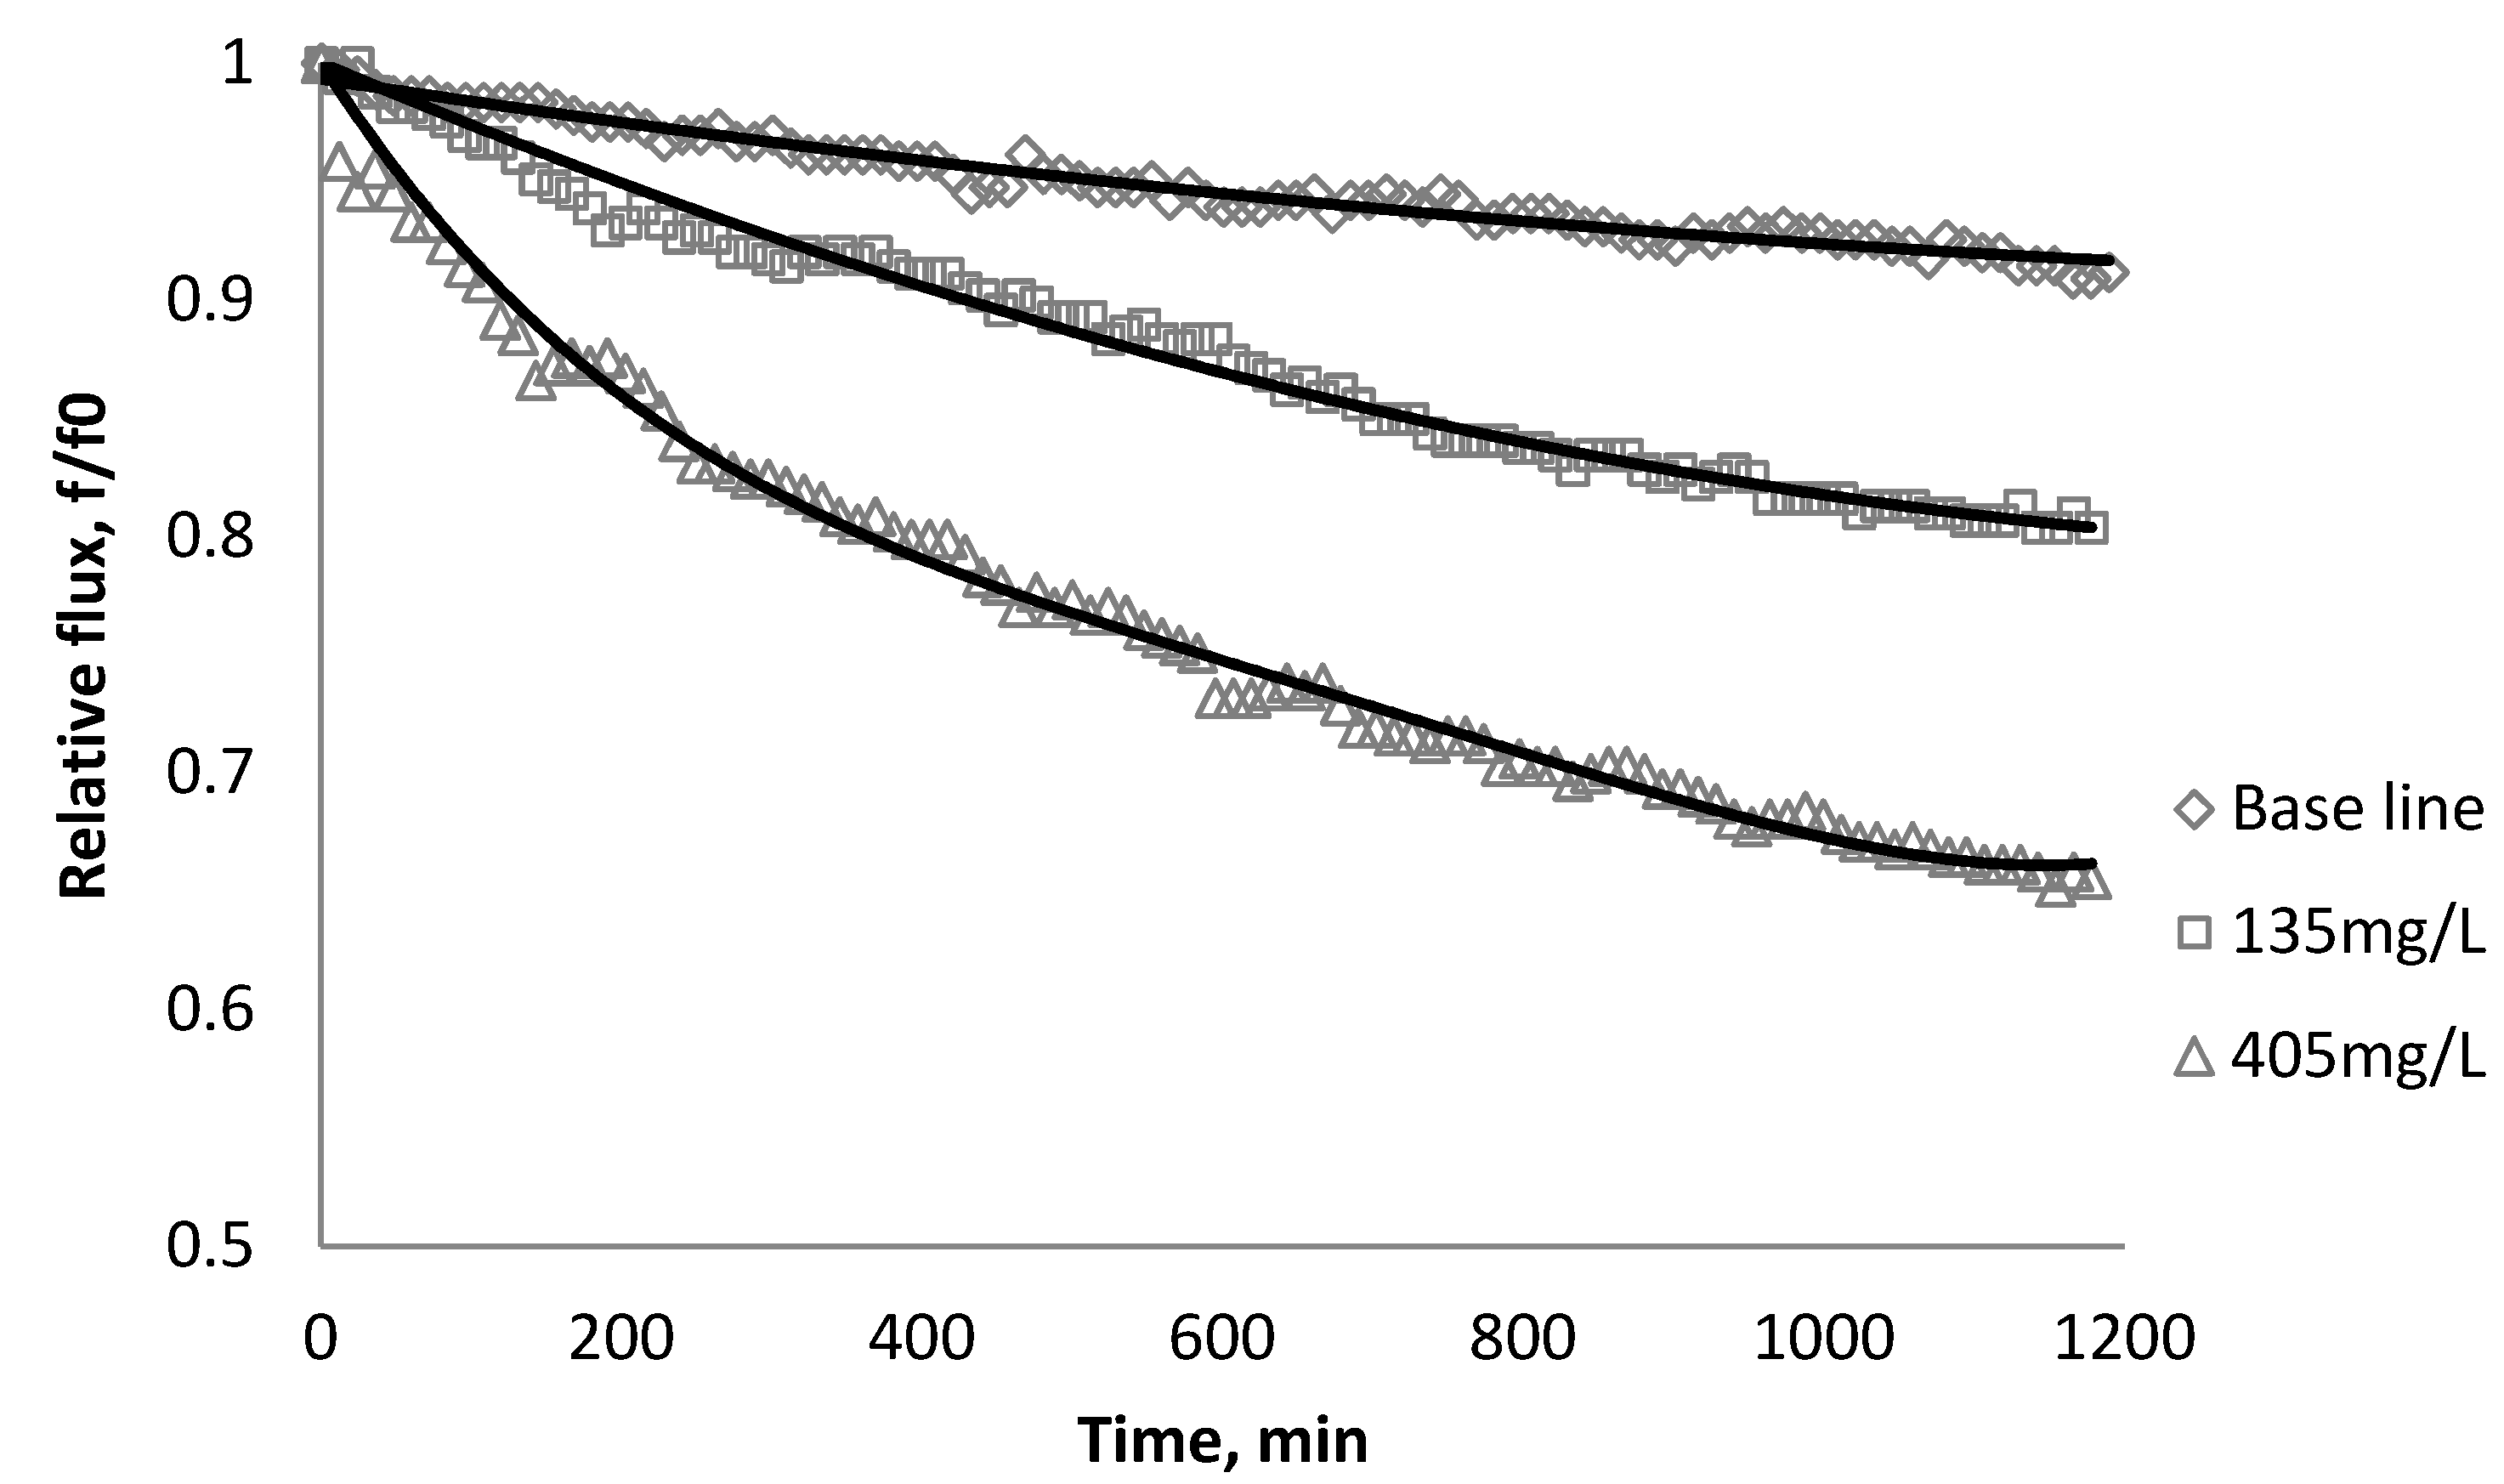
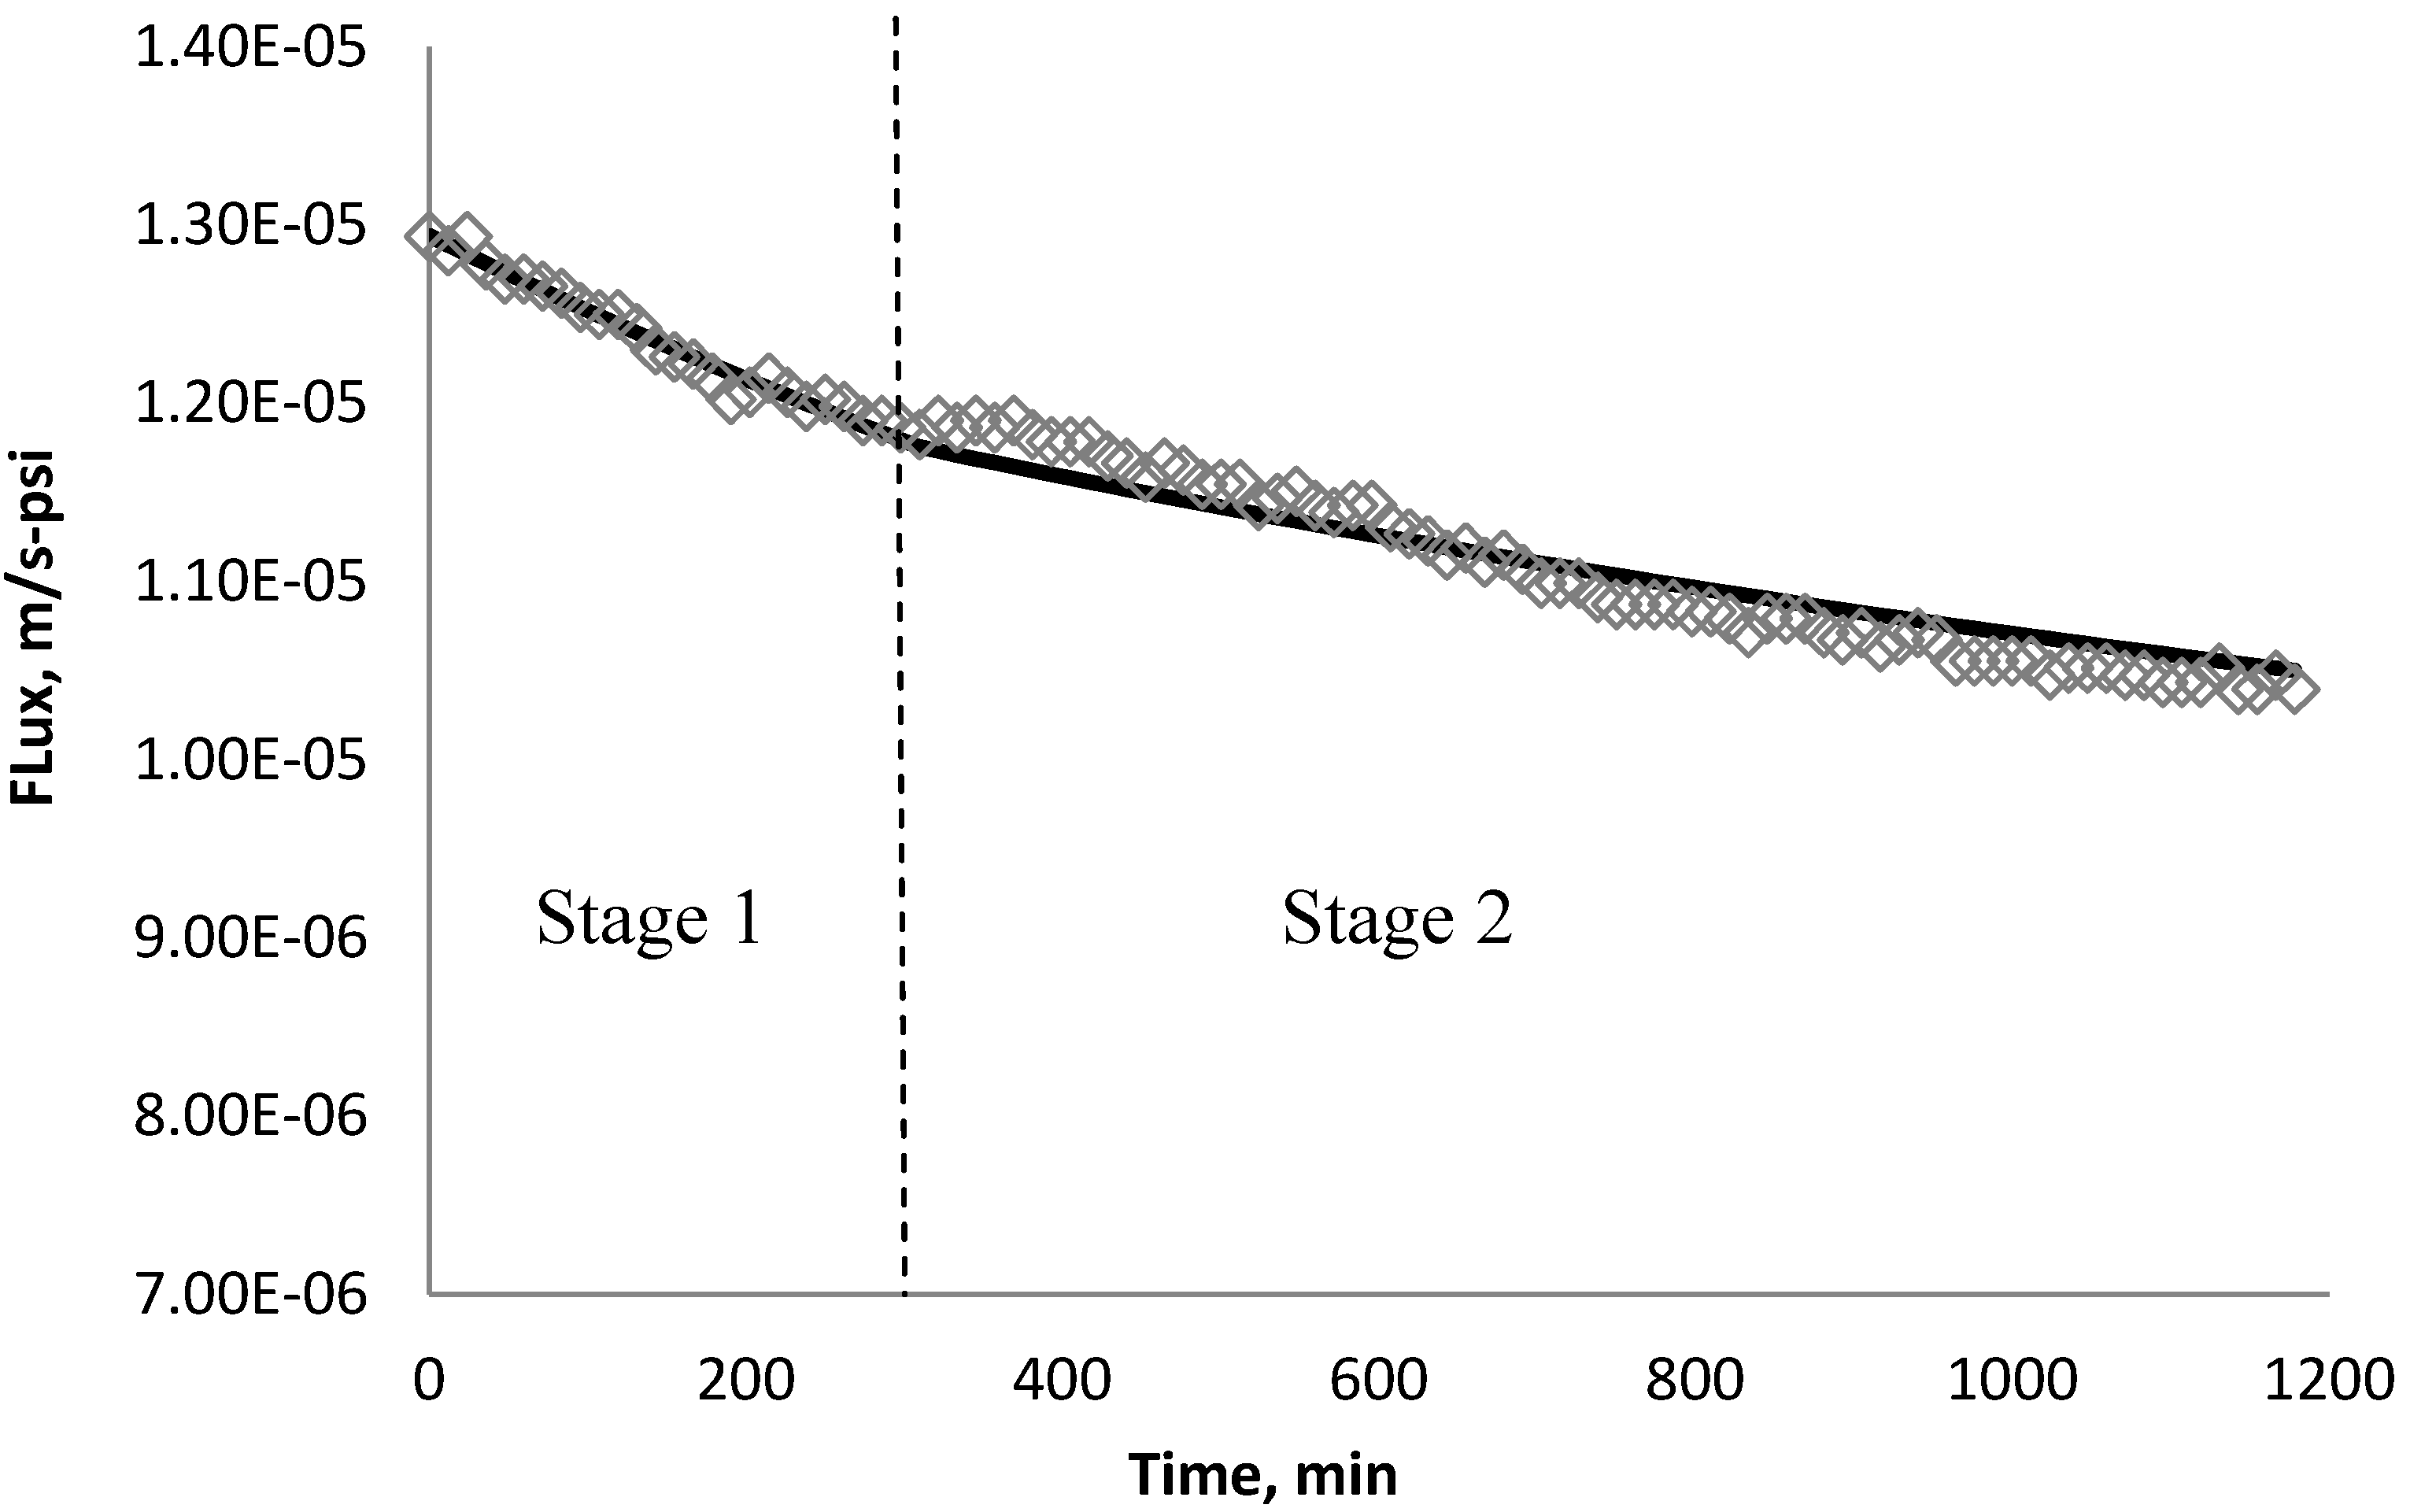
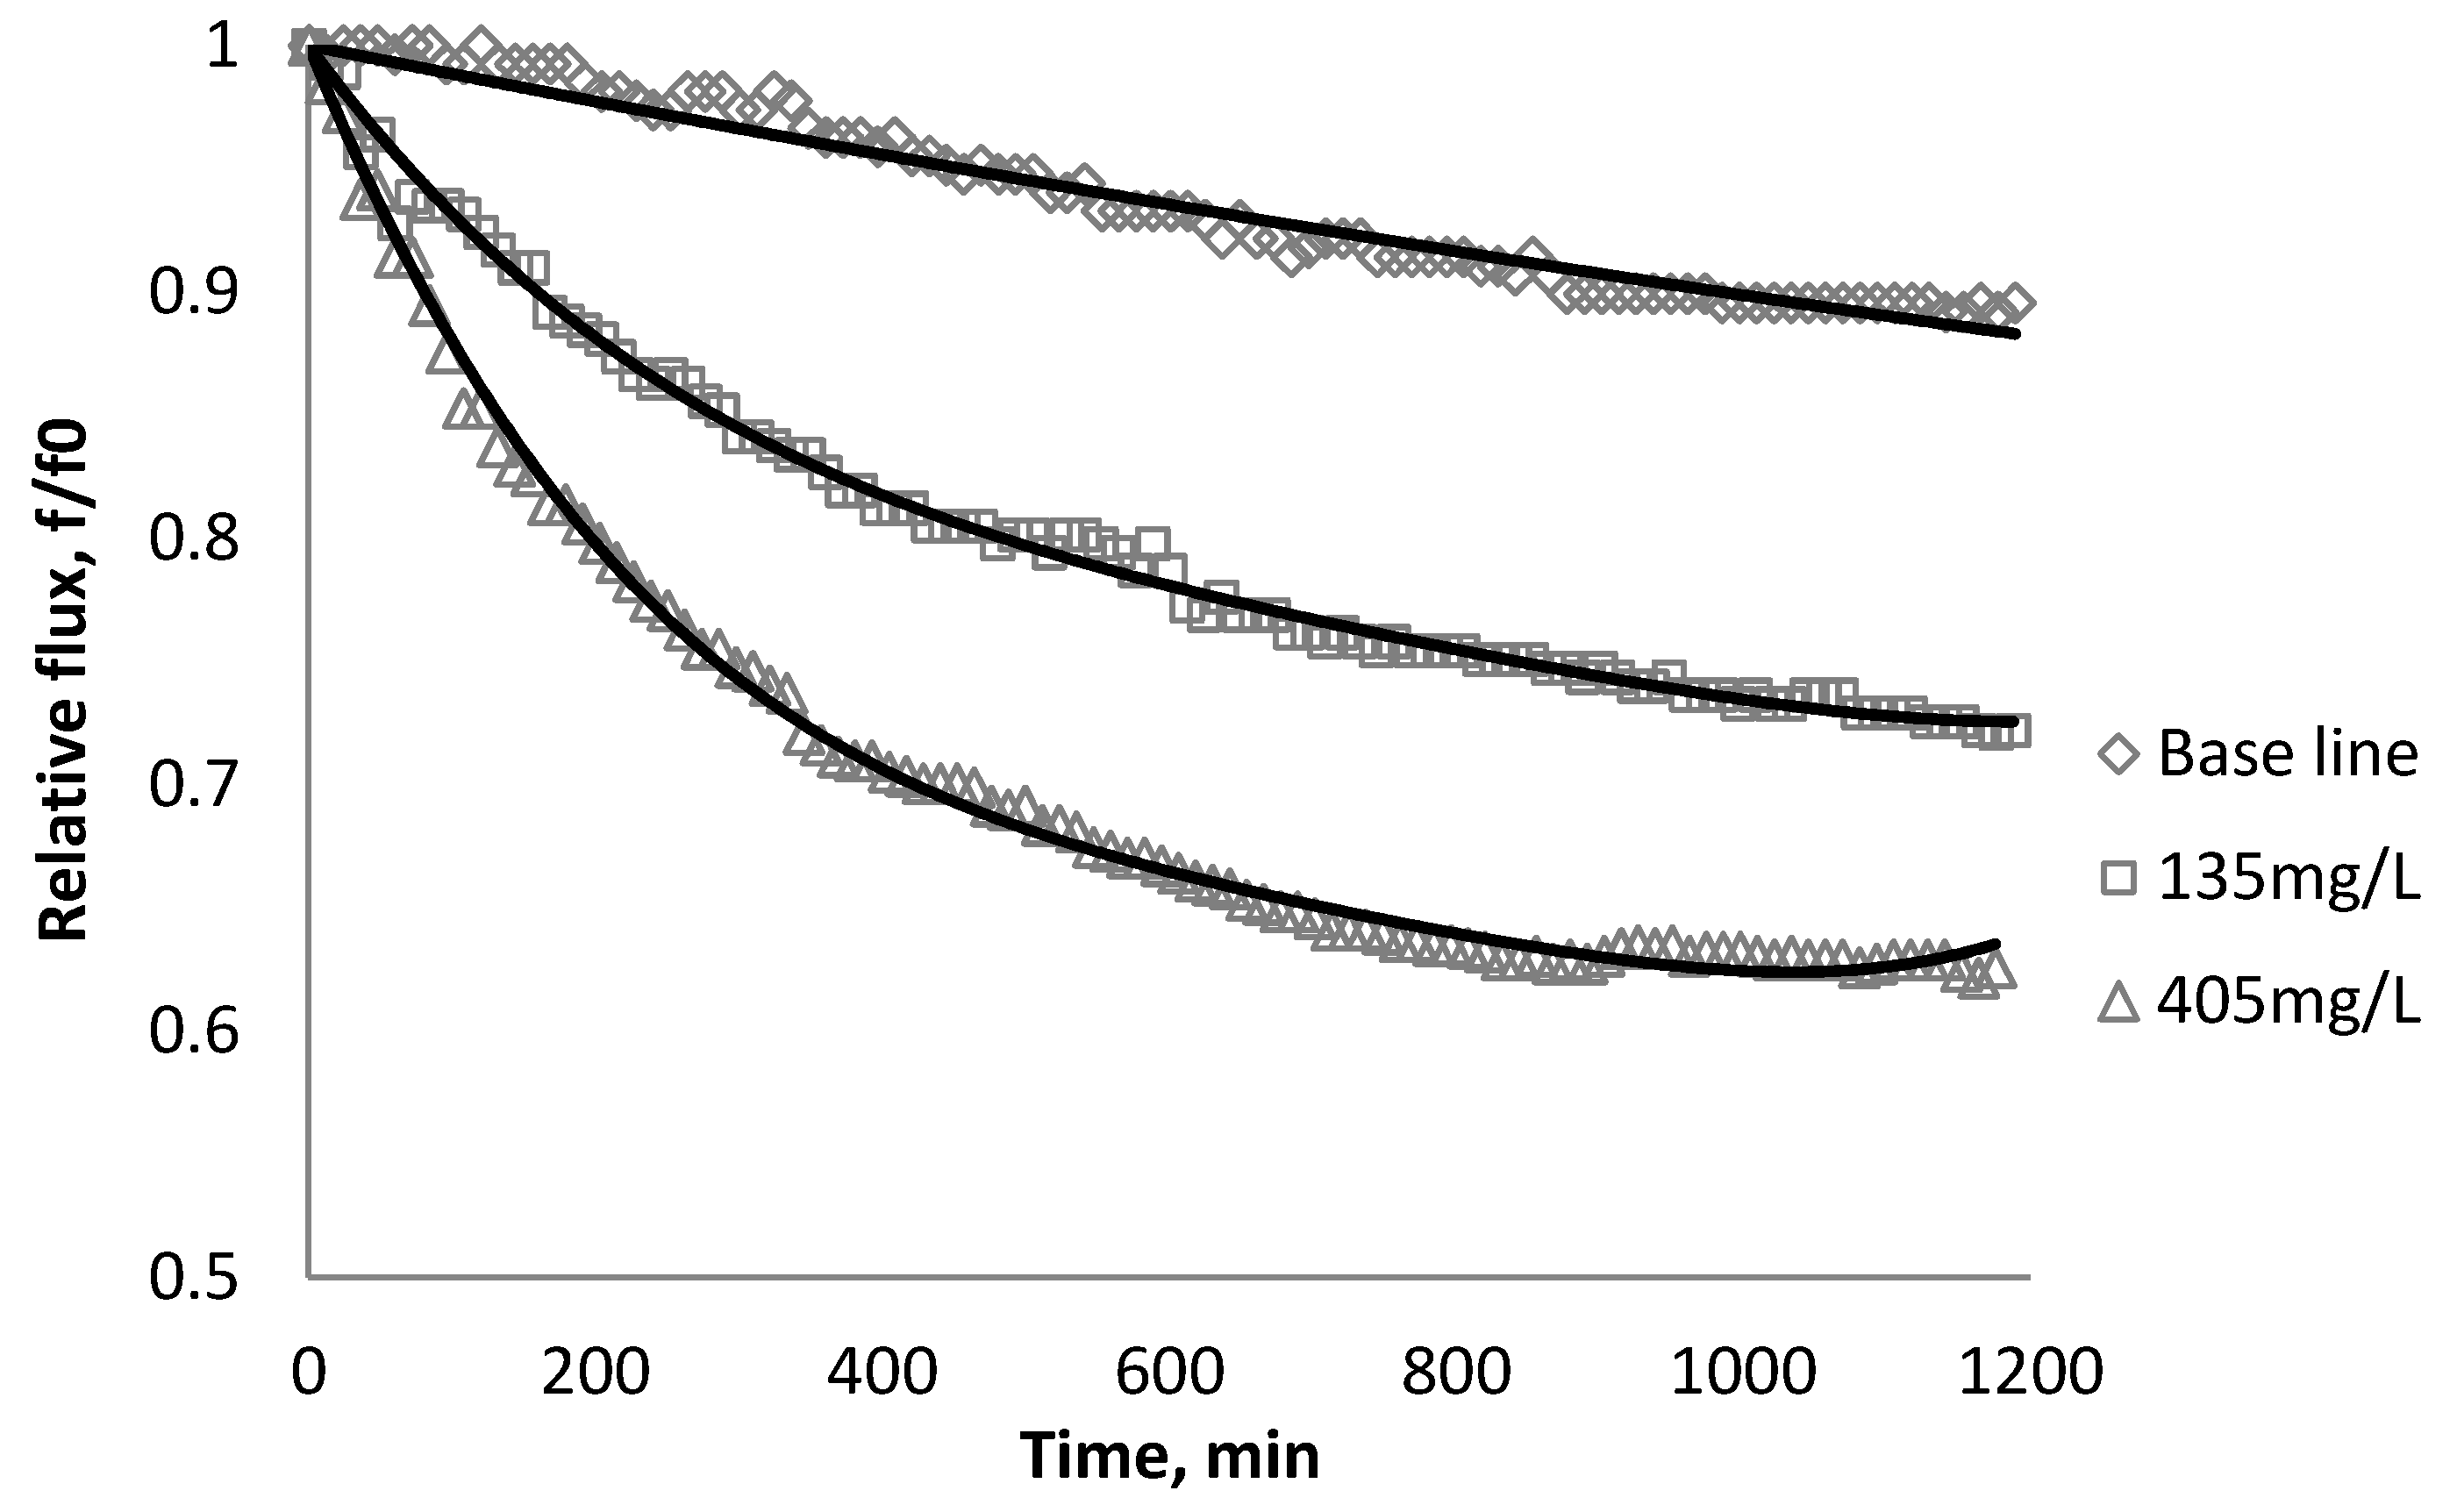
3.1. Effect of SiO2 on Flux Decline


| Initial flux | BW30 | XLE | CK |
|---|---|---|---|
| m/s | 1.31 × 10⁻⁵ | 1.00 × 10⁻⁵ | 6.54 × 10⁻⁶ |
| gal/sfd | 27.78 | 21.20 | 13.87 |
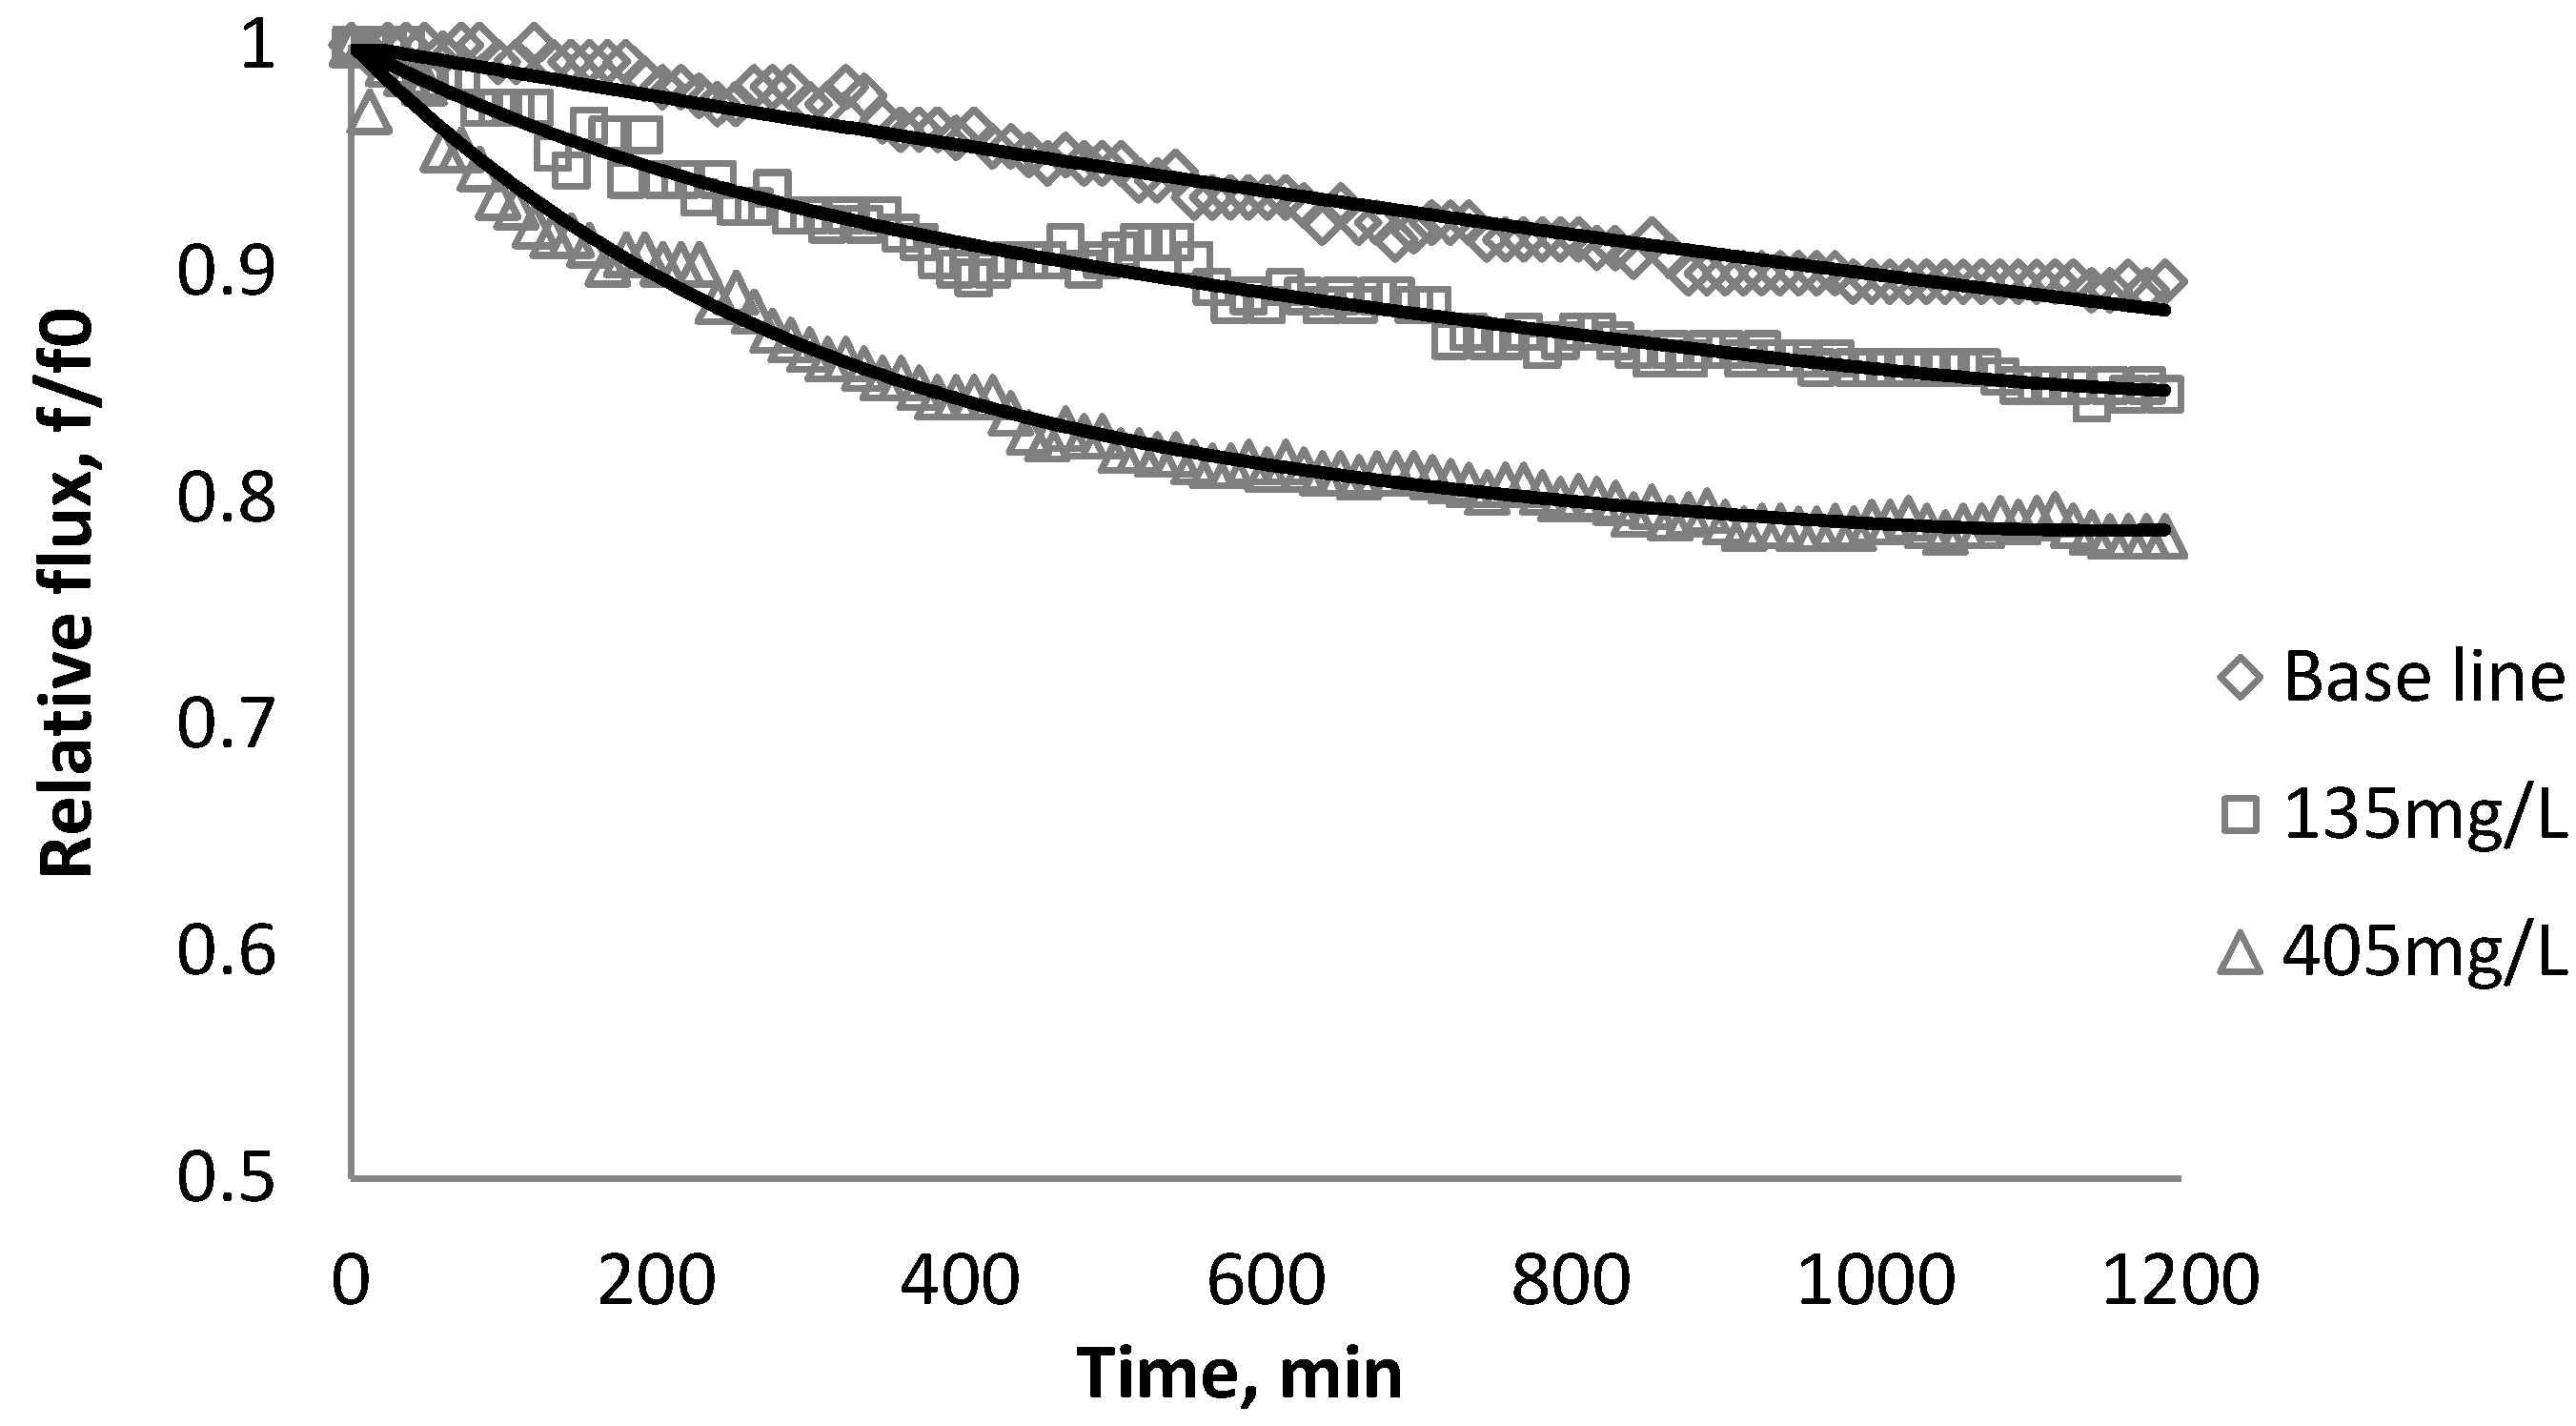
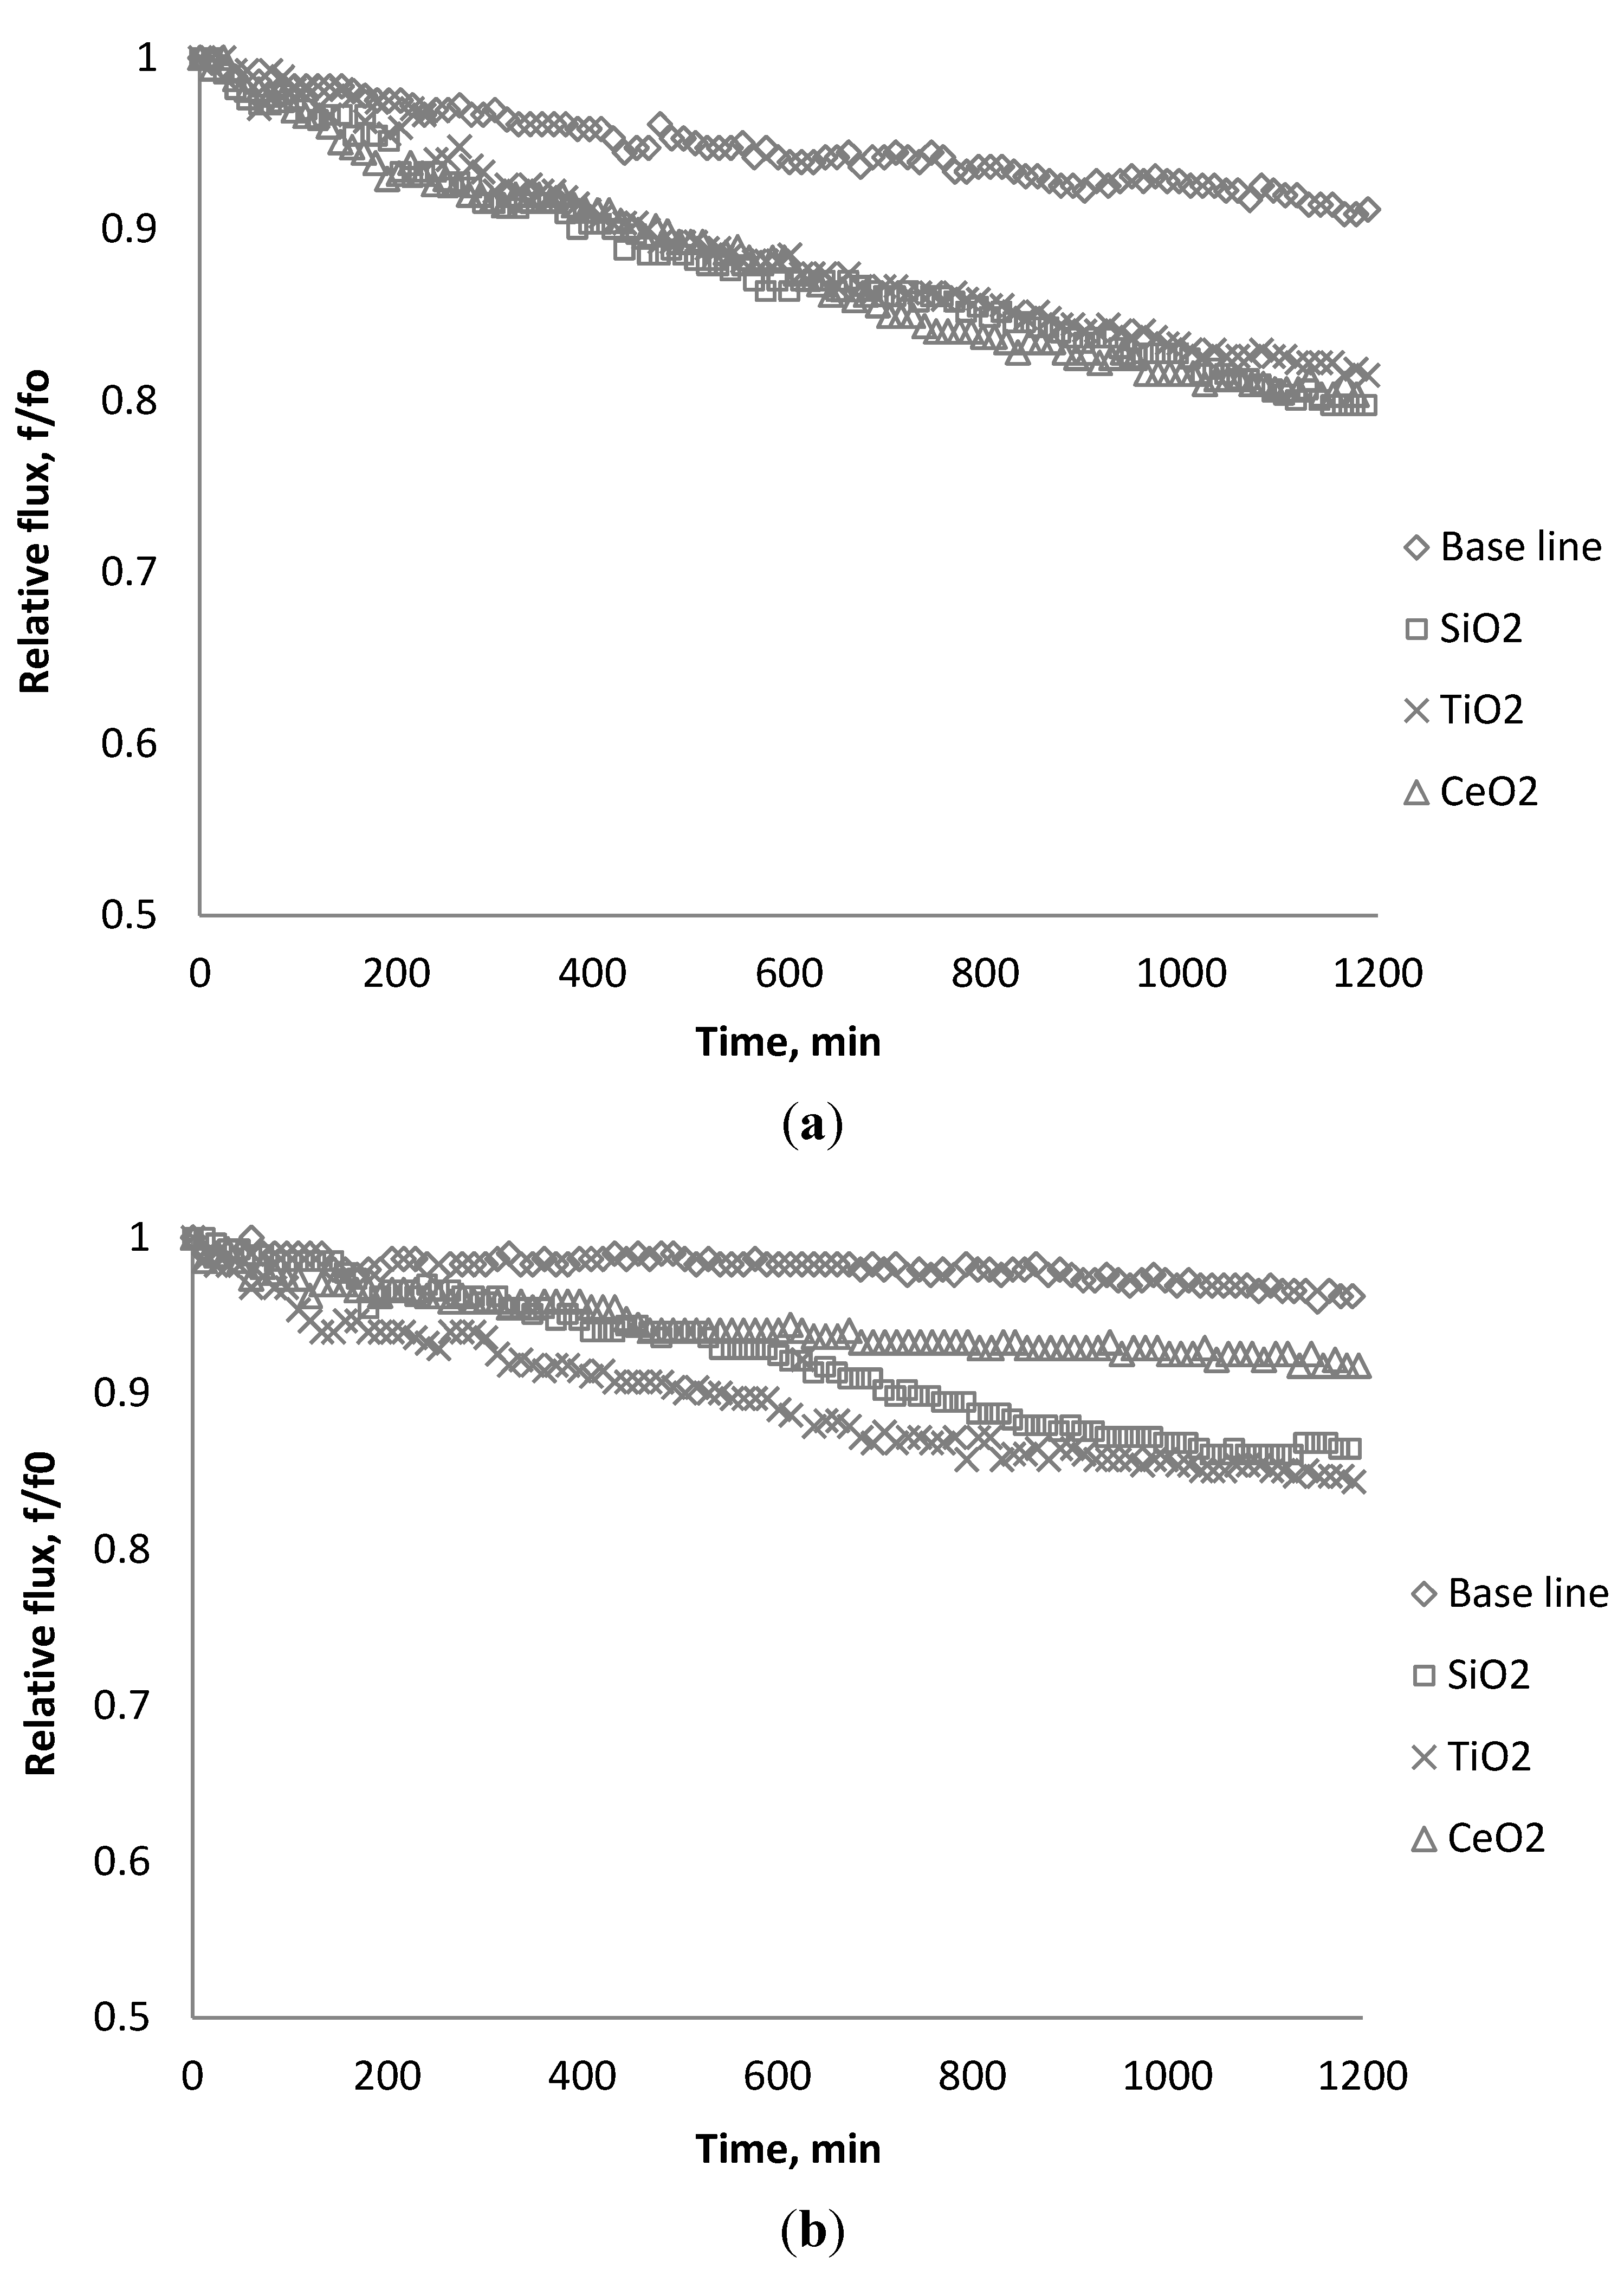
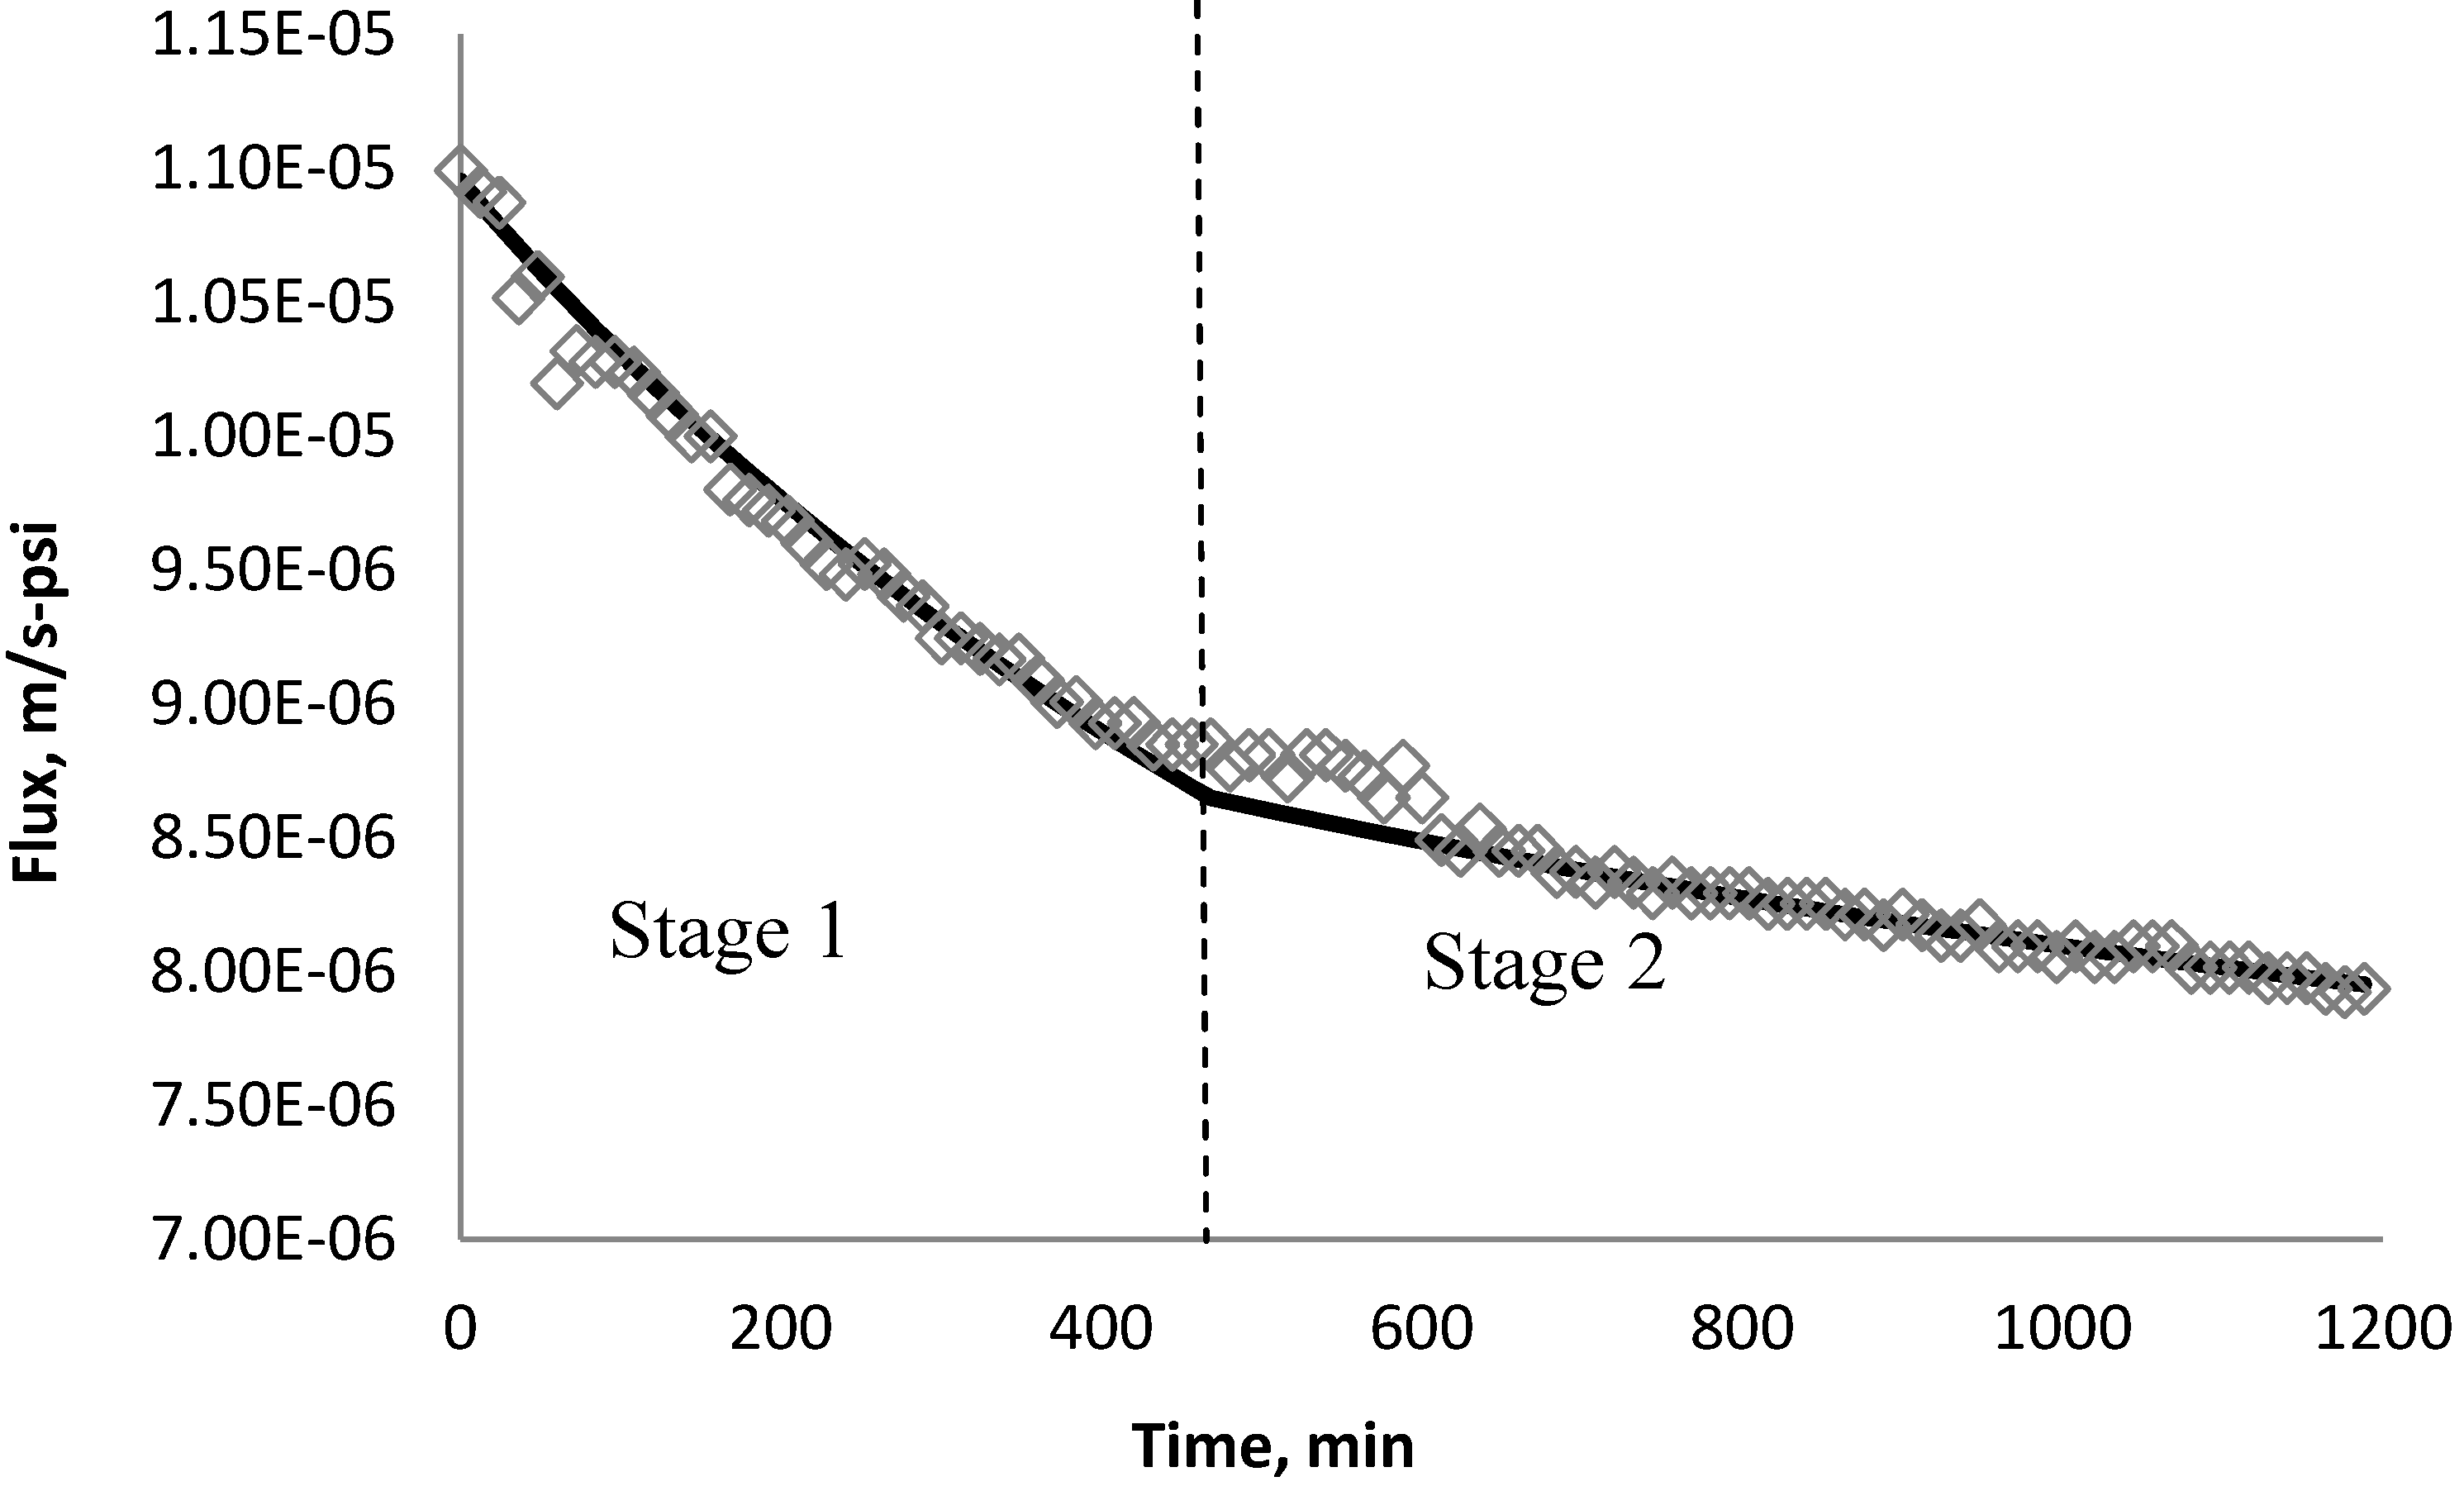
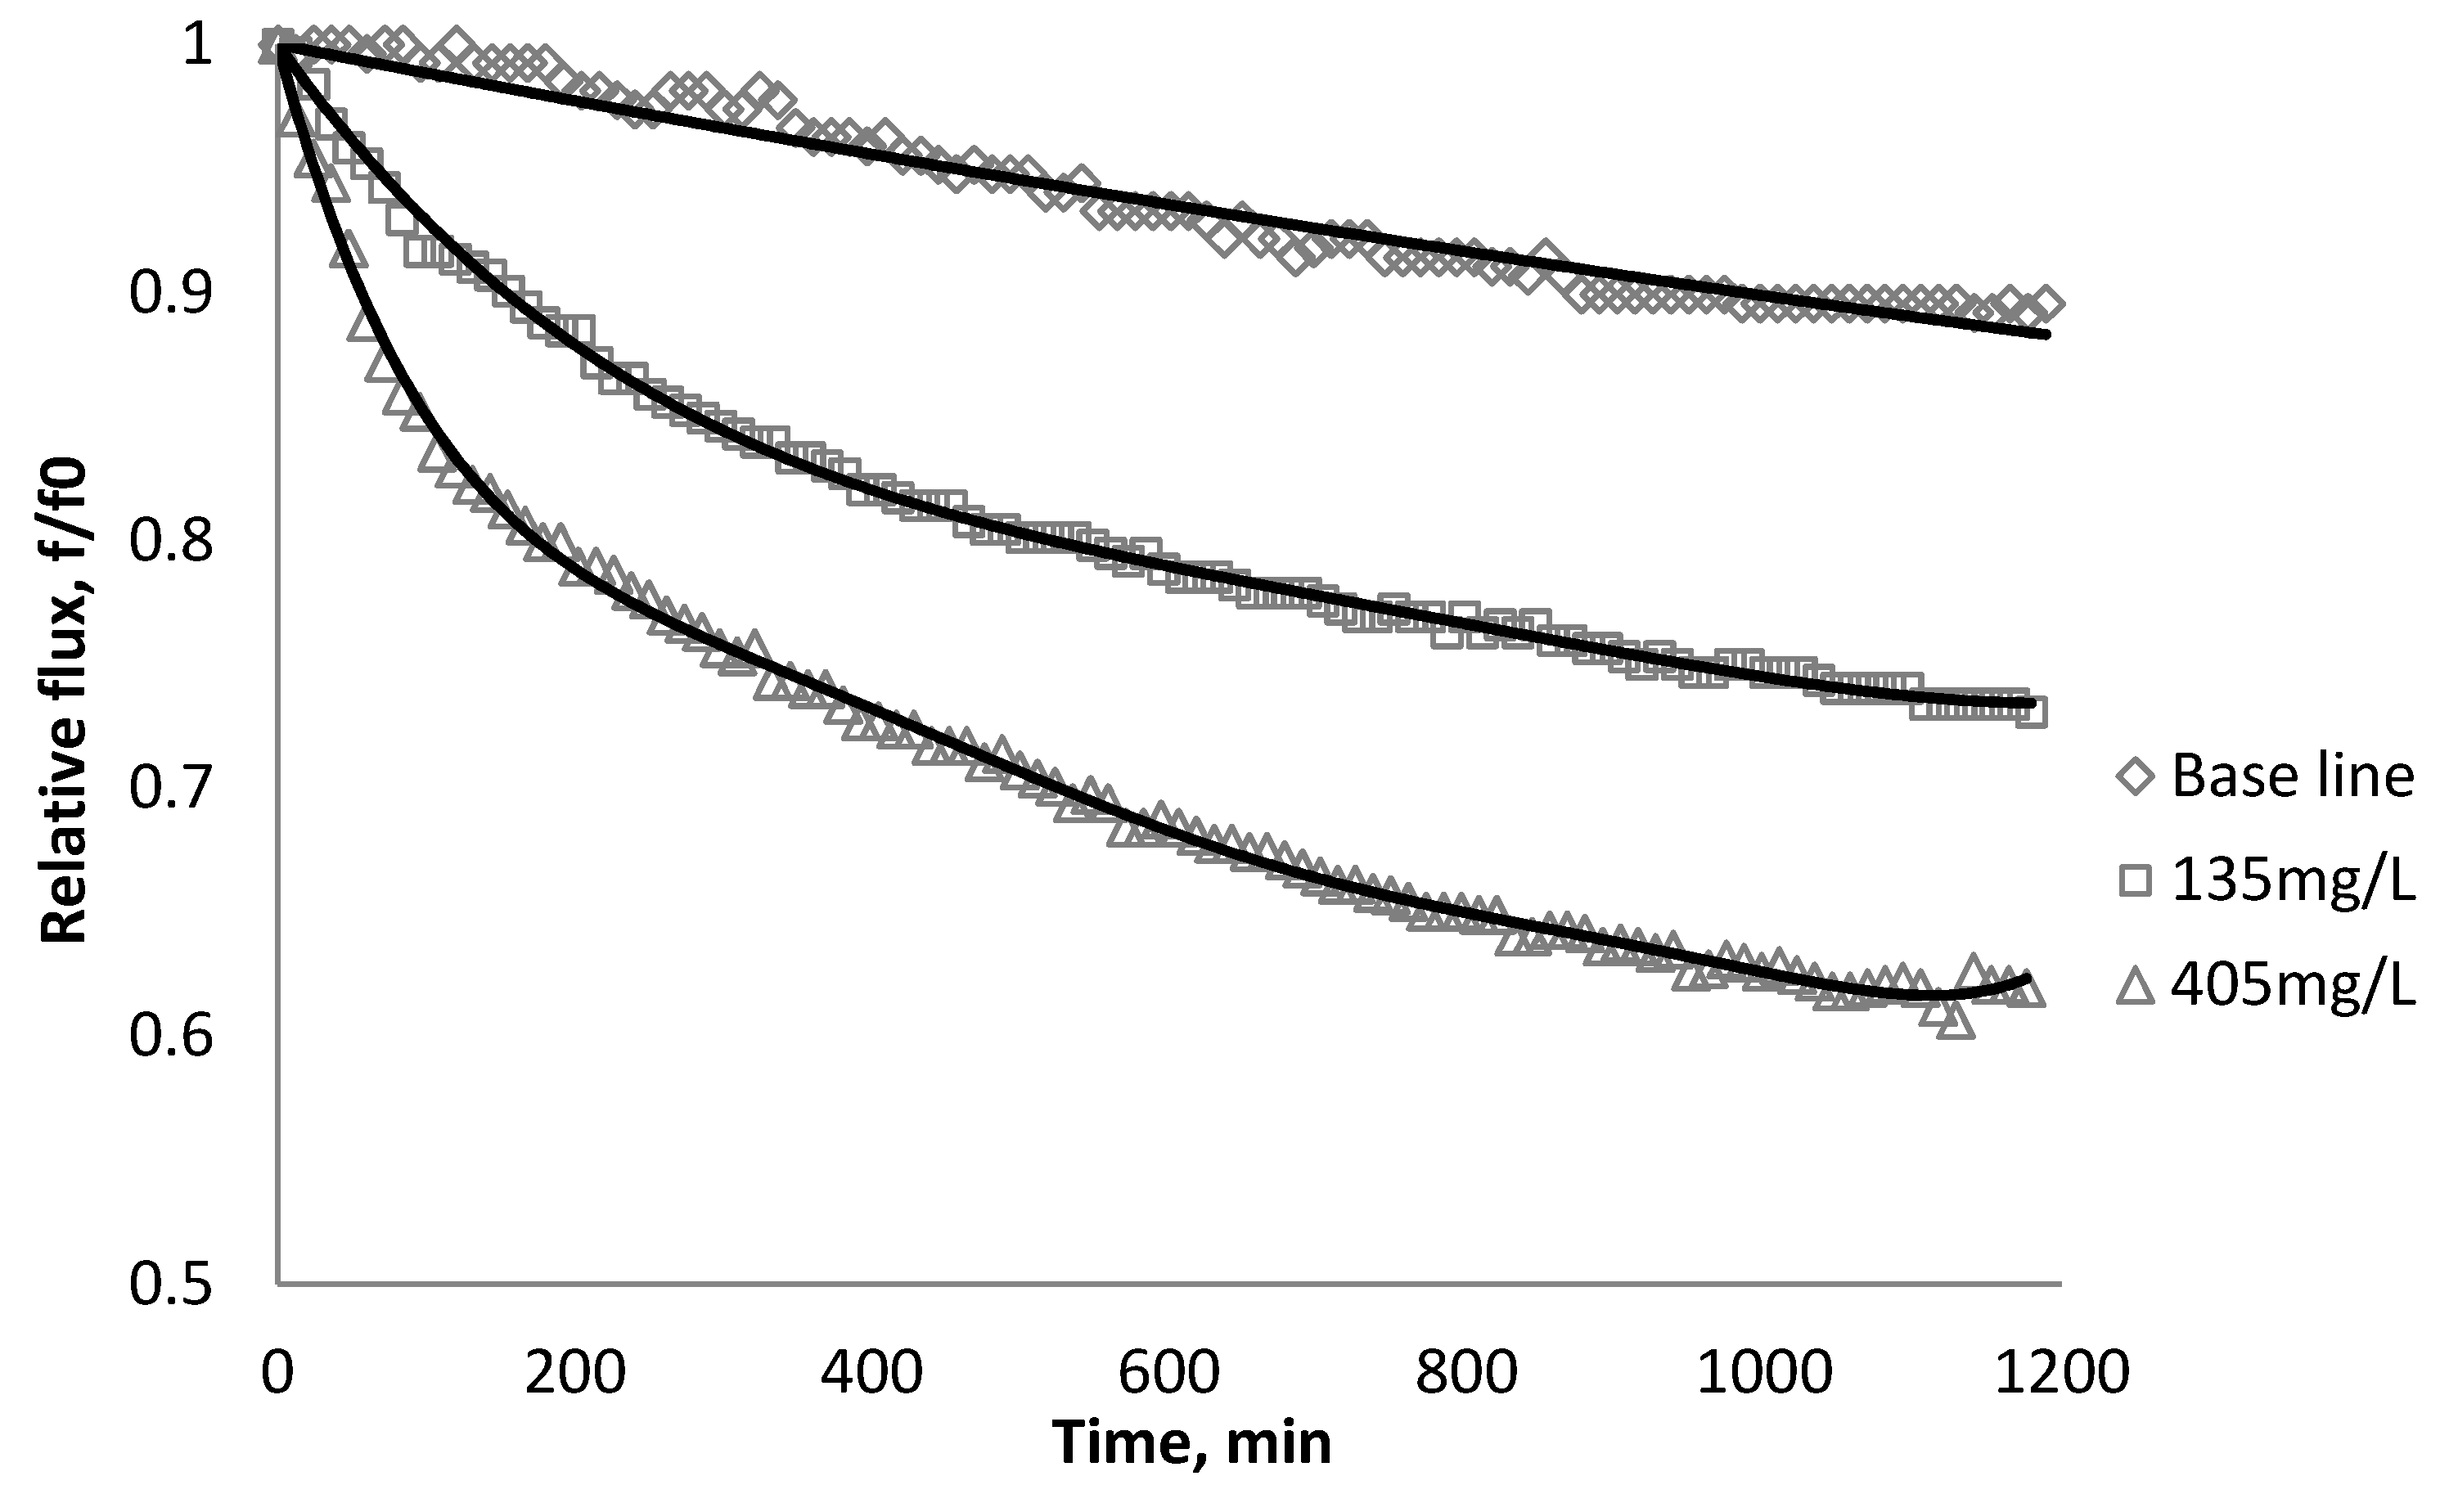
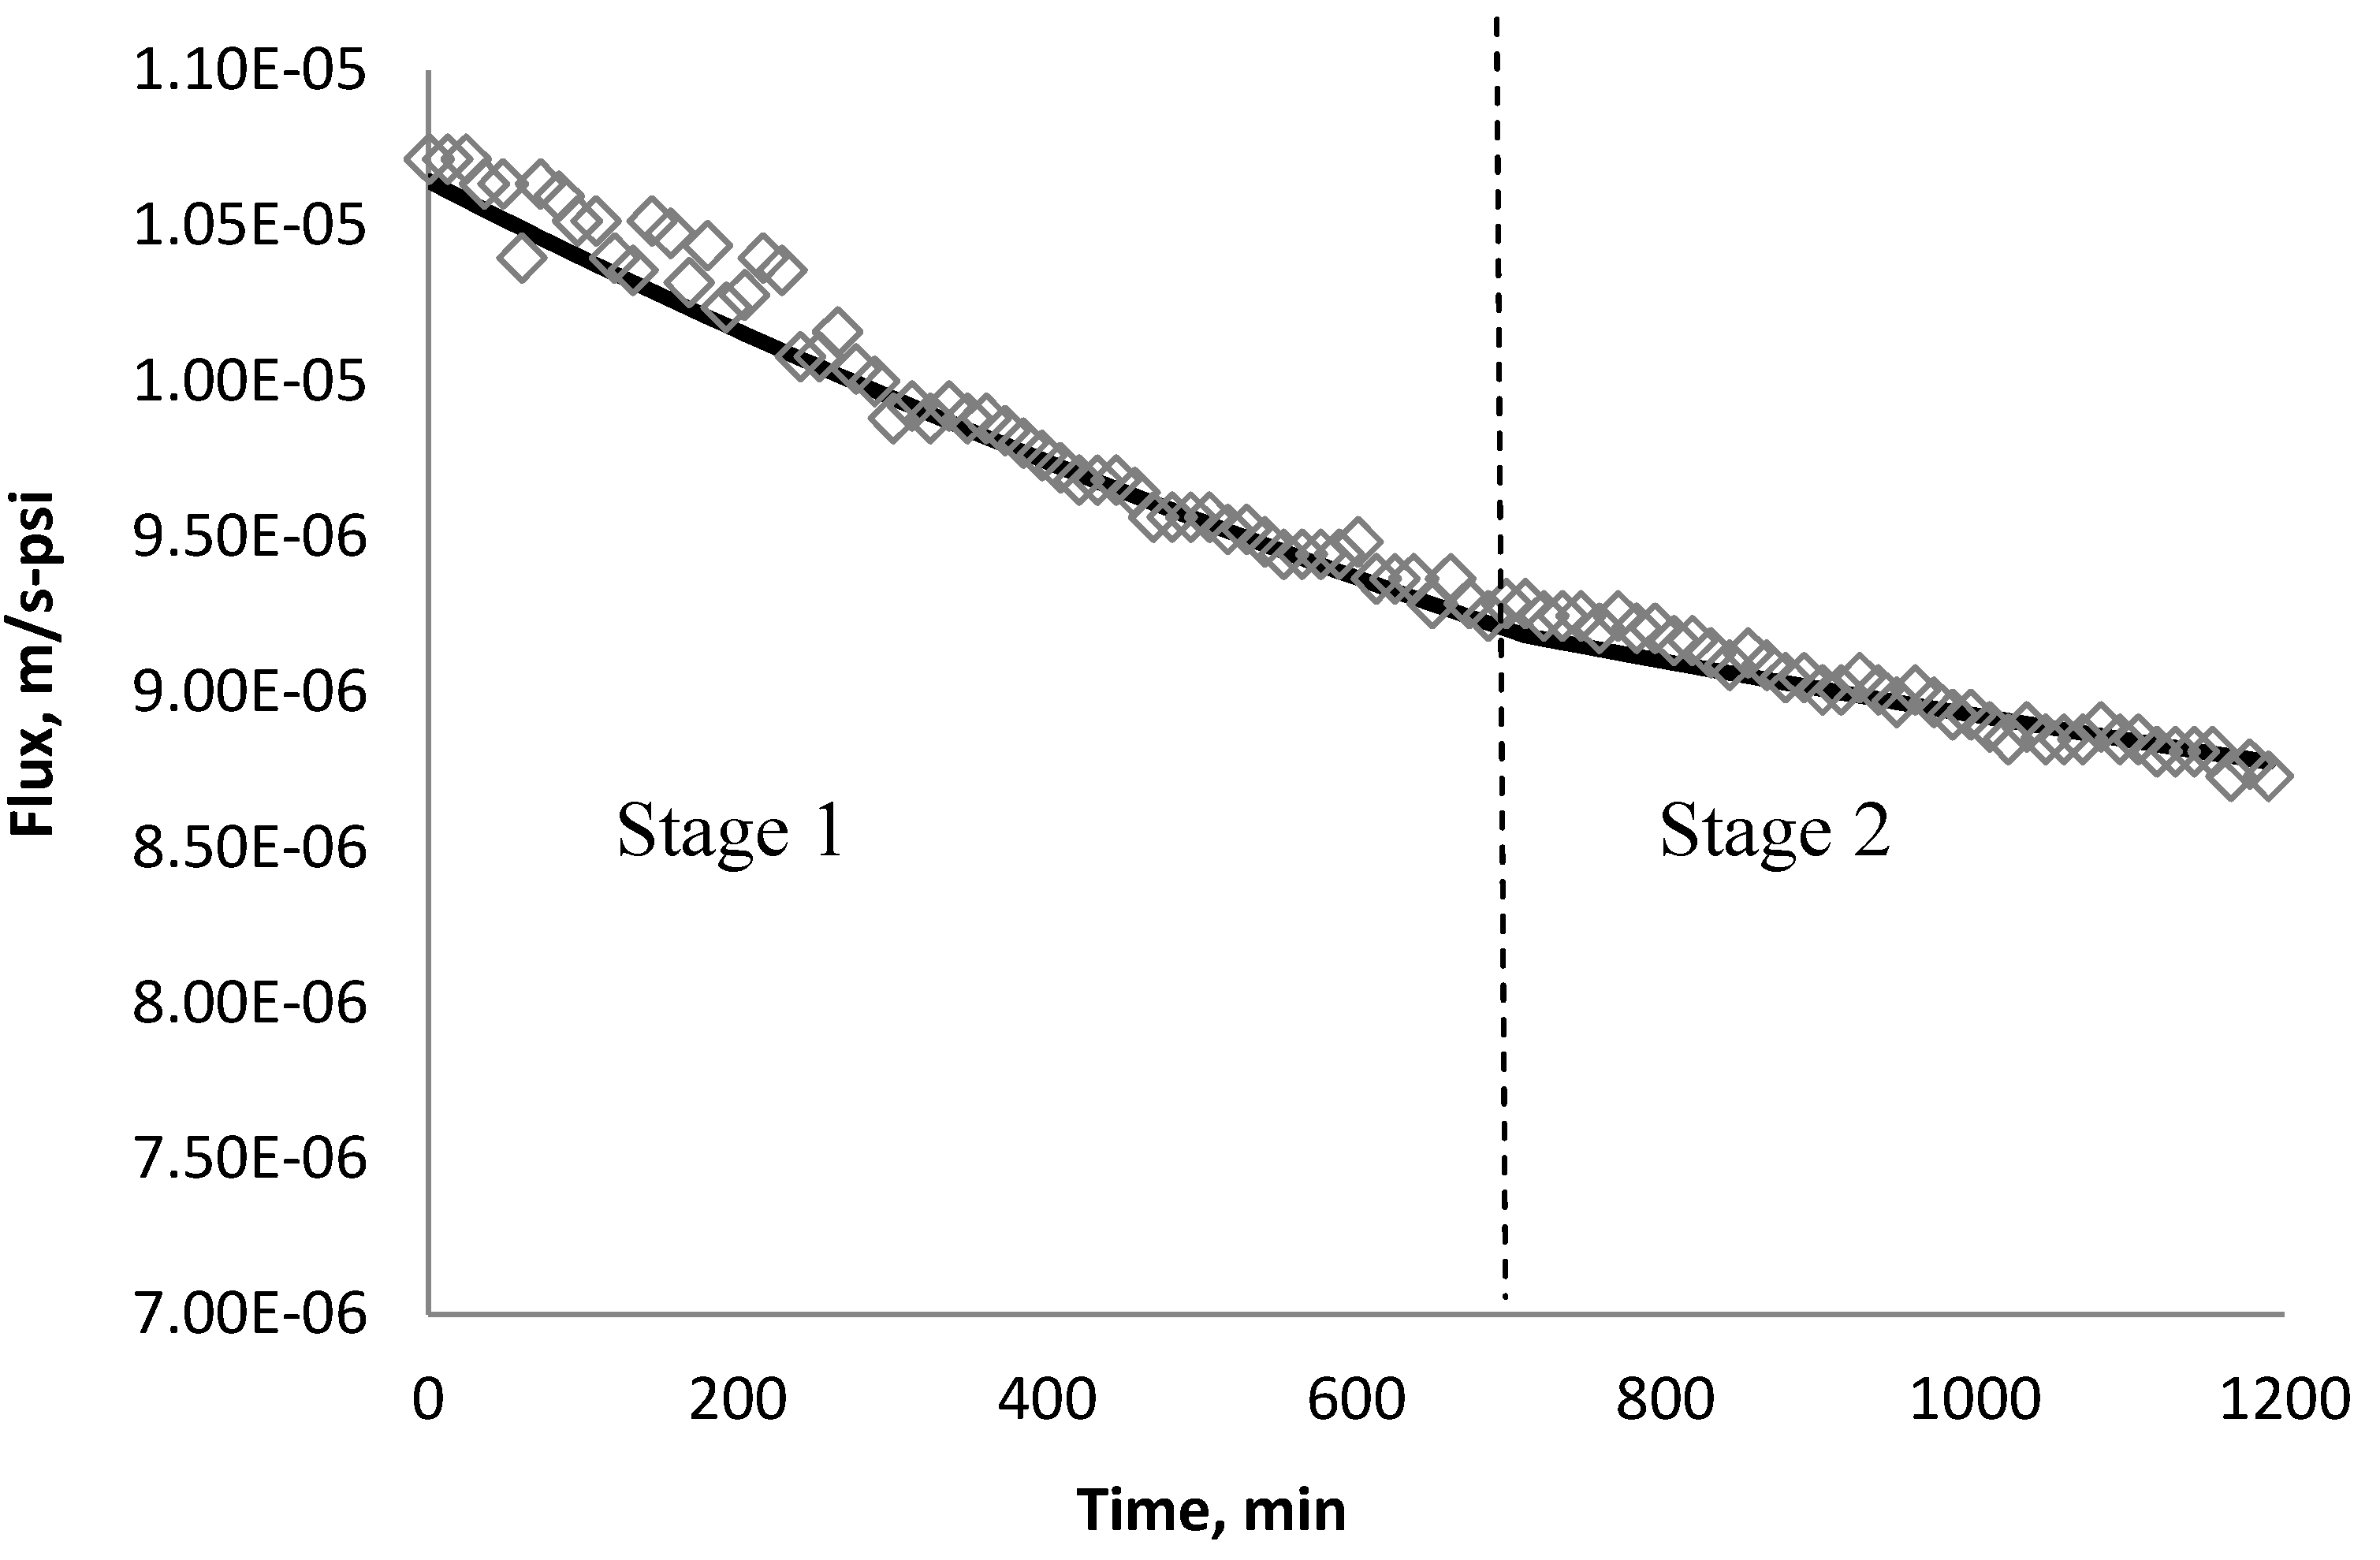
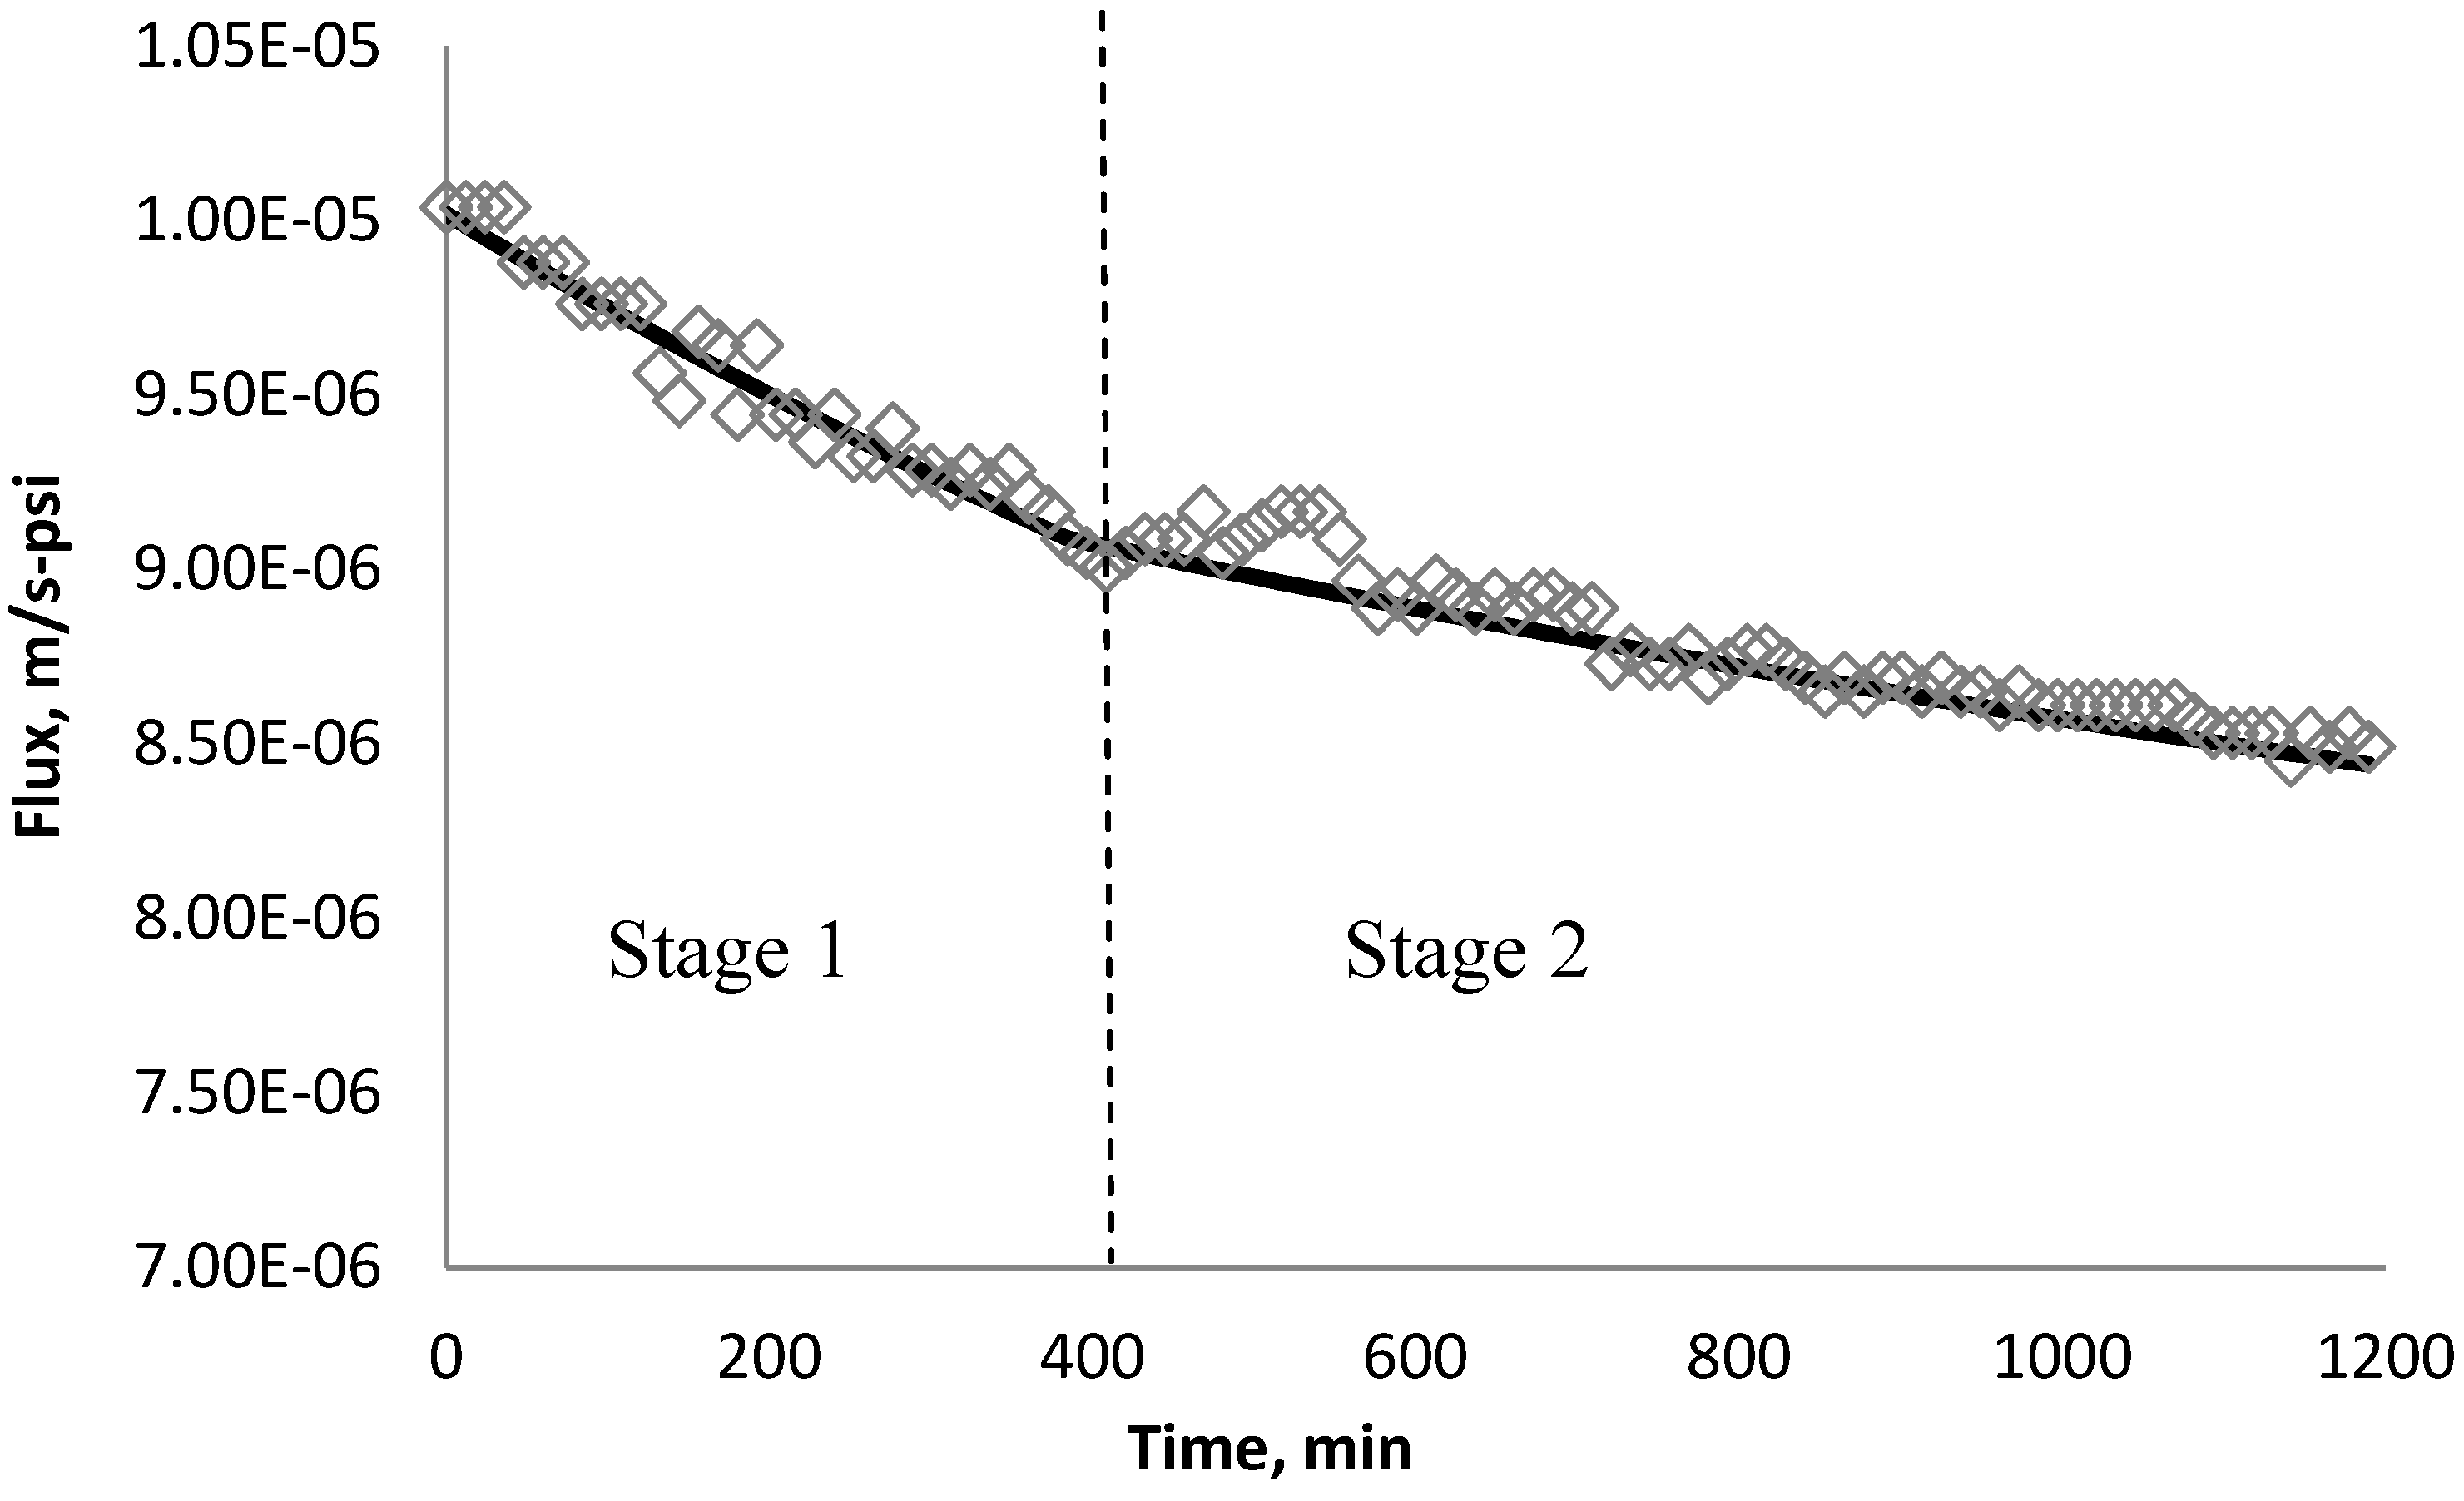
3.2. Effect of TiO2 on Flux Decline


| Initial flux | BW30 | XLE | CK |
|---|---|---|---|
| m/s | 1.07 × 10⁻⁵ | 1.10 × 10⁻⁵ | 6.59 × 10⁻⁶ |
| gal/sfd | 22.69 | 23.33 | 13.98 |
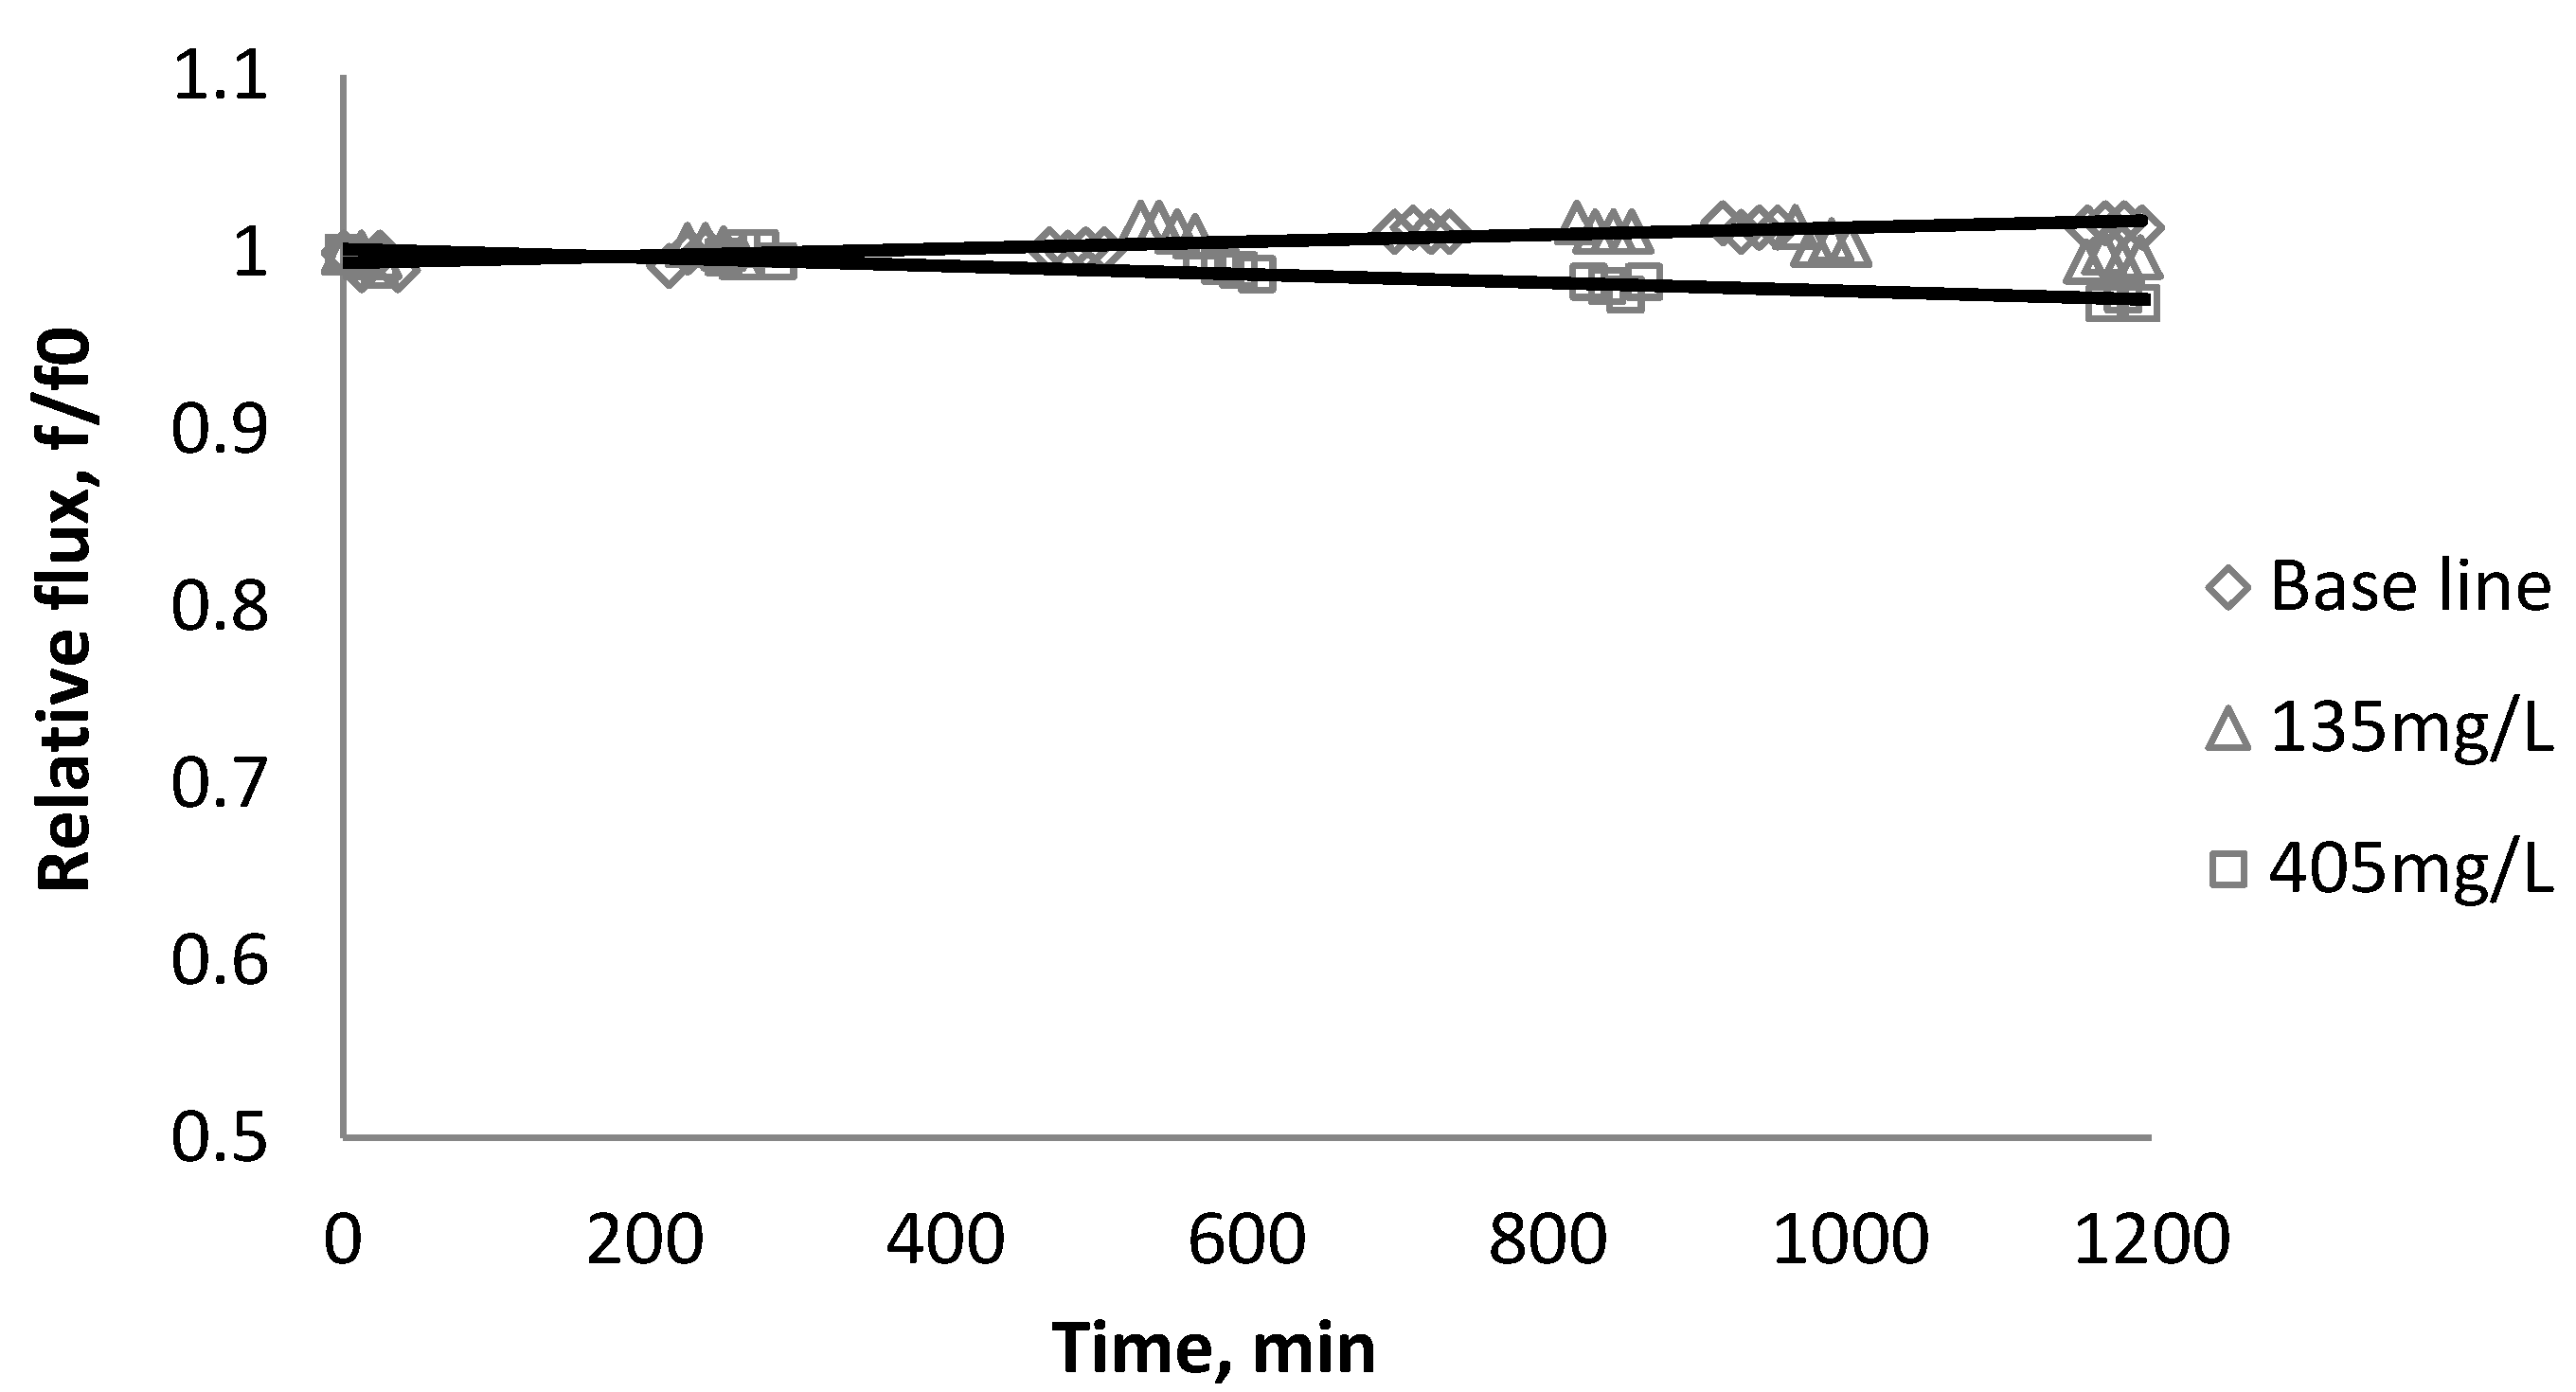
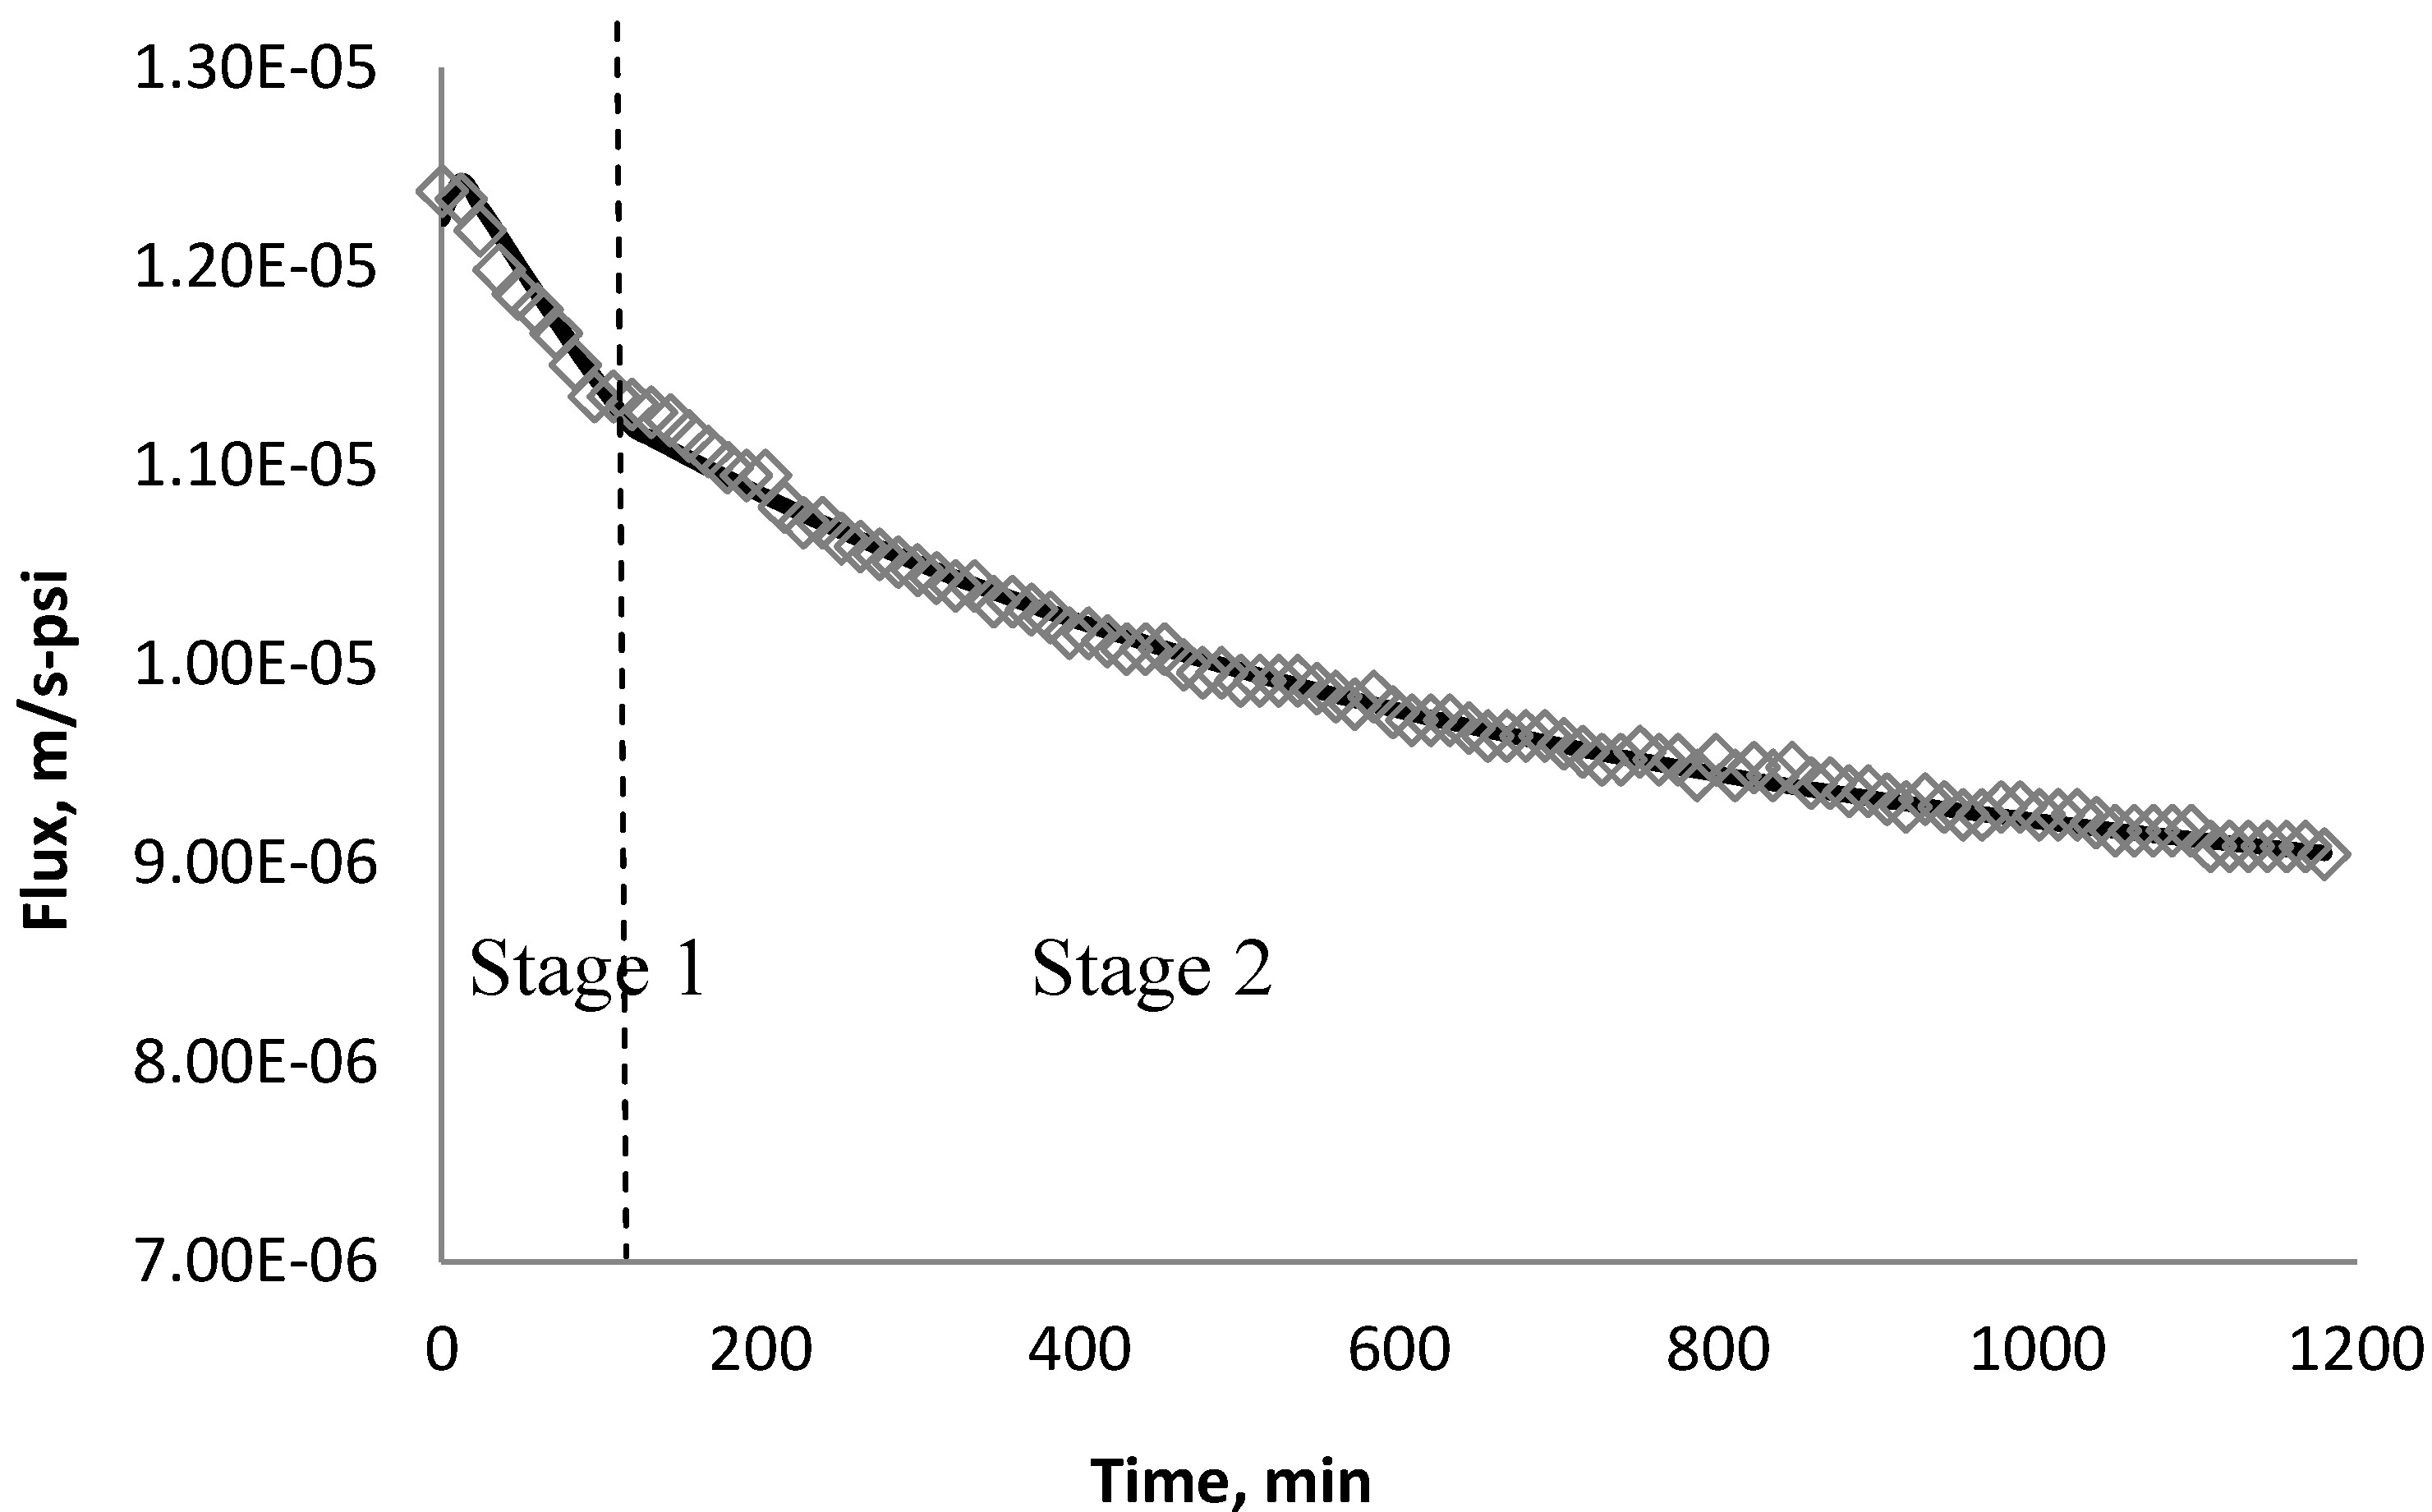
3.3. Effect of CeO2 on Flux Decline


| Initial flux | BW30 | XLE | CK |
|---|---|---|---|
| m/s | 1.29 × 10⁻⁵ | 1.24 × 10⁻⁵ | 6.68 × 10⁻⁶ |
| gal/sfd | 27.35 | 26.29 | 14.16 |
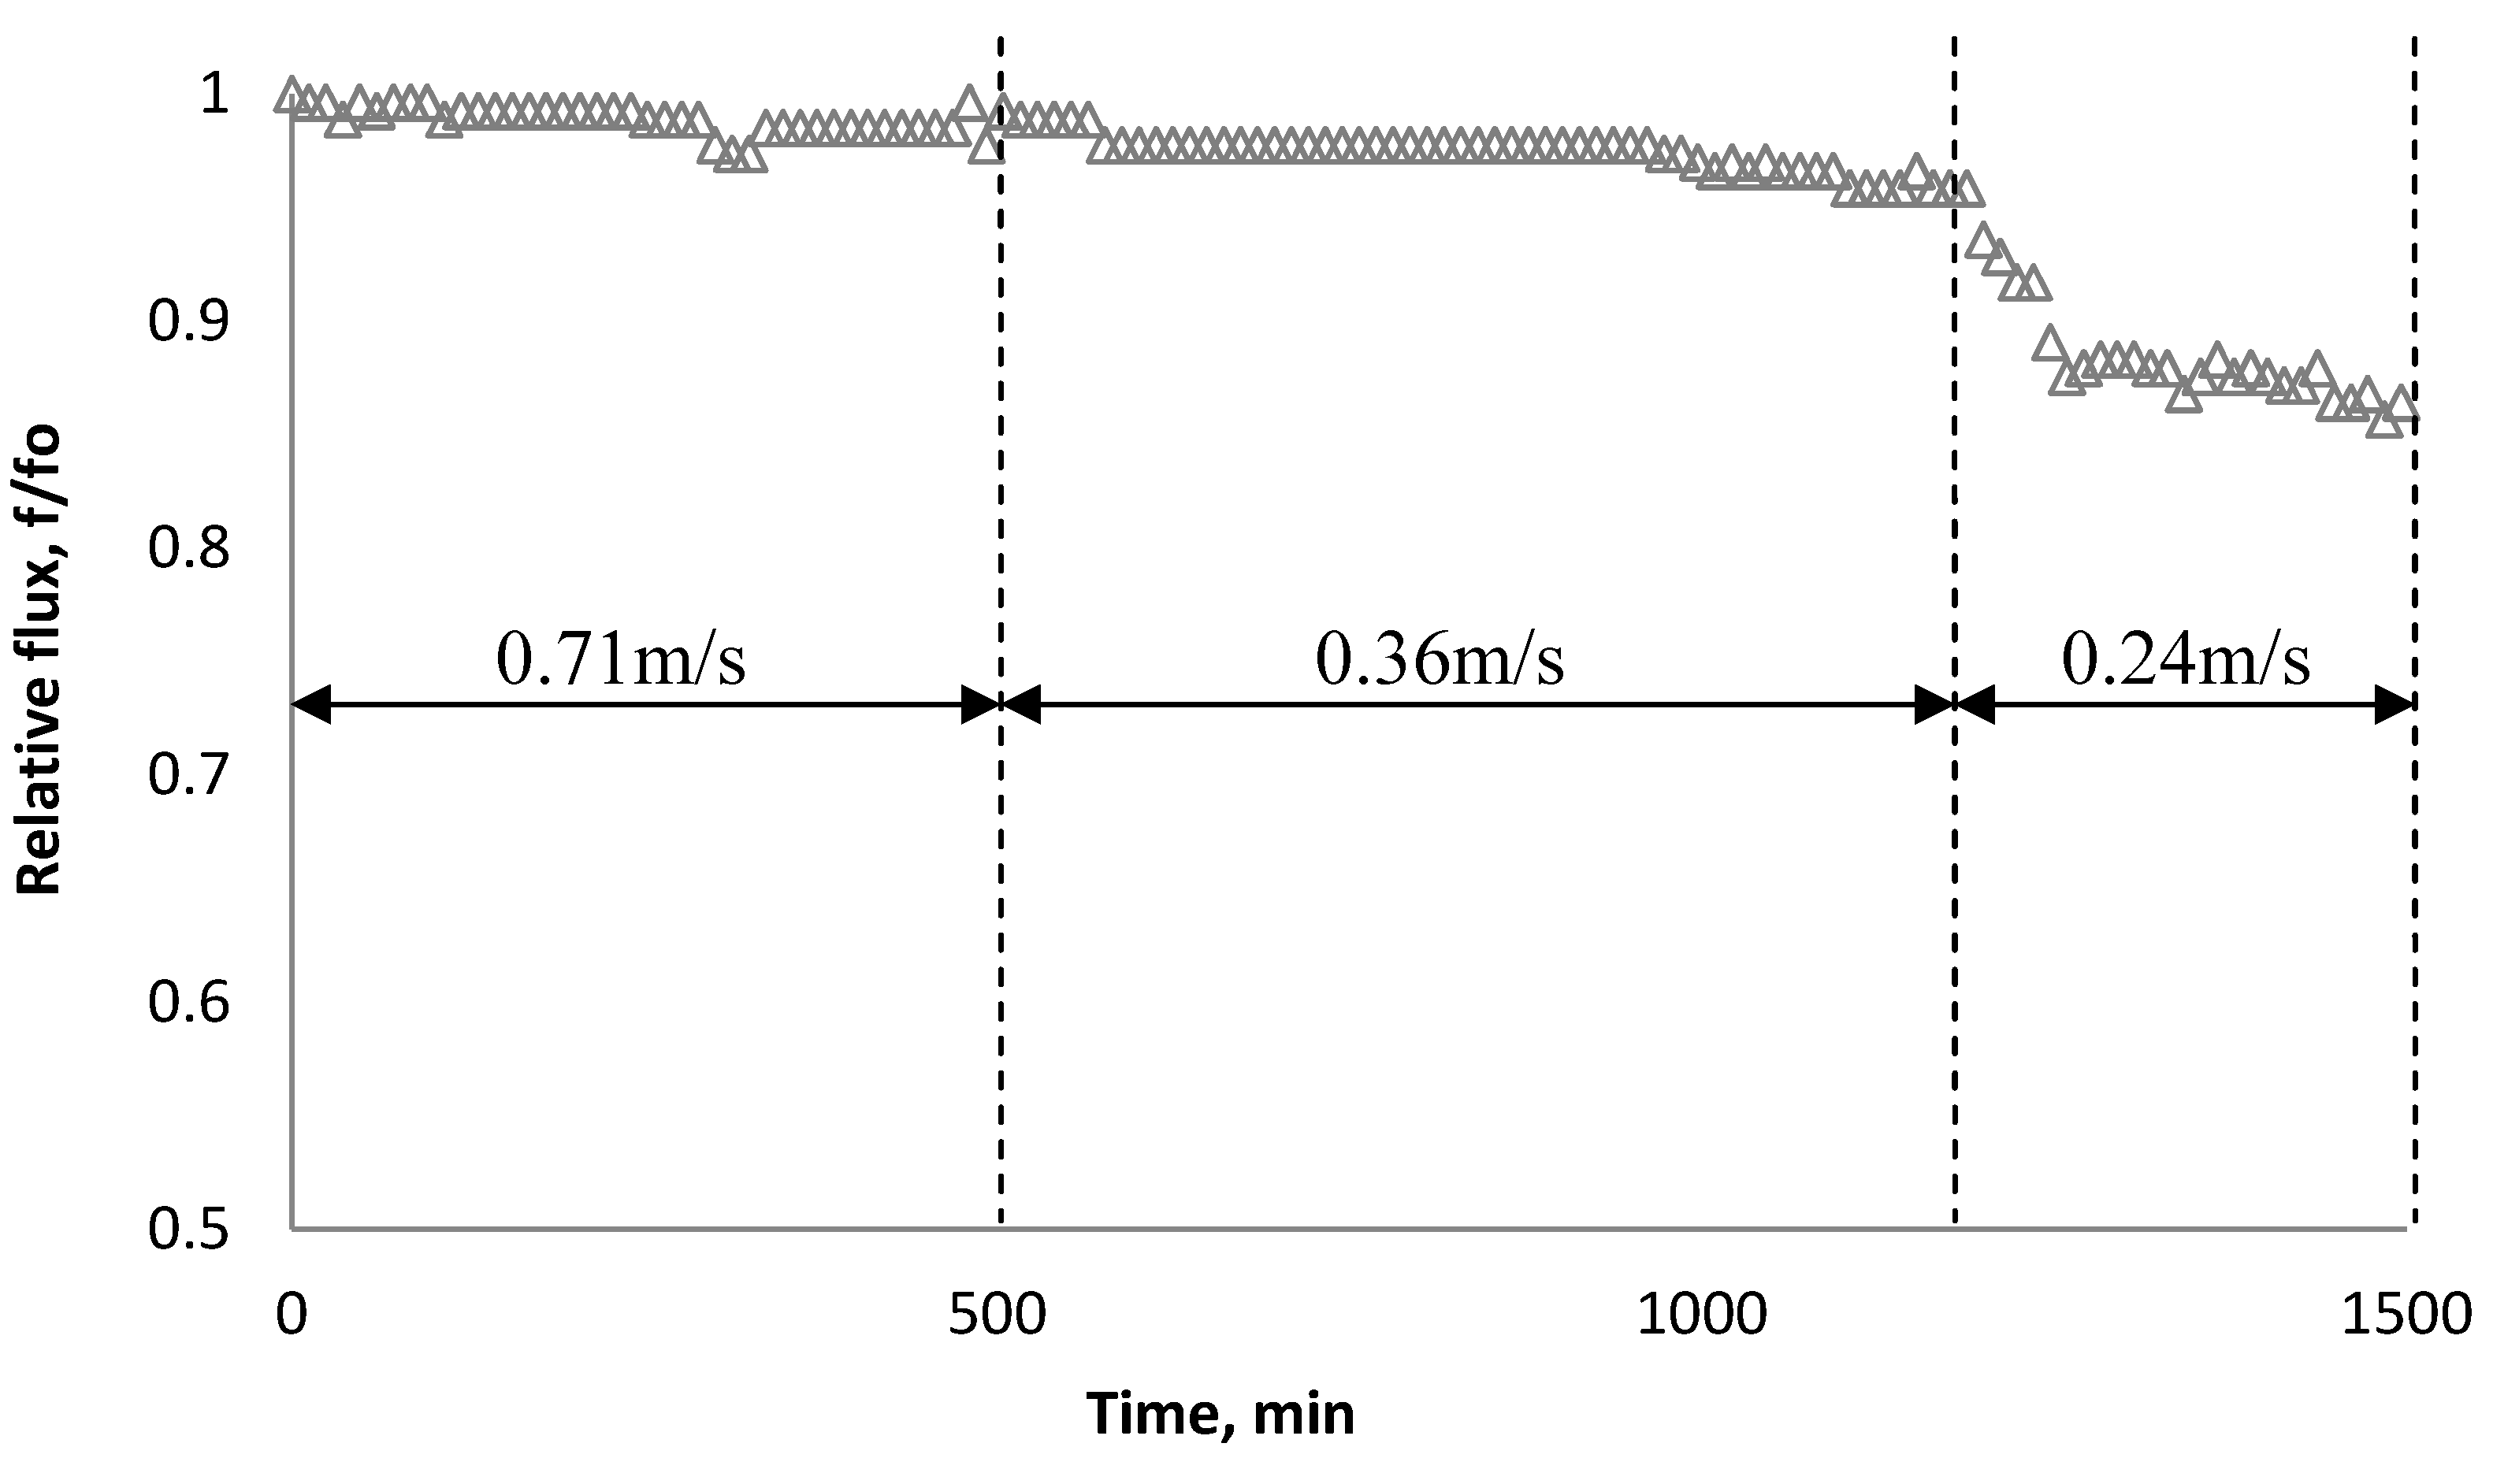
3.4. Effect of Cross Flow Velocity
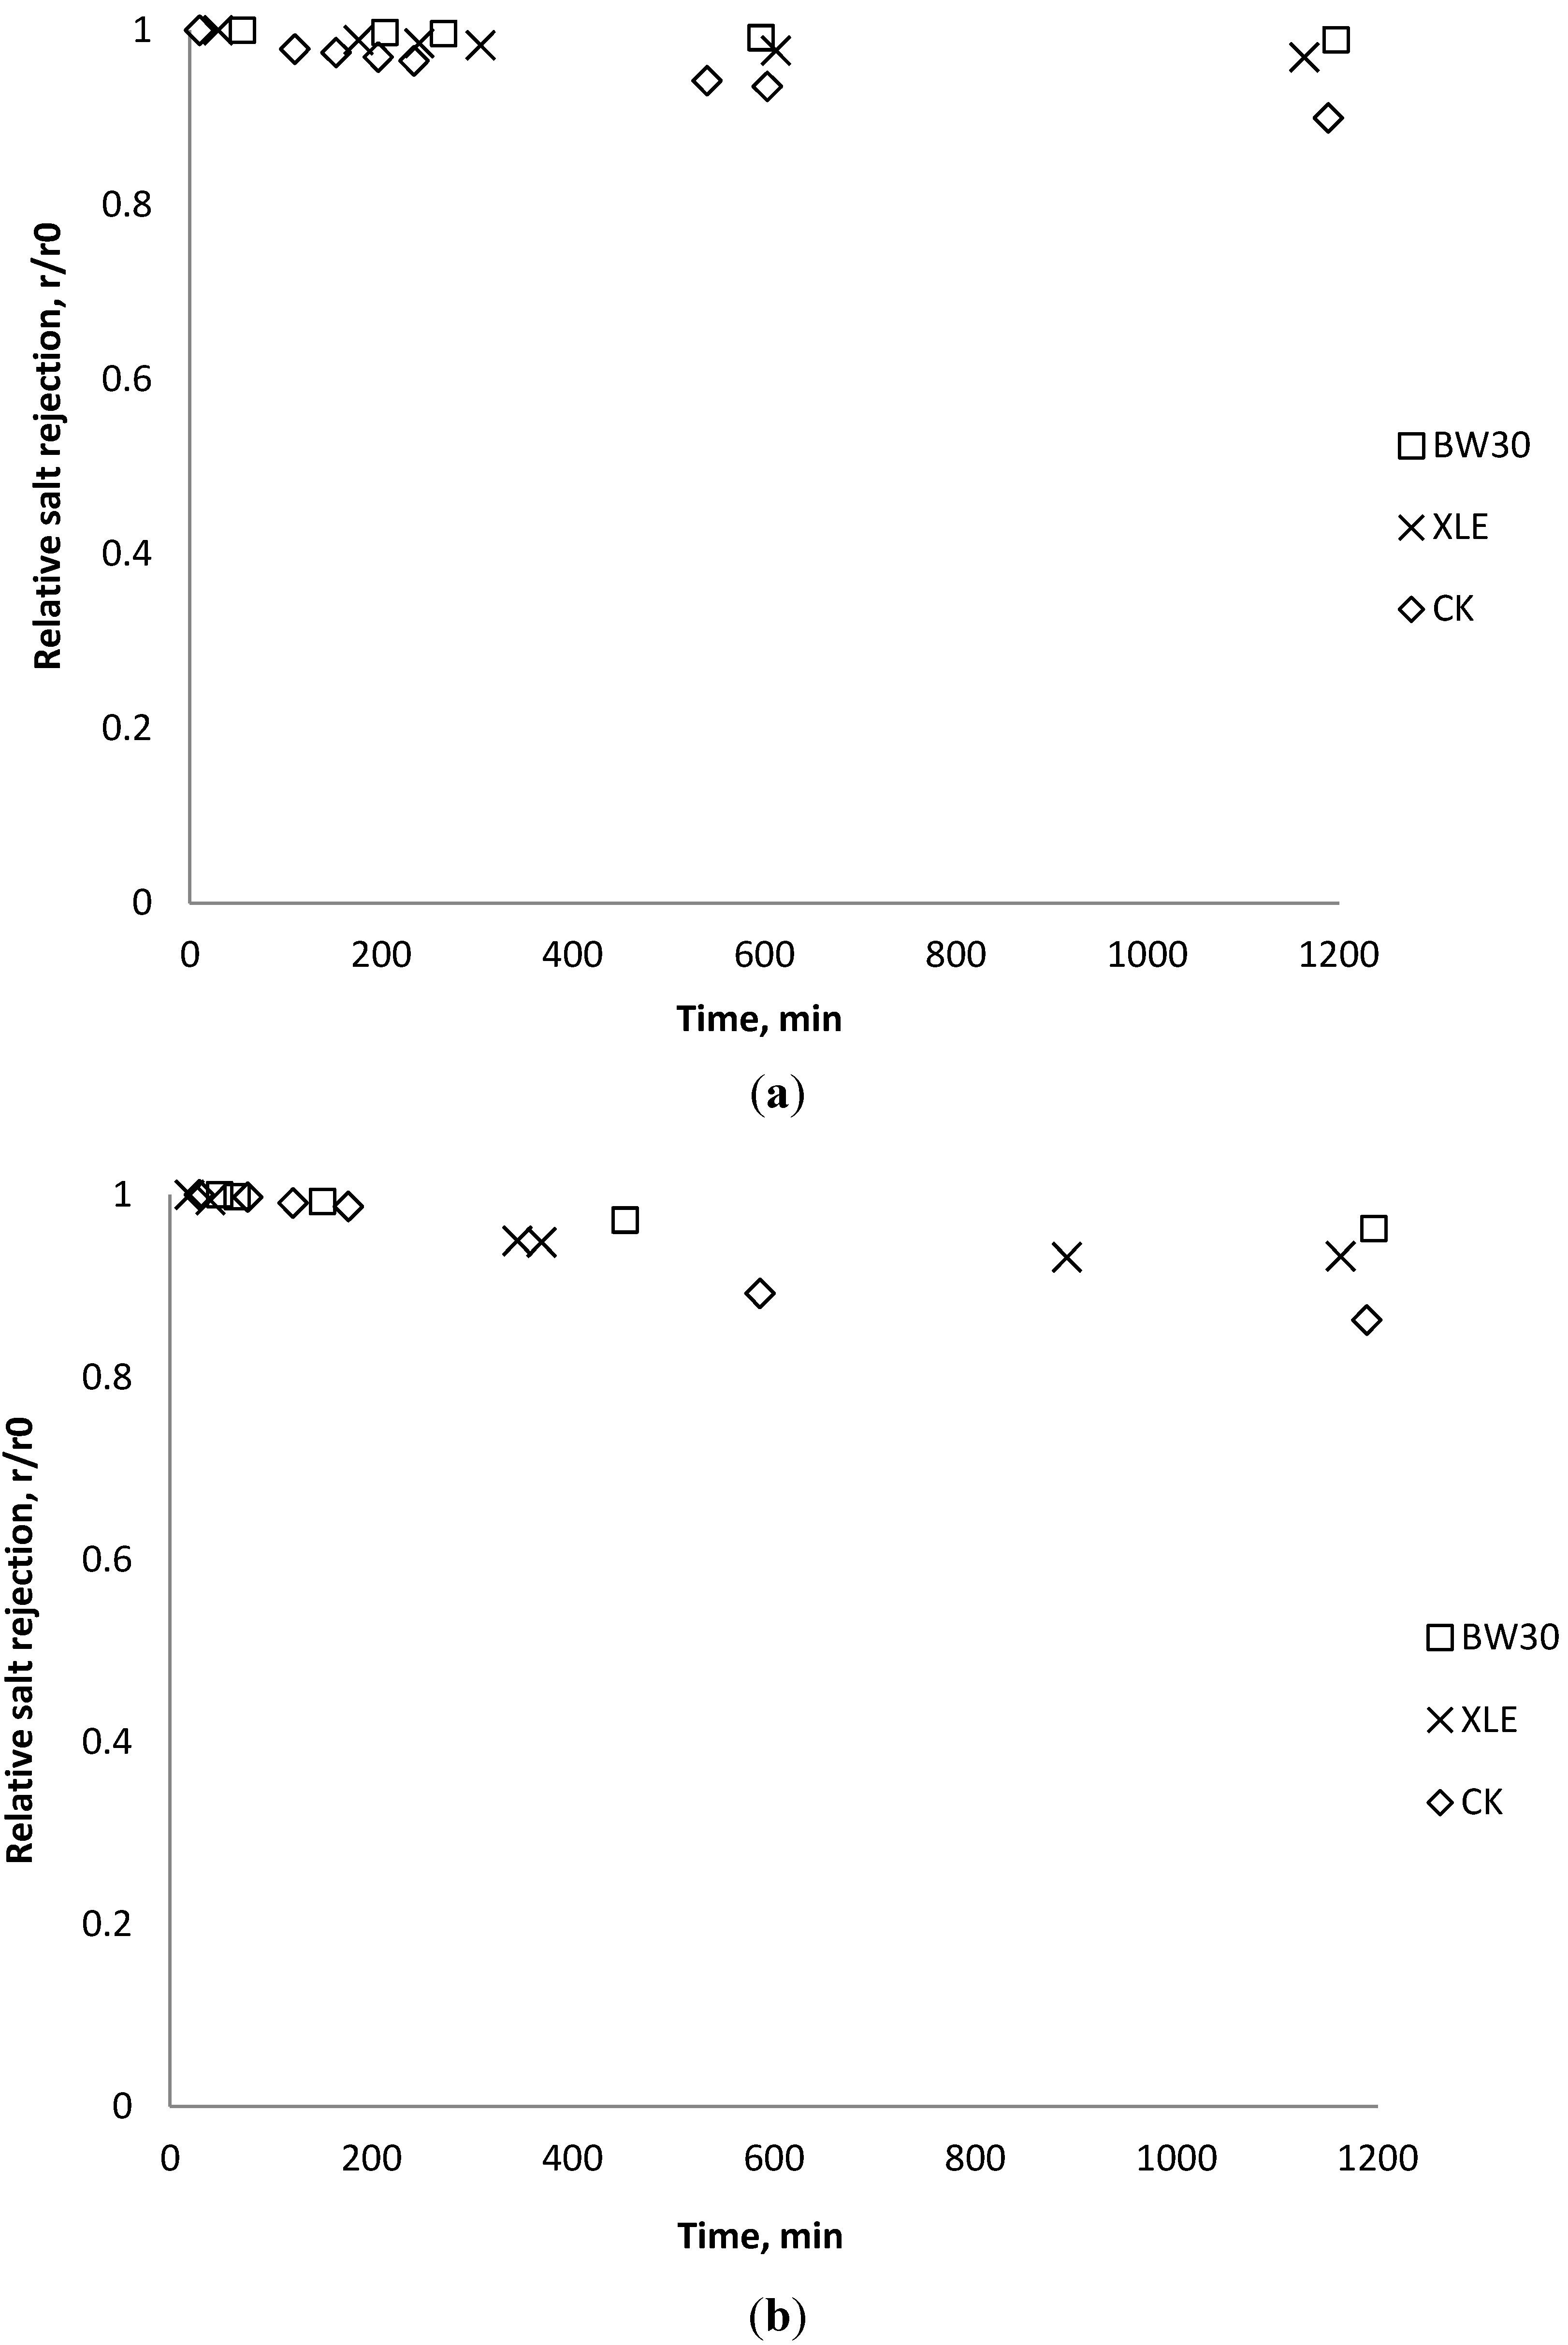
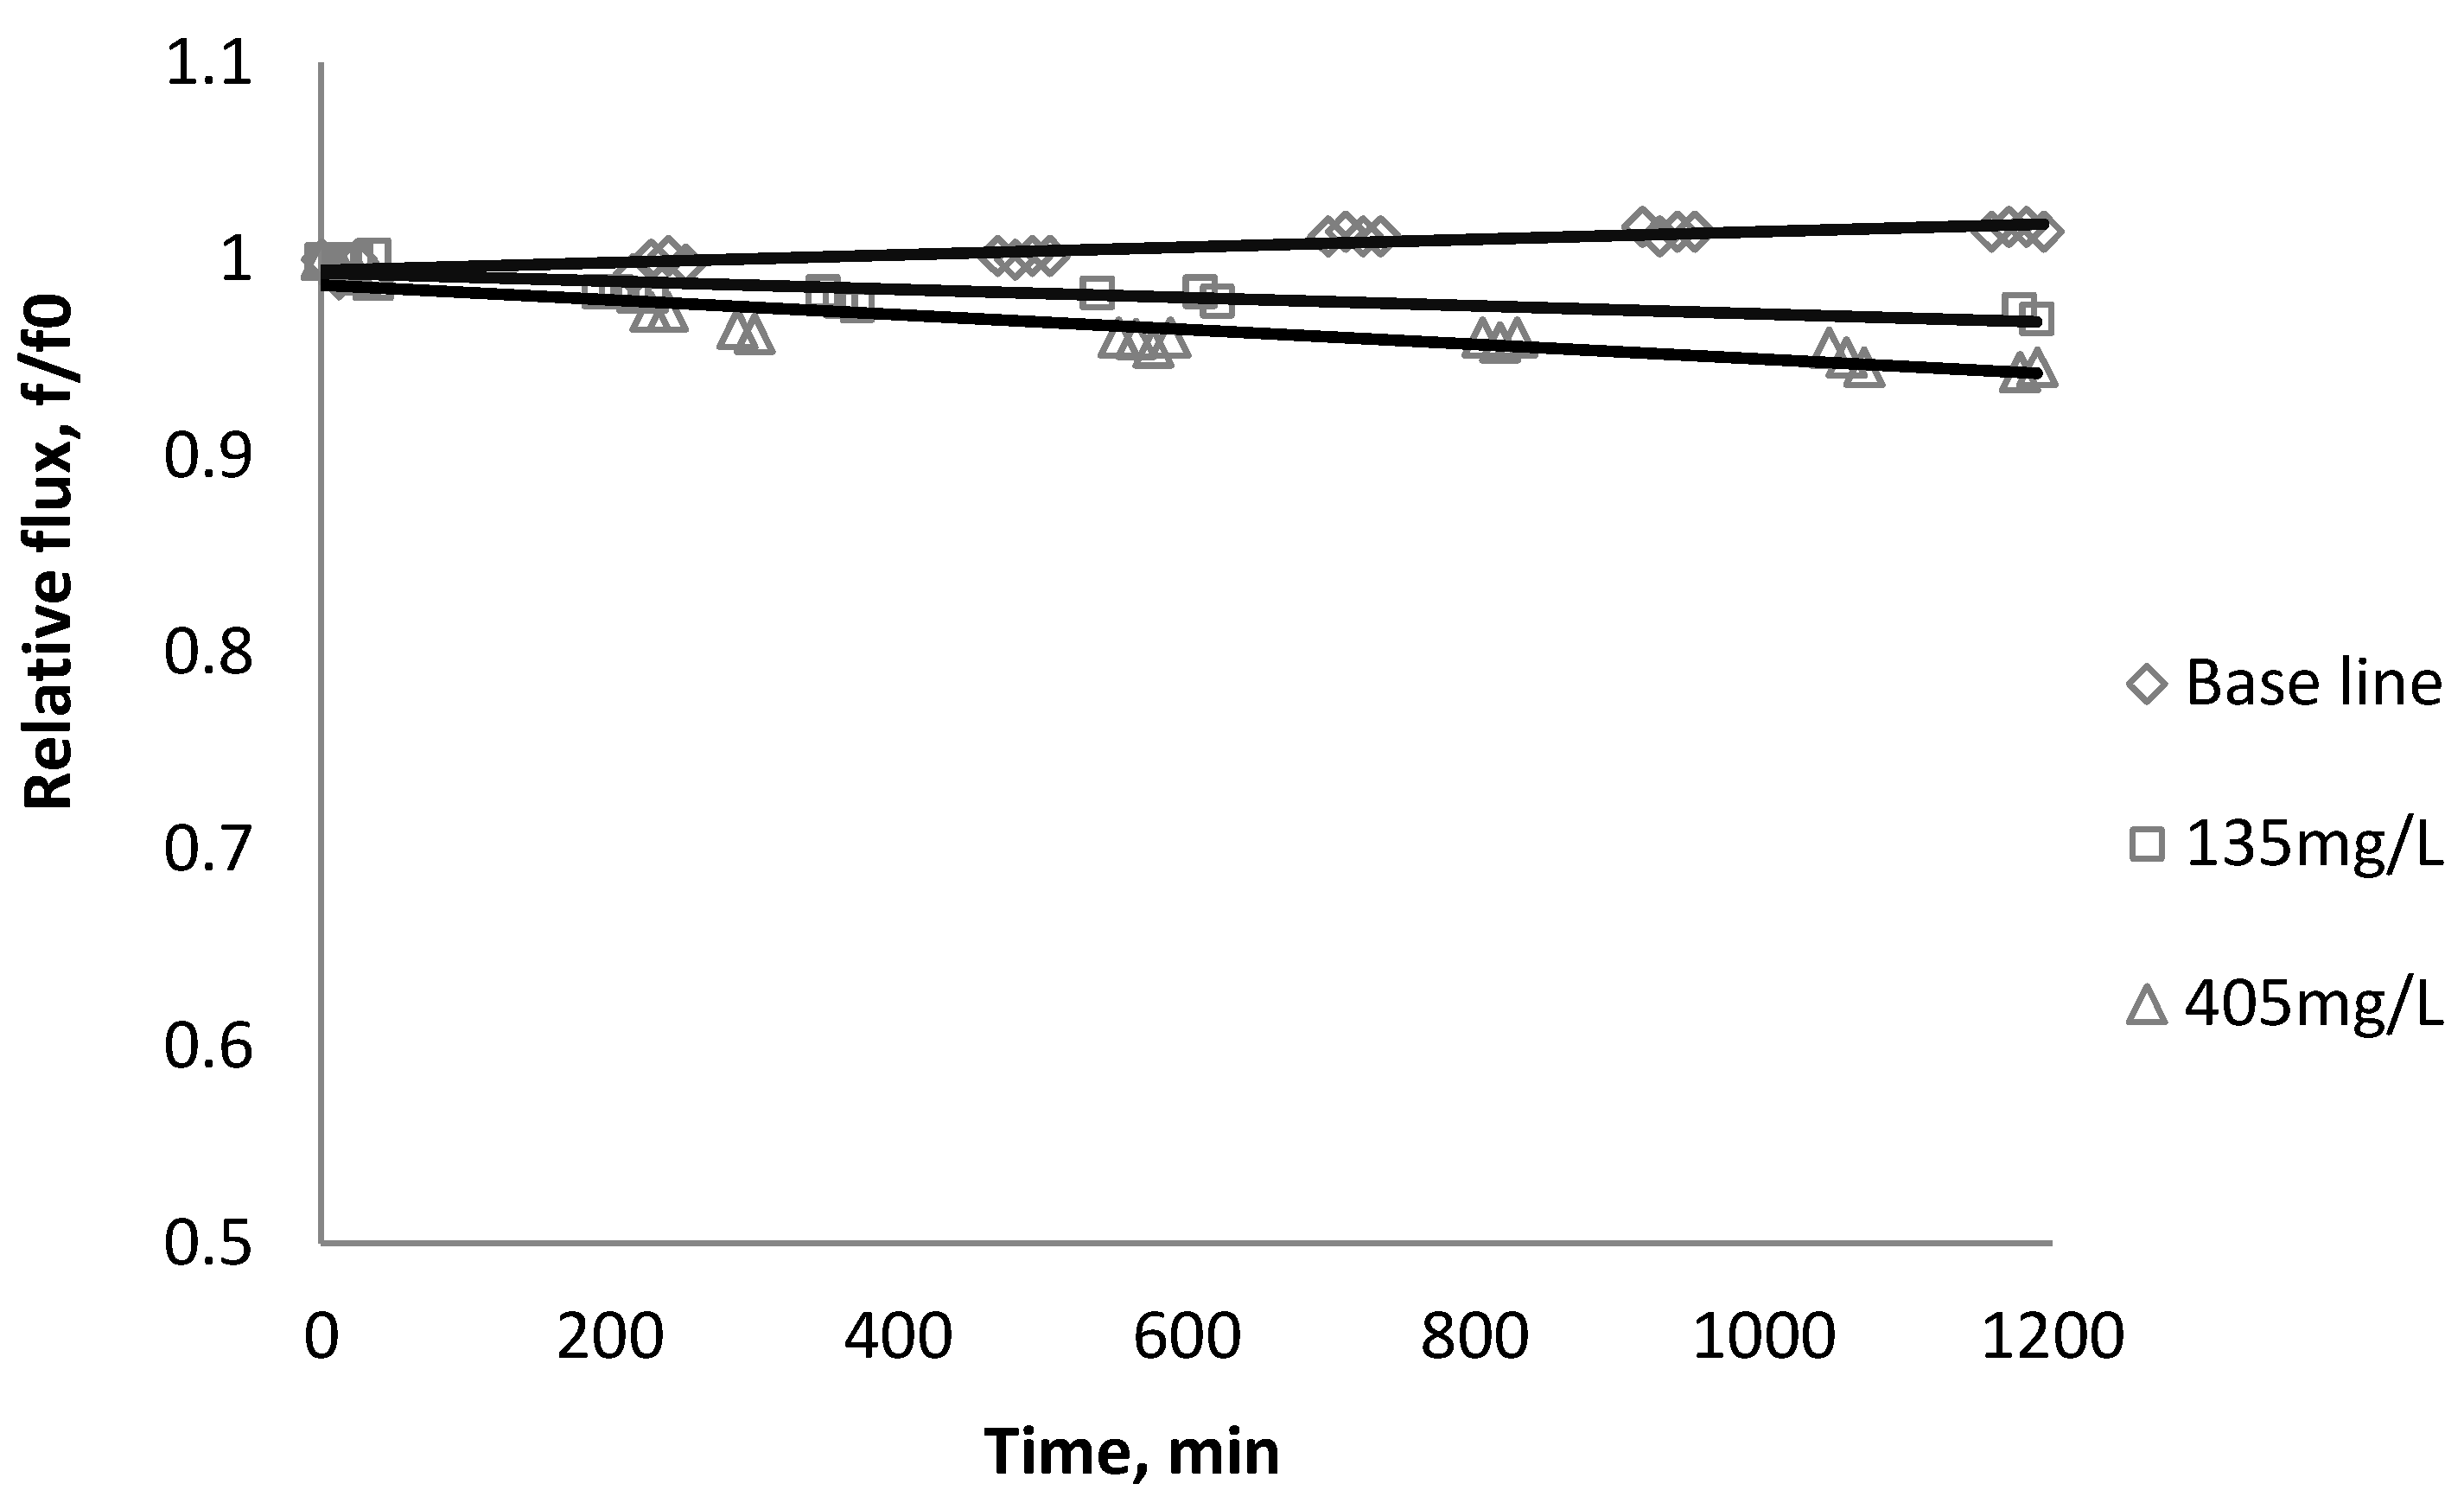
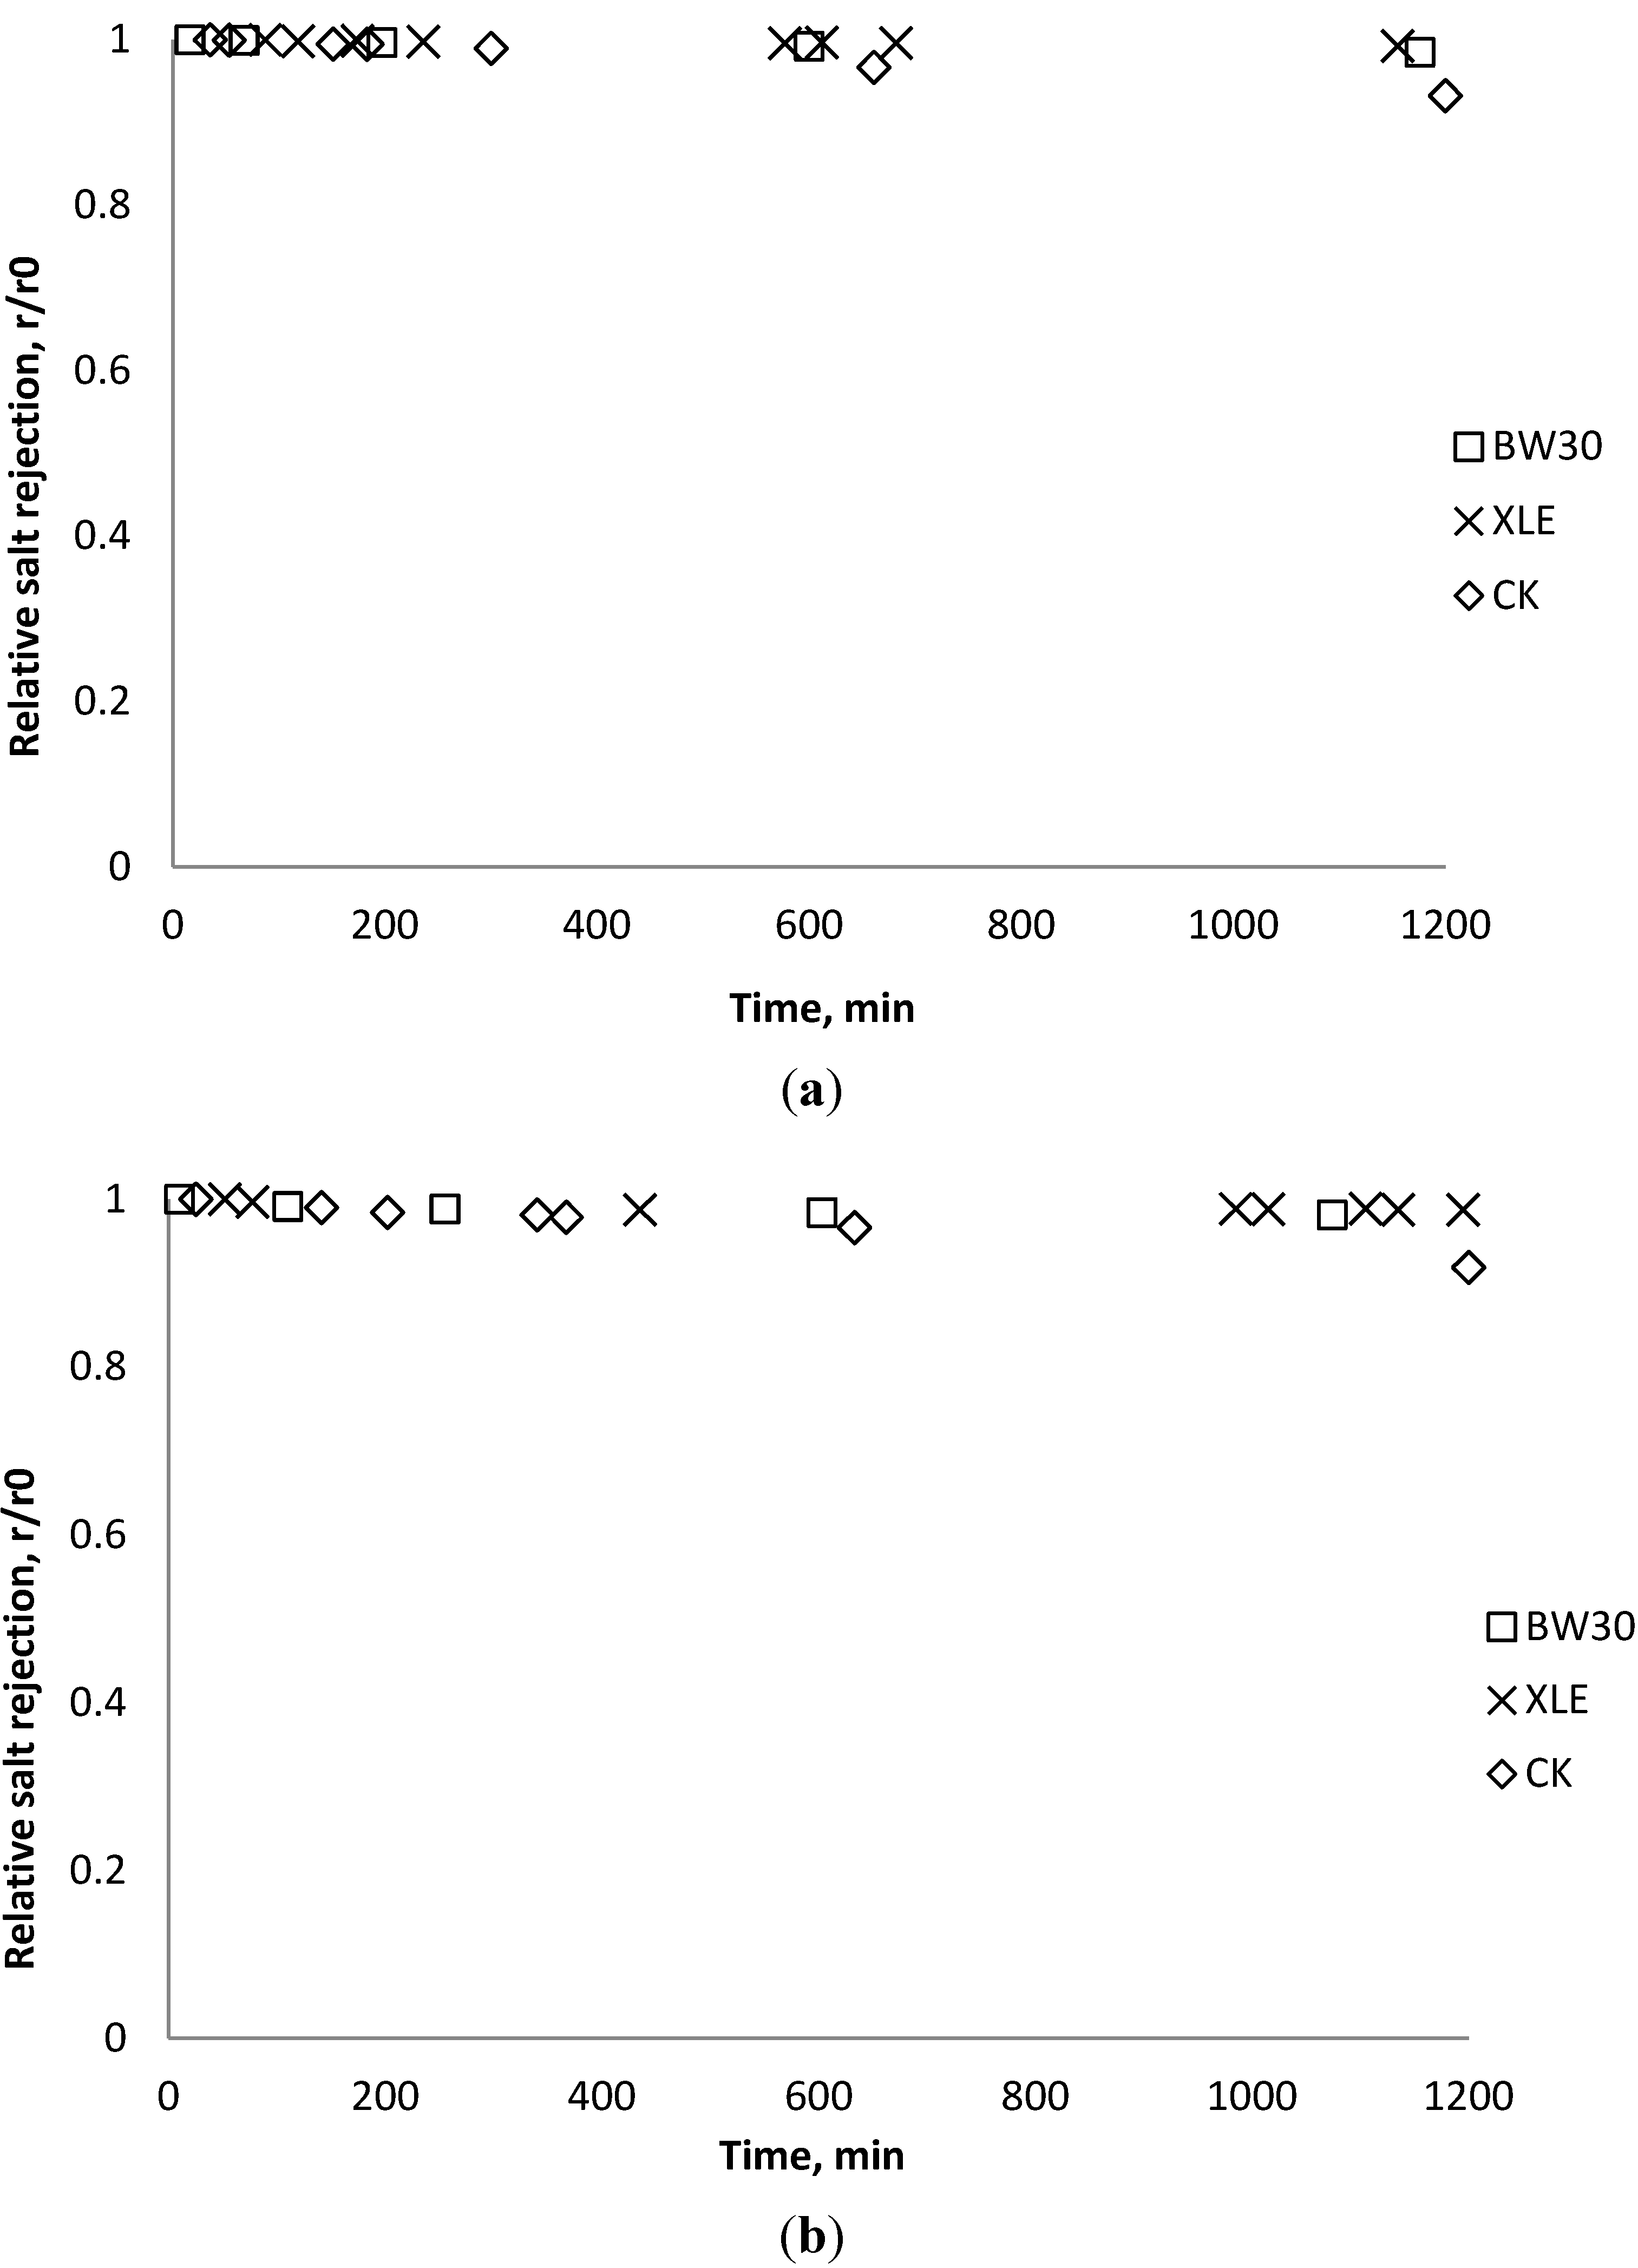
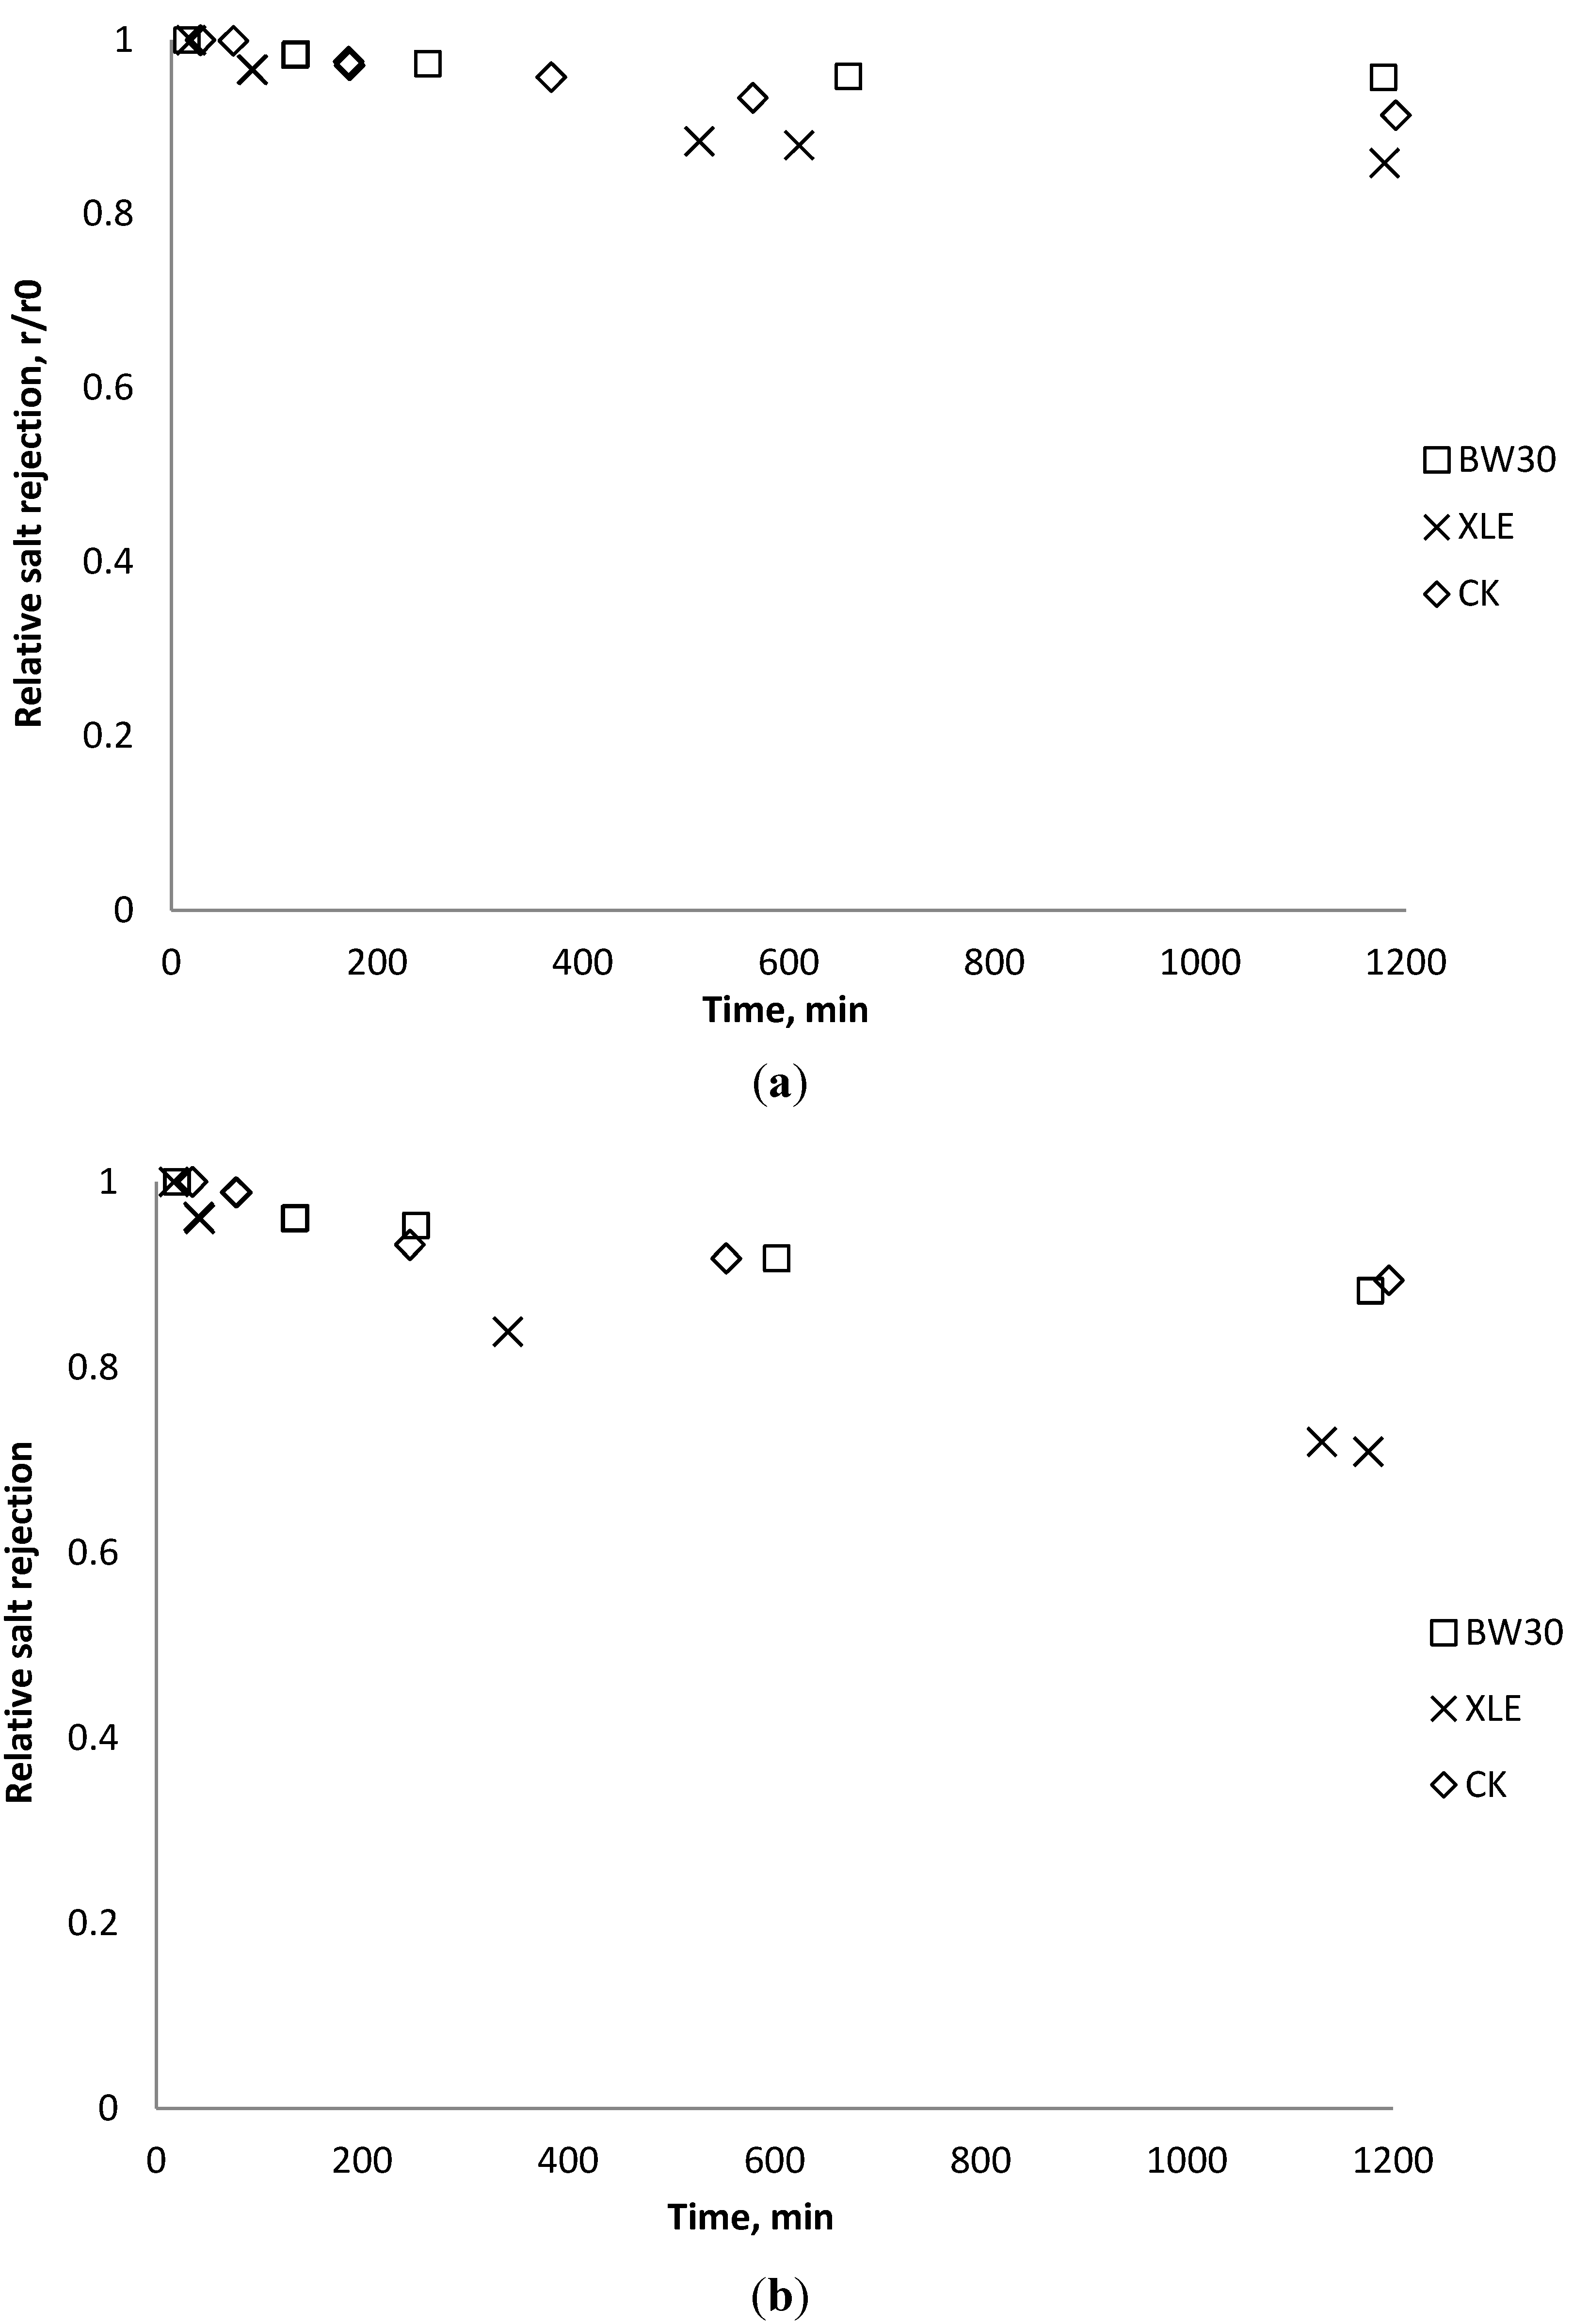
3.5. Effect of Nanoparticles on Salt Rejection
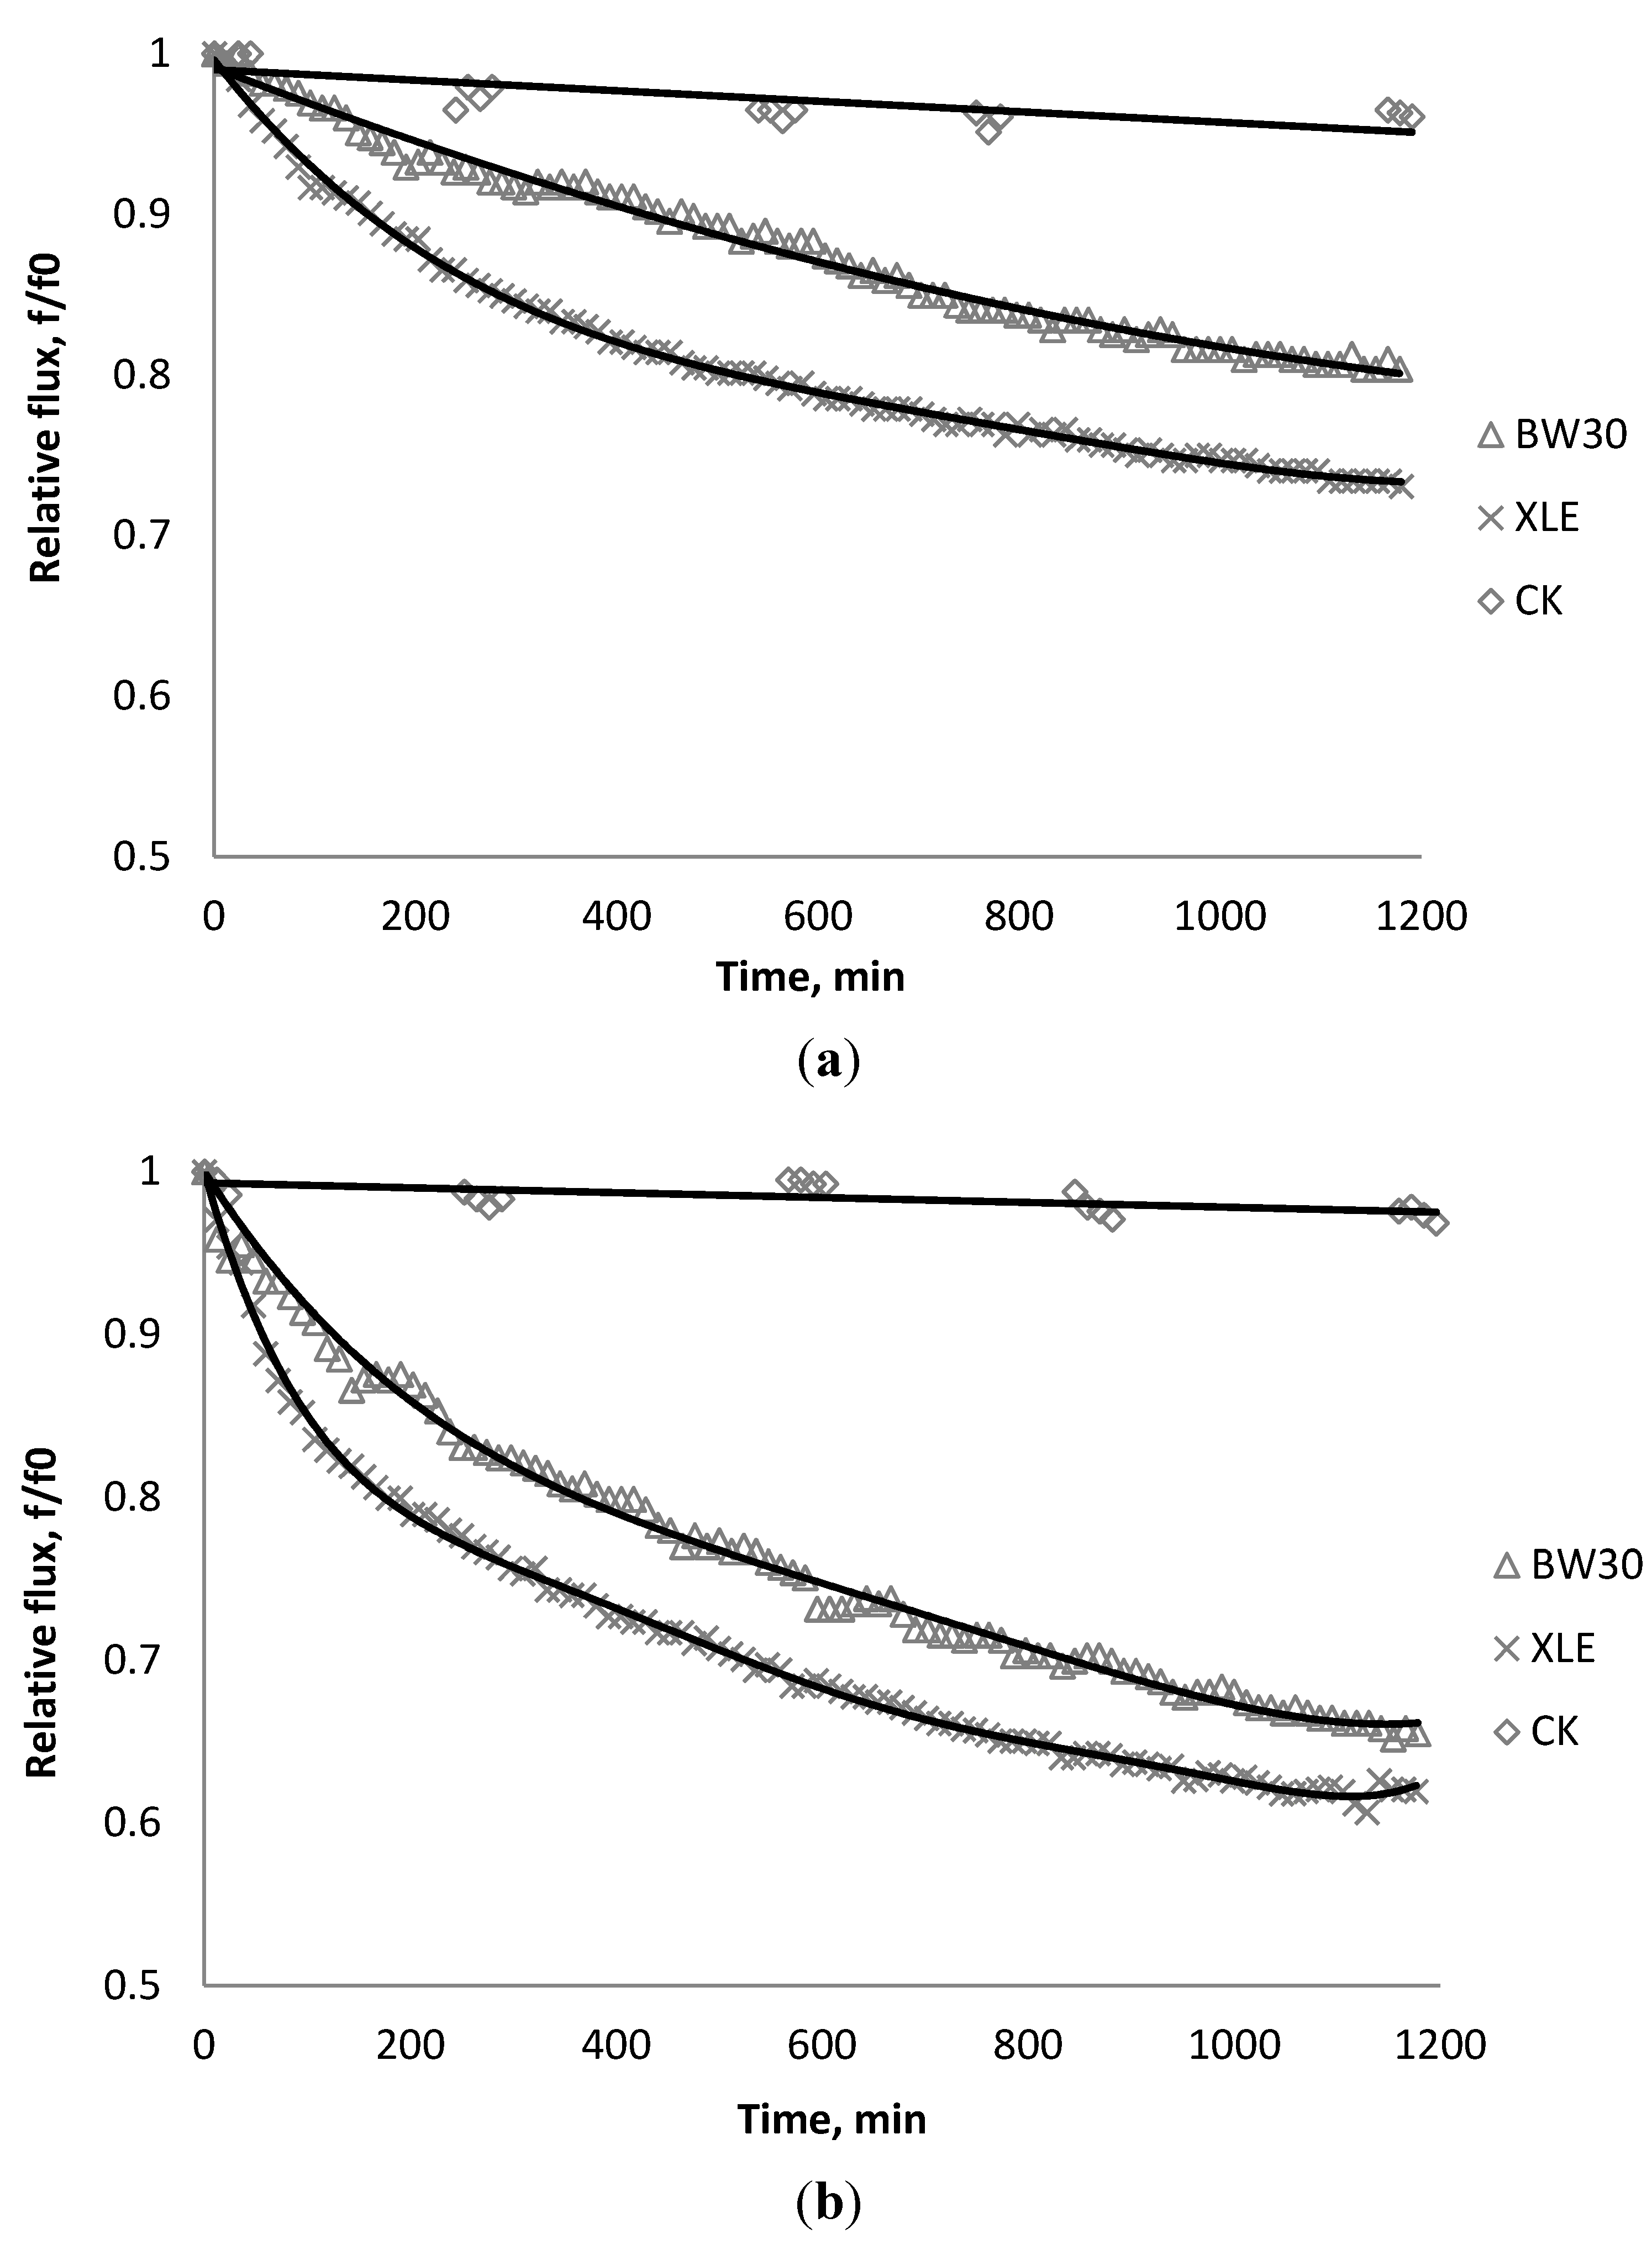
3.6. Fouling Experiment with Desalination Plant Water


3.7. Correlation of Membrane Surface Properties with Membrane Productivity
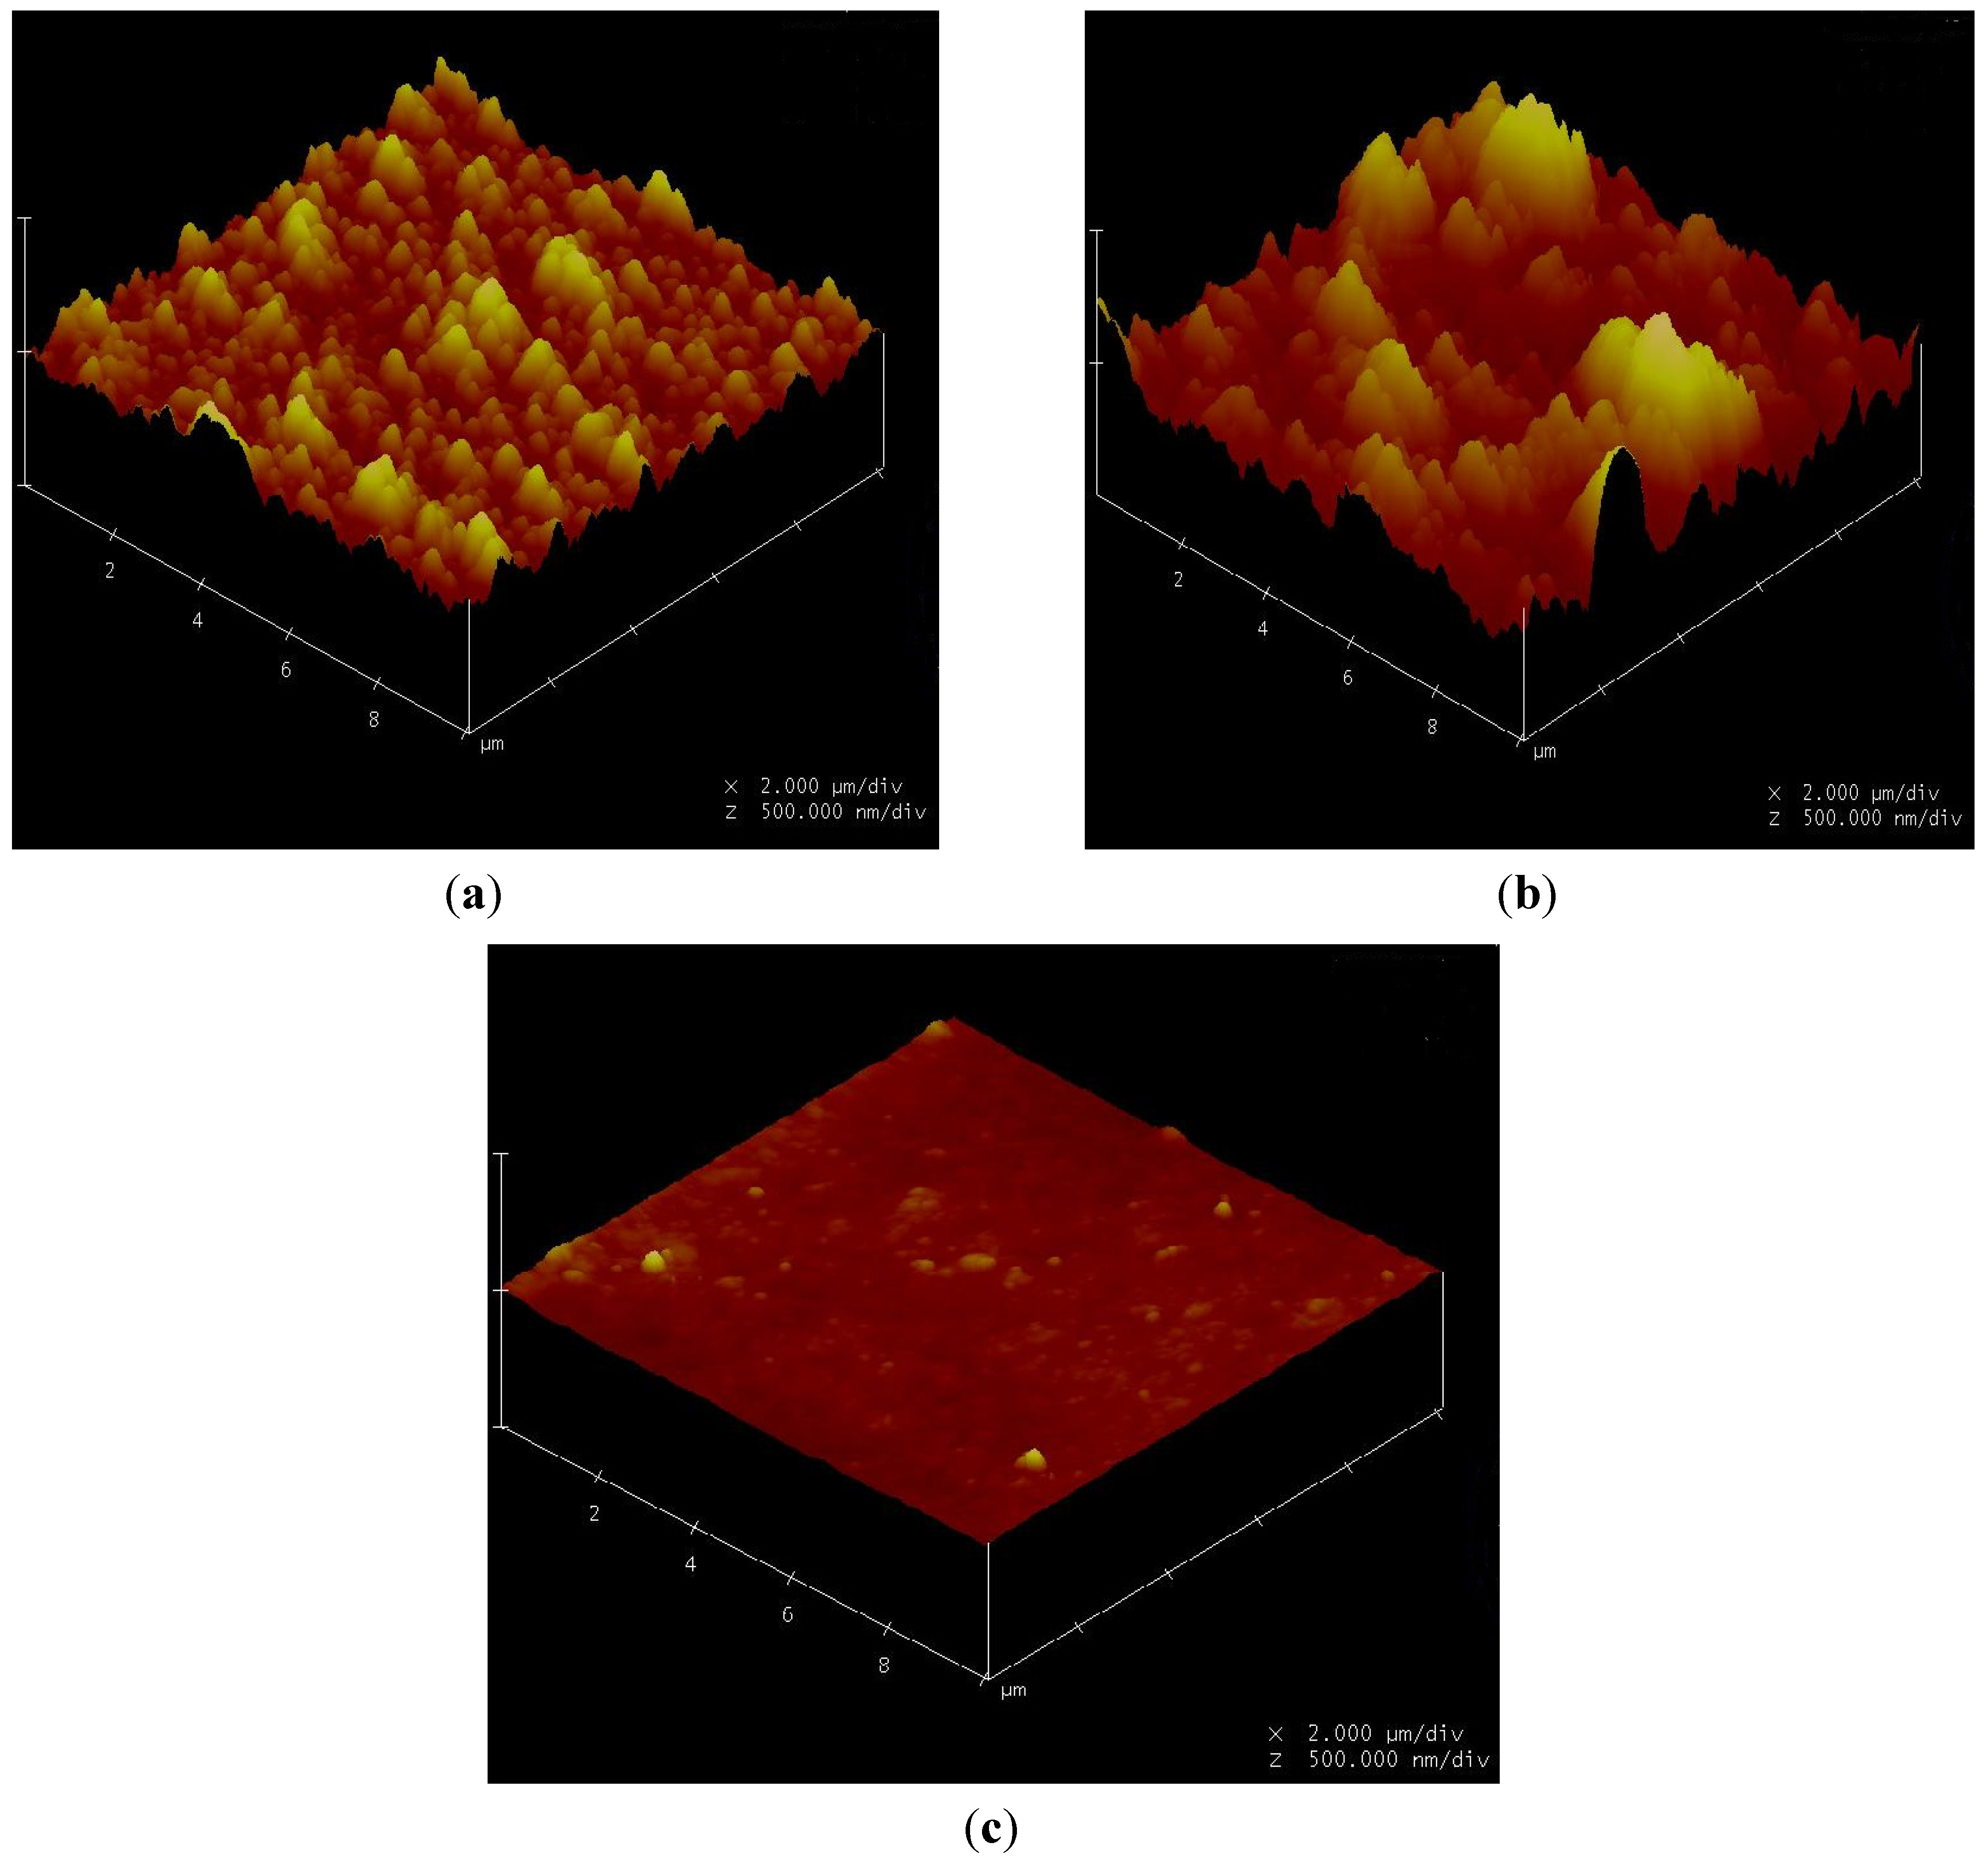
3.7.1. Surface Morphology

| Membrane | Average roughness (nm) | RMS * (nm) | Mean (nm) |
|---|---|---|---|
| BW30 | 30 | 38.1 | 0 |
| XLE | 81.1 | 105.8 | 0.123 |
| CK | 5.1 | 6.6 | 0.018 |
3.7.2. Contact Angle
| Membrane | Condition | Contact angle |
|---|---|---|
| BW30 | Clean | 58.4 |
| SiO2 | 48.8 | |
| TiO2 | 54.0 | |
| CeO2 | 51.5 | |
| XLE | Clean | 61.5 |
| SiO2 | 54.2 | |
| TiO2 | 53.2 | |
| CeO2 | 46.4 | |
| CK | Clean | 61.1 |
| SiO2 | 58.8 | |
| TiO2 | 62.9 | |
| CeO2 | 54.5 |
4. Simulation of Cake Deposit Membrane Processes
4.1. Model Development


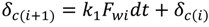
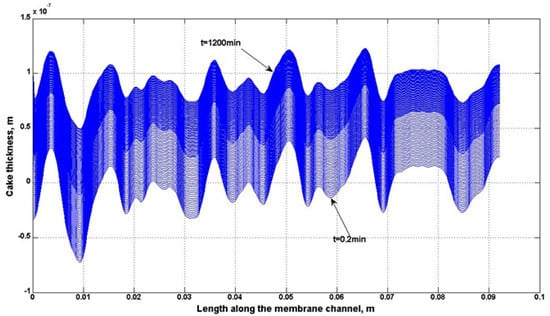
4.2. Numerical Representation of Membrane Surface Morphology
4.3. Effect of Surface Roughness on Overall Cake Growth Rate
| Membrane | SiO2 | TiO2 | CeO2 |
|---|---|---|---|
| BW30 | 93% | 86% | 92% |
| XLE | 90% | 80% | 90% |
| CK | N/A | N/A | 97% |
| Membrane | Particle | Cake growth term | Particle back diffusion term |  | RMS | Applied Pressure, psi |
|---|---|---|---|---|---|---|
| k1 | k2 | |||||
| XLE | CeO2 | 0.105 | 0.00055 | 191 | 105.8 | 130 |
| BW30 | 0.028 | 0.00012 | 233 | 38.1 | 260 | |
| CK | 0.015 | 0.00009 | 167 | 6.6 | 230 | |
| XLE | SiO2 | 0.029 | 0.00012 | 236 | 105.8 | 130 |
| BW30 | 0.020 | 0.00007 | 286 | 38.1 | 260 | |
| CK | no flux decline,
 | 0 | 6.6 | 230 | ||
| XLE | TiO2 | 0.060 | 0.00025 | 240 | 105.8 | 130 |
| BW30 | 0.023 | 0.00008 | 295 | 38.1 | 260 | |
| CK | no flux decline,
 | 0 | 6.6 | 230 | ||
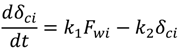
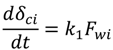
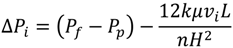
 indicates back diffusion k2 is more significant and more particles remain in the bulk flow. The XLE and BW30 membranes have a higher value than the CK membranes, indicating the permeate flux is determined by the cake layer resistance and back diffusion is less significant. There is no observed flux decline using the CK membranes with SiO2 or TiO2 deposition, so Equation (5) can be approximated to zero and is determined by the following:
 ratio. In addition, when comparing the XLE and BW30 membranes, a higher applied pressure tends to produce more resistance for particle back diffusion, thereby the BW30 membranes have a higher ratio than the XLE membranes.
4.4. Effect of Non-Homogeneous Surface on Particle Deposition Distribution
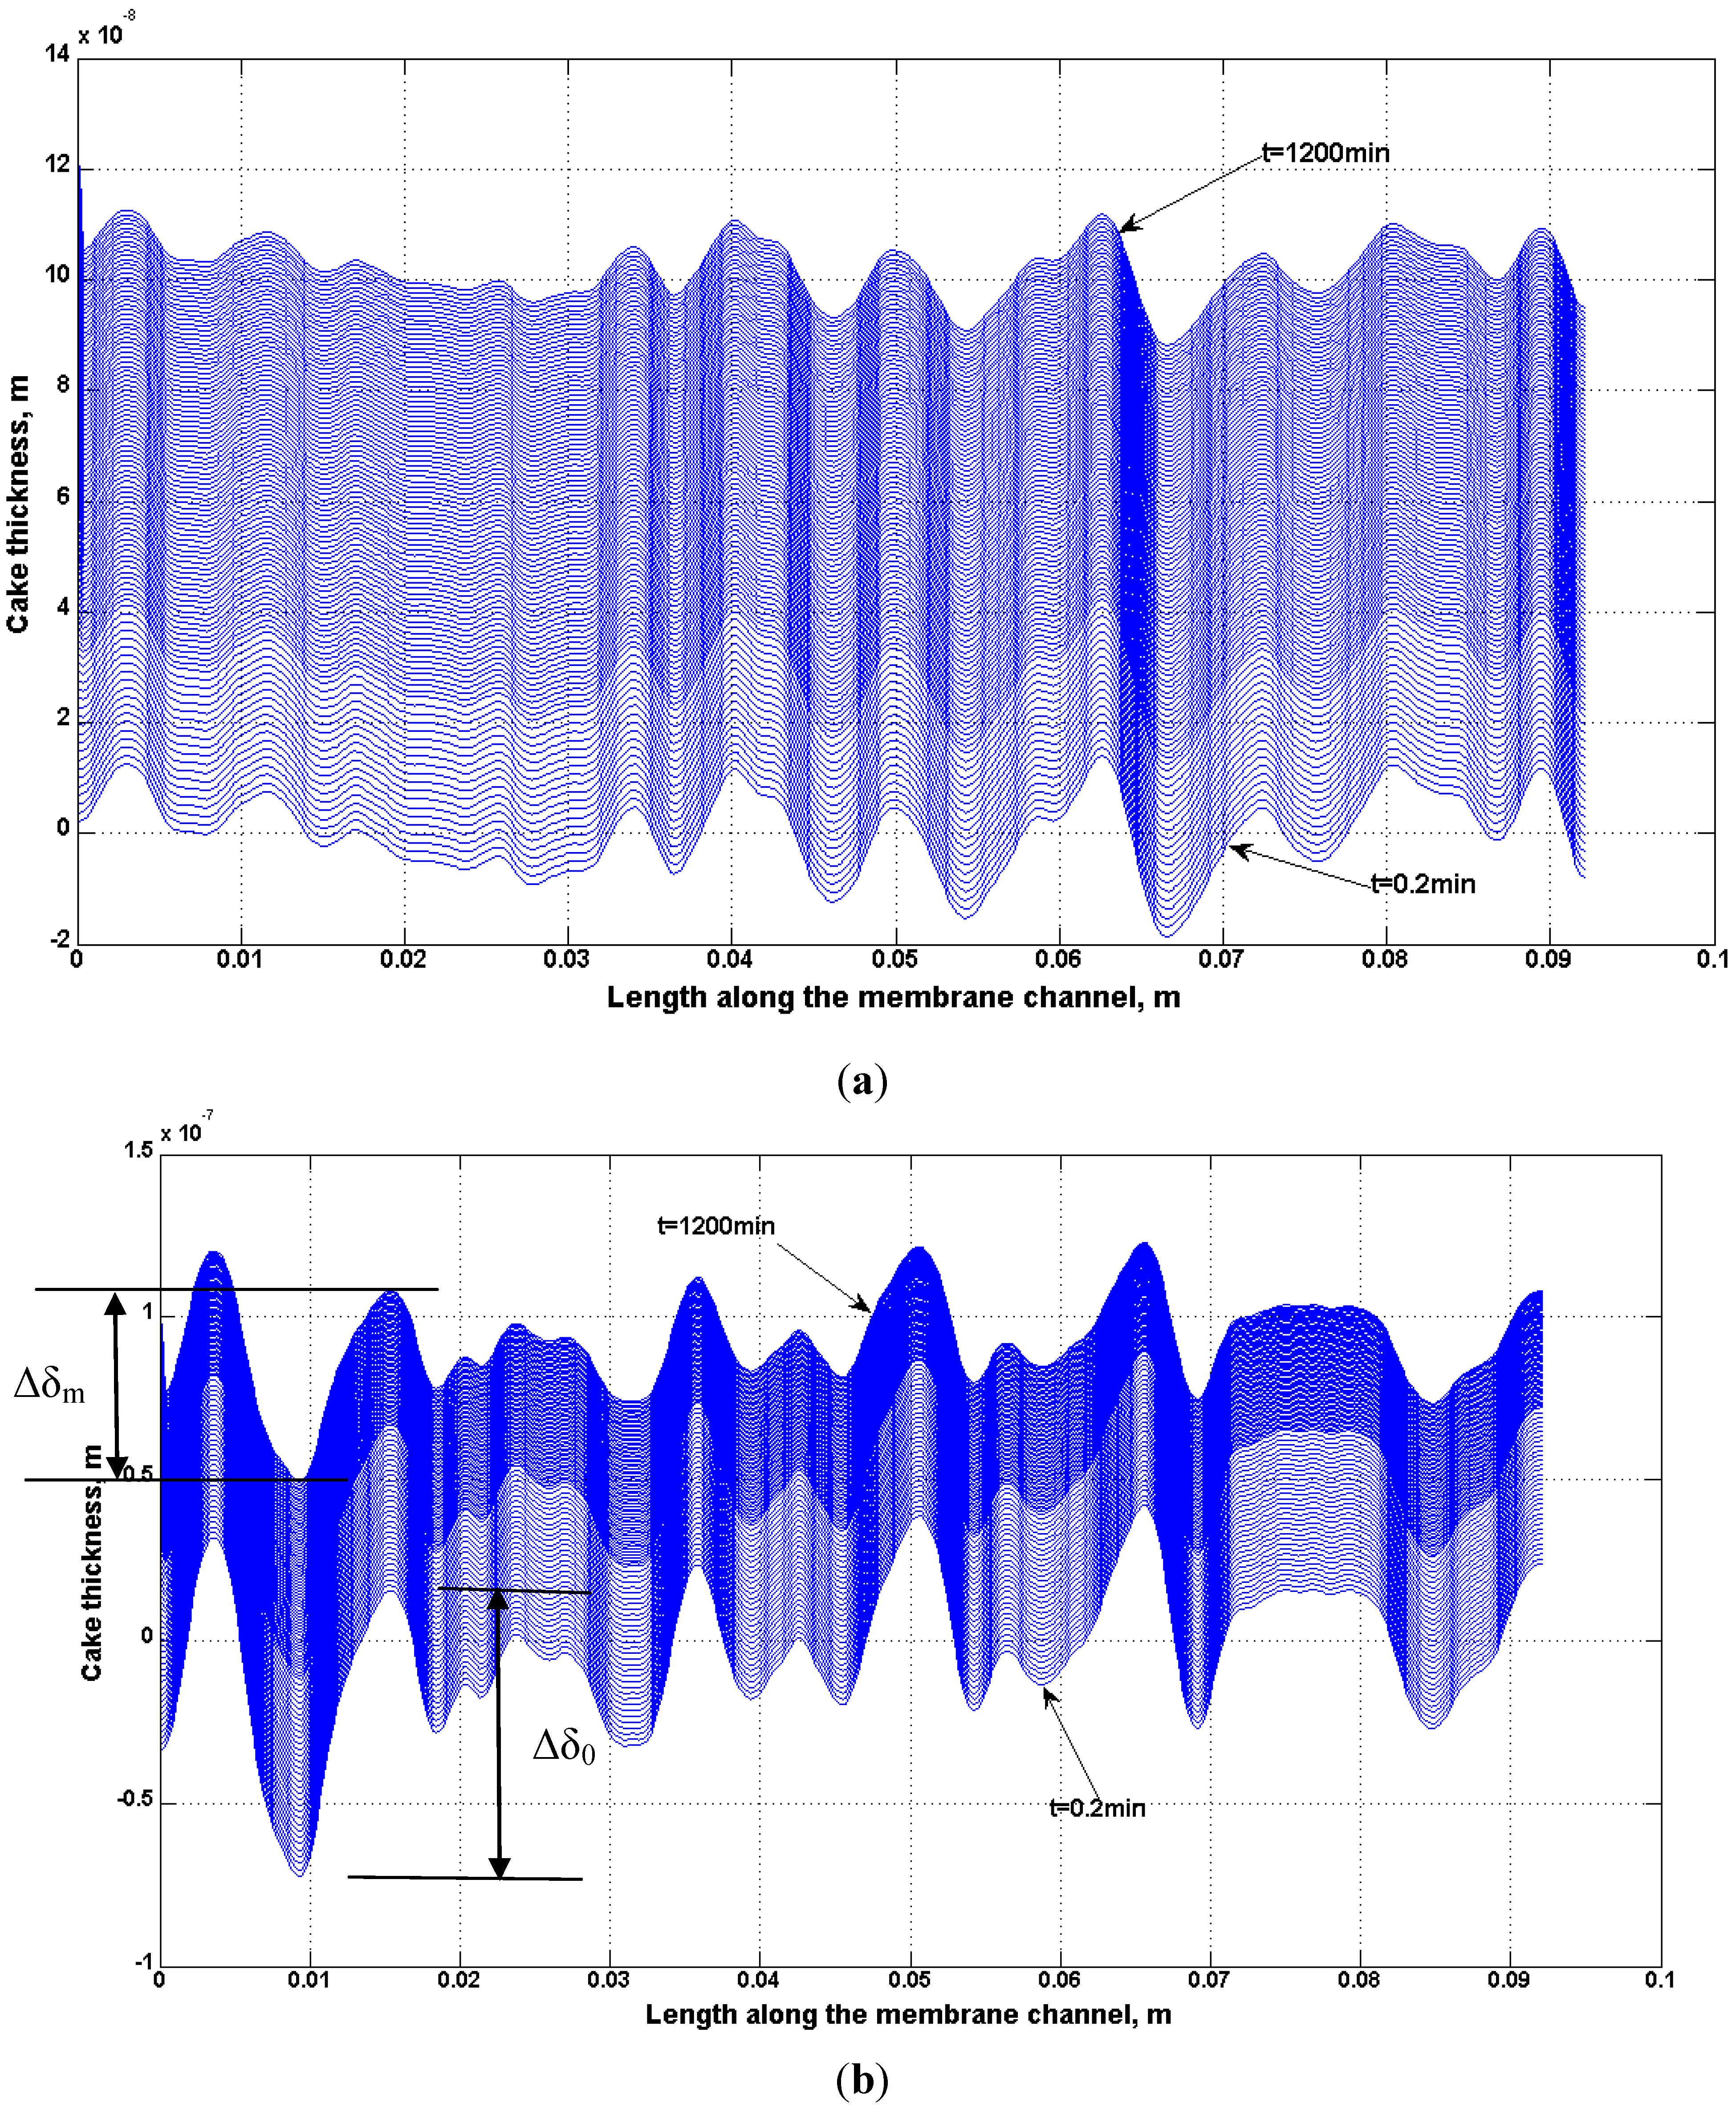
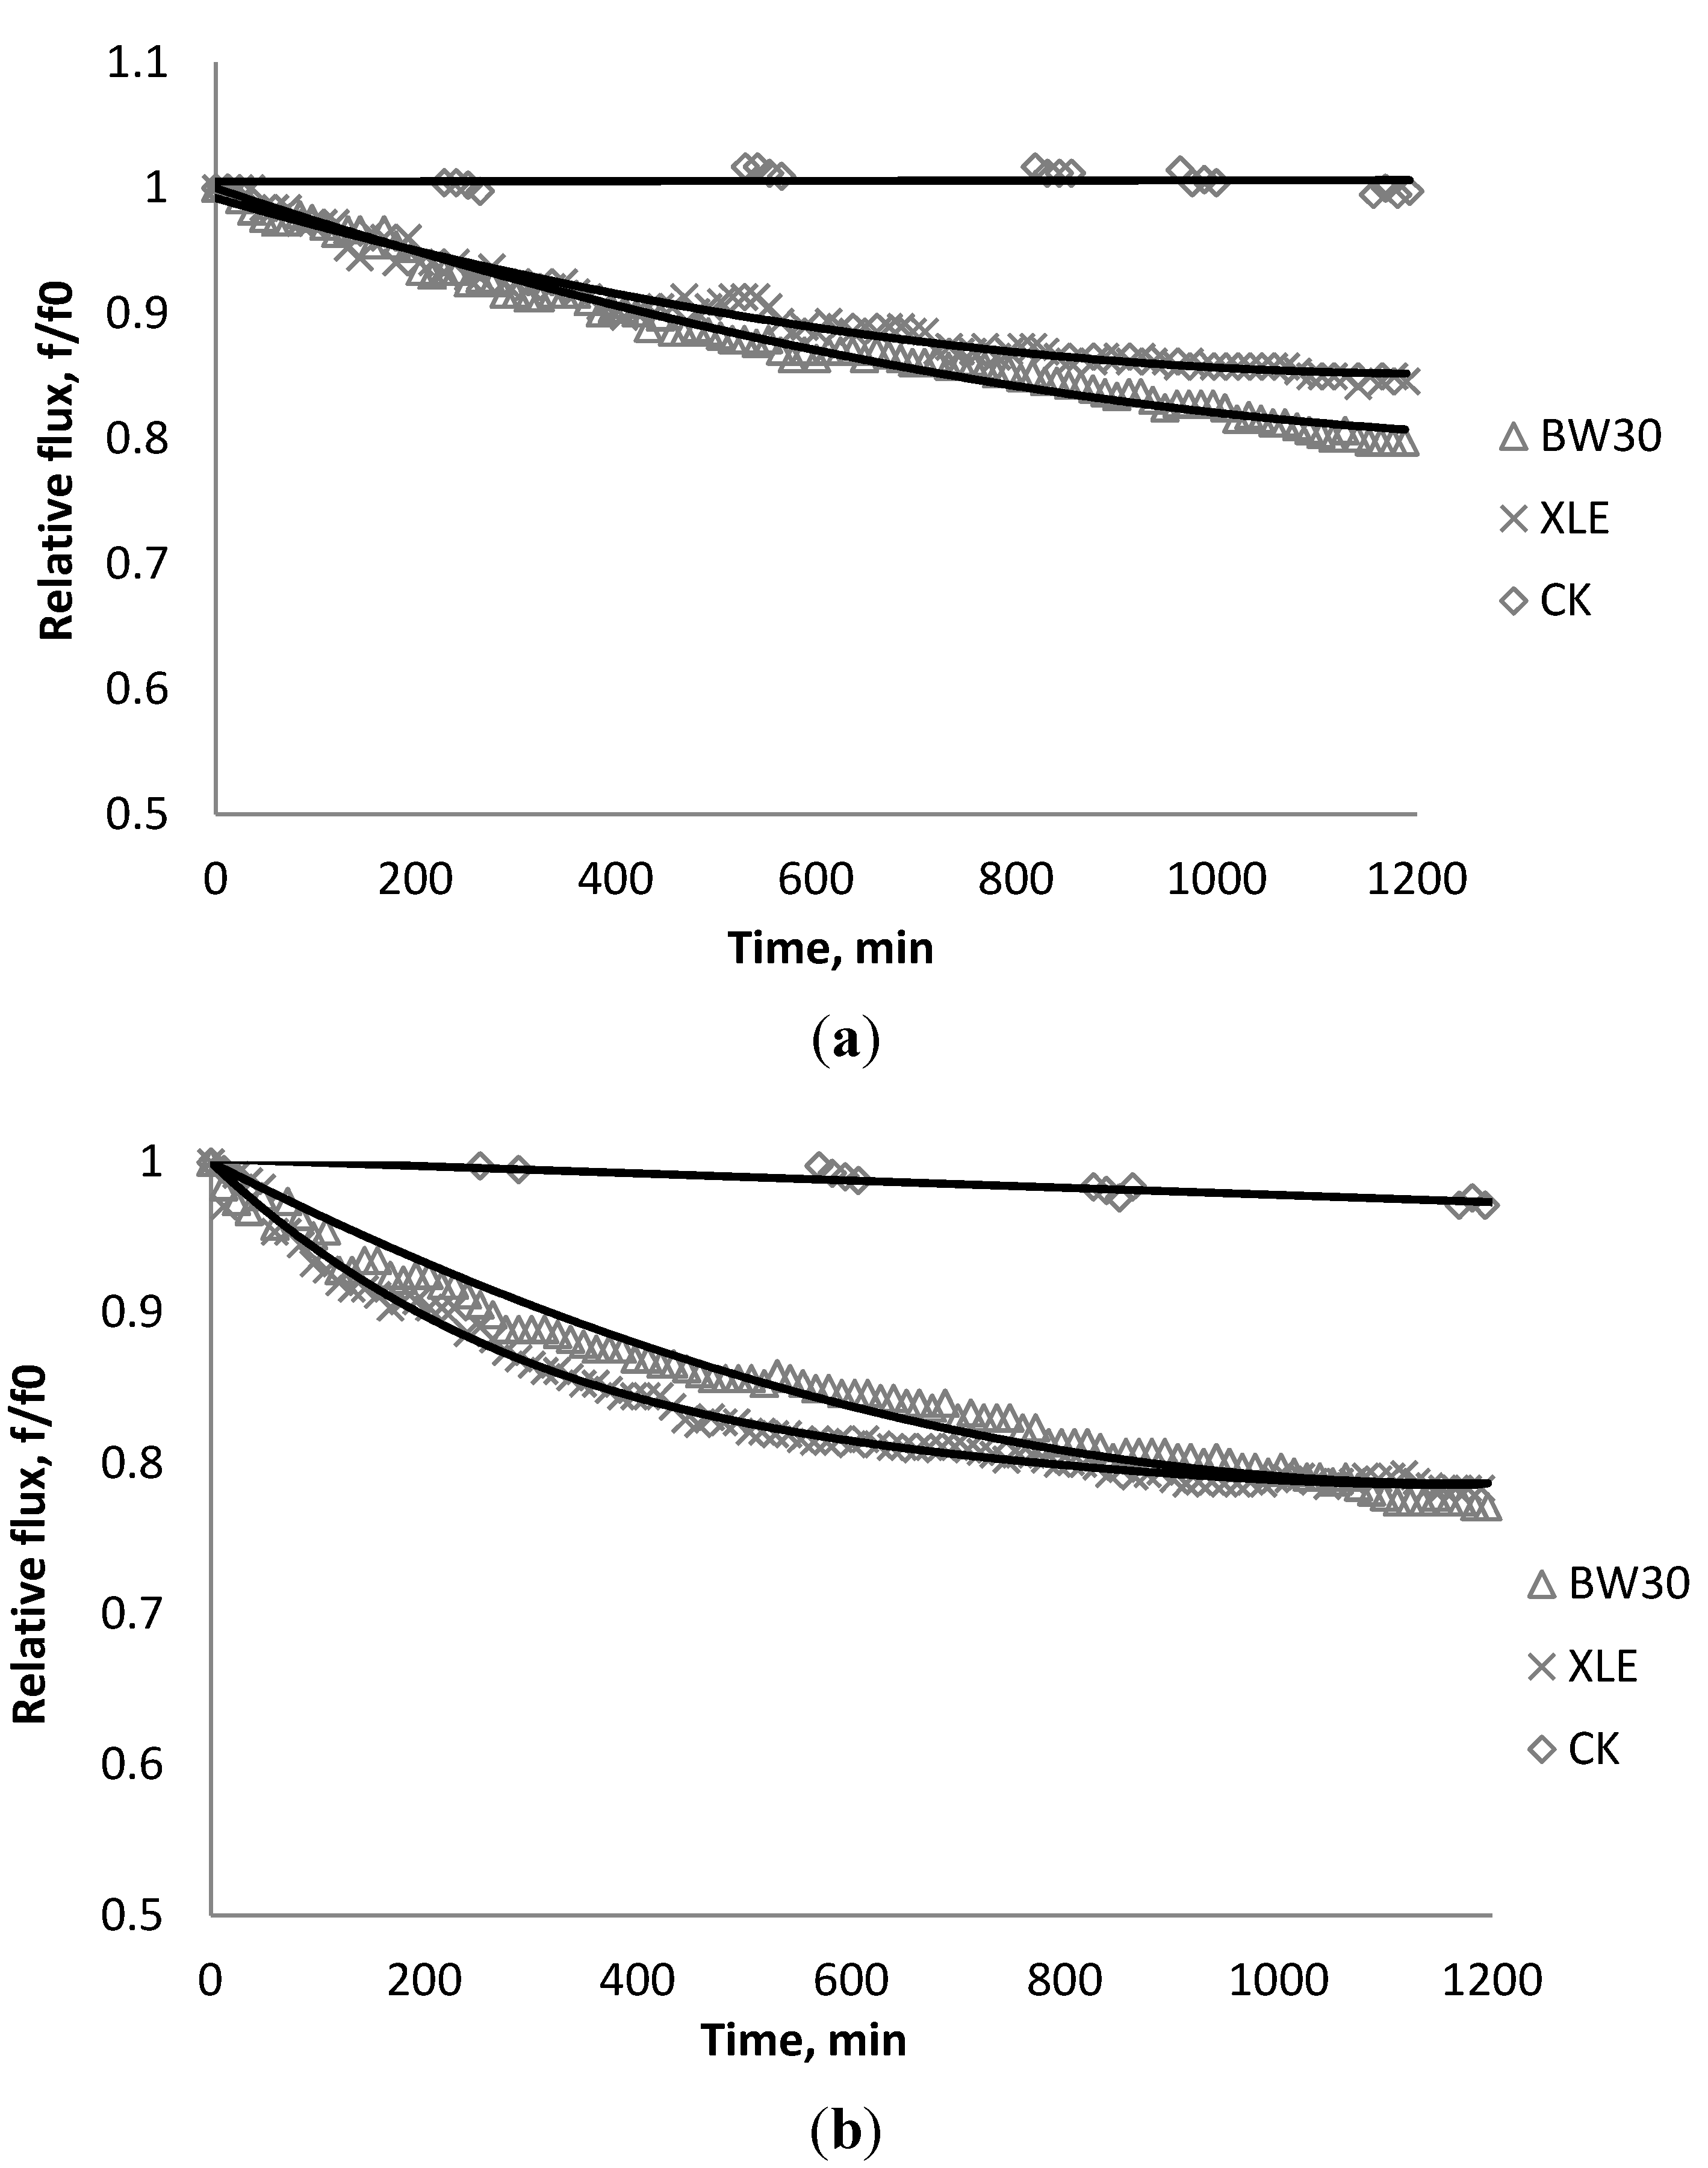
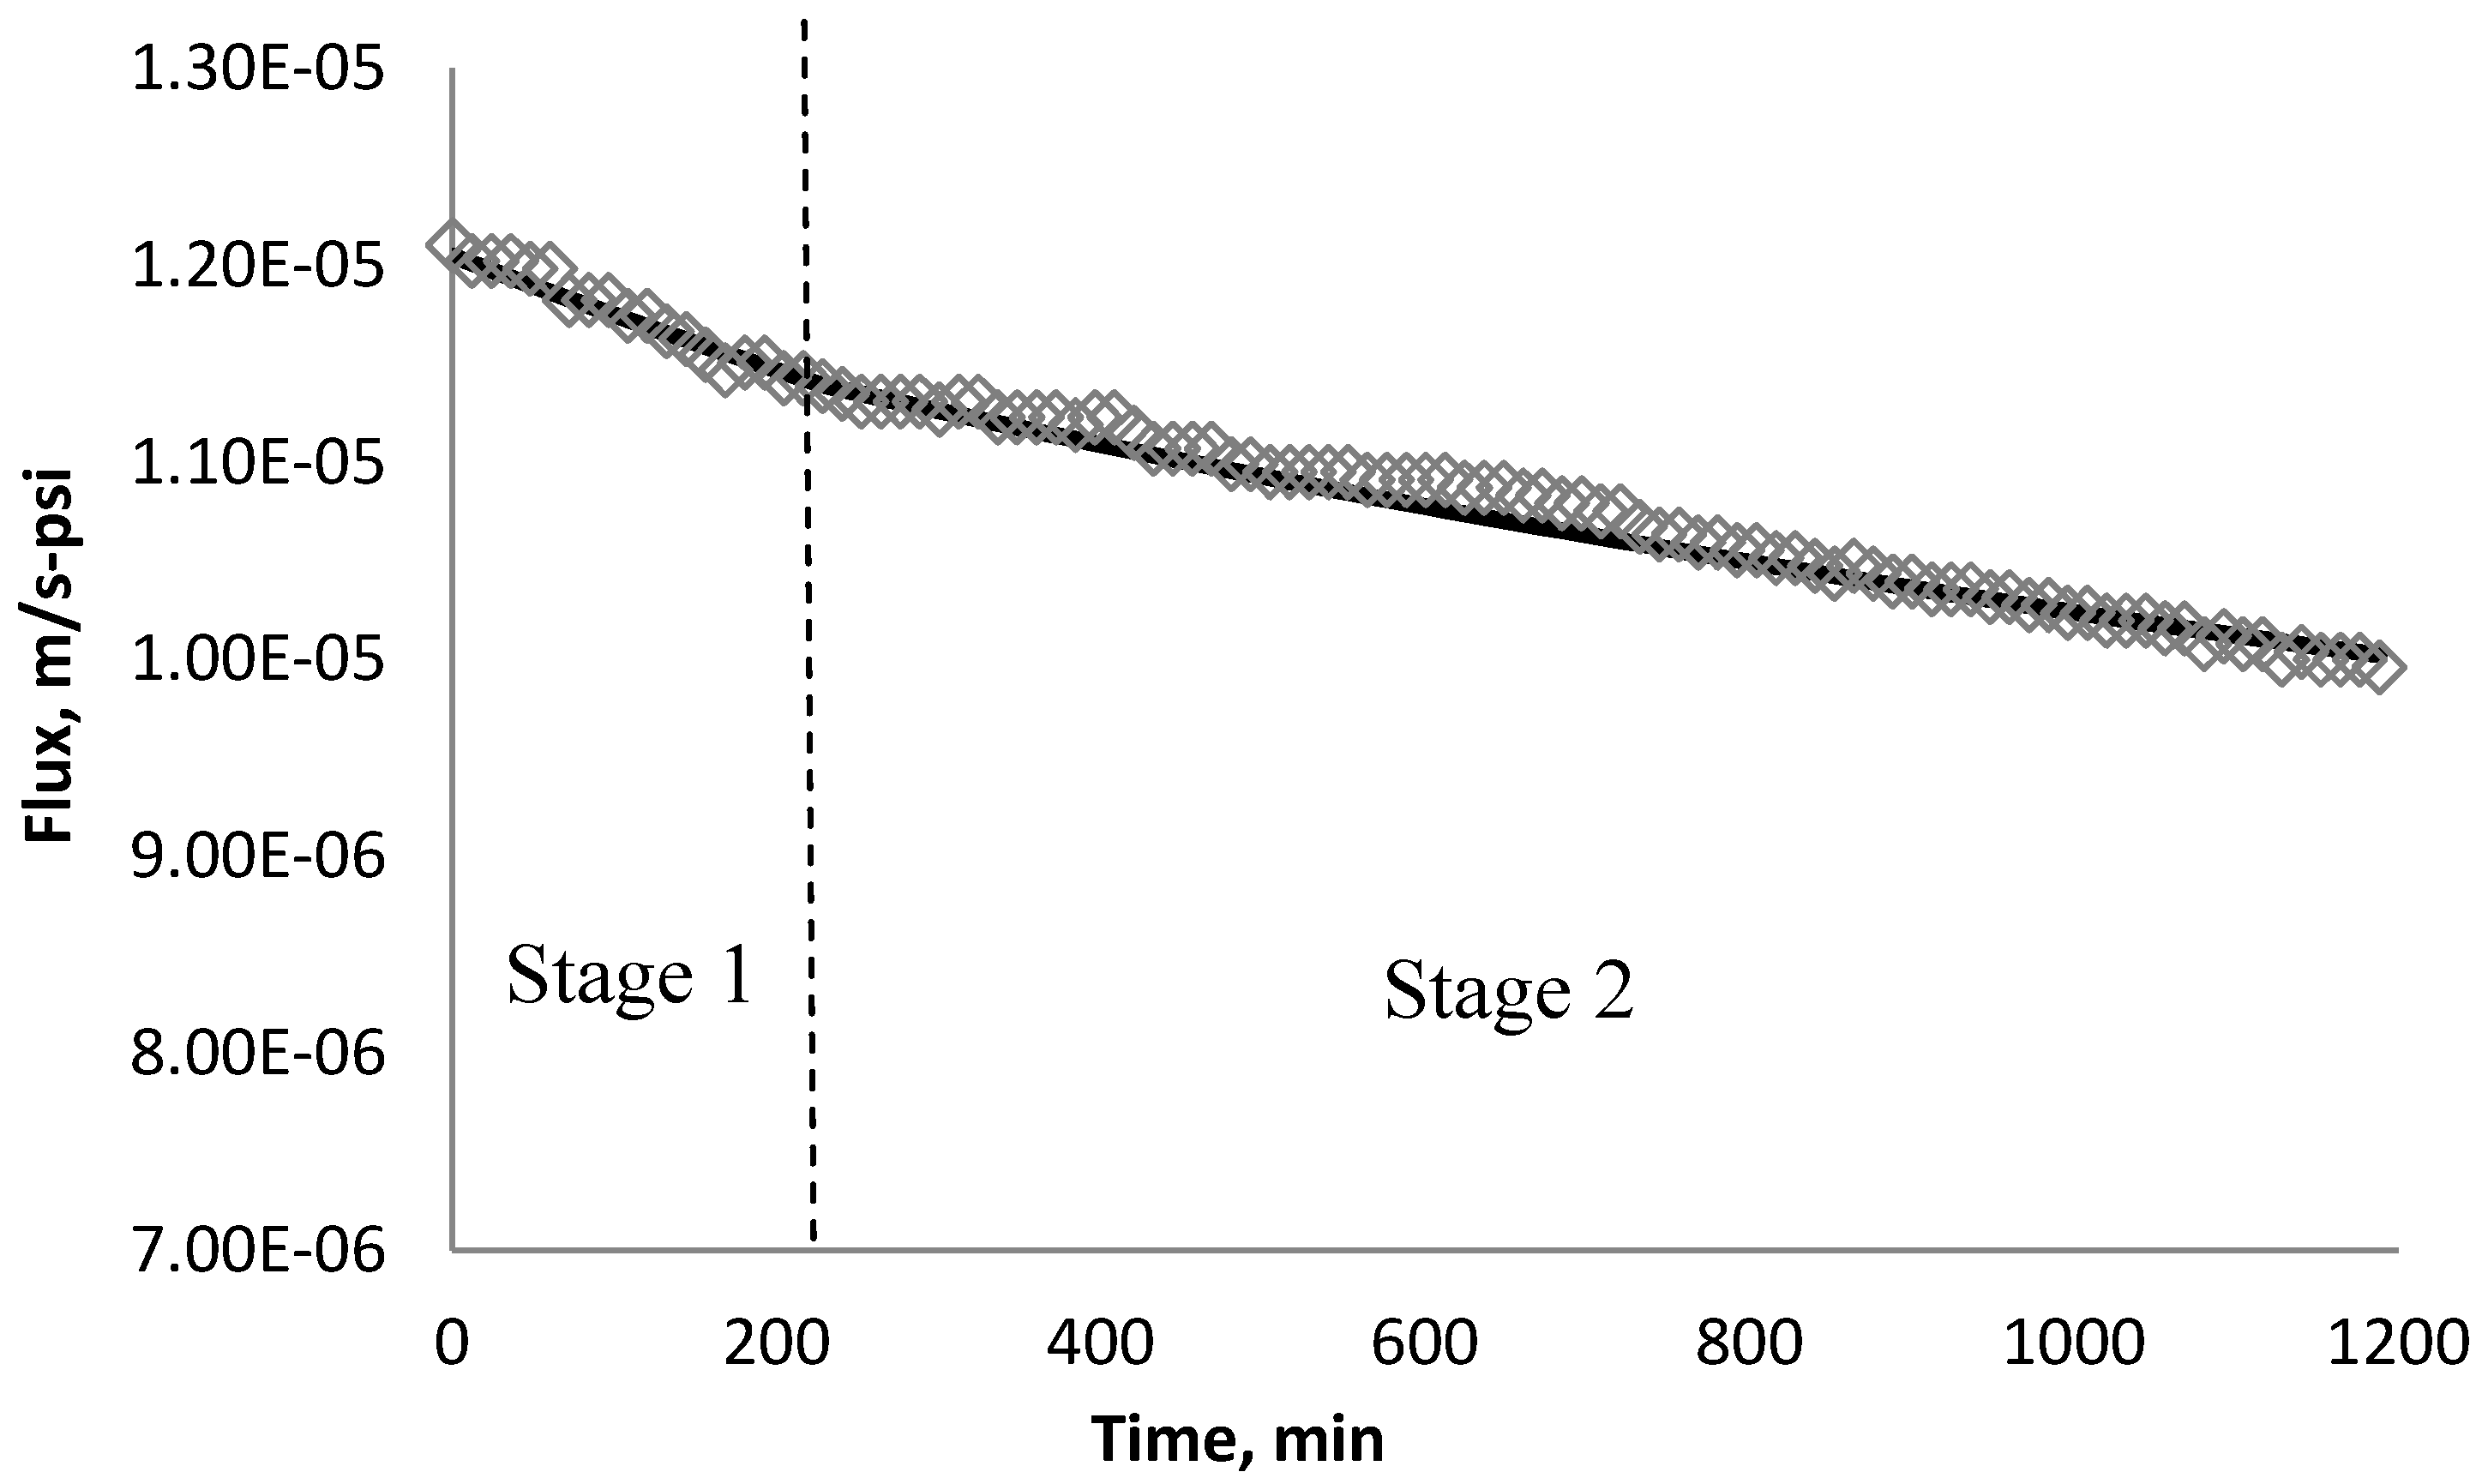
4.5. Comparison of Simulation and Experimental Results


5. Conclusions
Symbols and Abbreviations
| RO | reverse osmosis |
| NF | nanofiltration |
| AFM | atomic force microscopy |
| TMP | trans-membrane pressure |
| RMS | root mean square |
| n | amount of uniform slice for channel discretization |
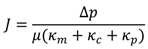
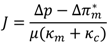
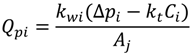
| Δp | transmembrane pressure, psi |
| Pf | feed pressure, psi |
| Pc | concentrate pressure, psi |
| ∆π,∆π∗m | osmotic pressure, psi |
| Qf | feed flow, m3/s |
| Qc | concentration flow, m3/s |
| Qpi | permeate flow, m3/s |
| Qi | flow in the membrane channel, m3/s |
| km, kc, kp | resistance coefficient for membrane, cake layer, and pore constriction |
| µ | dynamic viscosity |
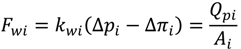
| Fwi | solvent permeate flux, gal/sfd |
| Ji | solute permeate flux, mg/sfd |
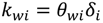
| kwi | solvent mass transfer coefficient, m/s-psi |
| θwi | empirical coefficient |
| δi | overall membrane thickness, m |
| δm | clean membrane thickness, m |
| δc | cake thickness, m |
| k1 | cake growth term |
| k2 | particle back diffusion term |
| dt | time interval, min |
| W | membrane channel width, m |
| H | membrane channel height, m |
| L | membrane channel length, m |
| ρ | density of water, kg/m3 |
| vi | cross flow velocity, m/s |
| k | friction coefficient |
Conflicts of Interest
References
- Liikanen, R.; Yli-Kuivila, J.; Laukkanen, R. Efficiency of various chemical cleanings for nanofiltration membrane fouled by conventionally-treated surface water. J. Membr. Sci. 2002, 195, 265–276. [Google Scholar] [CrossRef]
- Shaalan, H.F. Development of fouling control strategies pertinent to nanofiltration membranes. Desalination 2002, 153, 125–131. [Google Scholar] [CrossRef]
- Kim, S.; Kwak, S.; Sohn, B.; Park, T. Design of TiO2 nanoparticle self-assembled aromatic polyamide thin-film-composite (TFC) membrane as an approach to solve biofouling problem. J. Membr. Sci. 2003, 211, 157–165. [Google Scholar] [CrossRef]
- Belfort, G.; Davis, R.; Zydney, A. The behavior of suspensions and macromolecular solutions in crossflow microfiltration. J. Membr. Sci. 1994, 96, 1–58. [Google Scholar] [CrossRef]
- Boussu, K.; Brlpaire, A.; Volodin, A.; Haesendonck, C.V.; van der Meeren, P.; Vandecasteele, C.; van der Bruggen, B. Influence of membrane and colloid characteristics on fouling of nanofiltration membranes. J. Membr. Sci. 2007, 289, 220–230. [Google Scholar] [CrossRef]
- Norberg, D.; Hong, S.; Taylor, J.; Zhao, Y. Surface characterization and performance evaluation of commercial fouling resistant low-pressure RO membranes. Desalination 2007, 202, 45–52. [Google Scholar] [CrossRef]
- Zhu, X.; Elimelech, M. Colloidal fouling of reverse osmosis membranes: Measurements and fouling mechanism. Environ. Sci. Technol. 1997, 31, 3654–3662. [Google Scholar] [CrossRef]
- Tarabara, V.; Koyuncu, I.; Wiesner, M. Effect of hydrodynamics and solution ionic strength on permeate flux in cross-flow filtration: Direct experimental observation of filter cake cross-sections. J. Membr. Sci. 2004, 241, 65–78. [Google Scholar] [CrossRef]
- Zhang, M.; Song, L. Mechanisms and parameters affecting flux decline in cross-flow microfiltration and ultrafiltration of colloids. Environ. Sci. Technol. 2004, 34, 3767–3773. [Google Scholar] [CrossRef]
- Lee, S.; Cho, J.; Elimelech, M. Combined influence of natural organic matter and colloid particles on nanofiltration membrane fouling. J. Membr. Sci. 2005, 262, 27–41. [Google Scholar] [CrossRef]
- Singh, G.; Song, L. Quantifying the effect of ionic strength on colloidal fouling potential in membrane filtration. J. Colloid Interface Sci. 2005, 284, 630–638. [Google Scholar] [CrossRef]
- Lee, S.; Cho, J.; Elimelech, M. Influence of colloidal fouling and feed water recovery on salt rejection of reverse osmosis and nanofiltration membranes. Desalination 2004, 160, 1–12. [Google Scholar] [CrossRef]
- Vrijenhoek, E.M.; Hong, S.; Elimelech, M. Influence of membrane surface properties on initial rate of colloidal fouling of reverse osmosis and nanofiltration membranes. J. Membr. Sci. 2001, 188, 115–128. [Google Scholar] [CrossRef]
- Madaeni, S.; Ghaemi, N. Characterization of self-cleaning RO membranes coated with TiO2 particles under UV irradiation. J. Membr. Sci. 2007, 303, 221–233. [Google Scholar] [CrossRef]
- Bae, T.-H.; Tak, T.-M.T. Preparation of TiO2 self-assembled polymeric nanocomposite membranes and examination of their fouling mitigation effects in a membrane bioreactor system. J. Membr. Sci. 2005, 266, 1–5. [Google Scholar] [CrossRef]
- Cao, X.; Ma, J.; Shi, X.; Ren, Z. Effect of TiO2 nanoparticle size on the performance of PVDF membrane. Appl. Surf. Sci. 2006, 253, 2003–2010. [Google Scholar] [CrossRef]
- Razmjou, A.; Mansouri, J.; Chen, V. The effects of mechanical and chemical modification of TiO2 nanoparticles on the surface chemistry, structure and fouling performance of PES ultrafiltration membranes. J. Membr. Sci. 2011, 378, 73–84. [Google Scholar] [CrossRef]
- Crittenden, J.C.; Trussell, R.R.; Hand, D.W. Water Treatment Principles and Design; Jonh Wiley & Sons. Inc.: Hoboken, NJ, USA, 2012. [Google Scholar]
- Hoek, E.M.; Elimelech, M. Cake-enhanced concentration polarization: A new fouling mechamism for salt-rejecting membranes. Environ. Sci. Technol. 2003, 37, 5581–5588. [Google Scholar] [CrossRef]
- Mohammadi, T.; Kazeminoghadam, M.; Saadabadi, M. Modeling of membrane fouling and flux decline in reverse osmosis during separation of oil in water emulasions. Desalination 2003, 157, 369–375. [Google Scholar] [CrossRef]
- Lim, A.; Bai, R. Membrane fouling and cleaning in microfiltration of activated sludge wastewater. J. Membr. Sci. 2003, 216, 279–290. [Google Scholar] [CrossRef]
- Bolton, G.; LaCasse, D.; Kuriyel, R. Combined models of membranes fouling: Development and application to microfiltration and ultrafiltration of biological fluids. J. Membr. Sci. 2006, 277, 75–84. [Google Scholar] [CrossRef]
- Sioutopoulos, S.G.; Yiantsios, D.G.; Karabelas, A.J. Relation between fouling characteristics of RO and UF membranes in experiments with colloidal organic and inorganic species. J. Membr. Sci. 2010, 350, 62–82. [Google Scholar] [CrossRef]
- Elimelech, M.; Zhu, X.; Childress, A.E.; Hong, S. Role of membrane surface morphology in colloidal fouling of cellulose acetate and composite aromatic polyamide reverse osmosis membranes. J. Membr. Sci. 1997, 127, 101–109. [Google Scholar] [CrossRef]
- Wiesner, M.; Veerapaneni, S.; Brejchova, D. Improvements in Membrane Microfiltration Using Coagulation Pretreatment. In Chemical Water and Wastewater Treatment; Hahn, H., Klute, R., Eds.; Springer Verlag: Berlin, Germany, 1992. [Google Scholar]
- Fang, Y.; Duranceau, S.J. Comparison of Non-Homogeneous and Homogeneous Mass Transfer in Reverse Osmosis Membrane Processes. Desalin. Water Treat. 2013, in press. [Google Scholar]
- Bouchard, C.R.; Carreau, P.J.; Matsuura, T.; Sourirajan, S. Modeling of ultrafiltration: Prediction of concentration polarization effect. J. Membr. Sci. 1994, 97, 215–229. [Google Scholar] [CrossRef]
© 2013 by the authors; licensee MDPI, Basel, Switzerland. This article is an open access article distributed under the terms and conditions of the Creative Commons Attribution license (http://creativecommons.org/licenses/by/3.0/).
Share and Cite
Fang, Y.; Duranceau, S.J. Study of the Effect of Nanoparticles and Surface Morphology on Reverse Osmosis and Nanofiltration Membrane Productivity. Membranes 2013, 3, 196-225. https://doi.org/10.3390/membranes3030196
Fang Y, Duranceau SJ. Study of the Effect of Nanoparticles and Surface Morphology on Reverse Osmosis and Nanofiltration Membrane Productivity. Membranes. 2013; 3(3):196-225. https://doi.org/10.3390/membranes3030196
Chicago/Turabian StyleFang, Yuming, and Steven J. Duranceau. 2013. "Study of the Effect of Nanoparticles and Surface Morphology on Reverse Osmosis and Nanofiltration Membrane Productivity" Membranes 3, no. 3: 196-225. https://doi.org/10.3390/membranes3030196