
Surface Interactions and Nanoconfinement of Methane and Methane plus CO2 Revealed by High-Pressure Magic Angle Spinning NMR Spectroscopy and Molecular Dynamics


Abstract
:1. Introduction
Background and Objectives
2. Materials and Methods
2.1. Materials
2.2. Nuclear Magnetic Resonance
2.3. Molecular Simulations
3. Results
3.1. Methane Behavior
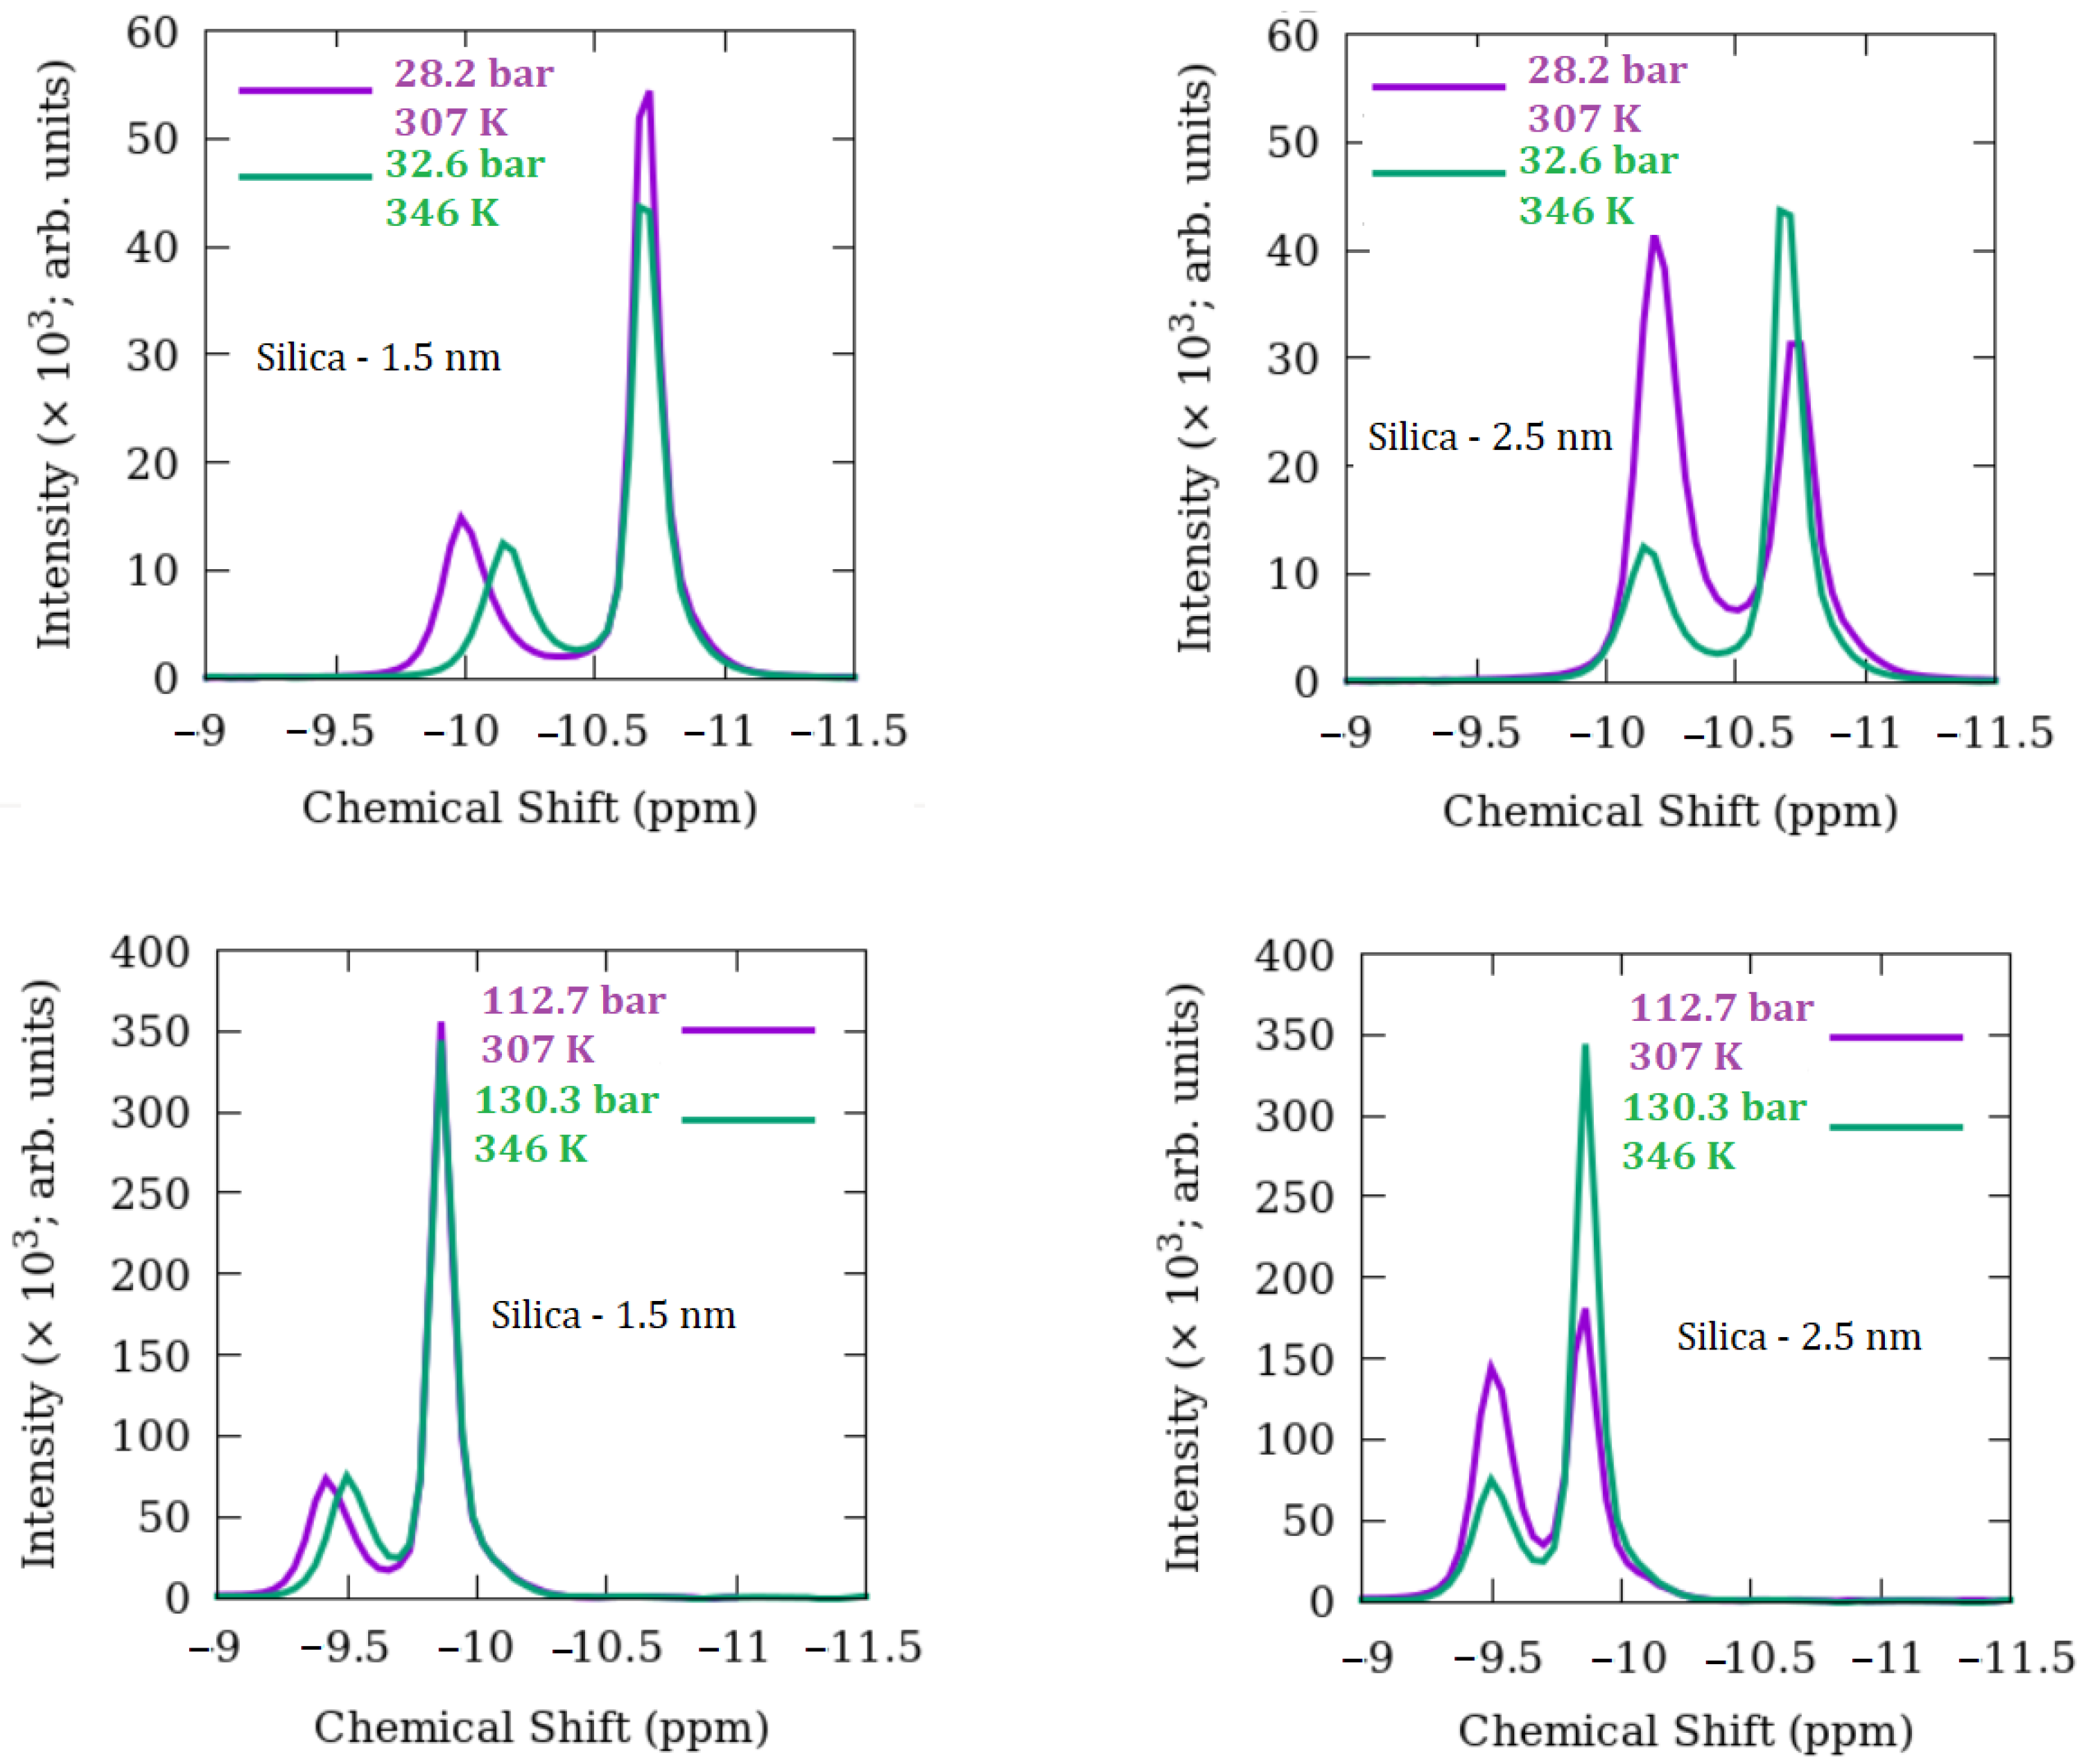
- Generally, bulk-like methane intensities are greater than confined peaks and greater with increased pressure except for 28.2 bar for 2.5 nm silica.
- Comparing the two silica materials, the confined methane intensities are greater for 2.5 nm versus 1.5 nm silica, and this difference is more pronounced at the lowest pressure of 28.2 bar.
- For the 2.5 nm silica, the bulk-like intensities become progressively more subordinate at the lower pressure conditions, whereas the confined intensities tend to be greater. An opposite trend is observed for the bulk-like methane in 1.5 nm silica.
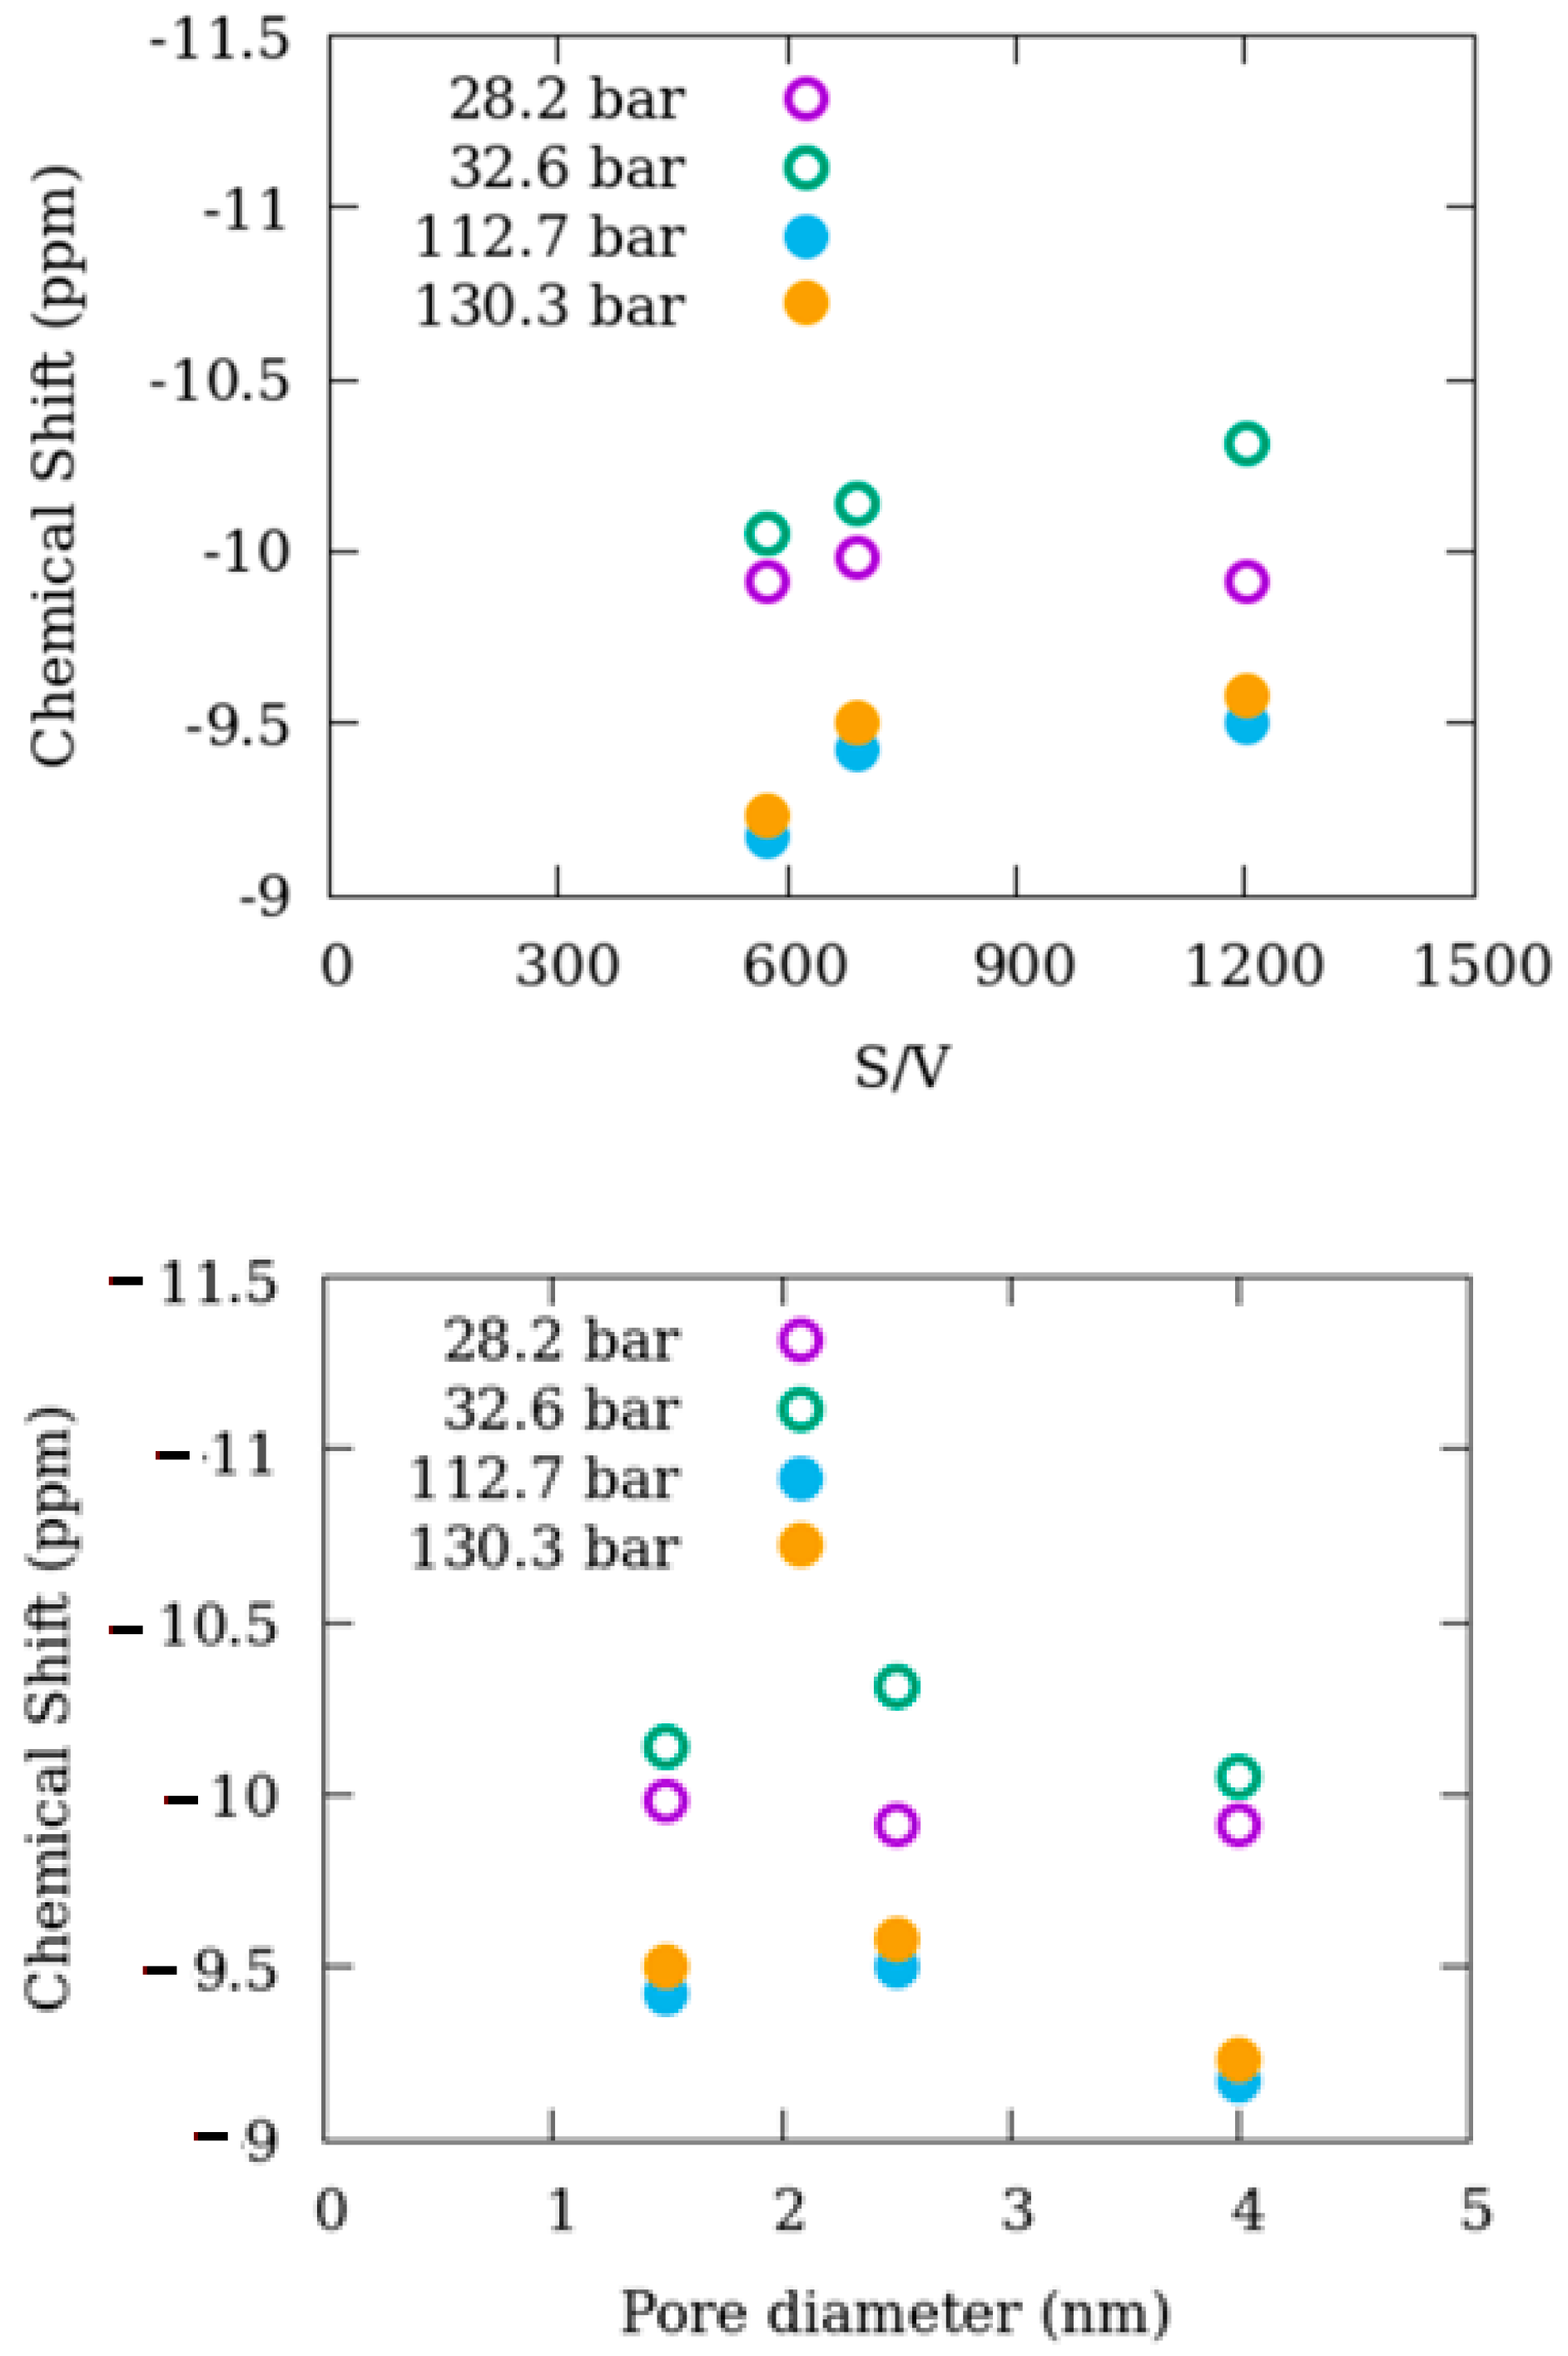
- The 13C shifts for pure bulk methane become less negative with increasing temperature and pressure,
- For most temperature-pressure conditions, bulk-like 13C shifts become more negative for both nanoporous silicas compared to pure methane except at 373 K, >130.3 bar,
- The 13C shifts for the 1.5 and 2.5 nm silica are nearly the same for the common pressure conditions measured,
- For both 1.5 and 2.5 nm silica, 13C shifts for confined methane are always less negative compared to bulk-like methane,
- For a given temperature, increasing pressure leads to progressively smaller differences between bulk-like and confined methane 13C shifts,
- In general, the differences in 13C shifts between bulk-like and confined methane decrease with increasing temperature and pressure for each silica system,
- Comparing both silica materials, there is a tendency for the difference in 13C shifts between bulk-like and confined methane to be slightly smaller for the 2.5 nm silica versus 1.5 nm silica.
3.2. Methane-CO2 Behavior
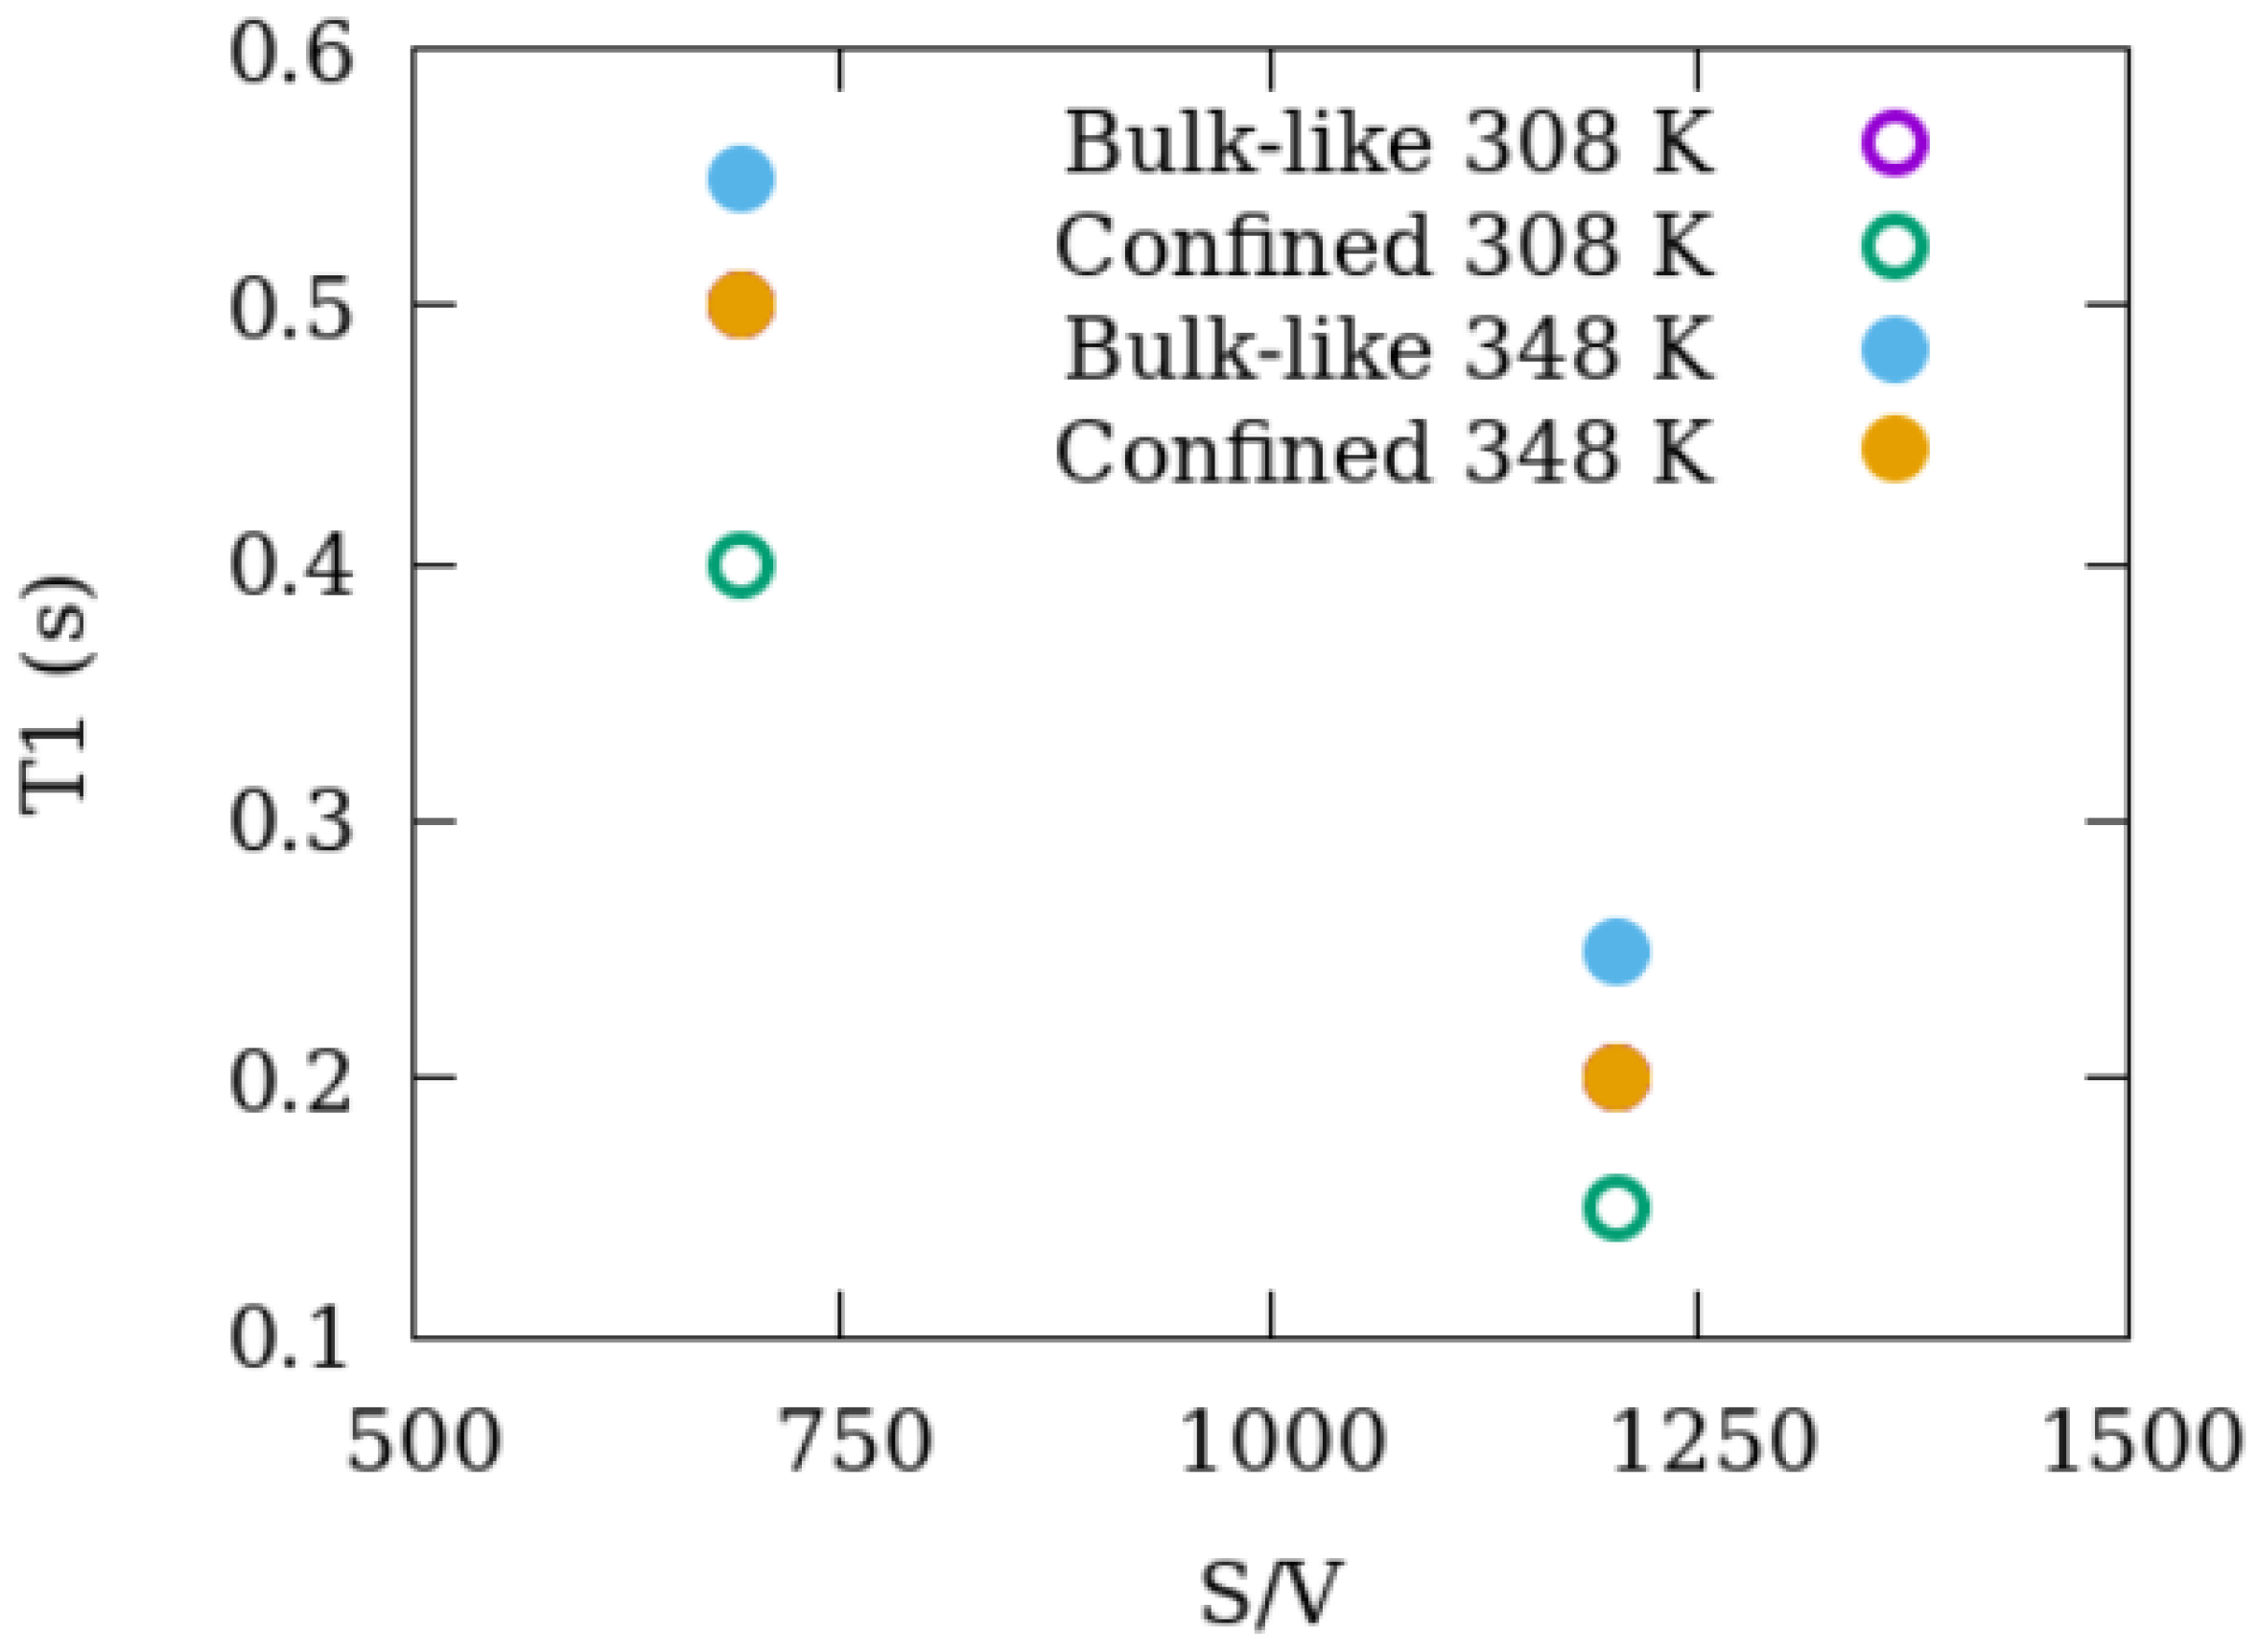
3.3. Dynamics of Methane as Revealed by NMR T1 Relaxation
3.4. Molecular Simulations
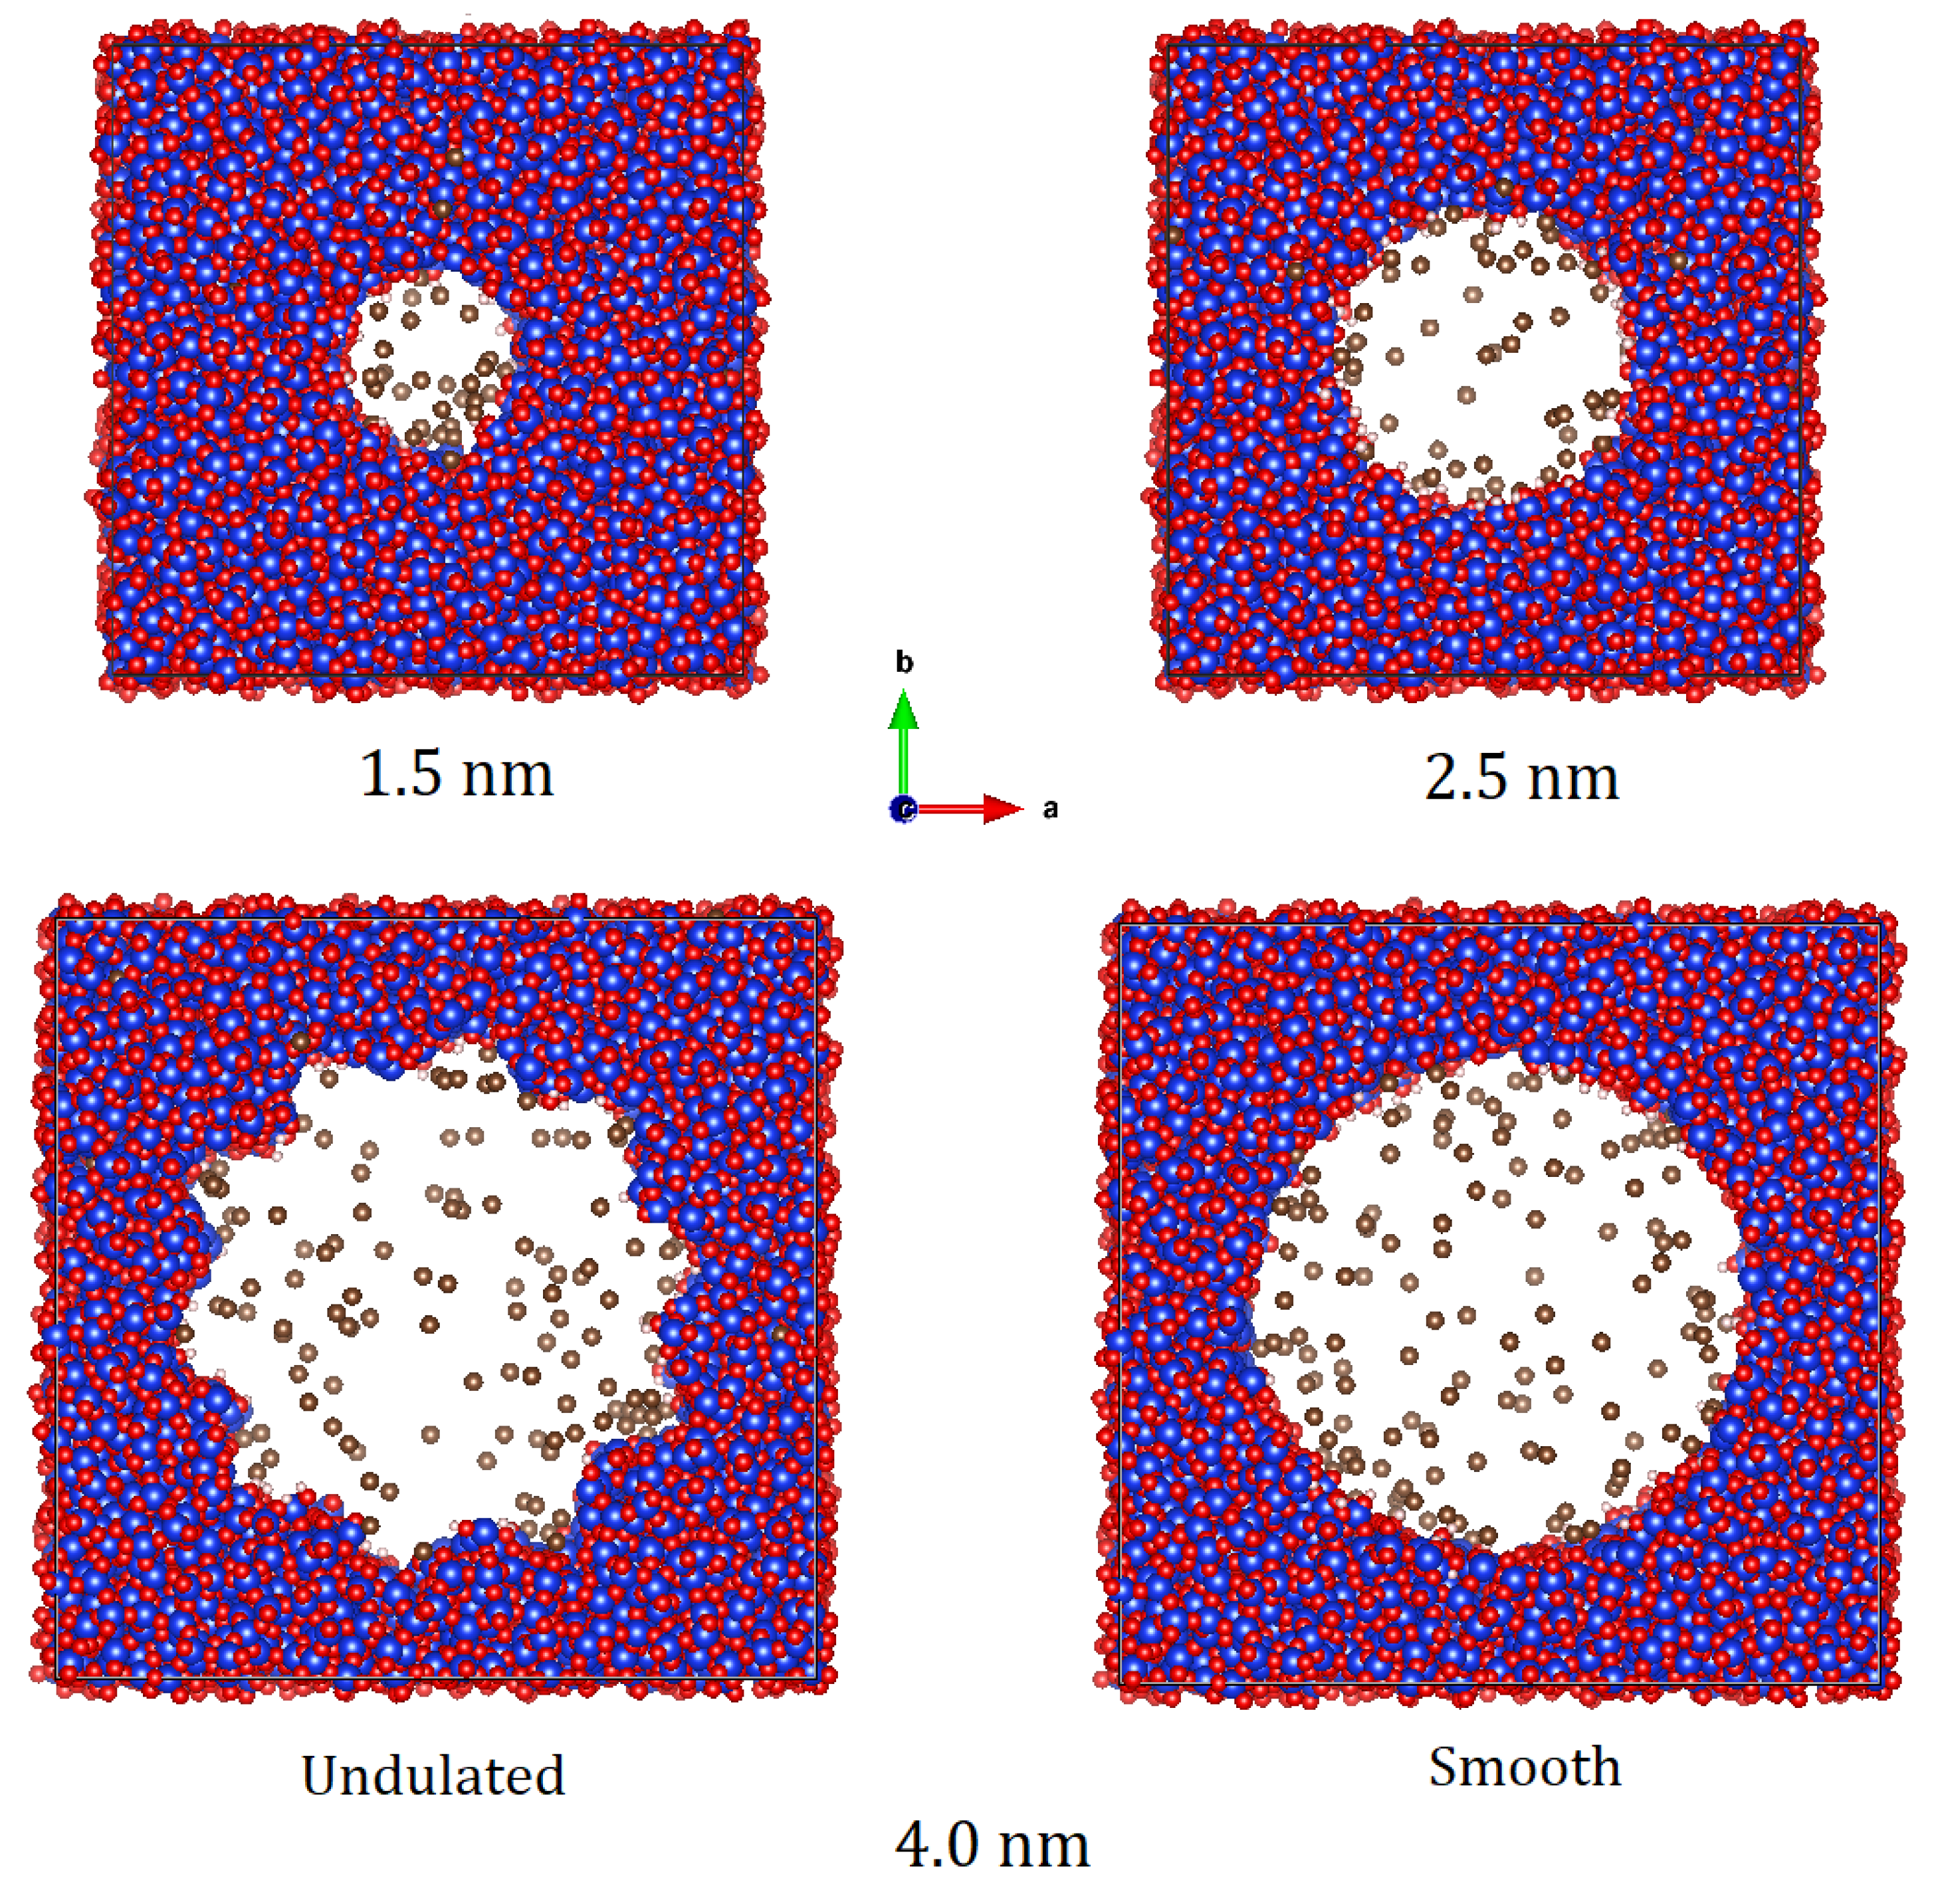
3.4.1. Structure
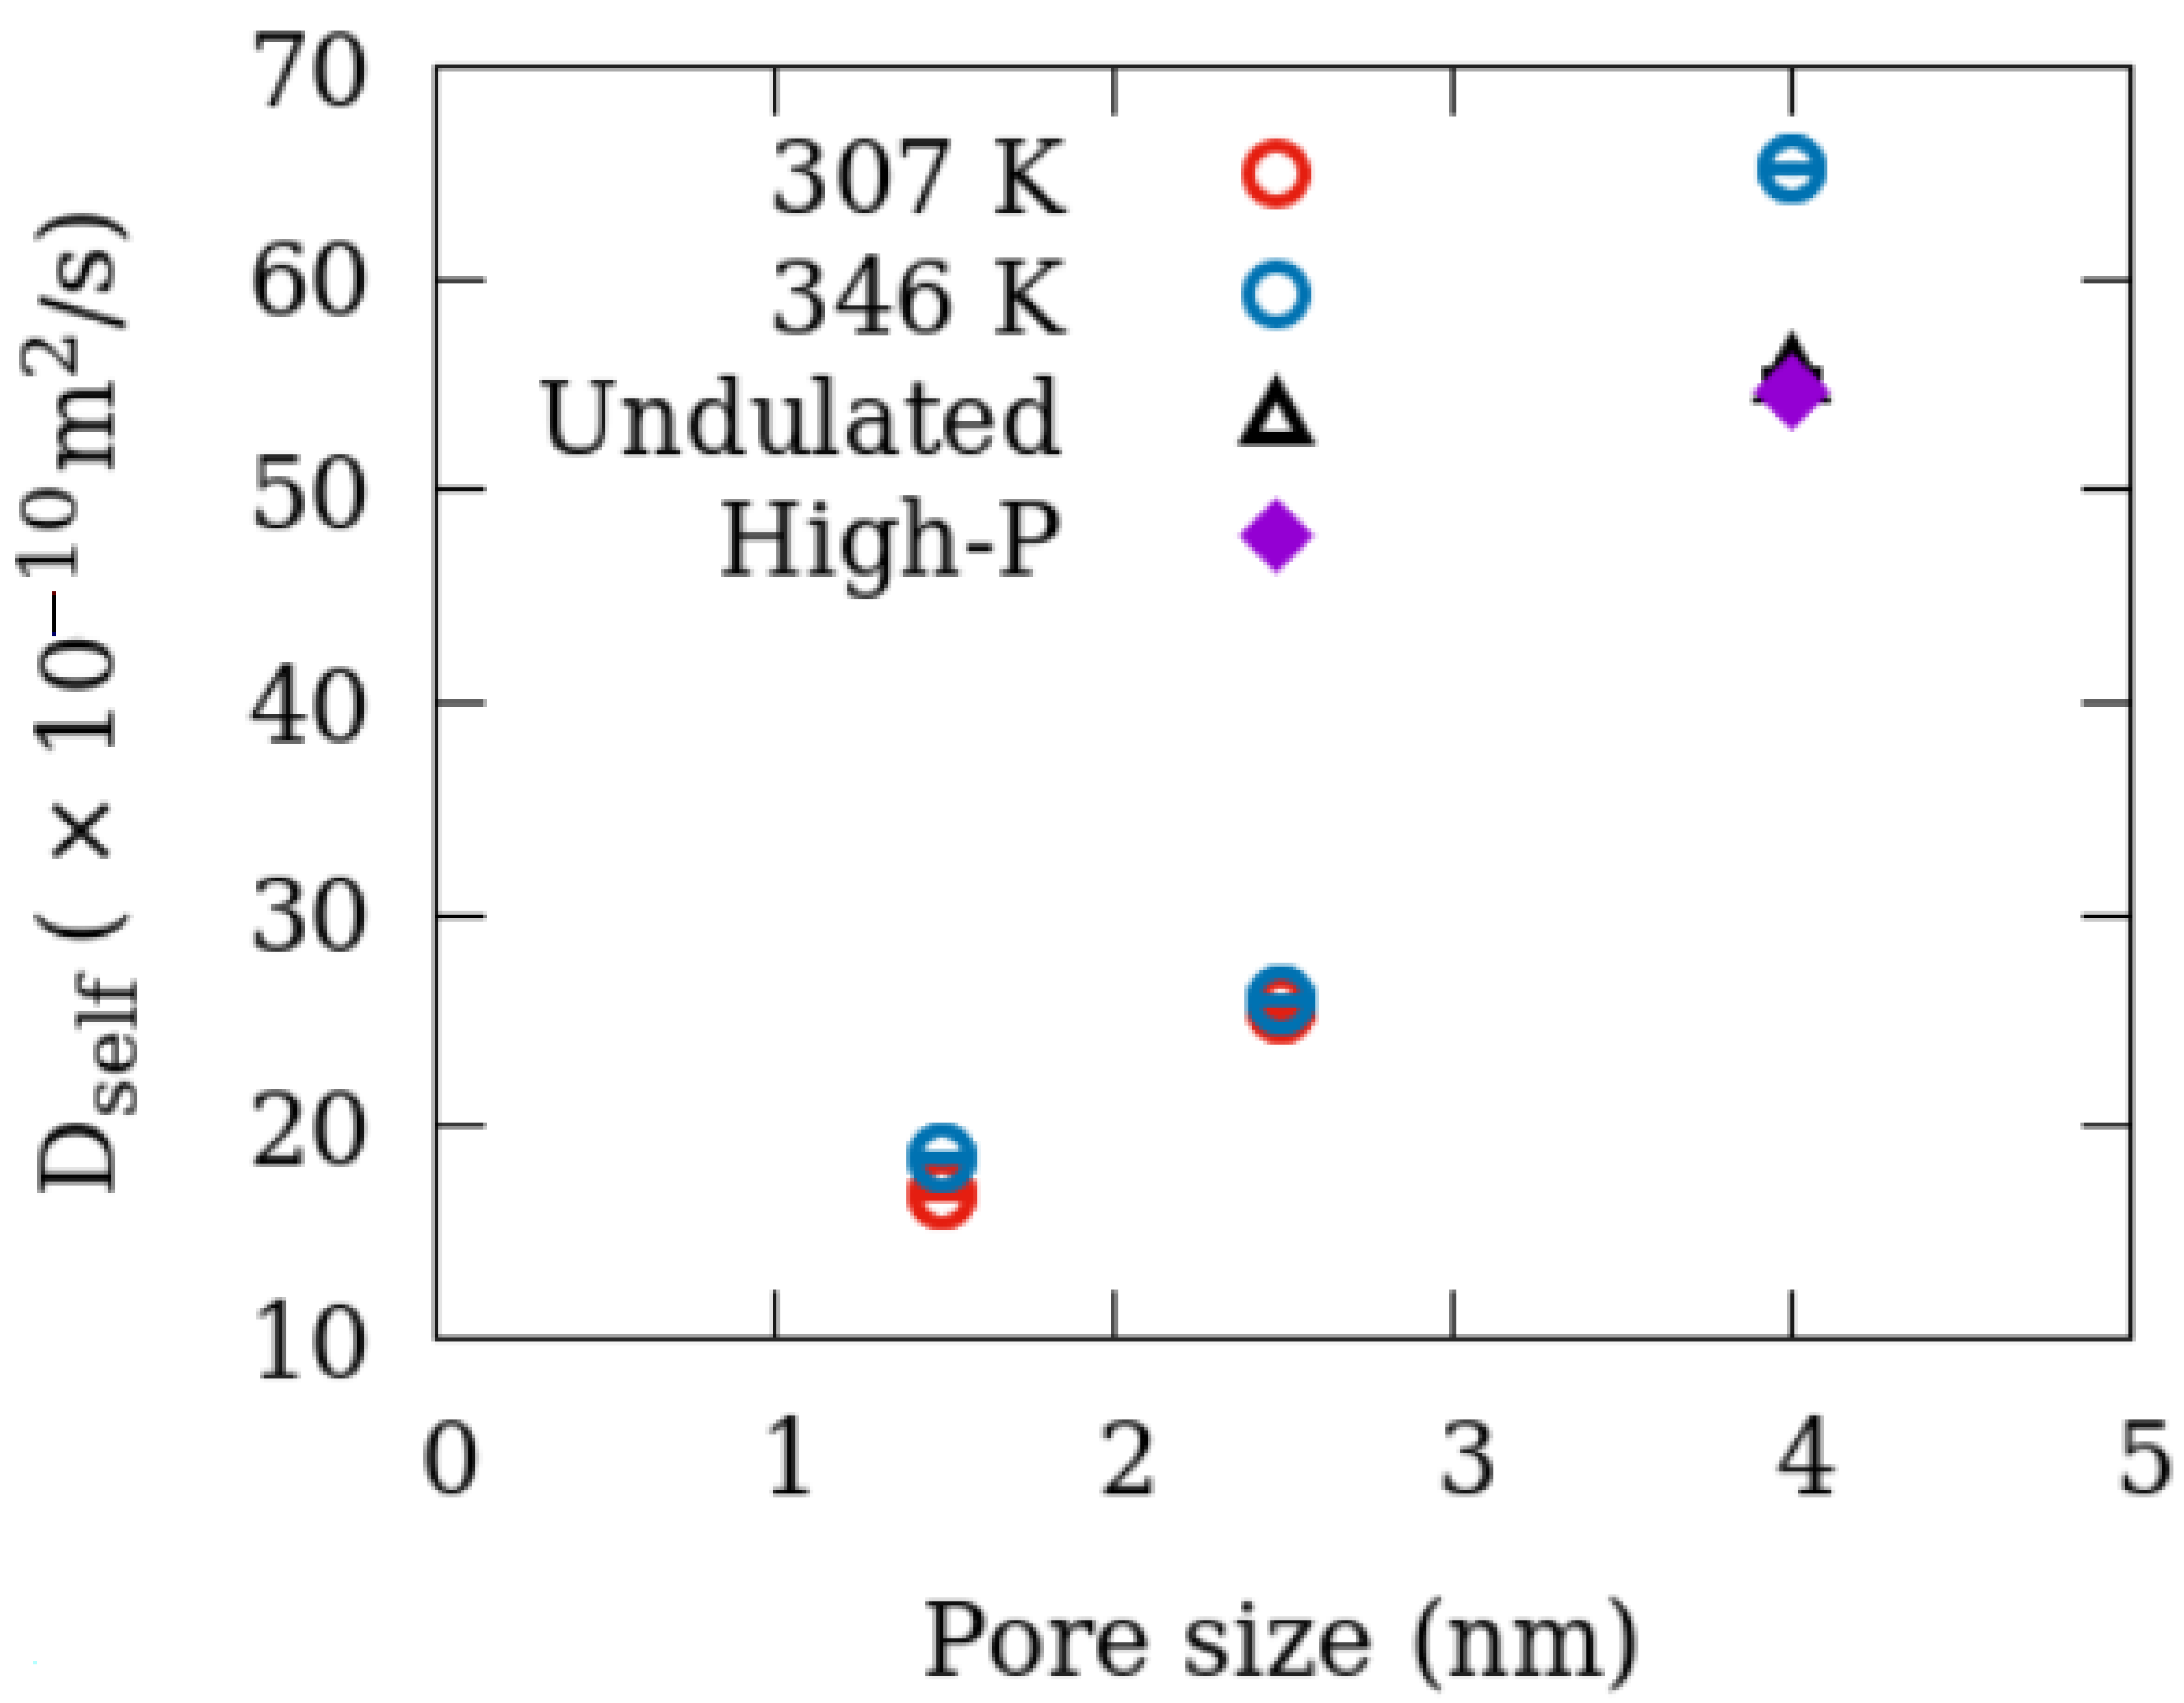
3.4.2. Dynamics
4. Discussion
5. Conclusions
Author Contributions
Funding
Institutional Review Board Statement
Data Availability Statement
Acknowledgments
Conflicts of Interest
References
- Gelb, L.D.; Gubbins, K.E.; Radhakrishnan, R.; Sliwinska-Bartkowiak, M. Phase Separation in Confined Systems. Rep. Prog. Phys. 1999, 62, 1573–1659. [Google Scholar] [CrossRef] [Green Version]
- Cole, D.R.; Arthur, M.A. Unconventional Hydrocarbons. Elements 2014, 10, 257–296. [Google Scholar]
- Ambrose, R.J.; Hartman, R.C.; Campos, M.D.; Akkutlu, I.Y.; Sondergeld, K. New Pore-scale Considerations for Shale Gas in Place Calculations. In Proceedings of the SPE Unconventional Gas Conference, Pittsburgh, PA, USA, 23–25 February 2010. [Google Scholar]
- Ruhle, B.; Davies, M.; Lebold, T.; Brauchle, C.; Bein, T. Highly Oriented Mesoporous Silica Channels Synthesized in Microgrooves and Visualized with Single-molecule Diffusion. ACS Nano 2012, 6, 1948–1960. [Google Scholar] [CrossRef]
- Yethiraj, A.; Striolo, A. Fracking: What Can Physical Chemistry Offer? J. Phys. Chem. Lett. 2013, 4, 687–690. [Google Scholar] [CrossRef] [PubMed]
- Gautam, S.S.; Ok, S.; Cole, D.R. Structure and Dynamics of Confined COH Fluids Relevant to the Subsurface: Application of Magnetic Resonance, Neutron Scattering, and Molecular Dynamics Simulations. Front. Earth Sci. 2017, 5, 43. [Google Scholar] [CrossRef] [Green Version]
- Singer, P.M.; Asthagiri, D.; Chapman, W.G.; Hirasaki, G.J. NMR Spin-rotation Relaxation and Diffusion of Methane. J. Chem. Phys. 2018, 148, 204504. [Google Scholar] [CrossRef] [Green Version]
- Siderius, D.W.; Krekelberg, W.P.; Chiang, W.S.; Shen, V.K.; Liu, Y. Quasi-two-dimensional Phase Transition of Methane Adsorbed in Cylindrical Silica Mesopores. Langmuir 2017, 33, 14252–14262. [Google Scholar] [CrossRef]
- Koskela, T.; Ylihautala, M.; Vaara, J.; Jokisaari, J. 13C NMR Spectroscopy of Methane Adsorbed in SAPO-11 Molecular Sieve. Chem. Phys. Lett. 1996, 261, 425–430. [Google Scholar] [CrossRef]
- Koskela, T.; Ylihautala, M.; Jokisaari, J.; Vaara, J. C-13 NMR of Methane in an AlPO4-11 Molecular Sieve: Exchange Effects and Shielding Anisotropy. Phys. Rev. B 1998, 58, 14833–14836. [Google Scholar] [CrossRef]
- Fleyfel, F.; Song, K.Y.; Kook, A.; Martin, R.; Kobayashi, R. Interpretation of C-13 NMR of Methane Propane Hydrates in the Metastable Nonequilibrium Region. J. Phys. Chem. 1993, 97, 6722–6725. [Google Scholar] [CrossRef]
- De La Fuente, M.; Vanuat, J.; Marin-Moreno, H. A Densification Mechanism to Model the Mechanical Effect of Methane Hydrates in Sandy Sediments. Int. J. Numer. Anal. Methods Geomech. 2019, 44, 782–802. [Google Scholar] [CrossRef]
- Hoyt, D.W.; Turcu, R.V.F.; Sears, J.A.; Rosso, K.M.; Burton, S.D.; Felmy, A.R.; Hu, J.Z. High-pressure Magic Angle Spinning Nuclear Magnetic Resonance. J. Magn. Reson. 2011, 212, 378–385. [Google Scholar] [CrossRef] [PubMed]
- Turcu, R.V.F.; Hoyt, D.W.; Rosso, K.M.; Sears, J.A.; Loring, J.S.; Felmy, A.R.; Hu, J.Z. Rotor Design for High Pressure Magic Angle Spinning Nuclear Magnetic Resonance. J. Magn. Reson. 2013, 226, 64–69. [Google Scholar] [CrossRef] [PubMed]
- Ok, S.; Hoyt, D.; Andersen, A.; Sheets, J.; Welch, S.; Cole, D.; Mueller, K.; Washton, N. Surface Interactions and Confinement of Methane: A High Pressure Magic Angle Spinning NMR and Computational Chemistry Study. Langmuir 2017, 33, 1359–1367. [Google Scholar] [CrossRef]
- Polenova, T.; Gupta, R.; Goldbourt, A. Magic Angle Spinning NMR Spectroscopy: A Versatile Technique for Structural and Dynamic Analysis of Solid-Phase Systems. Anal. Chem. 2015, 87, 5458–5469. [Google Scholar] [CrossRef] [Green Version]
- Chen, P.-H.; Gao, C.; Price, L.E.; Urban, M.A.; Popp, T.M.O.; Barnes, A.B. Two Millimeter Diameter Spherical Rotors Spinning at 68 kHz for MAS NMR. J. Magn. Res. 2021, 8–9, 100015. [Google Scholar] [CrossRef]
- Miyoshi, T.; Takegoshi, K.; Terao, T. A Simple Method for 13C CPMAS NMR Measurements under High Gas Pressures. J. Magn. Reson. 1997, 125, 383–384. [Google Scholar] [CrossRef]
- Teresa Deuchande, T.; Breton, O.; Haedelt, J.; Hughes, E. Design and Performance of a High Pressure Insert for Use in a Standard Magic Angle Spinning NMR Probe. J. Magn. Reson. 2006, 183, 178–182. [Google Scholar] [CrossRef]
- Bowers, G.M.; Schaef, H.T.; Loring, J.S.; Hoyt, D.W.; Burton, S.D.; Walter, E.D.; Kirkpatrick, R.J. Role of Cations in CO2 Adsorption, Dynamics, and Hydration in Smectite Clays under In Situ Supercritical CO2 Conditions. J. Phys. Chem. C 2017, 121, 577–592. [Google Scholar] [CrossRef]
- Bowers, G.M.; Schaef, H.T.; Miller, Q.R.S.; Walter, E.D.; Burton, S.D.; Hoyt, D.W.; Horner, J.A.; Loring, J.S.; McGrail, B.P.; Kirkpatrick, R.J. 13C Nuclear Magnetic Resonance Spectroscopy of Methane and Carbon Dioxide in a Natural Shale. ACS Earth Space Chem. 2019, 3, 324–328. [Google Scholar] [CrossRef]
- Bowers, G.M.; Loring, J.S.; Schaef, H.T.; Cunniff, S.S.; Walter, E.D.; Burton, S.D.; Larsen, R.K.; Miller, Q.R.; Bowden, M.E.; Ilton, E.S.; et al. Chemical Trapping of CO2 by Clay Minerals at Reservoir Conditions: Two Mechanisms Observed by in Situ High-Pressure and -Temperature Experiments. ACS Earth Space Chem. 2019, 3, 1034–1046. [Google Scholar] [CrossRef]
- Loganathan, N.; Bowers, G.M.; Yazaydin, A.O.; Schaef, H.T.; Loring, J.S.; Kalinichev, A.G.; Kirkpatrick, R.J. Clay Swelling in Dry Supercritical Carbon Dioxide: Effects of Interlayer Cations on the Structure, Dynamics, and Energetics of CO2 Intercalation Probed by XRD, NMR, and GCMD Simulations. J. Phys. Chem. C 2018, 122, 4391–4402. [Google Scholar] [CrossRef] [Green Version]
- Bowers, G.M.; Loring, J.S.; Schaef, H.T.; Walter, E.D.; Burton, S.D.; Hoyt, D.W.; Cunnif, S.S.; Loganathan, N.; Kirkpatrick, R.J. Interaction of Hydrocarbons with Clays at Reservoir Conditions: In situ IR and NMR Spectroscopy and X-ray Diffraction for Expandable Clays with Variably Wet Supercritical Methane. ACS Earth Space Chem. 2018, 2, 640–652. [Google Scholar] [CrossRef]
- Walter, E.D.; Qi, L.; Chamas, A.; Mehta, H.S.; Sears, J.A.; Scott, S.L.; Hoyt, D.W. Operando MAS NMR Reaction Studies at High Temperatures and Pressures. J. Phys. Chem. C 2018, 122, 8209–8215. [Google Scholar] [CrossRef]
- Chamas, A.; Qi, L.; Mehta, H.S.; Sears, J.A.; Scott, S.L.; Walter, E.D.; Hoyt, D.W. High Temperature/Pressure MAS-NMR for the Study of Dynamic Processes in Mixed Phase Systems. Magn. Reson. Imaging 2019, 56, 37–44. [Google Scholar] [CrossRef] [PubMed]
- Bowers, G.M.; Loring, J.S.; Walter, E.D.; Burton, S.; Bowden, M.E.; Hoyt, D.W.; Arey, B.; Larsen IV, R.K.; Kirkpatrick, R.J. Influence of Smectite Structure and Hydration on Supercritical Methane Binding and Dynamics in Smectite Pores. J. Phys. Chem. C 2019, 123, 29231–29244. [Google Scholar] [CrossRef]
- Bowers, G.M.; Walter, E.D.; Burton, S.D.; Schwarz, K.C.; Hoyt, D.W.; Kirkpatrick, R.J. Probing Pore Size and Connectivity in Porous Silicas Using 13C MAS NMR Spectroscopy of Supercritical Methane. J. Phys. Chem. C 2020, 124, 11536–11543. [Google Scholar] [CrossRef]
- Ok, S.; Hwang, B.; Liu, T.; Welch, S.; Sheets, J.M.; Cole, D.R.; Liu, K.-H.; Mou, C.-Y. Fluid Behavior in Nanoporous Silica. Front. Chem. 2020, 8, 734. [Google Scholar] [CrossRef]
- Liu, L.; Chen, S.H.; Faraone, A.; Yen, C.W.; Mou, C.Y.; Kolesnikov, A.I.; Mamontov, E.; Leao, J. Quasielastic and Inelastic Neutron Scattering Investigation of Fragile-to-strong Crossover in Deeply Supercooled Water Confined in Nanoporous Silica Matrices. J. Phys. Condens. Matter 2006, 18, S2261–S2284. [Google Scholar] [CrossRef] [Green Version]
- Liu, K.-H.; Zhang, Y.; Lee, J.-J.; Chen, C.-C.; Yeh, Y.-Q.; Chen, S.-H.; Mou, C.-Y. Density and Anomalous Thermal Expansion of Deeply Cooled Water Confined in Mesoporous Silica Investigated by Synchrotron X-ray Diffraction. J. Chem. Phys. 2013, 139, 064502-1–064502-9. [Google Scholar] [CrossRef]
- Sindorf, D.W.; Maciel, G.E. Si-29 Nmr-Study of Dehydrated Rehydrated Silica-Gel Using Cross Polarization and Magic-Angle Spinning. J. Am. Chem. Soc. 1983, 105, 1487–1493. [Google Scholar] [CrossRef]
- Zhao, H.P.; Chen, Q.; Zhang, S.M. A Novel Scheme for Quantitative Characterization of the Structures of Mesoporous Silica by Solid-State Si-29 NMR. Microporous Mesoporous Mater. 2012, 155, 240–244. [Google Scholar] [CrossRef]
- Bielecki, A.; Burum, D.P. Temperature-Dependence of Pb-207 Mas Spectra of Solid Lead Nitrate-an Accurate, Sensitive Thermometer for Variable-Temperature Mas. J. Magn. Reson. Ser. A 1995, 116, 215–220. [Google Scholar] [CrossRef]
- Langer, B.; Schnell, L.; Spiess, H.W.; Grimmer, A.R. Temperature Calibration Under Ultrafast MAS Conditions. J. Magn. Reson. 1999, 138, 182–186. [Google Scholar] [CrossRef] [PubMed]
- Le, T.T.B.; Striolo, A.; Gautam, S.S.; Cole, D.R. Propane–water Mixtures Confined within Cylindrical Silica Nanopores: Structural and Dynamical Properties Probed by Molecular Dynamics. Langmuir 2017, 33, 11310–11320. [Google Scholar] [CrossRef]
- Gautam, S.; Kolesnikov, A.I.; Rother, G.; Dai, S.; Qiao, Z.A.; Cole, D. Effects of Confinement and Pressure on the Vibrational Behavior of Nano-Confined Propane. J. Phys. Chem. A 2018, 122, 6736–6745. [Google Scholar] [CrossRef]
- Gautam, S.; Le, T.T.B.; Rother, G.; Jalarvo, N.; Liu, T.; Mamontov, E.; Cole, D. Effects of Water on the Stochastic Motions of Propane Confined in MCM-41-S Pores. Phys. Chem. Chem. Phys. 2019, 21, 25035–25046. [Google Scholar] [CrossRef]
- Liu, T.; Gautam, S.; Cole, D.R.; Patankar, S.; Tomasko, D.; Zhou, W.; Rother, G. Structure and Dynamics of Ethane Confined in Silica Nanopores in the Presence of CO2. J. Chem. Phys. 2020, 152, 084707. [Google Scholar] [CrossRef]
- Dollase, W.A. Reinvestigation of the Structure of Low Cristobalite. Z. Kristallogr. 1965, 121, 369–377. [Google Scholar] [CrossRef]
- Cygan, R.T.; Liang, J.J.; Kalinichev, A.G. Molecular Models of Hydroxide, Oxyhydroxide, and Clay Phases and the Development of a General Force Field. J. Phys. Chem. B 2004, 108, 1255–1266. [Google Scholar] [CrossRef]
- Martin, M.G.; Siepmann, J.I. Transferable Potentials for Phase Equilibria. 1. United-atom Description of n-alkanes. J. Phys. Chem. B 1998, 102, 2569–2577. [Google Scholar] [CrossRef]
- Purton, J.A.; Crabtree, J.C.; Parker, S.C. DL_MONTE: A General Purpose Program for Parallel Monte Carlo Simulation. Mol. Simul. 2013, 39, 1240–1252. [Google Scholar] [CrossRef]
- Gautam, S.; Liu, T.; Cole, D. Sorption, Structure and Dynamics of CO2 and Ethane in Silicalite at High Pressure: A Combined Monte Carlo and Molecular Dynamics Simulation Study. Molecules 2018, 24, 99. [Google Scholar] [CrossRef] [PubMed] [Green Version]
- Allen, M.P.; Tildesley, D.J. Computer Simulation of Liquids; Oxford University Press: Oxford, UK, 2017. [Google Scholar]
- Todorov, I.T.; Smith, W.; Trachenko, K.; Dove, M.T. DL_POLY_3: New Dimensions in Molecular Dynamics Simulations via Massive Parallelism. J. Mat. Chem. 2006, 16, 1911–1918. [Google Scholar] [CrossRef] [Green Version]
- Gautam, S.; Liu, T.; Rother, G.; Jalarvo, N.; Mamontov, E.; Welch, S.; Sheets, J.; Droege, M.; Cole, D.R. Dynamics of Propane in Nanoporous Silica Aerogel: A Quasielastic Neutron Scattering Study. J. Phys. Chem. C 2015, 119, 18188–18195. [Google Scholar] [CrossRef]
- Mohammed, S.; Sunkara, A.K.; Walike, C.E.; Gadikota, G. The Role of Surface Hydrophobicity on the Structure and Dynamics of CO2 and CH4 Confined in Silica Nanopores. Front. Clim. 2021, 3, 713708. [Google Scholar] [CrossRef]
- Freedman, R.; Heaton, N. Fluid Characterization Using Nuclear Magnetic Resonance Logging. Petrophysics 2004, 45, 241–250. [Google Scholar]
- Slichter, C.P. Principles of Magnetic Resonance; Springer: Berlin, Germany, 1990. [Google Scholar]
- Corsaro, C.; Maisano, R.; Mallamace, D.; Dugo, G. 1H NMR Study of Water/methanol Solutions as a Function of Temperature and Concentration. Phys. A 2013, 392, 596–601. [Google Scholar] [CrossRef]
- Krekelberg, W.P.; Siderius, D.W.; Shen, V.K.; Truskett, T.M.; Errington, J.R. Position-dependent dynamics explain pore-averaged diffusion in strongly attractive adsorptive systems. Langmuir 2017, 33, 13955–13963. [Google Scholar] [CrossRef]
- Momma, K.; Izumi, F. VESTA: A Three-dimensional Visualization System for Electronic and Structural Analysis. J. Appl. Crystallogr. 2008, 41, 653–658. [Google Scholar] [CrossRef]
- Williams, T.; Kelley, C.; Lang, R.; Kotz, D.; Campbell, J. Gnuplot 4.6: An Interactive Plotting Program. 2014. Available online: http://gnuplot.info (accessed on 31 October 2022).


| Pore Size | Pore Surface | Pressure (bar) | Temperature (K) | Number of Methane Molecules |
|---|---|---|---|---|
| 1.5 nm | Smooth | 30 | 307 | 66 |
| 346 | 66 | |||
| 2.5 nm | Smooth | 30 | 307 | 88 |
| 346 | 88 | |||
| 4.0 nm | Smooth | 30 | 346 | 150 |
| 60 | 346 | 305 | ||
| Undulated | 30 | 346 | 150 |
| Sample | Pressure | Temperature (K) | Bulk (ppm) | Confined (ppm) | Amount of | Amount of Methane (mg) |
|---|---|---|---|---|---|---|
| (bar) | Silica (mg) | |||||
| Pure methane | 28.2 | 307 | −10.45 | - | - | 0.0115 |
| 13C labeled | 32.6 | 346 | −10.45 | - | - | 0.0115 |
| 112.7 | 307 | −9.71 | - | - | 0.0452 | |
| 130.3 | 346 | −9.71 | - | - | 0.0452 | |
| >130.3 | 373 | −9.90 | - | - | 0.0412 | |
| Methane + 1.5 nm silica | 28.2 | 307 | −10.71 | −9.98 | 0.0274 | 0.0094 |
| 32.6 | 346 | −10.67 | −10.14 | 0.0274 | 0.0094 | |
| 112.7 | 307 | −9.86 | −9.42 | 0.0274 | 0.0400 | |
| 130.3 | 346 | −9.86 | −9.50 | 0.0274 | 0.0400 | |
| >130.3 | 373 | −9.89 | −9.54 | 0.0274 | 0.0400 | |
| Methane + 2.5 nm silica | 28.2 | 307 | −10.71 | −9.91 | 0.0478 | 0.0080 |
| 32.6 | 346 | −10.71 | −10.31 | 0.0478 | 0.0080 | |
| 56.4 | 307 | −10.42 | −9.92 | 0.0478 | 0.0219 | |
| 65.1 | 346 | −10.42 | −10.03 | 0.0478 | 0.0219 | |
| 112.7 | 307 | −9.86 | −9.50 | 0.0478 | 0.0398 | |
| 130.3 | 346 | −9.86 | −9.58 | 0.0478 | 0.0398 | |
| >130.3 | 373 | −9.86 | −9.60 | 0.0478 | 0.0398 |
| Sample | Loading Pressure (bar) | Temperature (K) | Bulk (ppm) | Confined (ppm) | Amount of Methane + CO2 (mg) |
|---|---|---|---|---|---|
| CH4 + CO2 | 0.0043 g methane + 0.0029 g CO2 | ||||
| methane | 15 + 15 | 307 | −10.71 | −10.23 | |
| methane | 15 + 15 | 346 | −10.70 | −10.32 | |
| CO2 | 15 + 15 | 307 | 125.38 | ||
| CO2 | 15 + 15 | 346 | 125.42 | ||
| 0.0043 g methane + 0.0487 g CO2 | |||||
| methane | 15 + 45 | 307 | −10.48 | −10.13 | |
| methane | 15 + 45 | 346 | −10.48 | −10.18 | |
| CO2 | 15 + 45 | 307 | 125.38 | ||
| CO2 | 15 + 45 | 346 | 125.42 | ||
| 0.0219 g methane + 0.0734 g CO2 | |||||
| methane | 60 + 60 | 307 | −9.83 | −9.58 | |
| methane | 60 + 60 | 346 | −9.85 | −9.63 | |
| CO2 | 60 + 60 | 307 | 125.42 | ||
| CO2 | 60 + 60 | 346 | 125.42 |
| 308 K | 348 K | ||
|---|---|---|---|
| 120 bar | pure CH4 | 0.35 s | 0.55 s |
| 2.5 nm Silica + methane 120 bar | bulk-like CH4 | 0.20 s | 0.25 s |
| confined CH4 | 0.15 s | 0.20 s | |
| 1.5 nm Silica + methane 120 bar | bulk-like CH4 | 0.50 s | 0.55 s |
| confined CH4 | 0.40 s | 0.50 s | |
| 2.5 nm Silica | bulk-like CH4 | 0.22 s | 0.25 s |
| 15 bar methane + 15 bar CO2 | confined CH4 | 0.18 s | 0.20 s |
| CO2 | 0.05 s | 0.35 s | |
| 2.5 nm silica | bulk-like CH4 | 0.95 s | 1.05 s |
| 15 bar methane + 45 bar CO2 | confined CH4 | 0.85 s | 1.00 s |
| CO2 | 0.35 s | 0.54 s | |
| 2.5 nm silica | bulk-like CH4 | 1.70 s | 1.70 s |
| 60 bar methane + 60 bar CO2 | confined CH4 | 1.40 s | 1.60 s |
| CO2 | 0.85 s | 0.90 s |
| Surface Area (m2/g) | 2.5 nm Silica without Exposure to CO2 | CO2 Exposed 2.5 nm Silica @ 30 bar, 35 °C, 2 h | sc CO2 Exposed 2.5 nm Silica @ 120 bar, 35 °C, 2 h |
|---|---|---|---|
| BET Surface area | 1166.9 | 841.6 | 756.1 |
| BJH Adsorption cumulative surface area | 1097.6 | 734.1 | 651.7 |
| BJH Desorption cumulative surface area | 1263.4 | 841.5 | 719.6 |
| Pore Volume (cm3/g) | |||
| BJH Adsorption cumulative volume of pores | 0.76 | 0.49 | 0.41 |
| BJH Desorption cumulative volume of pores | 0.88 | 0.55 | 0.47 |
| Pore Size (Å) | |||
| BJH Adsorption Average pore width | 27.6 | 26.5 | 25.3 |
| BJH Desorption Average pore width | 27.8 | 26.3 | 26.2 |
Publisher’s Note: MDPI stays neutral with regard to jurisdictional claims in published maps and institutional affiliations. |
© 2022 by the authors. Licensee MDPI, Basel, Switzerland. This article is an open access article distributed under the terms and conditions of the Creative Commons Attribution (CC BY) license (https://creativecommons.org/licenses/by/4.0/).
Share and Cite
Ok, S.; Gautam, S.; Liu, K.-H.; Cole, D.R. Surface Interactions and Nanoconfinement of Methane and Methane plus CO2 Revealed by High-Pressure Magic Angle Spinning NMR Spectroscopy and Molecular Dynamics. Membranes 2022, 12, 1273. https://doi.org/10.3390/membranes12121273
Ok S, Gautam S, Liu K-H, Cole DR. Surface Interactions and Nanoconfinement of Methane and Methane plus CO2 Revealed by High-Pressure Magic Angle Spinning NMR Spectroscopy and Molecular Dynamics. Membranes. 2022; 12(12):1273. https://doi.org/10.3390/membranes12121273
Chicago/Turabian StyleOk, Salim, Siddharth Gautam, Kao-Hsiang Liu, and David R. Cole. 2022. "Surface Interactions and Nanoconfinement of Methane and Methane plus CO2 Revealed by High-Pressure Magic Angle Spinning NMR Spectroscopy and Molecular Dynamics" Membranes 12, no. 12: 1273. https://doi.org/10.3390/membranes12121273