Innate Lymphocyte Th1 and Th17 Responses in Elderly Hospitalised Patients with Infection and Sepsis

 and
and
Abstract
:1. Introduction
2. Methods and Materials
2.1. Study Population
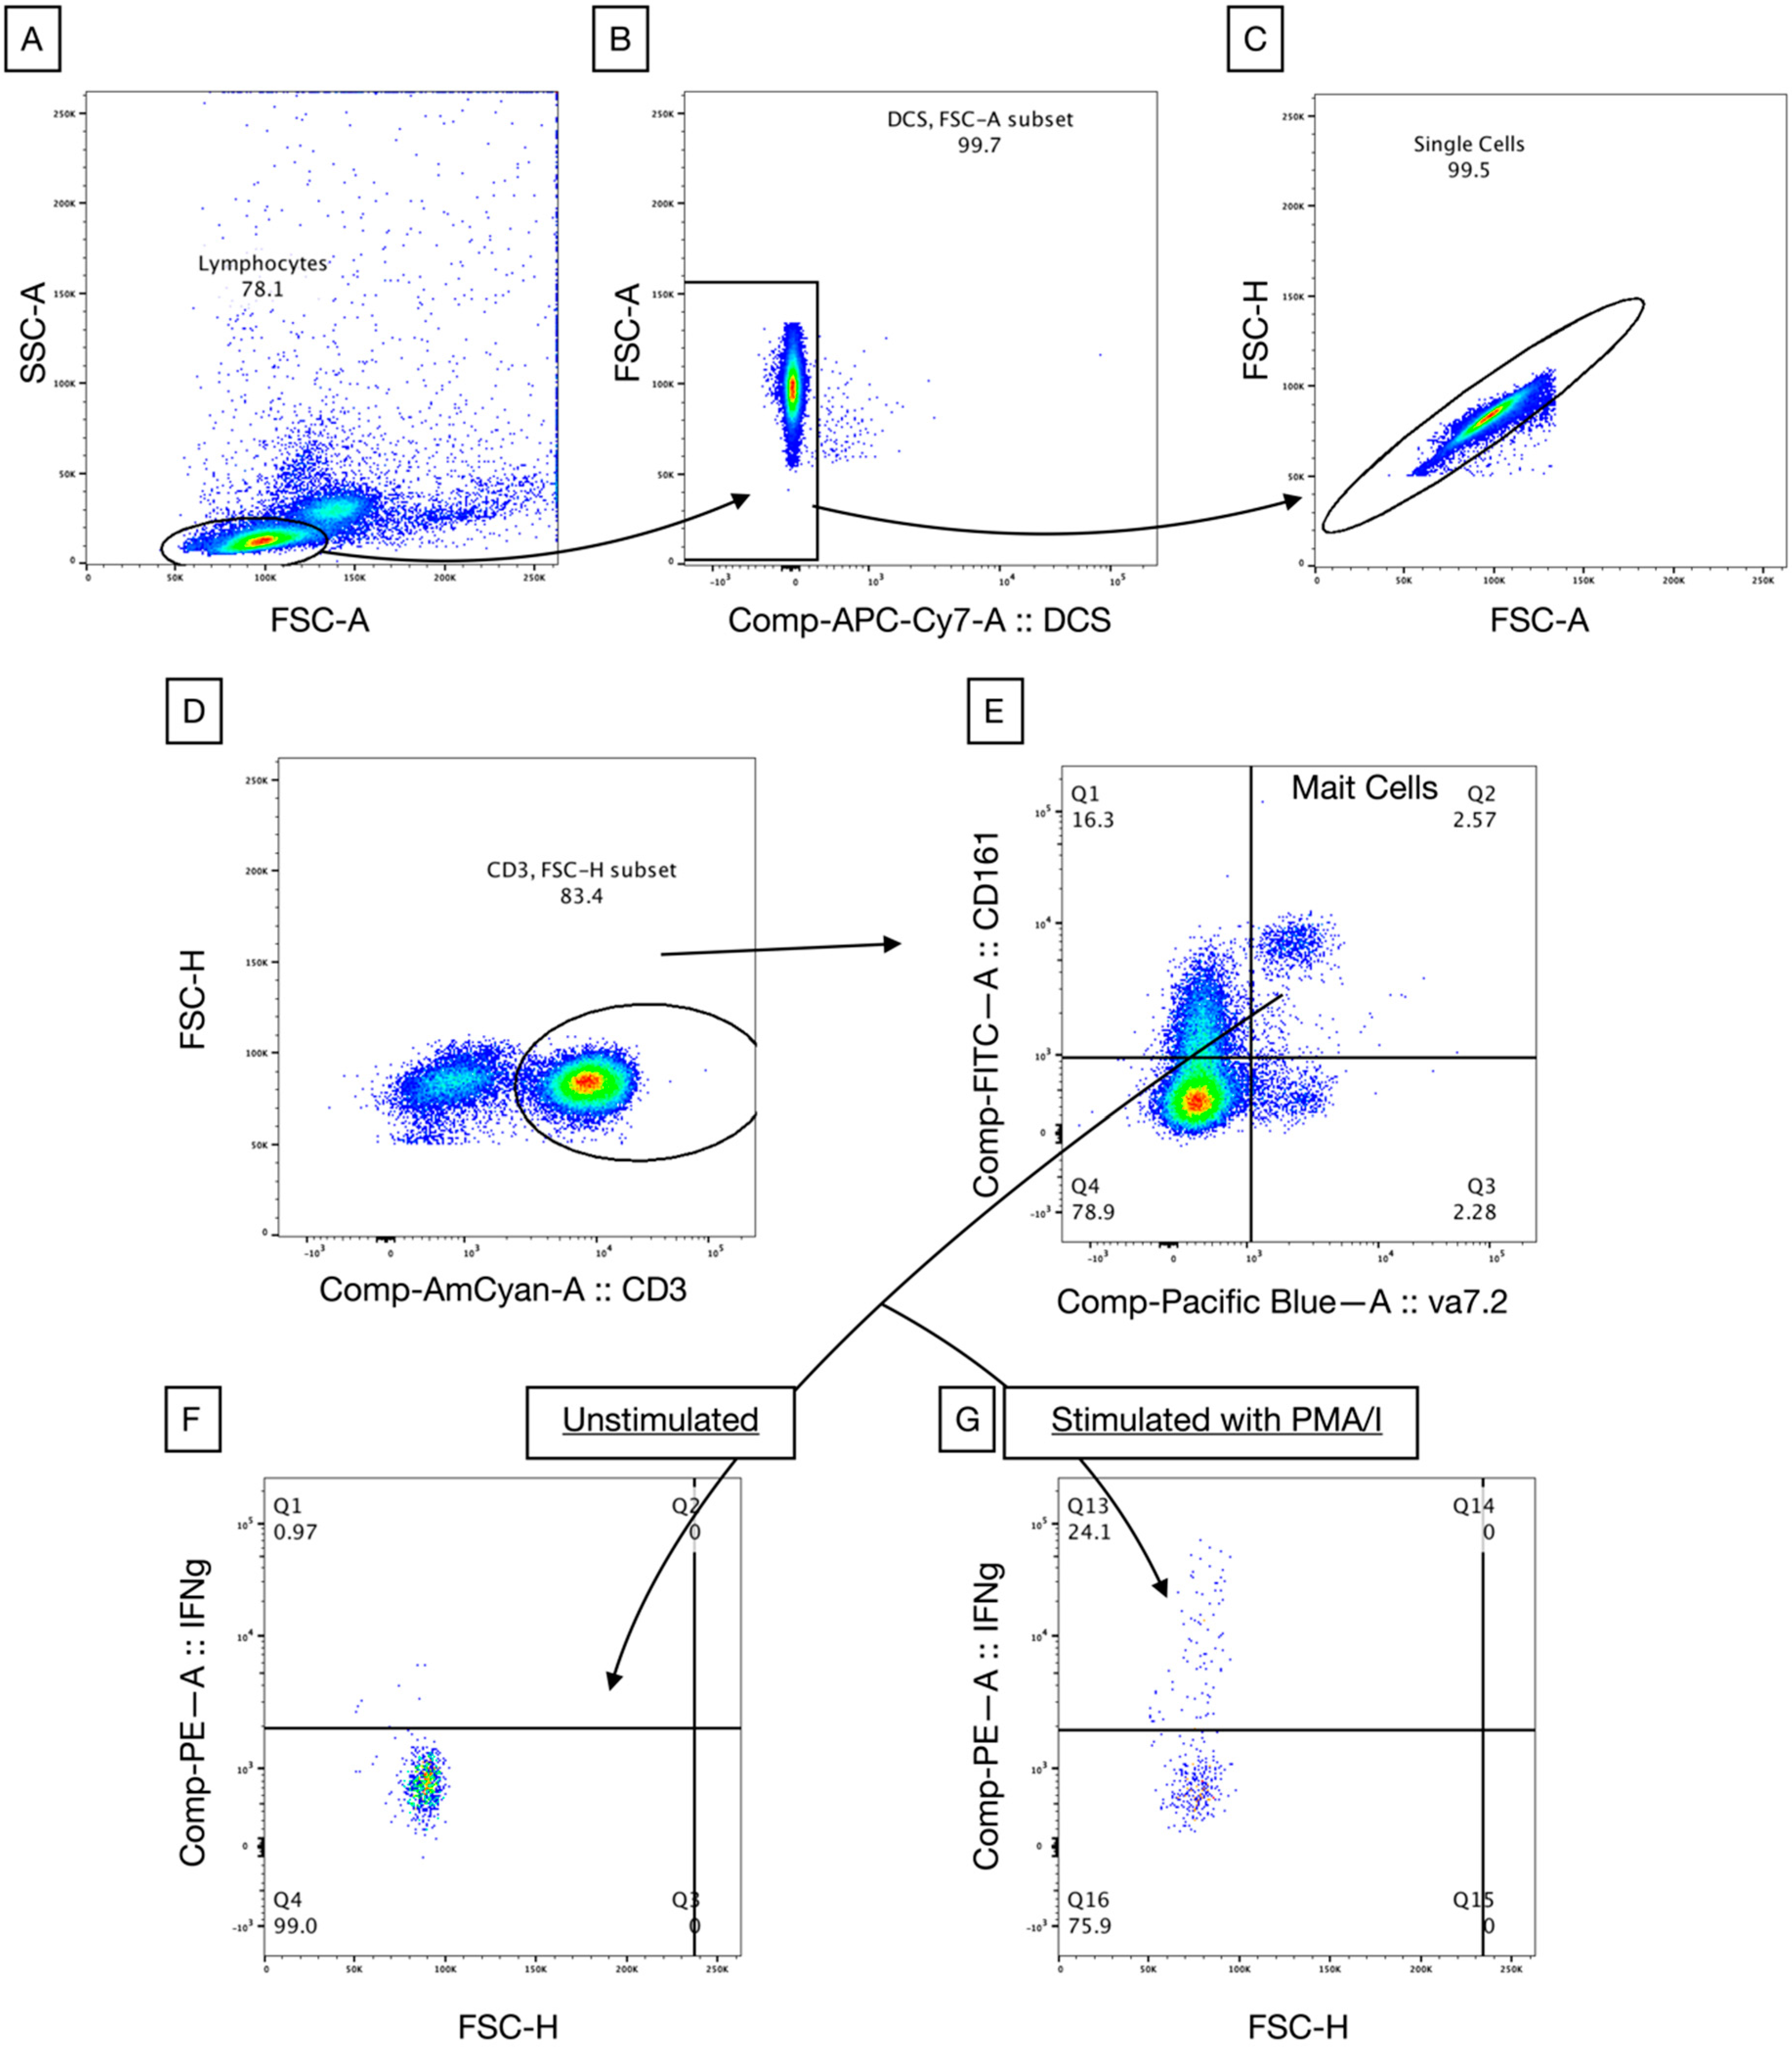
2.2. Immune Phenotyping of Circulating Lymphocytes
2.3. Lymphocyte Stimulation In Vitro
2.4. Statistical Analysis
3. Results
3.1. Demographics
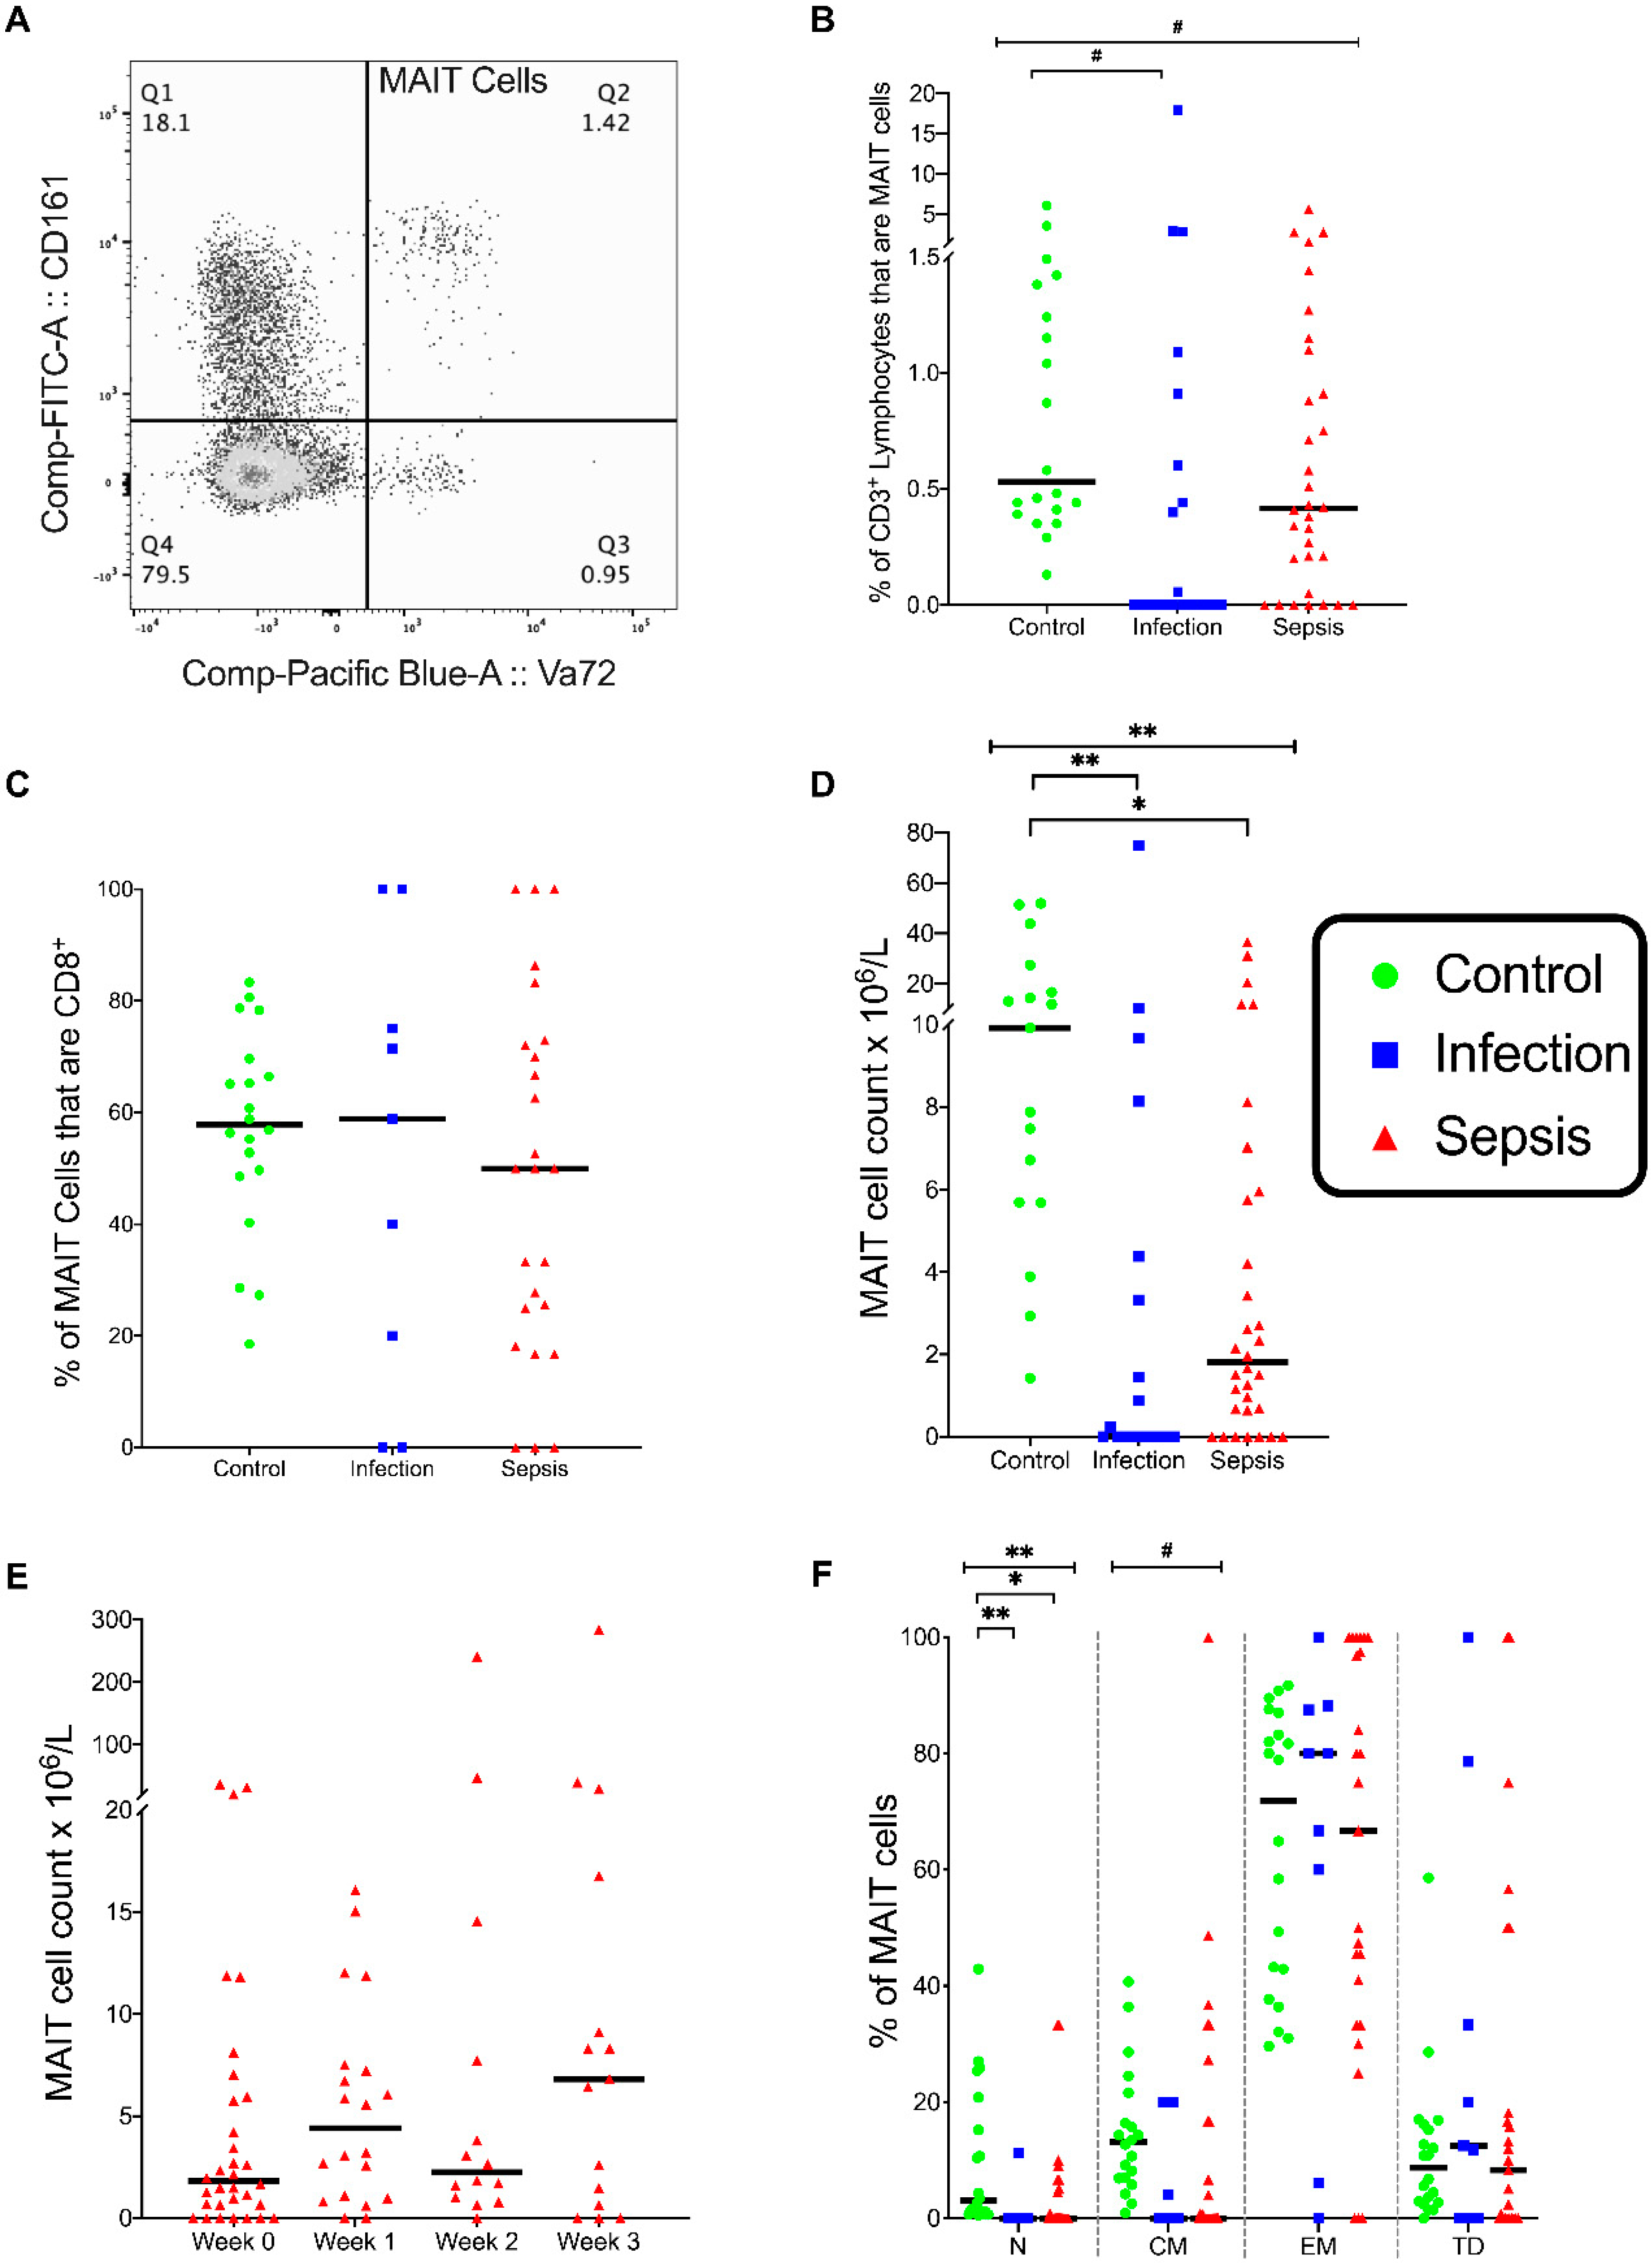
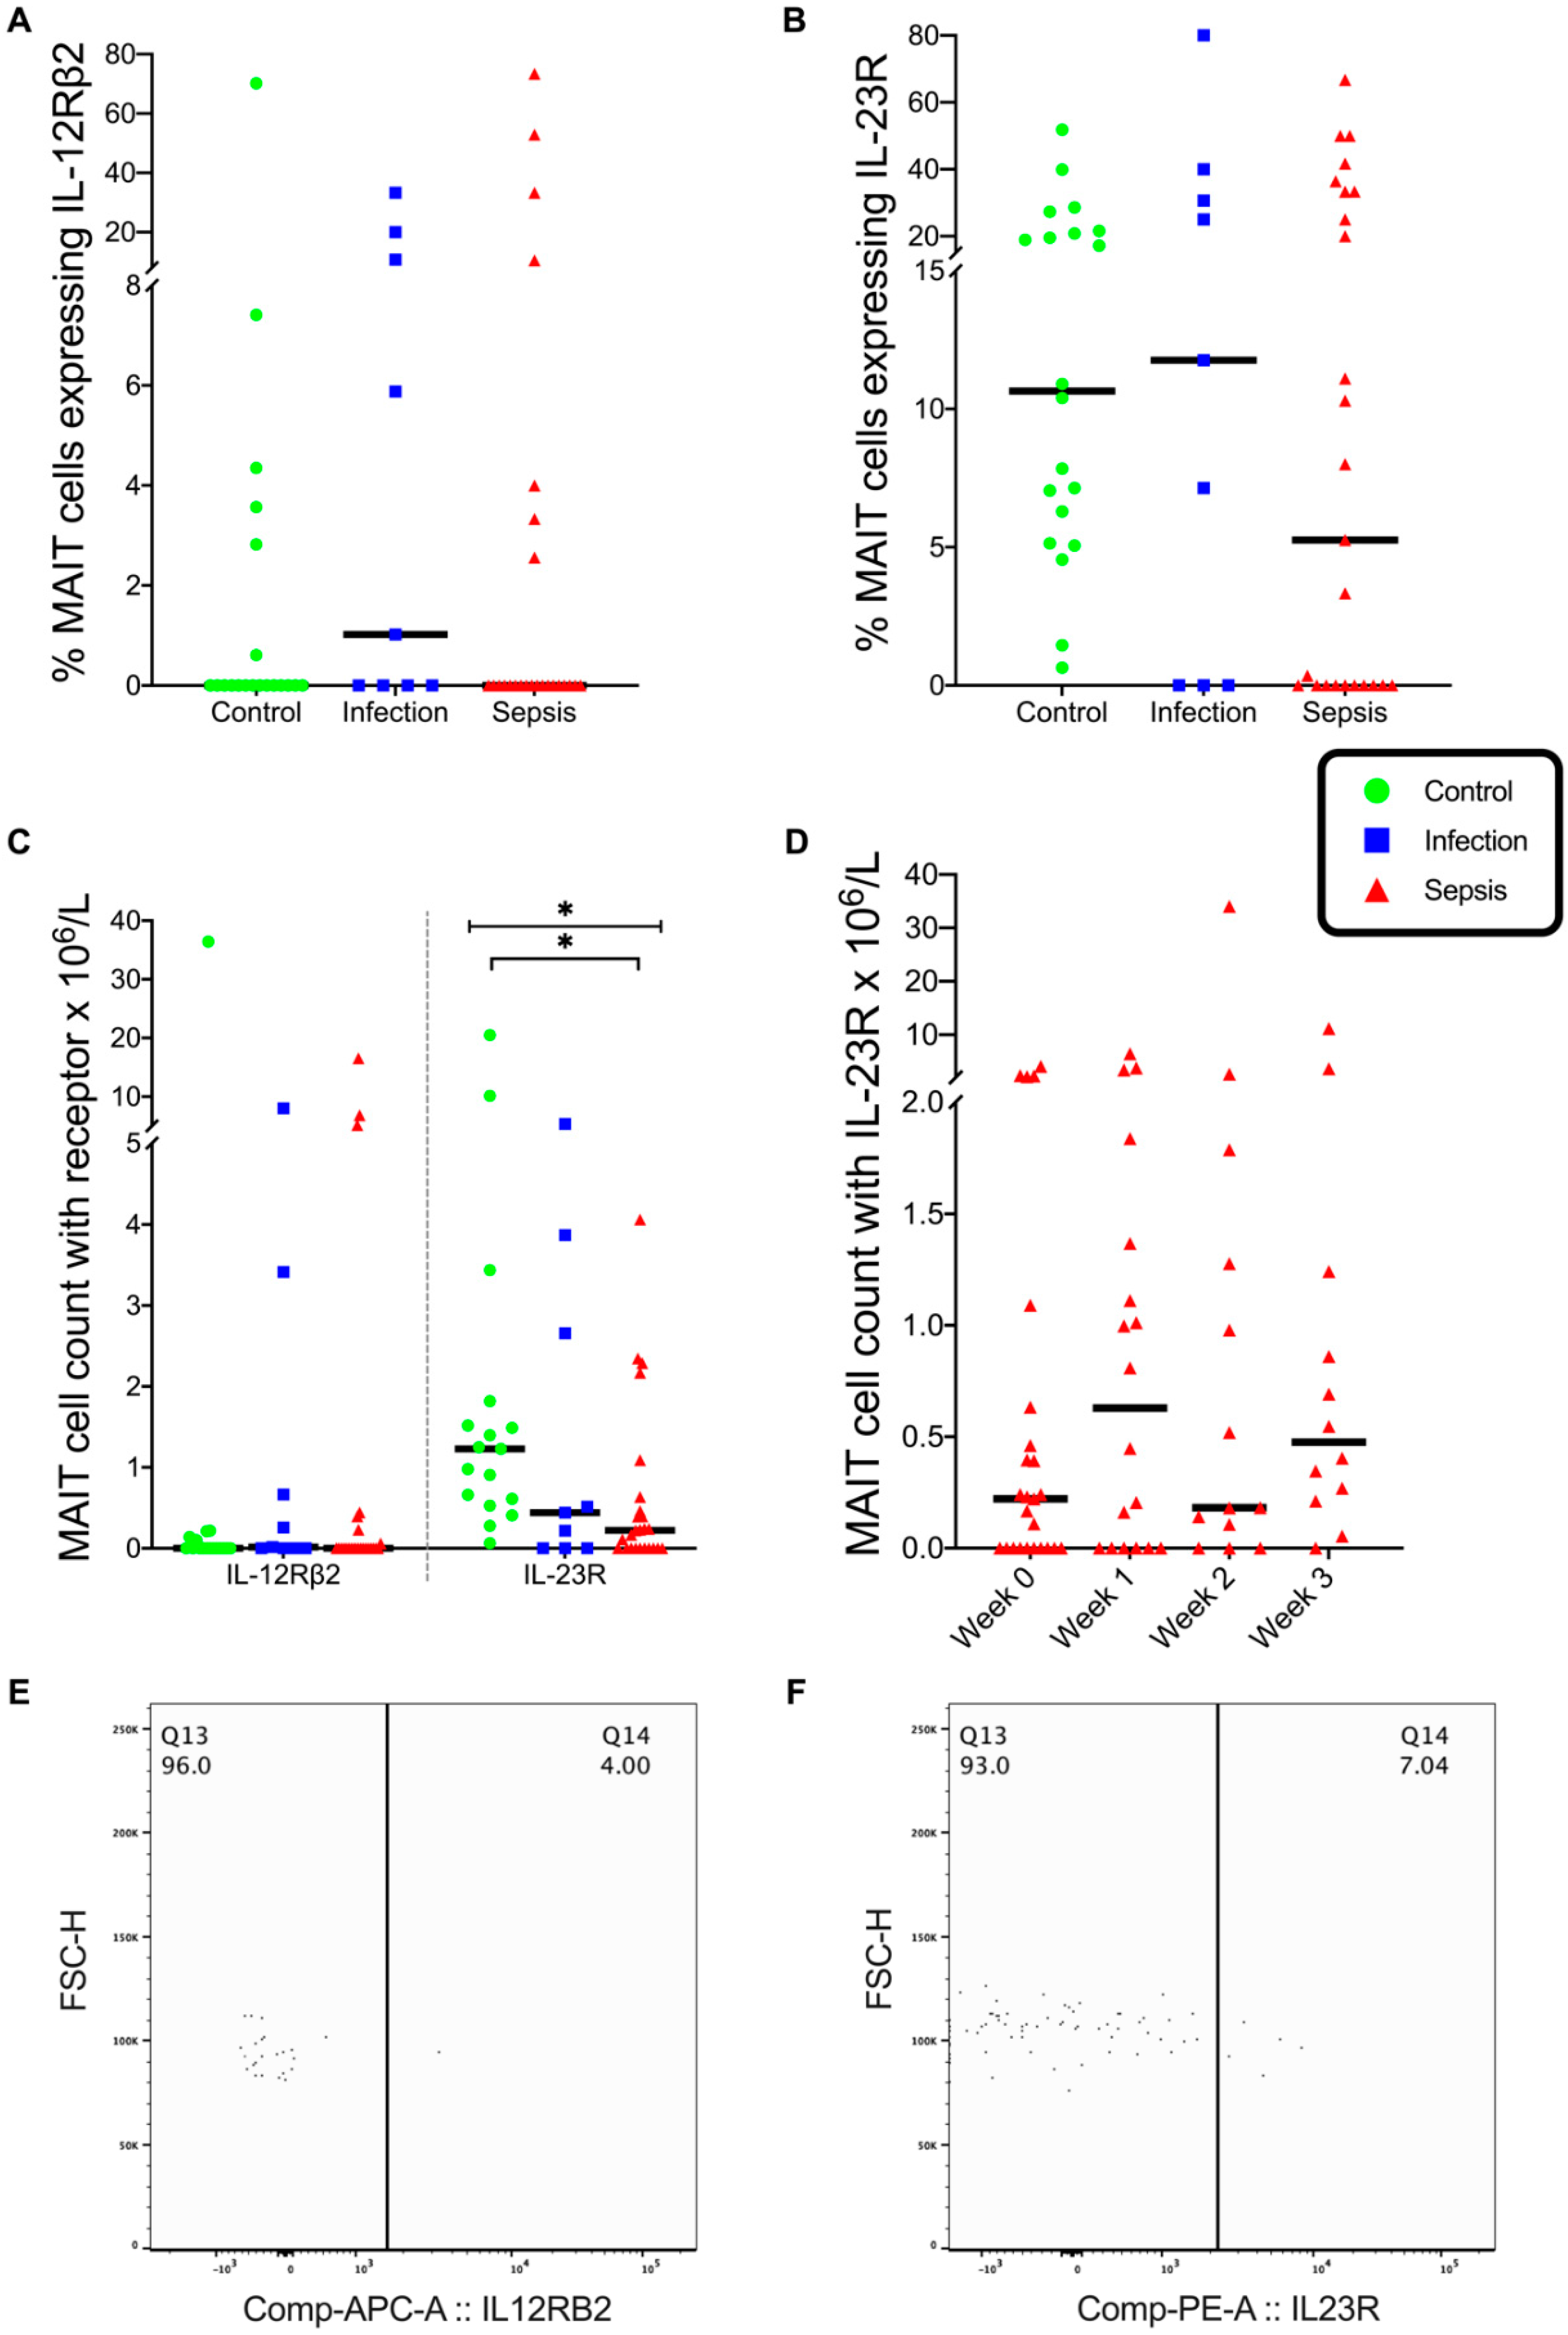
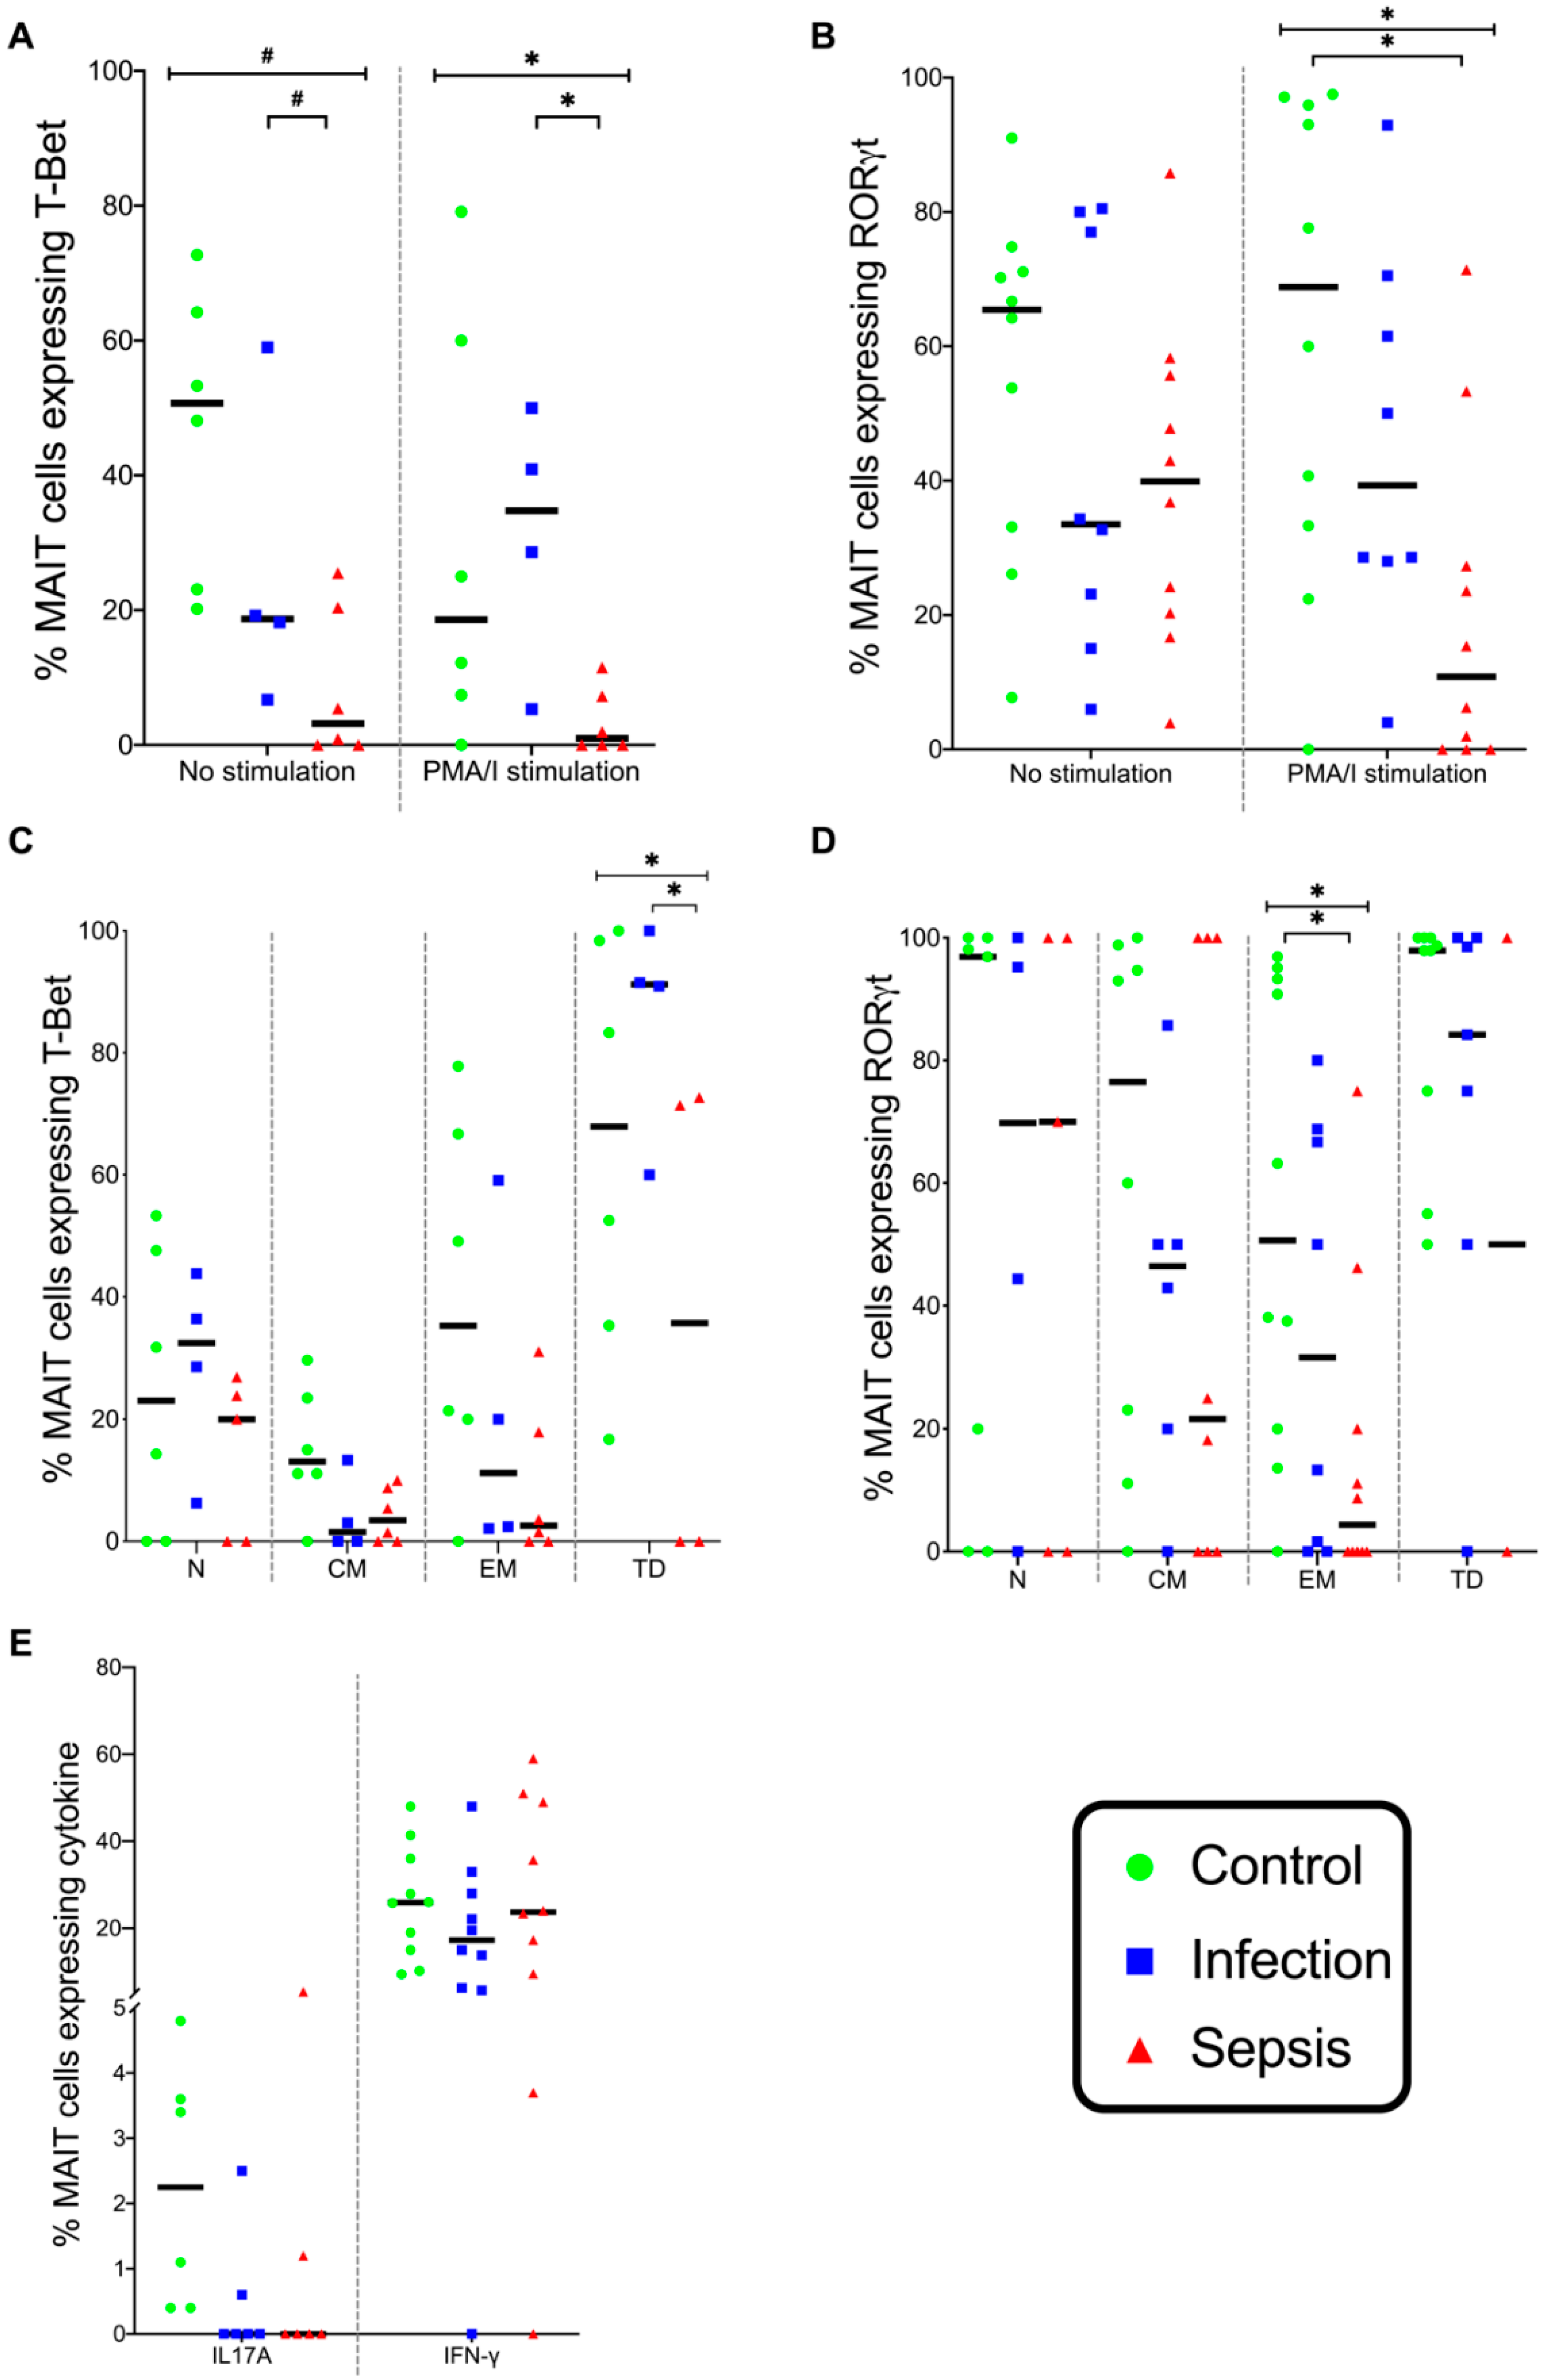
3.2. MAIT Cells
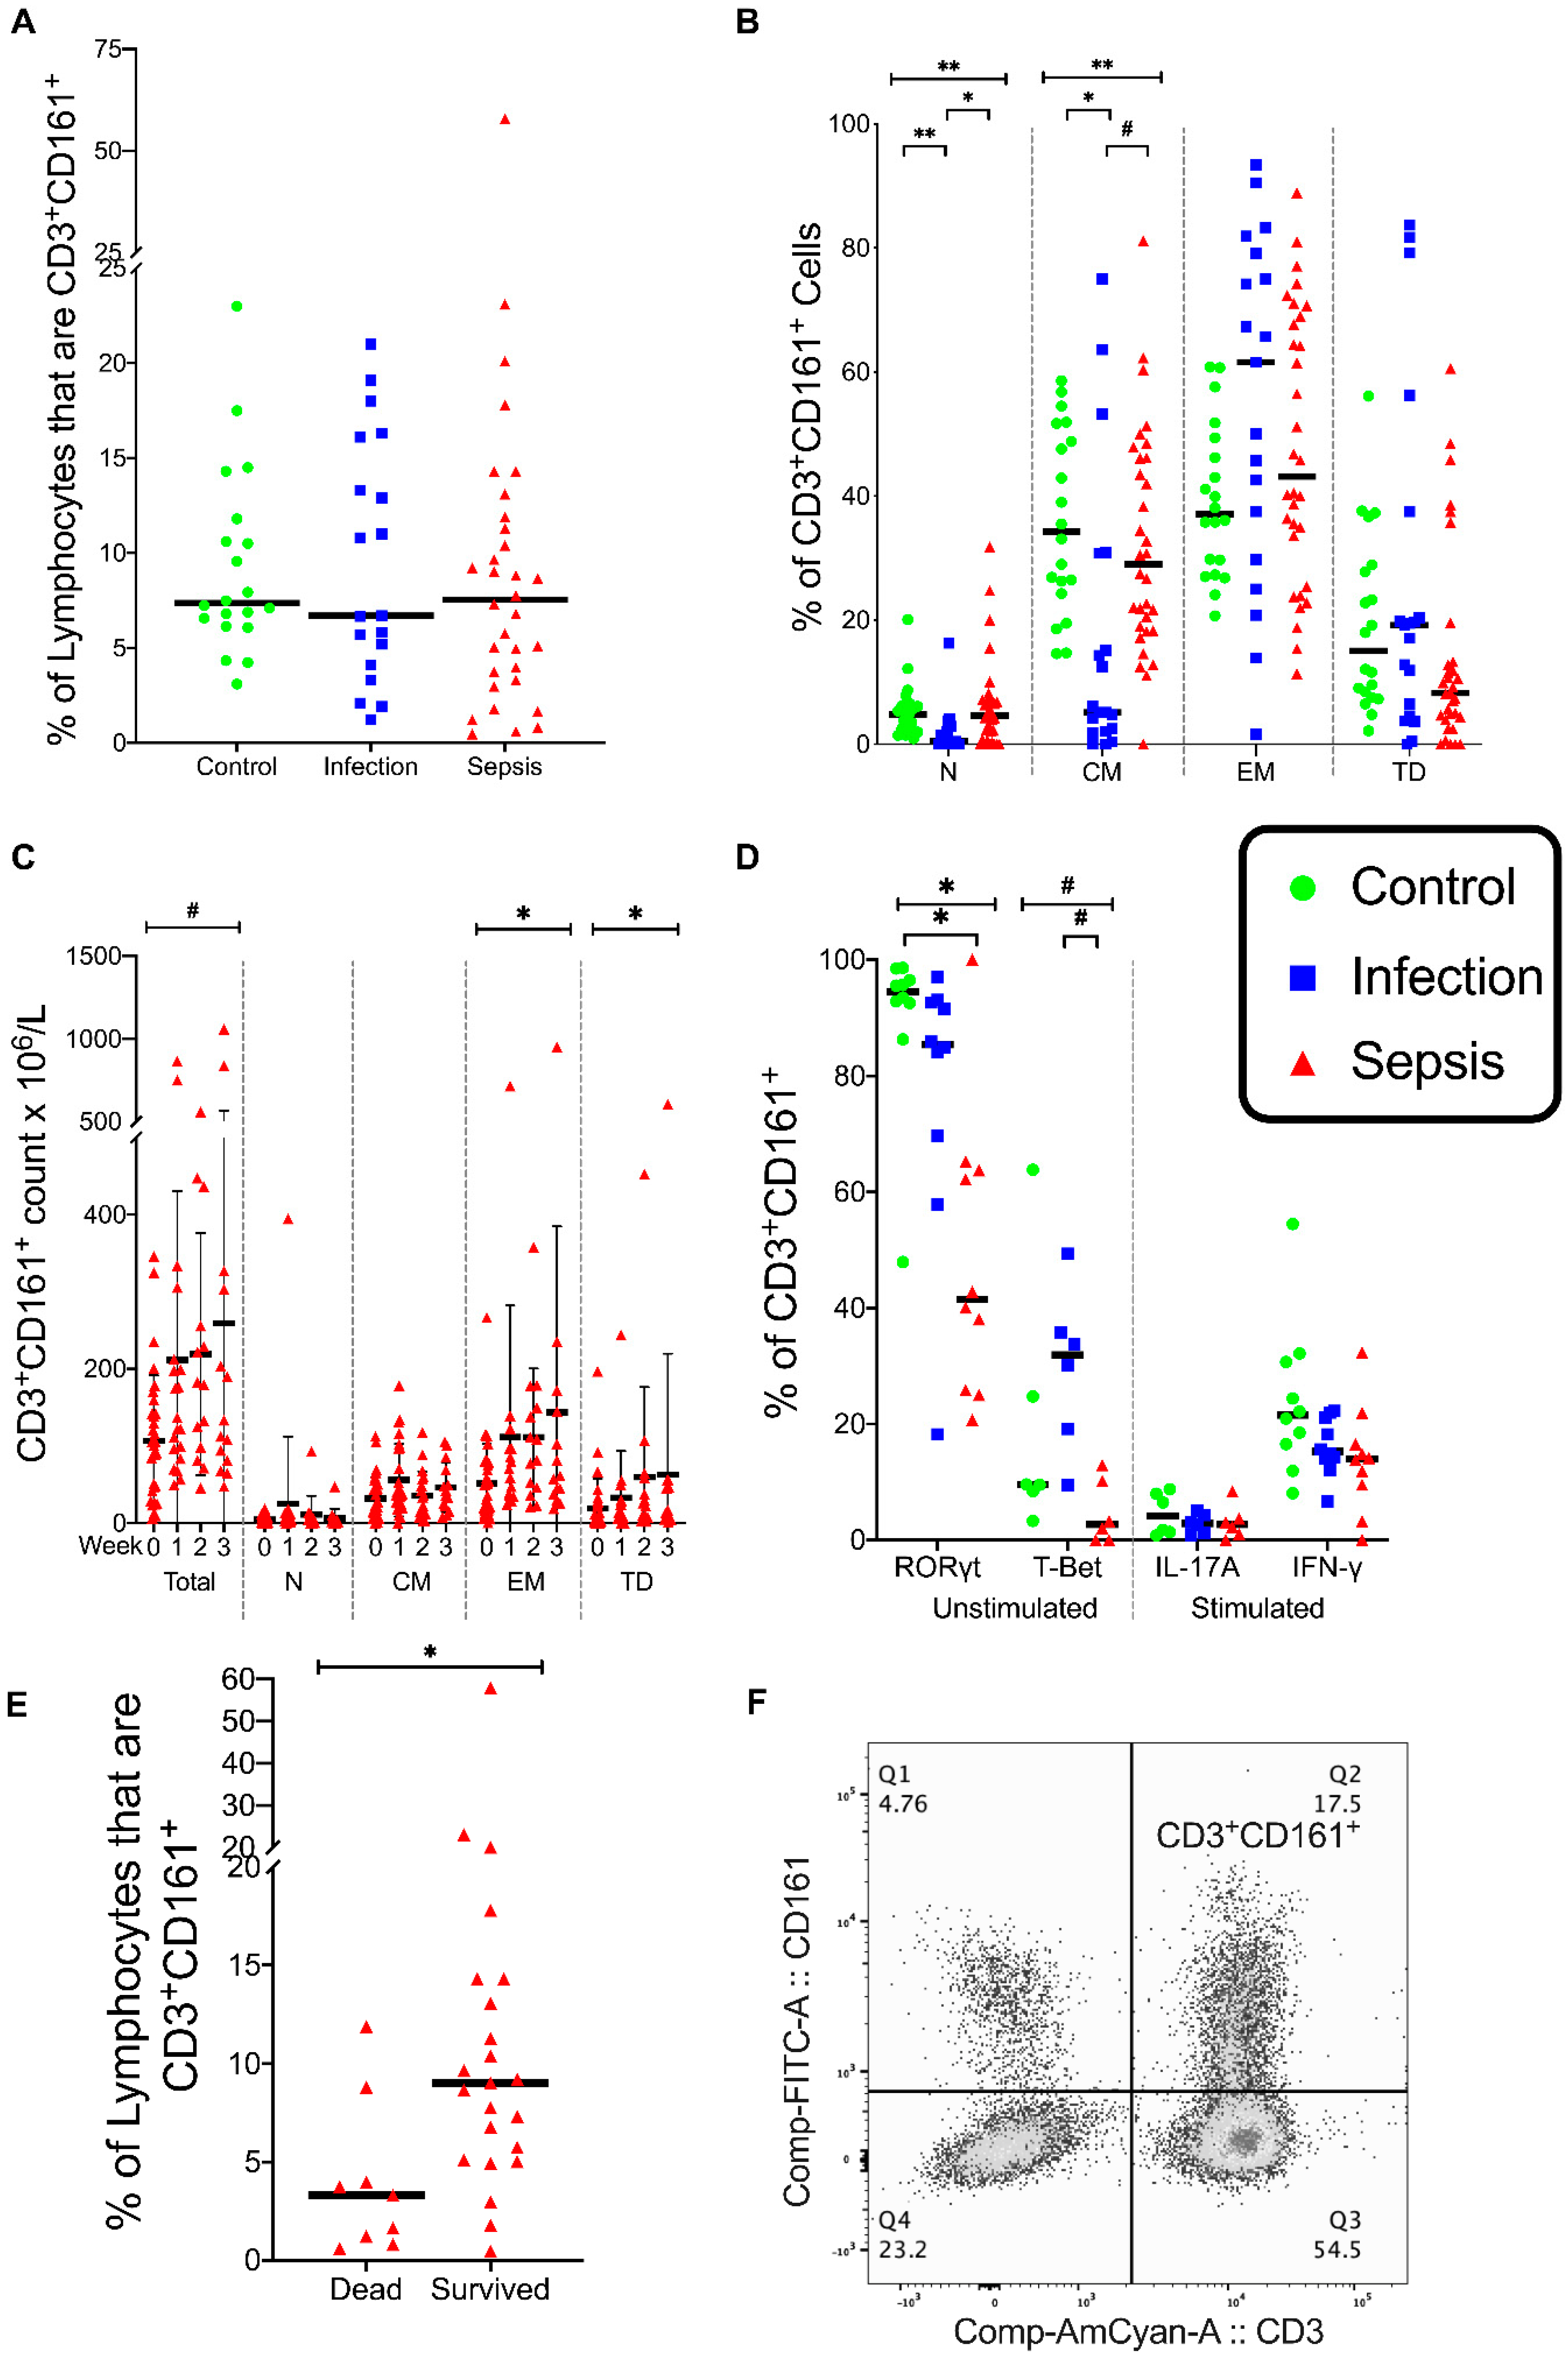
3.3. CD3+ CD161+ Lymphocytes
3.4. Natural Killer (NK) Cells
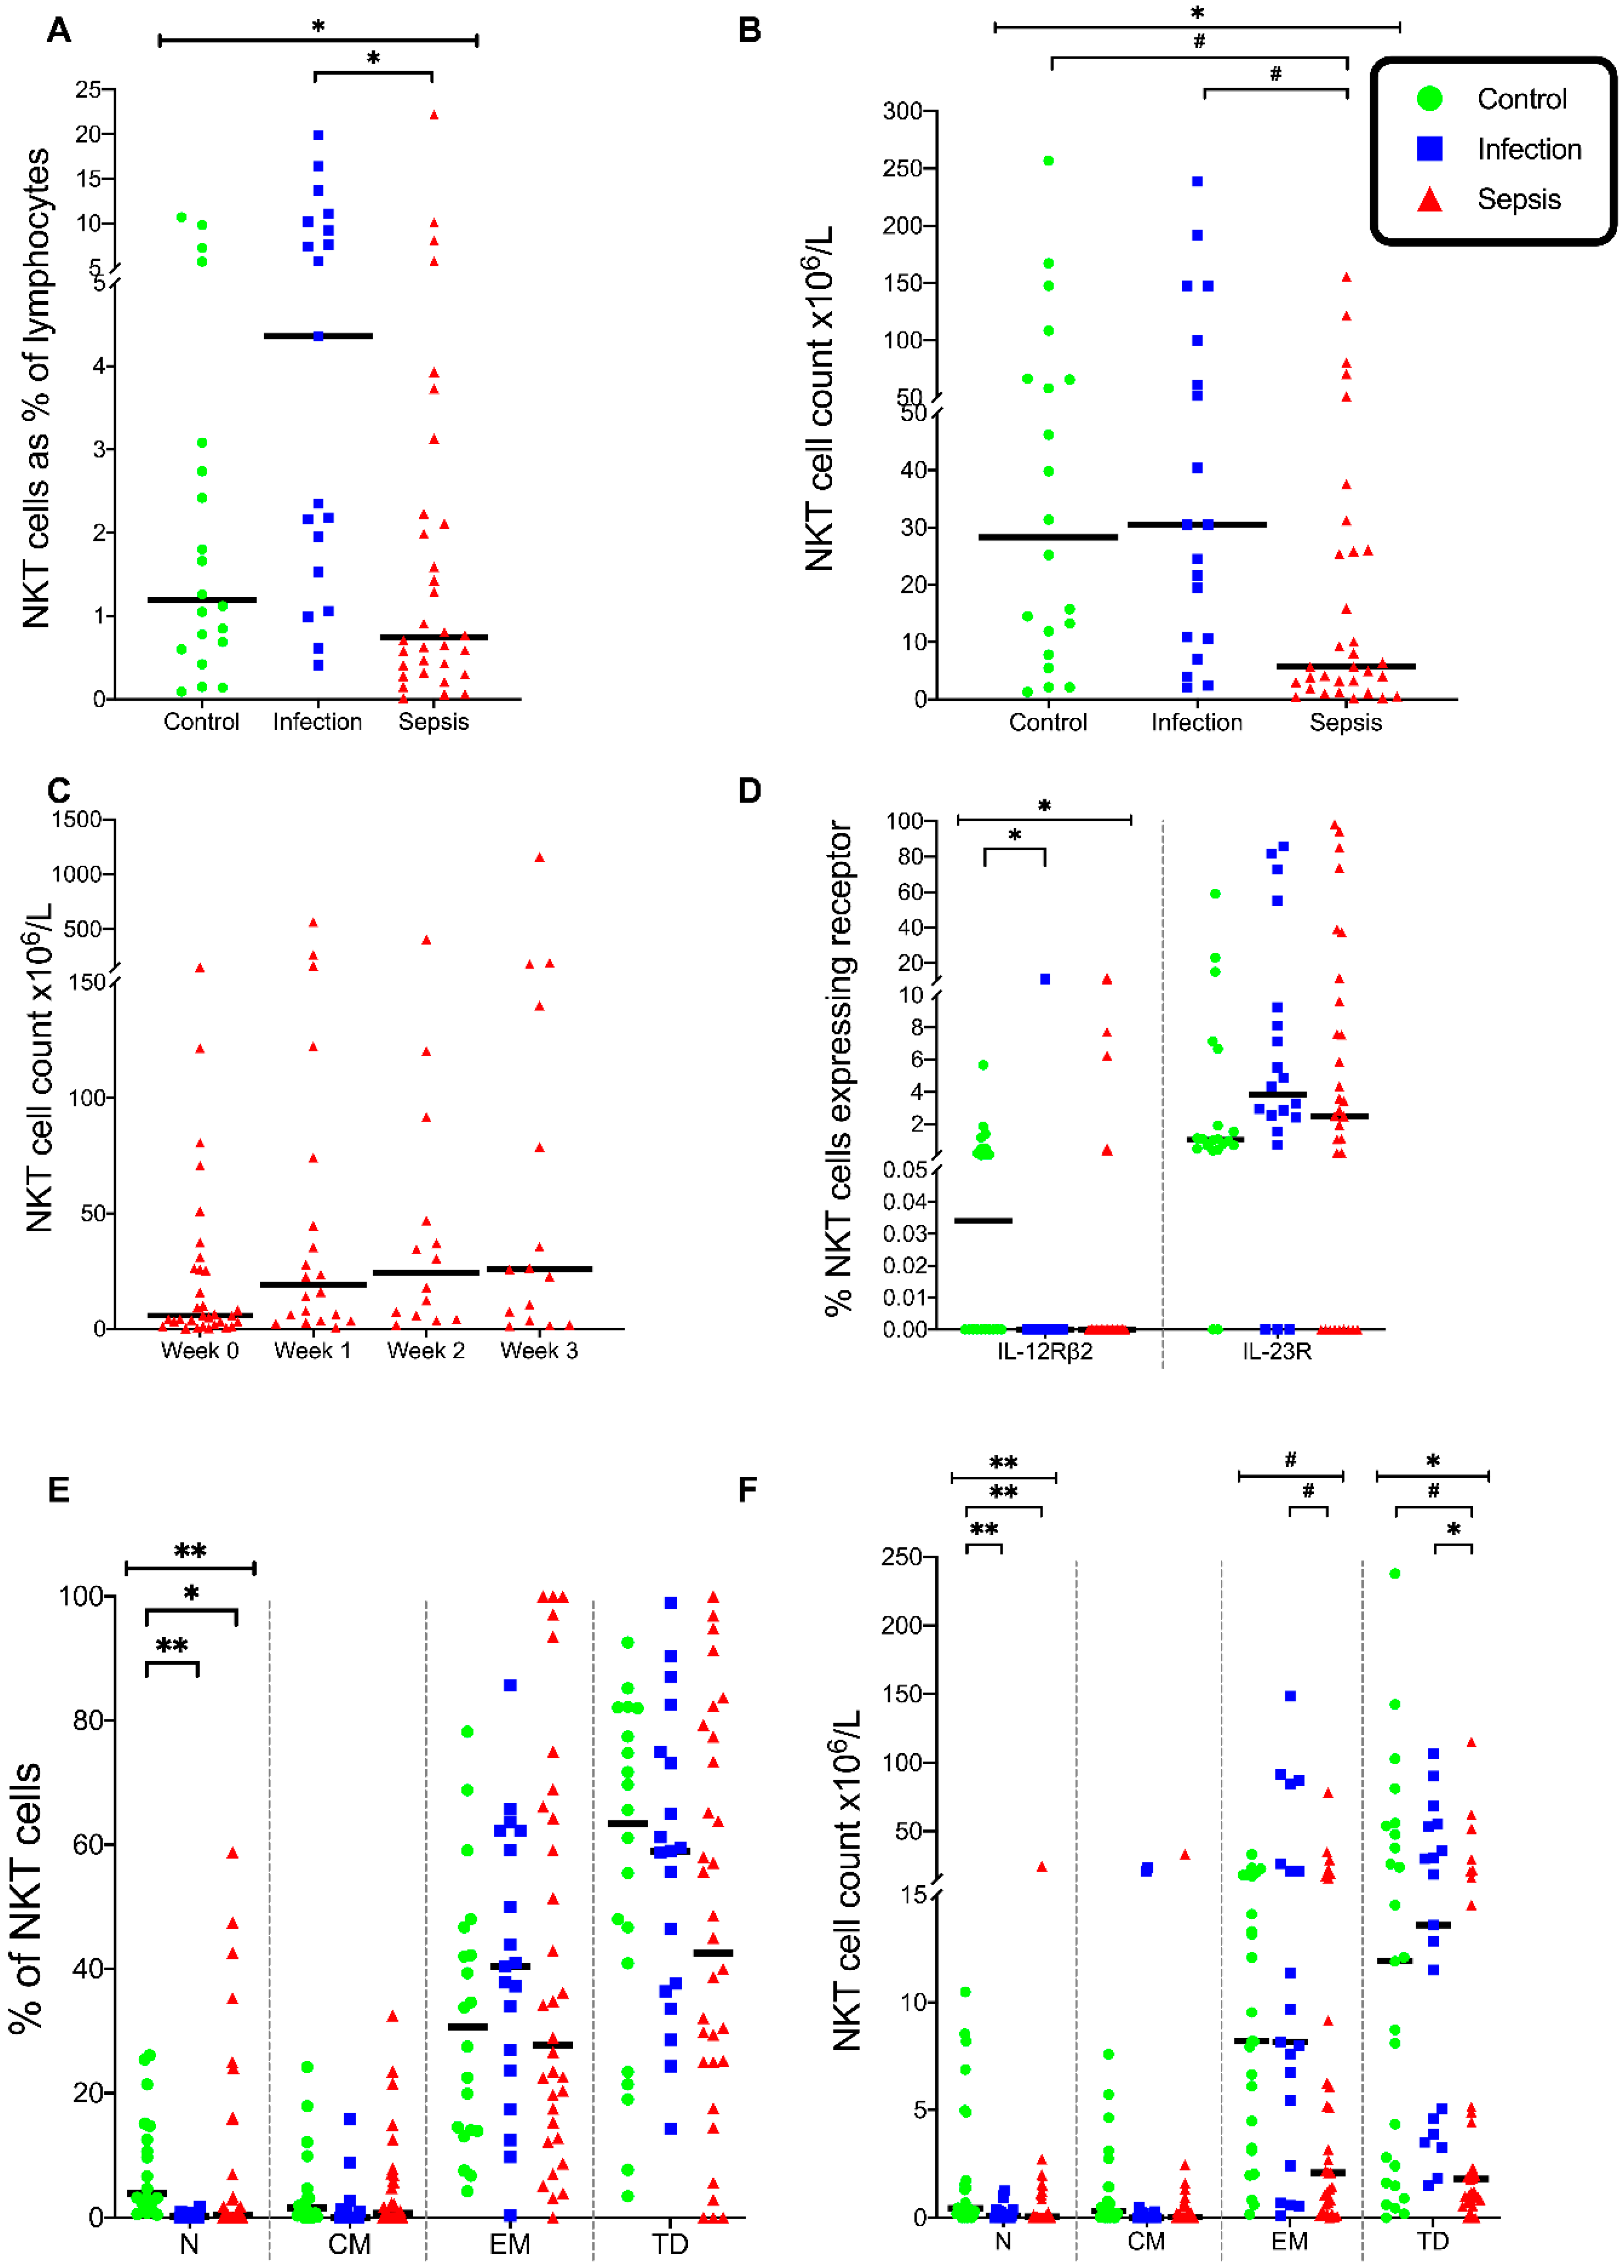
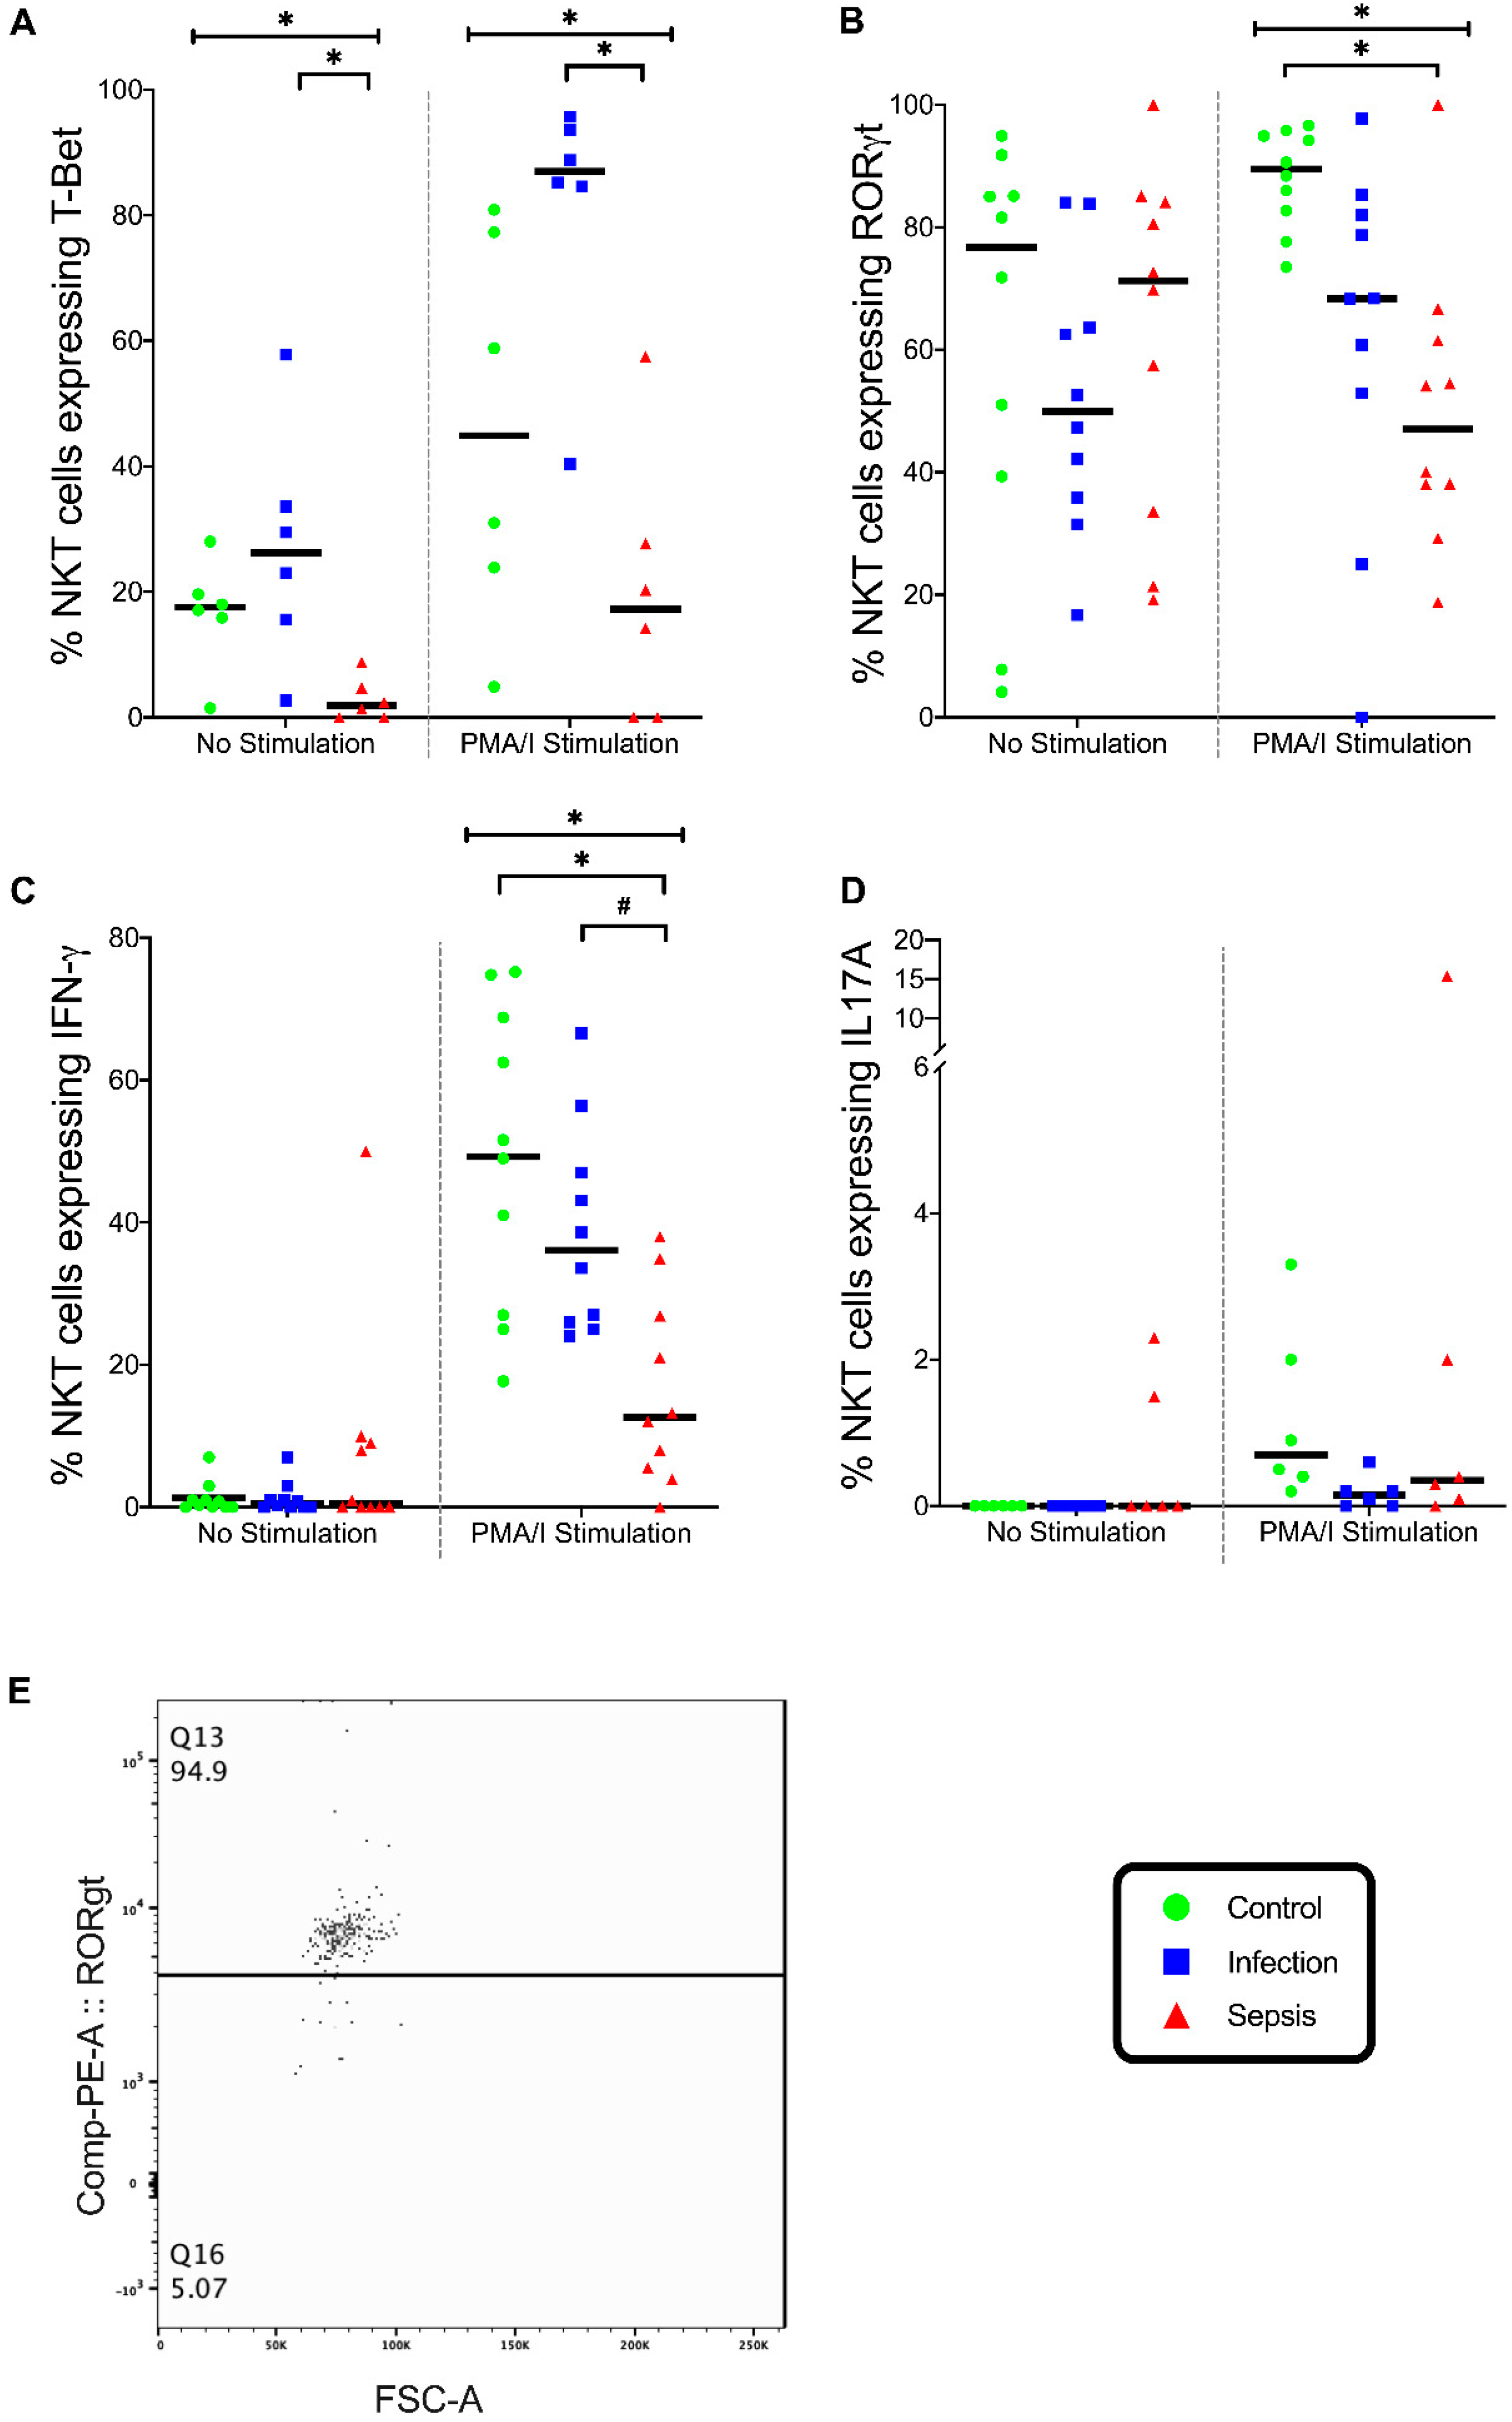
3.5. Natural Killer T (NKT) Cells
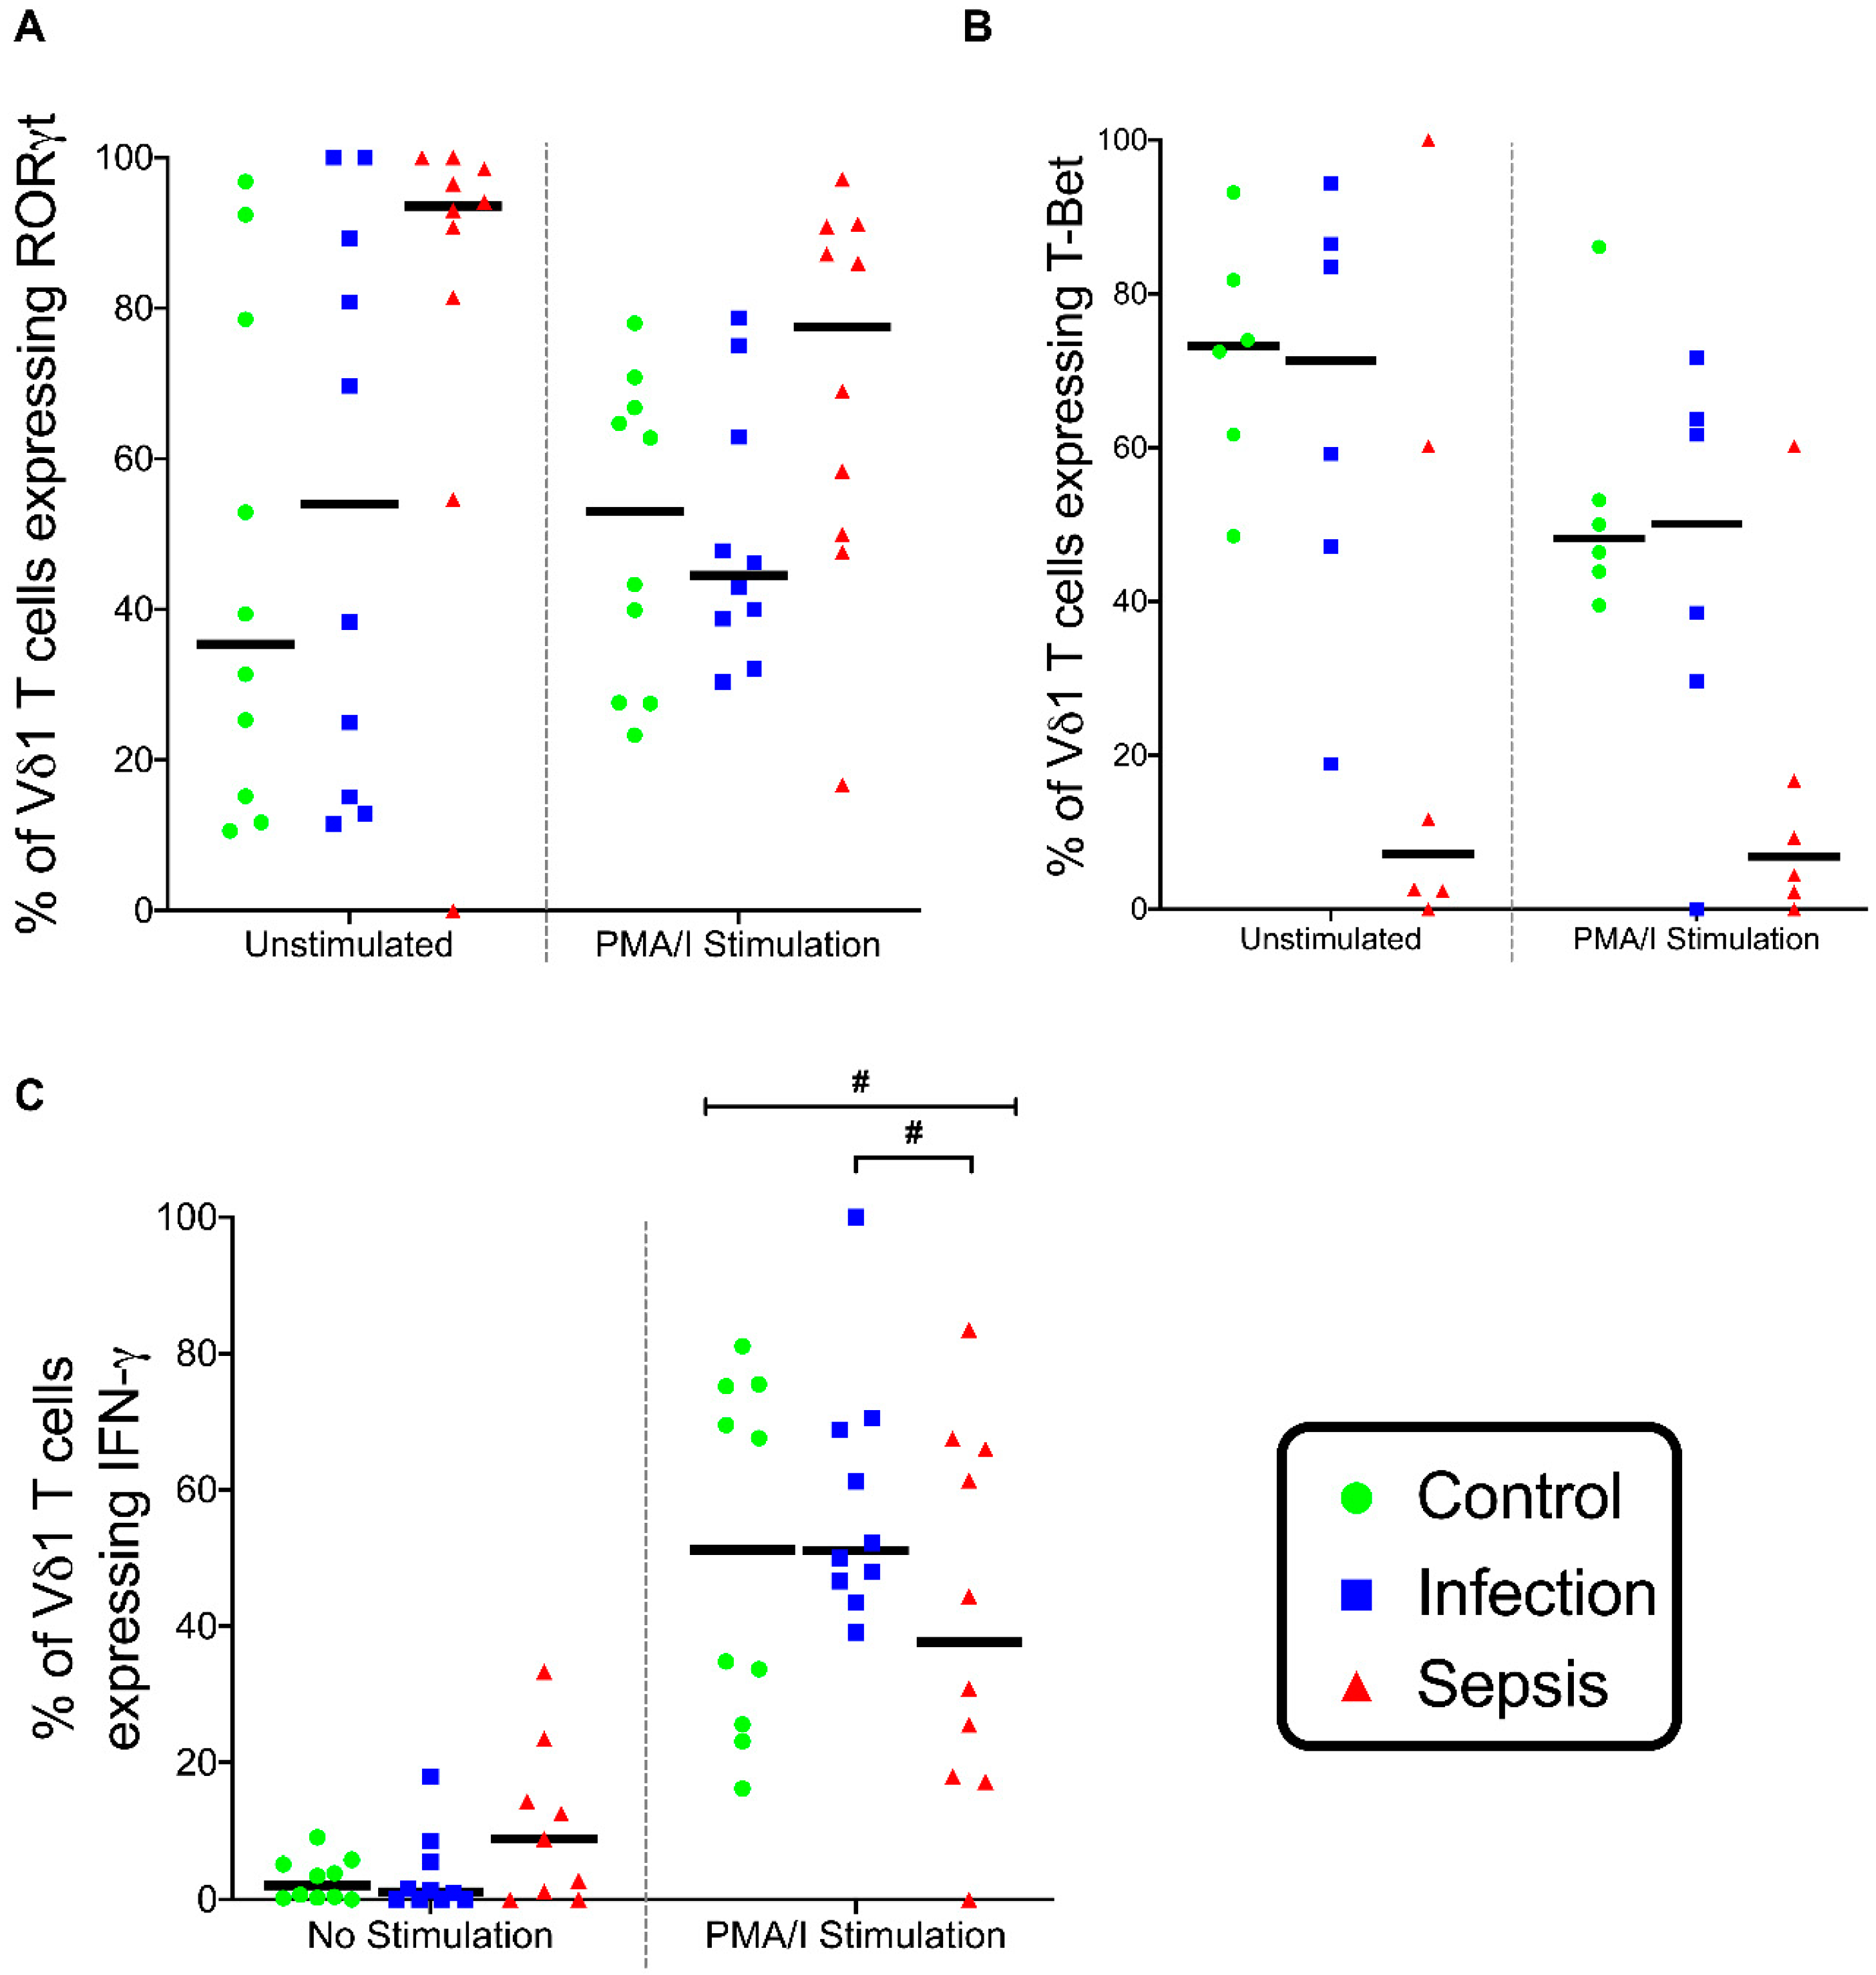
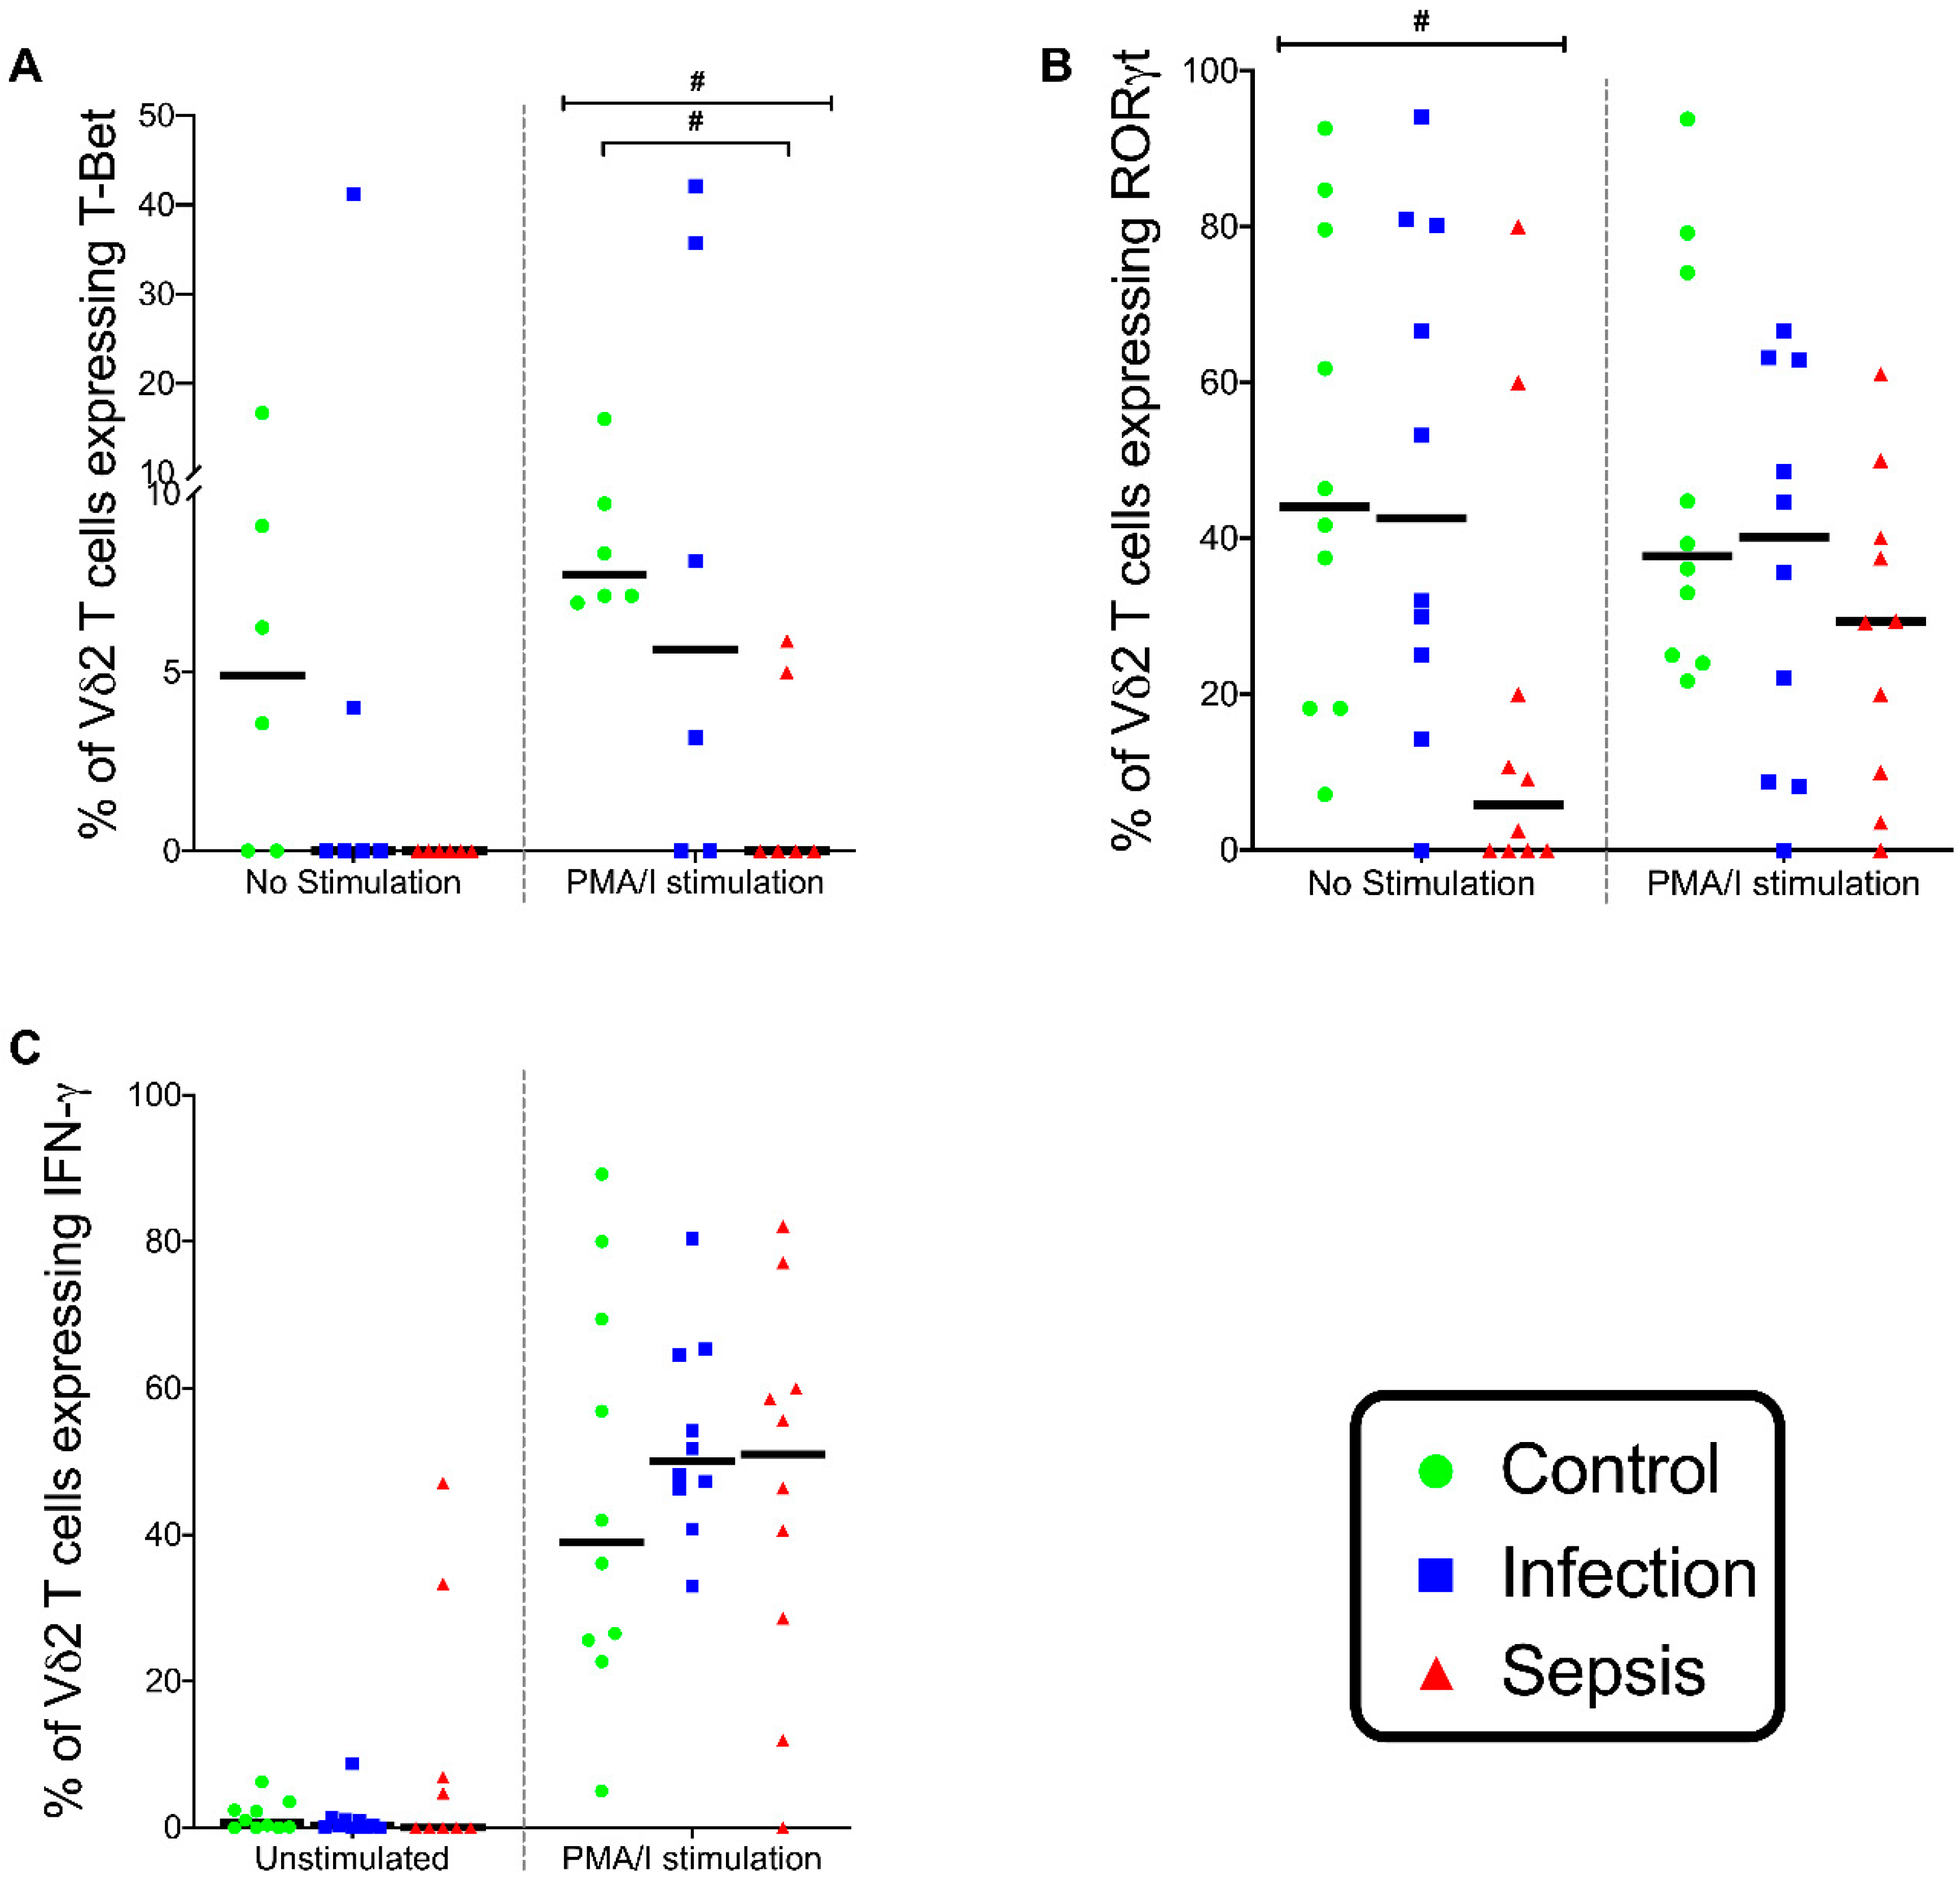
3.6. Gamma-Delta (γδ) T lymphocytes
4. Discussion
5. Conclusions
Author Contributions
Funding
Acknowledgments
Conflicts of Interest
References
- Angus, D.C.; Linde-Zwirble, W.T.; Lidicker, J.; Clermont, G.; Carcillo, J.; Pinsky, M.R. Epidemiology of severe sepsis in the United States: Analysis of incidence, outcome, and associated costs of care. Crit. Care Med. 2001, 29, 1303–1310. [Google Scholar] [CrossRef] [PubMed]
- Seok, J.; Warren, H.S.; Cuenca, A.G.; Mindrinos, M.N.; Baker, H.V.; Xu, W.; Richards, D.R.; McDonald-Smith, G.P.; Gao, H.; Hennessy, L.; et al. Genomic responses in mouse models poorly mimic human inflammatory diseases. Proc. Natl. Acad. Sci. USA 2013, 110, 3507–3512. [Google Scholar] [CrossRef] [Green Version]
- Venet, F.; Filipe-Santos, O.; Lepape, A.; Malcus, C.; Poitevin-Later, F.; Grives, A.; Plantier, N.; Pasqual, N.; Monneret, G. Decreased T-cell repertoire diversity in sepsis: A preliminary study. Crit. Care Med. 2013, 41, 111–119. [Google Scholar] [CrossRef]
- Lukaszewicz, A.C.; Grienay, M.; Resche-Rigon, M.; Pirracchio, R.; Faivre, V.; Boval, B.; Payen, D. Monocytic HLA-DR expression in intensive care patients: Interest for prognosis and secondary infection prediction. Crit. Care Med. 2009, 37, 2746–2752. [Google Scholar]
- Hotchkiss, R.S.; Osmon, S.B.; Chang, K.C.; Wagner, T.H.; Coopersmith, C.M.; Karl, I.E. Accelerated lymphocyte death in sepsis occurs by both the death receptor and mitochondrial pathways. J. Immunol. 2005, 174, 5110–5118. [Google Scholar] [CrossRef] [Green Version]
- Monneret, G.; Lepape, A.; Voirin, N.; Bohe, J.; Venet, F.; Debard, A.L.; Thizy, H.; Bienvenu, J.; Gueyffier, F.; Vanhems, P. Persisting low monocyte human leukocyte antigen-DR expression predicts mortality in septic shock. Intensive Care Med. 2006, 32, 1175–1183. [Google Scholar] [CrossRef]
- Grimaldi, D.; Louis, S.; Pene, F.; Sirgo, G.; Rousseau, C.; Claessens, Y.E.; Vimeux, L.; Cariou, A.; Mira, J.P.; Hosmalin, A.; et al. Profound and persistent decrease of circulating dendritic cells is associated with ICU-acquired infection in patients with septic shock. Intensive Care Med. 2011, 37, 1438–1446. [Google Scholar] [CrossRef]
- Forel, J.M.; Chiche, L.; Thomas, G.; Mancini, J.; Farnarier, C.; Cognet, C.; Guervilly, C.; Daumas, A.; Vely, F.; Xeridat, F.; et al. Phenotype and functions of natural killer cells in critically-ill septic patients. PLoS ONE 2012, 7, e50446. [Google Scholar] [CrossRef] [Green Version]
- Inoue, S.; Suzuki-Utsunomiya, K.; Okada, Y.; Taira, T.; Iida, Y.; Miura, N.; Tsuji, T.; Yamagiwa, T.; Morita, S.; Chiba, T.; et al. Reduction of immunocompetent T cells followed by prolonged lymphopenia in severe sepsis in the elderly. Crit. Care Med. 2013, 41, 810–819. [Google Scholar] [CrossRef]
- Hotchkiss, R.S.; Monneret, G.; Payen, D. Sepsis-induced immunosuppression: From cellular dysfunctions to immunotherapy. Nat. Rev. Immunol. 2013, 13, 862–874. [Google Scholar] [CrossRef]
- Hotchkiss, R.S.; Monneret, G.; Payen, D. Immunosuppression in sepsis: A novel understanding of the disorder and a new therapeutic approach. Lancet Infect. Dis. 2013, 13, 260–268. [Google Scholar] [CrossRef] [Green Version]
- Coakley, J.D.; Breen, E.P.; Moreno-Olivera, A.; Al-Harbi, A.I.; Melo, A.M.; O’Connell, B.; McManus, R.; Doherty, D.G.; Ryan, T. Dysregulated T helper type 1 (Th1) and Th17 responses in elderly hospitalised patients with infection and sepsis. PLoS ONE 2019, 14, e0224276. [Google Scholar] [CrossRef]
- Treiner, E.; Duban, L.; Bahram, S.; Radosavljevic, M.; Wanner, V.; Tilloy, F.; Affaticati, P.; Gilfillan, S.; Lantz, O. Selection of evolutionarily conserved mucosal-associated invariant T cells by MR1. Nature 2003, 422, 164–169. [Google Scholar] [CrossRef]
- Dusseaux, M.; Martin, E.; Serriari, N.; Peguillet, I.; Premel, V.; Louis, D.; Milder, M.; Le Bourhis, L.; Soudais, C.; Treiner, E.; et al. Human MAIT cells are xenobiotic-resistant, tissue-targeted, CD161hi IL-17-secreting T cells. Blood 2011, 117, 1250–1259. [Google Scholar] [CrossRef]
- Ben Youssef, G.; Tourret, M.; Salou, M.; Ghazarian, L.; Houdouin, V.; Mondot, S.; Mburu, Y.; Lambert, M.; Azarnoush, S.; Diana, J.S.; et al. Ontogeny of human mucosal-associated invariant T cells and related T cell subsets. J. Exp. Med. 2018, 215, 459–479. [Google Scholar] [CrossRef]
- Smith, D.J.; Hill, G.R.; Bell, S.C.; Reid, D.W. Reduced mucosal associated invariant T-cells are associated with increased disease severity and Pseudomonas aeruginosa infection in cystic fibrosis. PLoS ONE 2014, 9, e109891. [Google Scholar] [CrossRef]
- Grimaldi, D.; Le Bourhis, L.; Sauneuf, B.; Dechartres, A.; Rousseau, C.; Ouaaz, F.; Milder, M.; Louis, D.; Chiche, J.D.; Mira, J.P.; et al. Specific MAIT cell behaviour among innate-like T lymphocytes in critically ill patients with severe infections. Intensive Care Med. 2014, 40, 192–201. [Google Scholar] [CrossRef]
- Brossay, L.; Chioda, M.; Burdin, N.; Koezuka, Y.; Casorati, G.; Dellabona, P.; Kronenberg, M. CD1d-mediated recognition of an alpha-galactosylceramide by natural killer T cells is highly conserved through mammalian evolution. J. Exp. Med. 1998, 188, 1521–1528. [Google Scholar] [CrossRef] [Green Version]
- Bendelac, A.; Savage, P.B.; Teyton, L. The biology of NKT cells. Annu. Rev. Immunol. 2007, 25, 297–336. [Google Scholar] [CrossRef] [PubMed] [Green Version]
- Passos, S.T.; Silver, J.S.; O’Hara, A.C.; Sehy, D.; Stumhofer, J.S.; Hunter, C.A. IL-6 promotes NK cell production of IL-17 during toxoplasmosis. J. Immunol. 2010, 184, 1776–1783. [Google Scholar] [CrossRef] [Green Version]
- Young, J.S.; Monaghan, S.F.; Chung, C.S.; Cioffi, W.G.; Ayala, A.; Heffernan, D.S. Divergent invariant natural killer T-cell response to sepsis of abdominal vs. non-abdominal origin in human beings. Surg. Infect. 2015, 16, 29–35. [Google Scholar] [CrossRef] [PubMed]
- Heffernan, D.S.; Monaghan, S.F.; Chung, C.S.; Cioffi, W.G.; Gravenstein, S.; Ayala, A. A divergent response of innate regulatory T-cells to sepsis in humans: Circulating invariant natural killer T-cells are preserved. Hum. Immunol. 2014, 75, 277–282. [Google Scholar] [CrossRef] [PubMed]
- Bai, L.; Picard, D.; Anderson, B.; Chaudhary, V.; Luoma, A.; Jabri, B.; Adams, E.J.; Savage, P.B.; Bendelac, A. The majority of CD1d-sulfatide-specific T cells in human blood use a semiinvariant Vdelta1 TCR. Eur. J. Immunol. 2012, 42, 2505–2510. [Google Scholar] [CrossRef] [PubMed]
- Mangan, B.A.; Dunne, M.R.; O’Reilly, V.P.; Dunne, P.J.; Exley, M.A.; O’Shea, D.; Scotet, E.; Hogan, A.E.; Doherty, D.G. Cutting edge: CD1d restriction and Th1/Th2/Th17 cytokine secretion by human Vdelta3 T cells. J. Immunol. 2013, 191, 30–34. [Google Scholar] [CrossRef]
- Tyler, C.J.; Doherty, D.G.; Moser, B.; Eberl, M. Human Vgamma9/Vdelta2 T cells: Innate adaptors of the immune system. Cell Immunol. 2015, 296, 10–21. [Google Scholar] [CrossRef]
- Naylor, K.; Li, G.; Vallejo, A.N.; Lee, W.W.; Koetz, K.; Bryl, E.; Witkowski, J.; Fulbright, J.; Weyand, C.M.; Goronzy, J.J. The influence of age on T cell generation and TCR diversity. J. Immunol. 2005, 174, 7446–7452. [Google Scholar] [CrossRef]
- National Consent Advisory Group. National Consent Policy; National Consent Advisory Group: Dublin, Ireland, 2017. [Google Scholar]
- Singer, M.; Deutschman, C.S.; Seymour, C.W.; Shankar-Hari, M.; Annane, D.; Bauer, M.; Bellomo, R.; Bernard, G.R.; Chiche, J.D.; Coopersmith, C.M.; et al. The Third International Consensus Definitions for Sepsis and Septic Shock (Sepsis-3). JAMA 2016, 315, 801–810. [Google Scholar] [CrossRef]
- Fleischmann, C.; Thomas-Rueddel, D.O.; Hartmann, M.; Hartog, C.S.; Welte, T.; Heublein, S.; Dennler, U.; Reinhart, K. Hospital Incidence and Mortality Rates of Sepsis. Dtsch. Arztebl. Int. 2016, 113, 159–166. [Google Scholar]
- Cosmi, L.; De Palma, R.; Santarlasci, V.; Maggi, L.; Capone, M.; Frosali, F.; Rodolico, G.; Querci, V.; Abbate, G.; Angeli, R.; et al. Human interleukin 17-producing cells originate from a CD161+CD4+ T cell precursor. J. Exp. Med. 2008, 205, 1903–1916. [Google Scholar] [CrossRef]
- Maggi, L.; Santarlasci, V.; Capone, M.; Peired, A.; Frosali, F.; Crome, S.Q.; Querci, V.; Fambrini, M.; Liotta, F.; Levings, M.K.; et al. CD161 is a marker of all human IL-17-producing T-cell subsets and is induced by RORC. Eur. J. Immunol. 2010, 40, 2174–2181. [Google Scholar] [CrossRef]
- Venet, F.; Bohe, J.; Debard, A.L.; Bienvenu, J.; Lepape, A.; Monneret, G. Both percentage of gammadelta T lymphocytes and CD3 expression are reduced during septic shock. Crit. Care Med. 2005, 33, 2836–2840. [Google Scholar] [CrossRef] [PubMed]
- Zhu, J.; Yamane, H.; Paul, W.E. Differentiation of effector CD4 T cell populations (*). Annu. Rev. Immunol. 2010, 28, 445–489. [Google Scholar] [CrossRef] [PubMed] [Green Version]
- Damsker, J.M.; Hansen, A.M.; Caspi, R.R. Th1 and Th17 cells: Adversaries and collaborators. Ann. N. Y. Acad. Sci. 2010, 1183, 211–221. [Google Scholar] [CrossRef]
- Boehm, U.; Klamp, T.; Groot, M.; Howard, J.C. Cellular responses to interferon-gamma. Annu. Rev. Immunol. 1997, 15, 749–795. [Google Scholar] [CrossRef]
- White, M.; Lawless, M.W.; O’Dwyer, M.J.; Grealy, R.; Connell, B.O.; Stordeur, P.; Kelleher, D.; McManus, R.; Ryan, T. Transforming growth factor beta-1 and interleukin-17 gene transcription in peripheral blood mononuclear cells and the human response to infection. Cytokine 2010, 50, 322–327. [Google Scholar] [CrossRef] [PubMed]
- Carvelli, J.; Piperoglou, C.; Bourenne, J.; Farnarier, C.; Banzet, N.; Demerle, C.; Gainnier, M.; Vely, F. Imbalance of Circulating Innate Lymphoid Cell Subpopulations in Patients With Septic Shock. Front. Immunol. 2019, 10, 2179. [Google Scholar] [CrossRef]
- van der Geest, K.S.M.; Kroesen, B.J.; Horst, G.; Abdulahad, W.H.; Brouwer, E.; Boots, A.M.H. Impact of Aging on the Frequency, Phenotype, and Function of CD161-Expressing T Cells. Front. Immunol. 2018, 9, 752. [Google Scholar] [CrossRef] [Green Version]
- Miao, J.; Zhang, K.; Qiu, F.; Li, T.; Lv, M.; Guo, N.; Han, Q.; Zhu, P. Percentages of CD4+CD161+ and CD4-CD8-CD161+ T cells in the synovial fluid are correlated with disease activity in rheumatoid arthritis. Mediat. Inflamm. 2015, 2015, 563713. [Google Scholar] [CrossRef]
- Miao, J.; Zhang, K.; Lv, M.; Li, Q.; Zheng, Z.; Han, Q.; Guo, N.; Fan, C.; Zhu, P. Circulating Th17 and Th1 cells expressing CD161 are associated with disease activity in rheumatoid arthritis. Scand. J. Rheumatol. 2014, 43, 194–201. [Google Scholar] [CrossRef]


| Clinical Data | Immunophenotype Study | Stimulation Experiment | |||||
|---|---|---|---|---|---|---|---|
| Control | Infection | Septic | Control | Infection | Septic | ||
| n | 20 | 19 | 32 | 10 | 10 | 10 | |
| Age | 73 [69–78.25] | 81.5 [70.25–87.25] | 73.5 [68.75–79.25] | 72 [67–74.5] | 85 [68.75–87.5] | 57.5 [53.75–69.25] | |
| Male Gender | 6 (30%) | 11 (58%) | 20 (62.5%) | 5 (50%) | 6 (60%) | 4 (40%) | |
| APACHE score | N/A | 12.5 [8–16.5] | 19 [16–24.5] p < 0.0001 | N/A | 14 [10–14] | 21.5 [16.25–24.5] | |
| SAPS score | N/A | N/A | 48 [37.75–54.5] | N/A | N/A | 49 [38.25–55.75] | |
| SOFA score on admission | N/A | 3 [1.75–4] | 7 [5.75–10] p < 0.0001 | N/A | 2 [0–3] | 10 [7.5–11.75] | |
| SOFA score on day of first sample | N/A | 1 [0.75–1.25] | 7 [5–8.25] | N/A | 1 [0,1] | 8 [4.5–9.75] | |
| Time to 1st sample from admission (days) | N/A | 2.5 [2,3] | 1.5 [0.75–2] | N/A | 3 [2.5–4.5] | 5 [4–6] | |
| ICU duration (days) | N/A | N/A | 14.5 [8.75–33.25] | N/A | N/A | 17.5 [9.25–26] | |
| Mortality in ICU | N/A | N/A | 11 (34.4%) | N/A | N/A | 1 (10%) | |
| Mortality in Hospital | N/A | 0 | 13 (40.6%) | N/A | 1 (10%) | 3 (30%) | |
| Inotropic Support | N/A | 0 | 30 (93.75%) | N/A | 0 | 10 (100%) | |
| Days on inotropes | N/A | 0 | 7 [3–13] | N/A | 0 | 7.5 [6–10.5] | |
| Invasive ventilation | N/A | N/A | 28 (87.5%) | N/A | N/A | 9 (90%) | |
| Days on invasive ventilation | N/A | N/A | 14.5 [5–29.25] | N/A | N/A | 8.5 [6.25–14.5] | |
| p/F ratio (mmHg) | N/A | 265.5 [331–392.25] | 170 [135.75–240.5] | N/A | 411.5 [386.5–436.5] | 163 [129–205.75] | |
| Muscle Relaxant infusion | N/A | N/A | 11 (34.4%) | N/A | N/A | 5 (50%) | |
| Acute Kidney Injury KDIGO grade ≥1 | 0 | 6 (31.58%) | 26 (81.25%) | 0 | 2 (20%) | 10 (100%) | |
| Renal Replacement Therapy | 0 | 0 | 16 (50%) | 0 | 0 | 8 (80%) | |
| Stress dose steroids | 0 | 1 (5.3%) | 6 (18.75%) | 0 | 1 (10%) | 5 (50%) | |
| Source of Sepsis | Respiratory | N/A | 5 (26.3%) | 16 (50%) | N/A | 3 (30%) | 4 (40%) |
| Abdominal | N/A | 7 (36.8%) | 11 (34.4%) | N/A | 2 (20%) | 3 (30%) | |
| Skin | N/A | 0 | 4 (12.5%) | N/A | 1 (10%) | 1 (10%) | |
| Urine | N/A | 6 (31.6%) | 0 | N/A | 4 (40%) | 2 (20%) | |
| Osteomyelitis | N/A | 1 (5.3%) | 0 | N/A | 0 | 0 | |
| Mediastinitis | N/A | 0 | 1 (3.1%) | N/A | 0 | 0 | |
| Type of organism | Gram− ve organism | N/A | 16 (84%) | 9 (28%) | N/A | 5 (50%) | 5 (50%) |
| Gram+ ve organism | N/A | 3 (16%) | 9 (28%) | N/A | 5 (50%) | 2 (20%) | |
| Fungal | N/A | 0 | 1 (3%) | N/A | 0 | 0 | |
| Empiric treatment | N/A | 0 | 13 (41%) | N/A | 0 | 3 (30%) | |
| Secondary Infections | N/A | 0 | 17 (53.1%) | N/A | 0 | 5 (50%) | |
| Lactate on admission | N/A | 2.1 [1.15–3.57] | 2.86 [2.27–4.09] | N/A | 1.95 [1.6–3.1] | 2.63 [1.81–3.36] | |
| Comorbidities ≥ 1 | 19 (95%) | 18 (94.7%) | 26 (81.25%) | 7 (70%) | 9 (90%) | 8 (80%) | |
| Exclusion Criteria | |
|---|---|
| 1 | Any haematological disease |
| 2 | Pre-existing liver disease |
| 3 | Pre-existing immunodeficiency |
| 4 | Immune modulating medications (incl. steroids prior to onset of sepsis) |
| 5 | Chronic infection |
| 6 | Malignancy |
© 2020 by the authors. Licensee MDPI, Basel, Switzerland. This article is an open access article distributed under the terms and conditions of the Creative Commons Attribution (CC BY) license (http://creativecommons.org/licenses/by/4.0/).
Share and Cite
Coakley, J.D.; Breen, E.P.; Moreno-Olivera, A.; Al-Harbi, A.I.; Melo, A.M.; O’Connell, B.; McManus, R.; Doherty, D.G.; Ryan, T. Innate Lymphocyte Th1 and Th17 Responses in Elderly Hospitalised Patients with Infection and Sepsis. Vaccines 2020, 8, 311. https://doi.org/10.3390/vaccines8020311
Coakley JD, Breen EP, Moreno-Olivera A, Al-Harbi AI, Melo AM, O’Connell B, McManus R, Doherty DG, Ryan T. Innate Lymphocyte Th1 and Th17 Responses in Elderly Hospitalised Patients with Infection and Sepsis. Vaccines. 2020; 8(2):311. https://doi.org/10.3390/vaccines8020311
Chicago/Turabian StyleCoakley, John Davis, Eamon P. Breen, Ana Moreno-Olivera, Alhanouf I. Al-Harbi, Ashanty M. Melo, Brian O’Connell, Ross McManus, Derek G. Doherty, and Thomas Ryan. 2020. "Innate Lymphocyte Th1 and Th17 Responses in Elderly Hospitalised Patients with Infection and Sepsis" Vaccines 8, no. 2: 311. https://doi.org/10.3390/vaccines8020311