Article

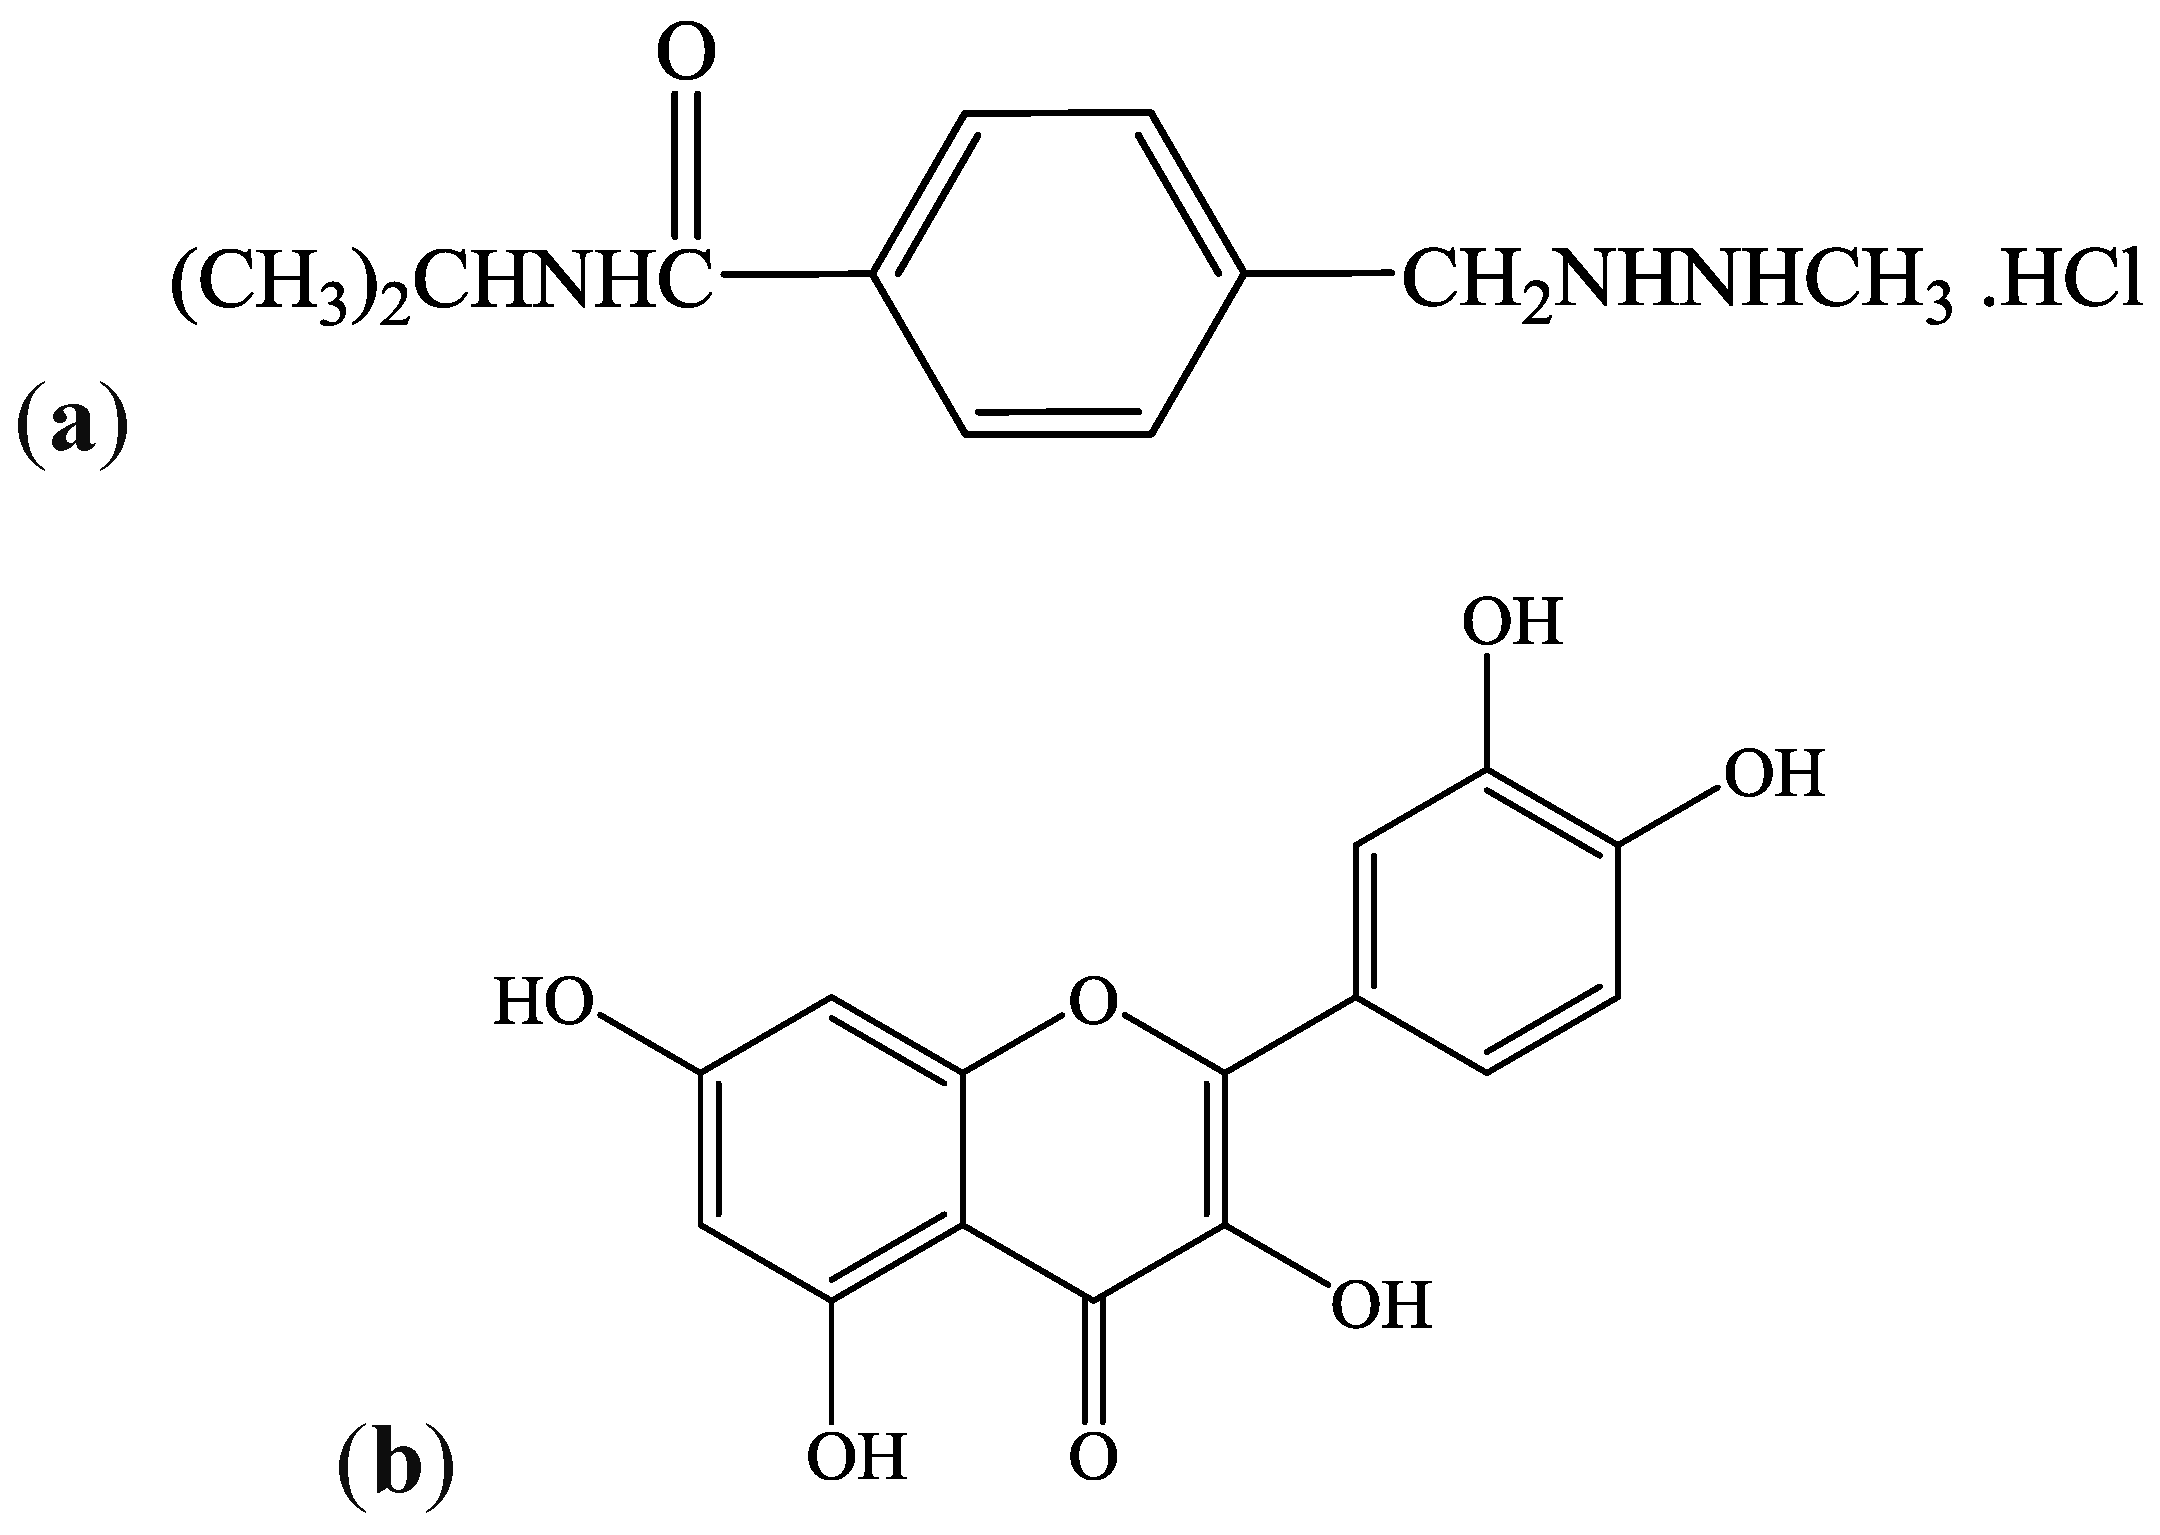
Quercetin, a Flavonoid Antioxidant, Ameliorated Procarbazine-Induced Oxidative Damage to Murine Tissues

by
Ebenezer Tunde Olayinka
*,
Ayokanmi Ore
,
Oluwatobi Adewumi Adeyemo
,
Olaniyi Solomon Ola
,
Olaoluwa Oluwaseun Olotu
and
Roseline Chinonye Echebiri
Biochemistry Unit, Department of Chemical Sciences, Ajayi Crowther University, PMB 1066, Oyo, Oyo State 211213, Nigeria
*
Author to whom correspondence should be addressed.
Antioxidants 2015, 4(2), 304-321; https://doi.org/10.3390/antiox4020304
Submission received: 16 January 2015 / Revised: 12 March 2015 / Accepted: 10 April 2015 / Published: 28 April 2015

Abstract

:
Procarbazine (PCZ) (indicated in Hodgkin’s disease), is an alkylating agent known to generate free radicals in vivo, while Quercetin (QCT) is a flavonoid antioxidant with proven free radical scavenging capacity. This study investigated the protective effects of QCT on PCZ-induced oxidative damage in the rat. Male Wistar rats (160–180 g) were randomized into five groups (n = 5/group): I (control), II PCZ-treated (2 mg/kg body weight (bw) for seven days); III pre-treated with QCT (20 mg/kg bw) for seven days, followed by PCZ for seven days; IV co-treated with PCZ and QCT for seven days and V administered QCT alone for seven days. PCZ caused a significant increase in plasma total bilirubin, urea, and creatinine when compared with control (P < 0.05). Similarly, plasma activities of alkaline phosphatase (ALP), aspartate aminotransferase (AST), alanine aminotransferase (ALT), and γ-glutamyl transferase (γ-GT) were significantly increased in the PCZ-treated group relative to control. Furthermore, PCZ caused a significant decrease in the activities of hepatic superoxide dismutase (SOD), catalase (CAT) and glutathione-S-transferase (GST) as well as levels of ascorbic acid (AA) and glutathione (GSH). This was followed by a significant increase in hepatic malondialdehyde (MDA) content. However, QCT pre-treatment and co-treatment ameliorated the PCZ-induced changes in plasma levels of urea, creatinine, and bilirubin as well as the activities of ALP, AST, ALT, and GGT. QCT also ameliorated hepatic AA and GSH levels and the activities of SOD, CAT, and GST. This all suggests that QCT protected against PCZ-induced oxidative damage in rats.

1. Introduction

Procarbazine (N-isopropyl-a-(2-methyl-hydrazine)-p-toluamide hydrochloride) (PCZ) is an orally administered alkylating anticancer agent used for the treatment of Hodgkin’s lymphoma, malignant melanoma, and brain tumors in children (Figure 1a). It is also administered as a component of a chemotherapeutic cocktail used in the treatment of Hodgkin’s disease, melanoma, and bronchogenic carcinoma [1]. PCZ is a prodrug, and therefore requires extensive metabolism for its bioactivation to reactive intermediates—a process involving CYP2B6 and CYP1A enzymes [2]. Following oral administration, it is first oxidized to azoprocarbazine and further oxidized to a mixture of methylazoxyprocarbazine and benzylazoxyprocarbazine isomers [3]. The methylazoxyprocarbazine produced has been proposed as the active metabolite responsible for anticancer activity in leukaemia [4].
The oxidation of PCZ by microsomal P450 systems and peroxidases produce free radical species. Active methyl and benzyl radicals have been shown to be formed through a nitrogen-centered radical intermediate following one-electron oxidation of PCZ [5,6]. The nitrogen-centered radical is postulated to undergo rearrangements to form carbon-centered radicals and nitrogen [6,7]. Although free radical formation and oxidative stress have been proposed as part of the pharmacological mechanisms of most alkylating agents [8], they also appear to contribute to the organ toxicities exhibited by these drugs [9]. Moreover, an excessive physiological level of free radicals, if not neutralized will lead to cell and tissue damage [8,10]. Some of the reported toxicities associated with procarbazine include mutagenicity [11], nephrotoxicity [12], granulomatous hepatitis [13], hepatotoxicity [14], as well as testicular and spermatotoxicity [15,16].
An array of antioxidant defense mechanisms present in the cell play a vital role in maintaining the physiological redox status and protect against the harmful effect of toxic drug metabolites and free radicals. These include the non-enzymic antioxidants like reduced glutathione (GSH), ascorbic acid (AA), and vitamin E among others and the enzymic antioxidants such as glutathione-S-transferase (GST), glutathione peroxidase (GPx), glutathione reductase (GR), superoxide dismutase (SOD), and catalase (CAT) [17]. Quercetin (QCT), Figure 1b, is a flavonoid antioxidant (of the flavonol subclass) which is ubiquitous in plants and plant food sources [18]. QCT and its derivatives have been promoted in several studies as potent antioxidants [15,19]. In addition, QCT possesses a number of pharmacological activities including antioxidant, anticancer, antimicrobial, and antiviral [20,21]. In recent studies, QCT was reported to protect against drug-induced genotoxicity [22], hepatotoxicity [23], nephrotoxicity [15], lung injury [24], and oxidative stress in vivo [25].
Figure 1. Chemical structures of Procarbazine (N-isopropyl-a-(2-methyl-hydrazine)-p-toluamide hydrochloride) (a), and Quercetin (3,5,7,3′,4′-pentahydroxyflavone) (b).
Antioxidants 04 00304 g001
One of the challenges associated with the use of alkylating agents is the phenomenon of drug-induced toxicity. Considering the popular use of alkylating agents in chemotherapy, it is thought that antioxidant supplementation may offer protection against toxic side effects. Use of antioxidants along with anticancer agents has been demonstrated to have little or no effect on anticancer activity [26]. For instance, QCT used in the present study was reported to protect against anticancer drug-induced toxicity in vivo without compromising antitumor activity [27]. Rather, it is known to improve the chemotherapeutic efficacy of certain alkylating agents in vivo [28]. Moreover, comparative studies in rats and in Hodgkin’s lymphoma patients suggest that human biotransformation of procarbazine is similar to that of rat [29]. Little or no work on the protective effect of QCT on PCZ-induced oxidative damage has been reported previously. Consequently, the present study was designed to investigate the protective effect of quercetin pre-treatment and co-treatment on procarbazine-induced nephrotoxicity, hepatoxicity, and oxidative stress in the rat model.

2. Materials and Methods

2.1. Chemicals and Reagents

The following substances were employed: Procarbazine Hydrochloride Capsules (Naprod Life Sciences Pvt. Ltd., Mumbai, India); Quercetin, Glutathione, 1-chloro-2,4-dinitrobenzene (CDNB), 5,5′-dithio bis-2-nitrobenzoic acid (DTNB), epinephrine, and hydrogen peroxide (H2O2), (Sigma® Chemical Company, London, UK); Assay kits for alanine aminotransferase (ALT), aspartate aminotransferase (AST), alkaline phosphatase (ALP), gamma glutamyl transferase (GGT), urea, Creatinine, total bilirubin (RANDOX® Laboratories Ltd., Antrim, UK). All other reagents used in the study were of analytical grade and highest purity.

2.2. Animal Selection and Care

Twenty five male Wistar rats weighing between 160 and 180 g were obtained from the animal holding unit, Department of Chemical Sciences, Ajayi Crowther University, Oyo, Nigeria. The rats were acclimatized under laboratory conditions prior to experiment. The animals were housed in wire-meshed cages and provided with food and water ad libitum. The animals were maintained at standard conditions of temperature and humidity with 12 h light/dark cycles. They were fed with commercial rat diet (Ladokun® Feeds, Nigeria Ltd., Ibadan, Nigeria). The study was approved by the ethical committee of the Faculty of Natural Sciences, Ajayi Crowther University, Oyo, Nigeria. Handling of the experimental animals also conforms to international guidelines on the care and use of laboratory animals (National Research Council) [30].

2.3. Animal Grouping and Drug Treatments

The animals were randomly assigned into five experimental groups (I–V) of five animals each. The animals of each group were treated as presented in Table 1. The dose for PCZ (2 mg/kg bw) was selected based on the recommended adult dose for Hodgkin’s disease while the dose for QCT (20 mg/kg bw) was arrived at based on available literature [31]. The respective doses were worked out according to the average weight of animals in each treatment groups and delivered in one mL of distilled water. The drug doses were administered once daily by oral intubation.
Table 1. Experimental design.
Treatment—GroupsTreatments—Duration
Day 1–7Day 8–14
I (CTRL)-Control; distilled water
II (PCZ)-2 mg/kg bw PCZ
III (PCZ + QCT-P)20 mg/kg bw QCT2 mg/kg bw PCZ
IV (PCZ + QCT-C)-2 mg/kg bw PCZ + 20 mg/kg bw QCT
V (QCT-A)-20 mg/kg bw QCT

2.4. Animal Sacrifice, Collection of Blood and Liver Samples

Blood samples were collected from each animal 24 h after the final treatments, through retro orbitals plexus into heparinized tubes (Li heparin). Animals were thereafter sacrificed and liver was carefully excised from each animal for preparation of the cytosolic fraction.

2.5. Preparation of Plasma and Cytosolic Fractions

Plasma was obtained by centrifugation of whole blood sample at 4000 rpm for 5 minutes using a CENCOM® bench centrifuge (Analytika, Athens, Greece). The plasma obtained were stored at –4 °C for subsequent plasma assays. The liver excised from each rat was blotted of blood stains, rinsed in ice-cold 1.15% KCl and homogenized in 4 volumes of ice-cold 0.01 M potassium phosphate buffer, (pH 7.4). The homogenates were centrifuged at 12,500× g for 15 min at –4 °C (Eppendorf UK Ltd., Stevenage, UK) and the supernatants, termed the post-mitochondrial fractions (PMF) were aliquoted and used for subsequent biochemical assays.

2.6. Determination of Plasma and Liver Protein Content

The protein concentration in the plasma and liver PMF was determined according to the biuret method of Gornall et al. [32], based on the reaction of peptide bonds in proteins with Cu2+ in moderately alkaline medium. This results in a purple colored chelate of the protein with maximum absorbance at 540 nm. The intensity of the purple color is proportional to the amount of protein present. The reaction mixture consists of 4 mL of biuret reagent and 1 mL of appropriately diluted sample. A blank was prepared with 4 mL of biuret solution and 1 mL of distilled water. The protein concentration in the samples was extrapolated from the standard bovine serum albumin (BSA) curve.

2.7. Assay of Biomarkers of Nephrotoxicity

Plasma urea and creatinine was determined with RANDOX® diagnostic kits following the manufacturer’s protocol. The method for creatinine assays was based on a colorimetric alkaline picrate method [33] with creatinine-picrate complex measured at 492 nm. Plasma urea determination was based on the Fenton reaction [34] with the diazine chromogen formed absorbing strongly at 540 nm.

2.8. Assay of Biomarkers of Hepatotoxicity

Biomarkers of hepatotoxicity, plasma total bilirubin (TBILI) level, and activities of alkaline phosphatase (ALP), alanine aminotransferase (ALT), aspartate aminotransferase (AST), and gamma glutamyl transferase (γ-GT) were assayed using RANDOX® diagnostic kits based on the manufacturer’s procedure. Assay of TBILI level was based on the dimethyl sulphoxide method of Tietz et al. [35]. The dimethyl sulphoxide formed a colored compound with maximum absorption at 550 nm. ALP activity was determined in accordance with the principles of Tietz [35]. The p-nitrophenol formed by the hydrolysis of p-nitrophenyl phosphate confers a yellowish color to the reaction mixture and its intensity can be monitored at 405 nm to give a measure of enzyme activity. Determination of plasma ALT and AST activities was based on the principle described by Reltman and Frankel [36]. ALT activity was measured by monitoring the concentration of pyruvate hydrazone formed with 2,4-dinitrophenylhydrazine at 546 nm. AST activity was measured by monitoring the concentration of oxaloacetate hydrazone formed with 2,4-dinitrophenylhydrazine at 546 nm. γ-GT activity was determined following the principle described by Szasz [37]. The substrate L-γ-glutamyl-3-carboxy-4-nitroanilide, in the presence of glycylglycine is converted to 5-amino-2-nitrobenzoate by γ-GT measured at 405 nm. The increase in absorbance is proportional to γ-GT activity.

2.9. Assay for Non-Enzymatic Antioxidants in the Liver

2.9.1. Hepatic Reduced Glutathione Level (GSH)

The level of hepatic GSH was determined according to the method of Jollow et al. [38]. The chromophoric product resulting from the reaction of Ellman’s reagent (5,5′-dithiobis-(2-nitrobenzoic acid), DTNB) with the reduced glutathione, 2-nitro-5-thiobenzoic acid possesses a molar absorption at 412 nm which was read using a spectrophotometer. Briefly, the reaction mixture was made up of 0.2 mL of sample, 1.8 mL of distilled water and 3 mL of 4% sulphosalicylic acid. The mixture was allowed to stand for 5 minutes and then filtered. 1 mL of the filtrate was added to 4 mL of 0.1 M phosphate buffer and finally, 0.5 mL of Ellmans’ reagent (0.04% in 0.1M phosphate buffer, pH 7.4) was added. A blank was prepared with 4 mL of the 0.1 M phosphate buffer, 1 mL of diluted sulphosalicylic acid and 0.5 mL of the Ellman’s reagent. The absorbance was measured at 412 nm. GSH concentration in the samples was estimated from the standard curve for GSH.

2.9.2. Hepatic Ascorbic Acid Level (AA)

The ascorbic acid (AA) concentration in the liver PMF was determined according to the method of Jagota and Dani [39]. In this procedure, AA in biological samples reacts with Folin Ciocalteu (Folin-phenol) reagent, an oxidizing agent to give a blue color which has maximum absorbance at 760 nm. Only strong reductants like ascorbic acid can react with Folin-phenol reagent under acidic conditions and interference by other possible substances is eliminated. Briefly, 0.5 mL of test sample was added to 0.8 mL of 10% TCA in a test tube. After vigorous shaking, the tubes were kept in an ice bath for 5 minutes and centrifuged at 3000× g for another 5 min. Two mL of supernatants were added to 0.2 mL of Folin’s reagent (diluted 10 fold in ddH2O) and stirred vigorously. After 10 min, the absorbance of the blue color developed was measured using a spectrophotometer at 760 nm. The ascorbic acid concentration (μg/mL) in the liver post mitochondrial fraction was extrapolated from the ascorbic acid standard curve. A standard curve was prepared by taking varying concentrations of standard ascorbic acid in ddH2O, ranging from 0.05 to 0.7 mL using a procedure similar to the one above.

2.10. Assay of Hepatic Antioxidant Enzymes

2.10.1. Hepatic Glutathione S-Transferase (GST) Activity

Hepatic GST activity was determined by the method described by Habig et al. [40] using 1-chloro-2,4-dinitrobenzene (CDNB) as substrate. Briefly, the assay mixture (3 mL) was made up of 30 μL of reduced GSH (0.1 M), 150 μL of CDNB (3.37 mg/ mL), 2.79 mL phosphate buffer (0.1 M, pH 6.5) and 30 μL of liver PMF. The reaction was allowed to run for 60 seconds before the absorbance was measured at 340 nm against the blank. GST activity in the liver homogenate was determined from the following equation:
G S T   A c t i v i t y   ( μ m o l e /   m i n / m g   p r o t e i n ) = A b s / m i n 9.6 × 1 0.03 × p r o t e i n   ( m g )
9.6, the molar extinction coefficient of CDNB (mmol−1cm−1); 0.03, volume of PMF used in mL.

2.10.2. Hepatic Superoxide Dismutase (SOD) Activity

The procedure of Misra and Fridovich [41] was used for the determination of hepatic superoxide dismutase (SOD) activity by measuring the inhibition of auto-oxidation of epinephrine at pH 10.2. One mL of the sample was diluted in 9 mL of distilled water to obtain a 1 in 10 dilution. An aliquot of 0.2 mL of the diluted enzyme preparation was added to 2.5 mL of 0.05 M carbonate buffer (pH 10.2), equilibrated in the spectrophotometer, and the reaction was started by the addition of 0.3 mL of freshly prepared 0.3 mM epinephrine to the mixture which was quickly mixed by inversion. The reference cuvette contained 2.5 mL of carbonate buffer, 0.3 mL of adrenaline and 0.2 mL of distilled water. The increase in absorbance at 480 nm was monitored every 30 s for 150 s. Activity of SOD in the liver PMF was expressed as follows:
%   I n h i b i t i o n = I n c r e a s e   i n   A b s   o f   s a m p l e I n c r e a s e   i n   A b s   o f   b l a n k × 100
One Unit of SOD activity is defined as the amount of SOD necessary to cause 50% inhibition of the oxidation of adrenaline to adrenochrome over an interval of one minute.
S O D   a c t i v i t y   ( U n i t / m g ) = S O D ( U n i t ) T o t a l   p r o t e i n   ( m g ) × d f
df = dilution factor

2.10.3. Hepatic Catalase Activity

Hepatic catalase activity was determined by the method described by Singha [42] based on the reduction of dichromate in acetic acid to chromic acetate when heated in the presence of hydrogen peroxide (H2O2). The assay mixture, 4 mL of H2O2 solution (800 μmoles), 5 mL of phosphate buffer (0.01 M, pH 7.0), 1 mL of diluted liver PMF (1:50) was rapidly mixed at room temperature. A 1 mL portion of reaction mixture was withdrawn and blown into 2 mL dichromate/acetic acid reagent at 60 seconds intervals to determine the amount of H2O2 remaining. The chromic acetate produced was measured spectrophotometrically at 570 nm and the amount of H2O2 remaining was extrapolated from the standard curve for H2O2. Catalase activity was expressed as micromole of H2O2 consumed per min per mg protein.

2.11. Assay of Hepatic Level of Lipid Peroxidation

The extent of lipid peroxidation (LPO) in the liver was estimated by the method of Vashney and Kale [43]. The method involved the reaction between malondialdehyde (MDA; product of lipid peroxidation) and thiobarbituric acid to yield a stable pink chromophore with maximum absorption at 532 nm. Briefly, the reaction mixture consisted of 1.6 mL Tris-KCl buffer, 0.4 mL of the test sample, 0.5 mL of 30% TCA, 0.5 mL of 0.75% TBA and the mixture was placed in a water bath for 1 h at 95 °C. This was then cooled in ice and centrifuged at 3000 rpm. The clear supernatant was collected and the absorbance measured against a reference blank of distilled water at 532 nm in a spectrophotometer. Lipid peroxidation in nmole/mg protein was computed as:
M D A = A b s × V o l u m e   o f   R e a c t i o n   M i x t u r e E 532 × V o l u m e   o f   S a m p l e × m g   p r o t e i n
where E532 is the molar extinction coefficient for MDA = 1.56 × 10⁵ M−1 Cm−1

2.12. Statistical Analysis

Data are presented as the mean ± standard deviation (SD) of five replicates. Statistical significance was determined by one-way analysis of variance (ANOVA) followed by Duncan’s multiple comparison between control and treated rats in all groups using SigmaPlot® statistical package (Systat Software Inc., San Jose, CA, USA). P-values less than 0.05 (P < 0.05) were considered statistically significant.

3. Results

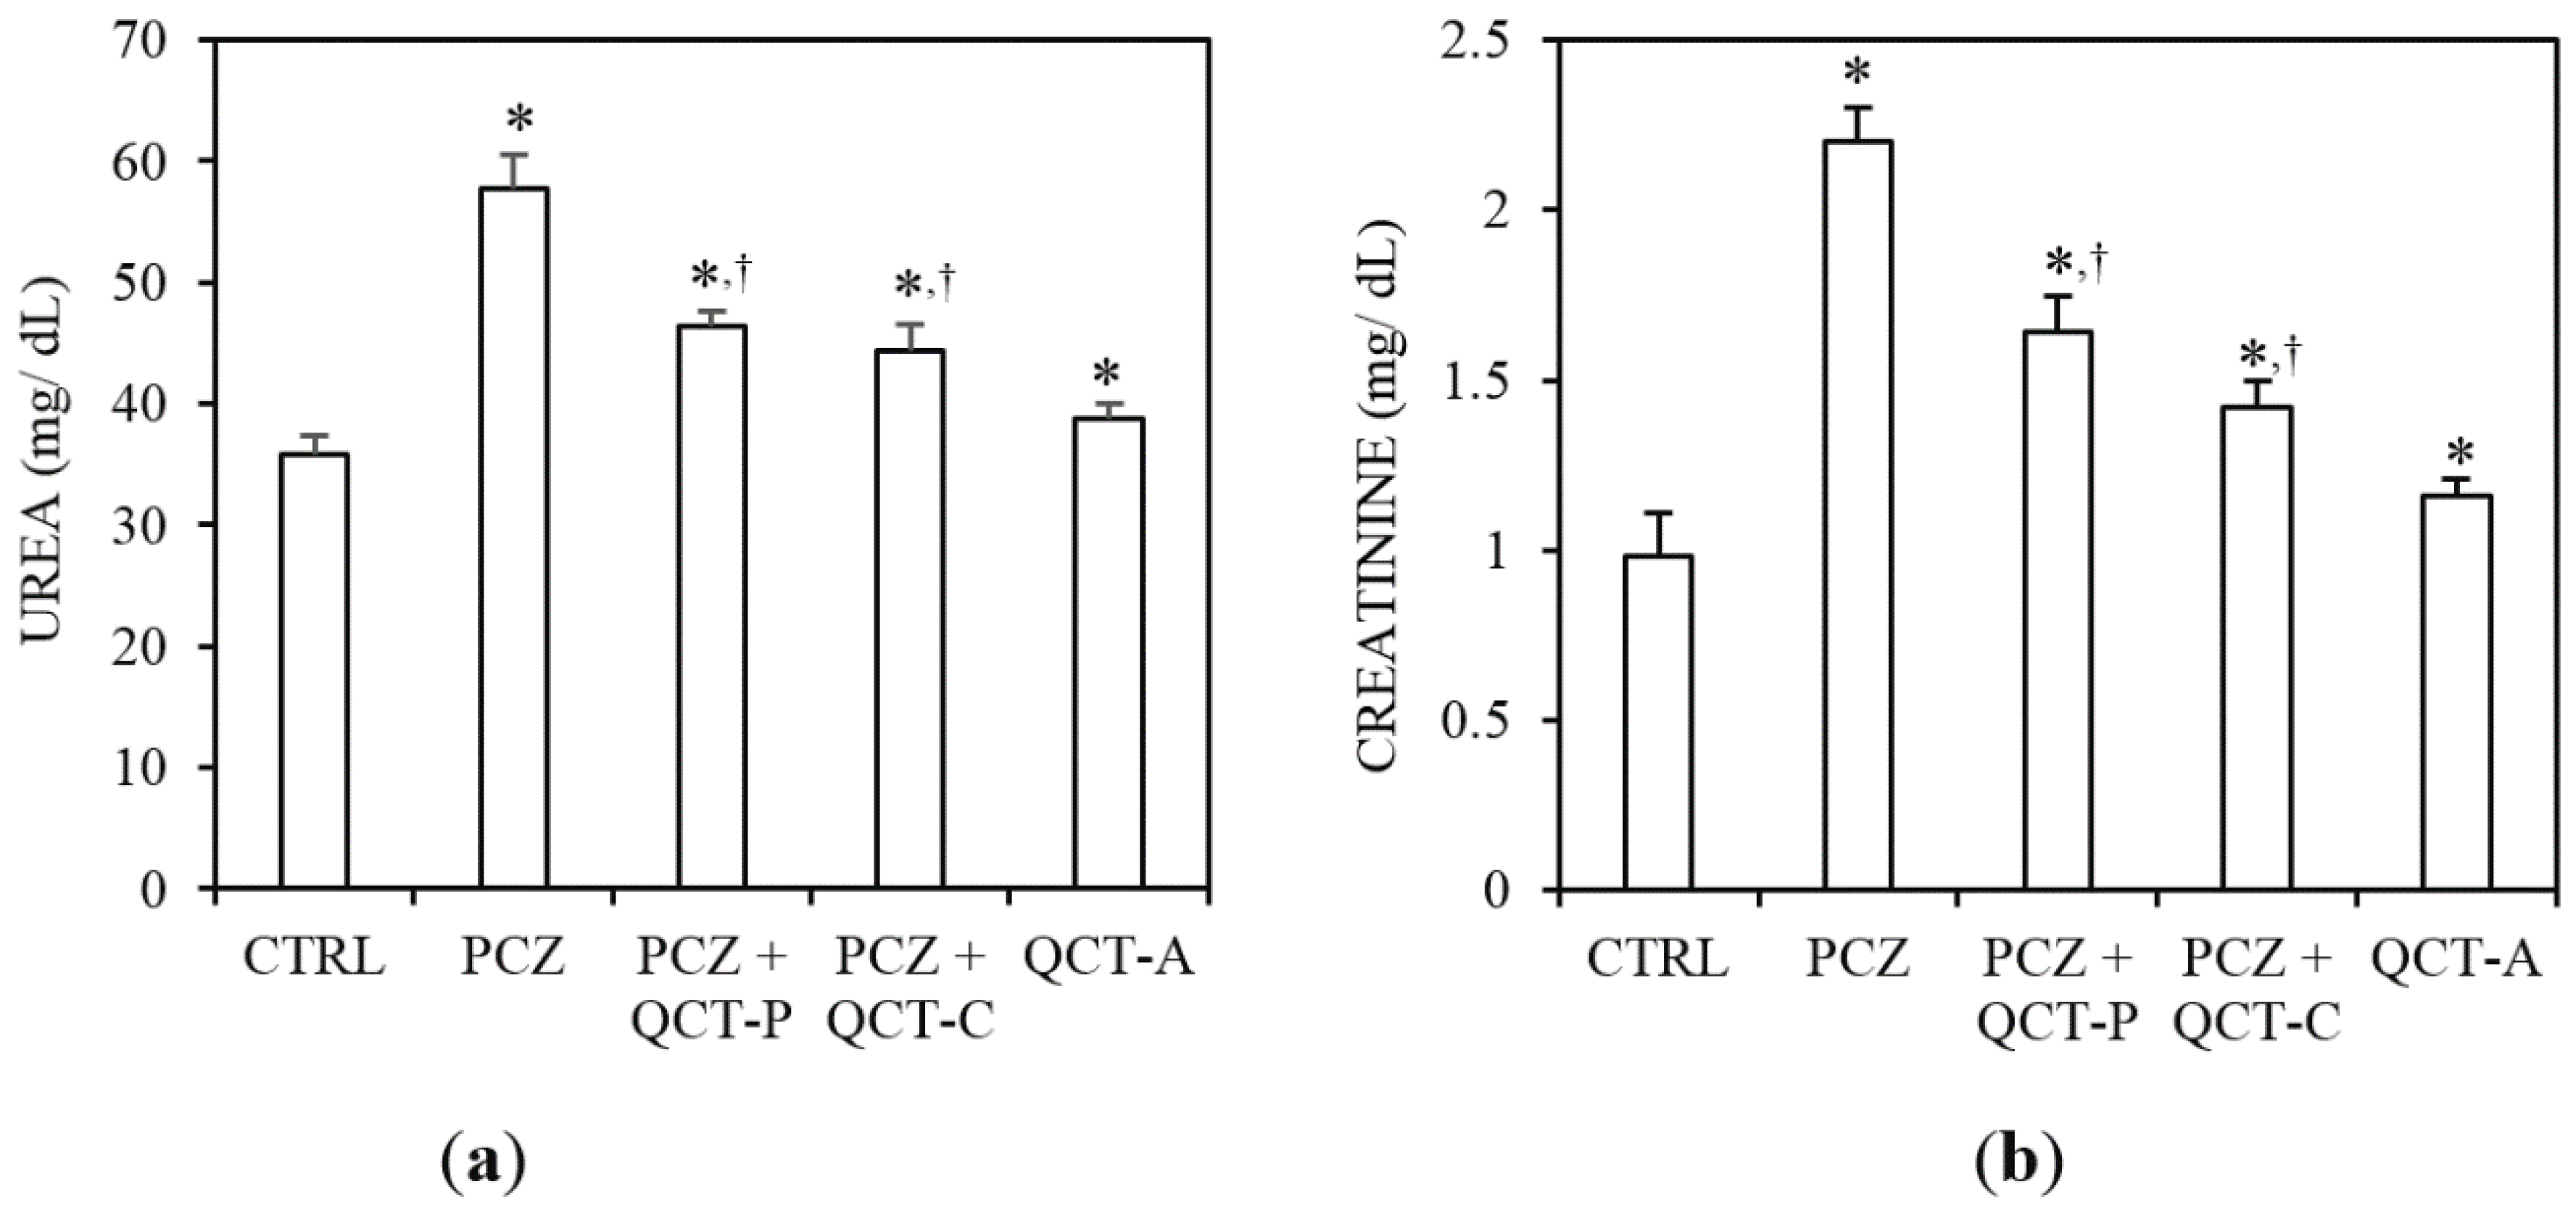
3.1. QCT Pre-Treatment and Co-Treatment Protects against PCZ-Induced Nephrotoxicity in Rats

Figure 2 represent the protective effect of QCT pre-treatment and co-treatment against PCZ-induced changes in plasma urea and bilirubin levels in rat. Administration of PCZ caused a significant (P < 0.05) increase in plasma urea level by 60.9% compared to control (Figure 2a). In a similar manner, plasma creatinine (Figure 2b) increased significantly by 124.5% relative to the control (P < 0.05). However, pre-administration and co-administration of QCT with PCZ attenuated the observed elevated plasma urea and creatinine levels when compared with the PCZ-treated group.
Figure 2. Protective effect of QCT pre-treatment and co-treatment against PCZ-induced changes in biomarkers of nephrotoxicity in rats. Data represent the means ± SD for five rats in each group; * significantly different from the CTRL; significantly different from PCZ (P < 0.05).
Antioxidants 04 00304 g002

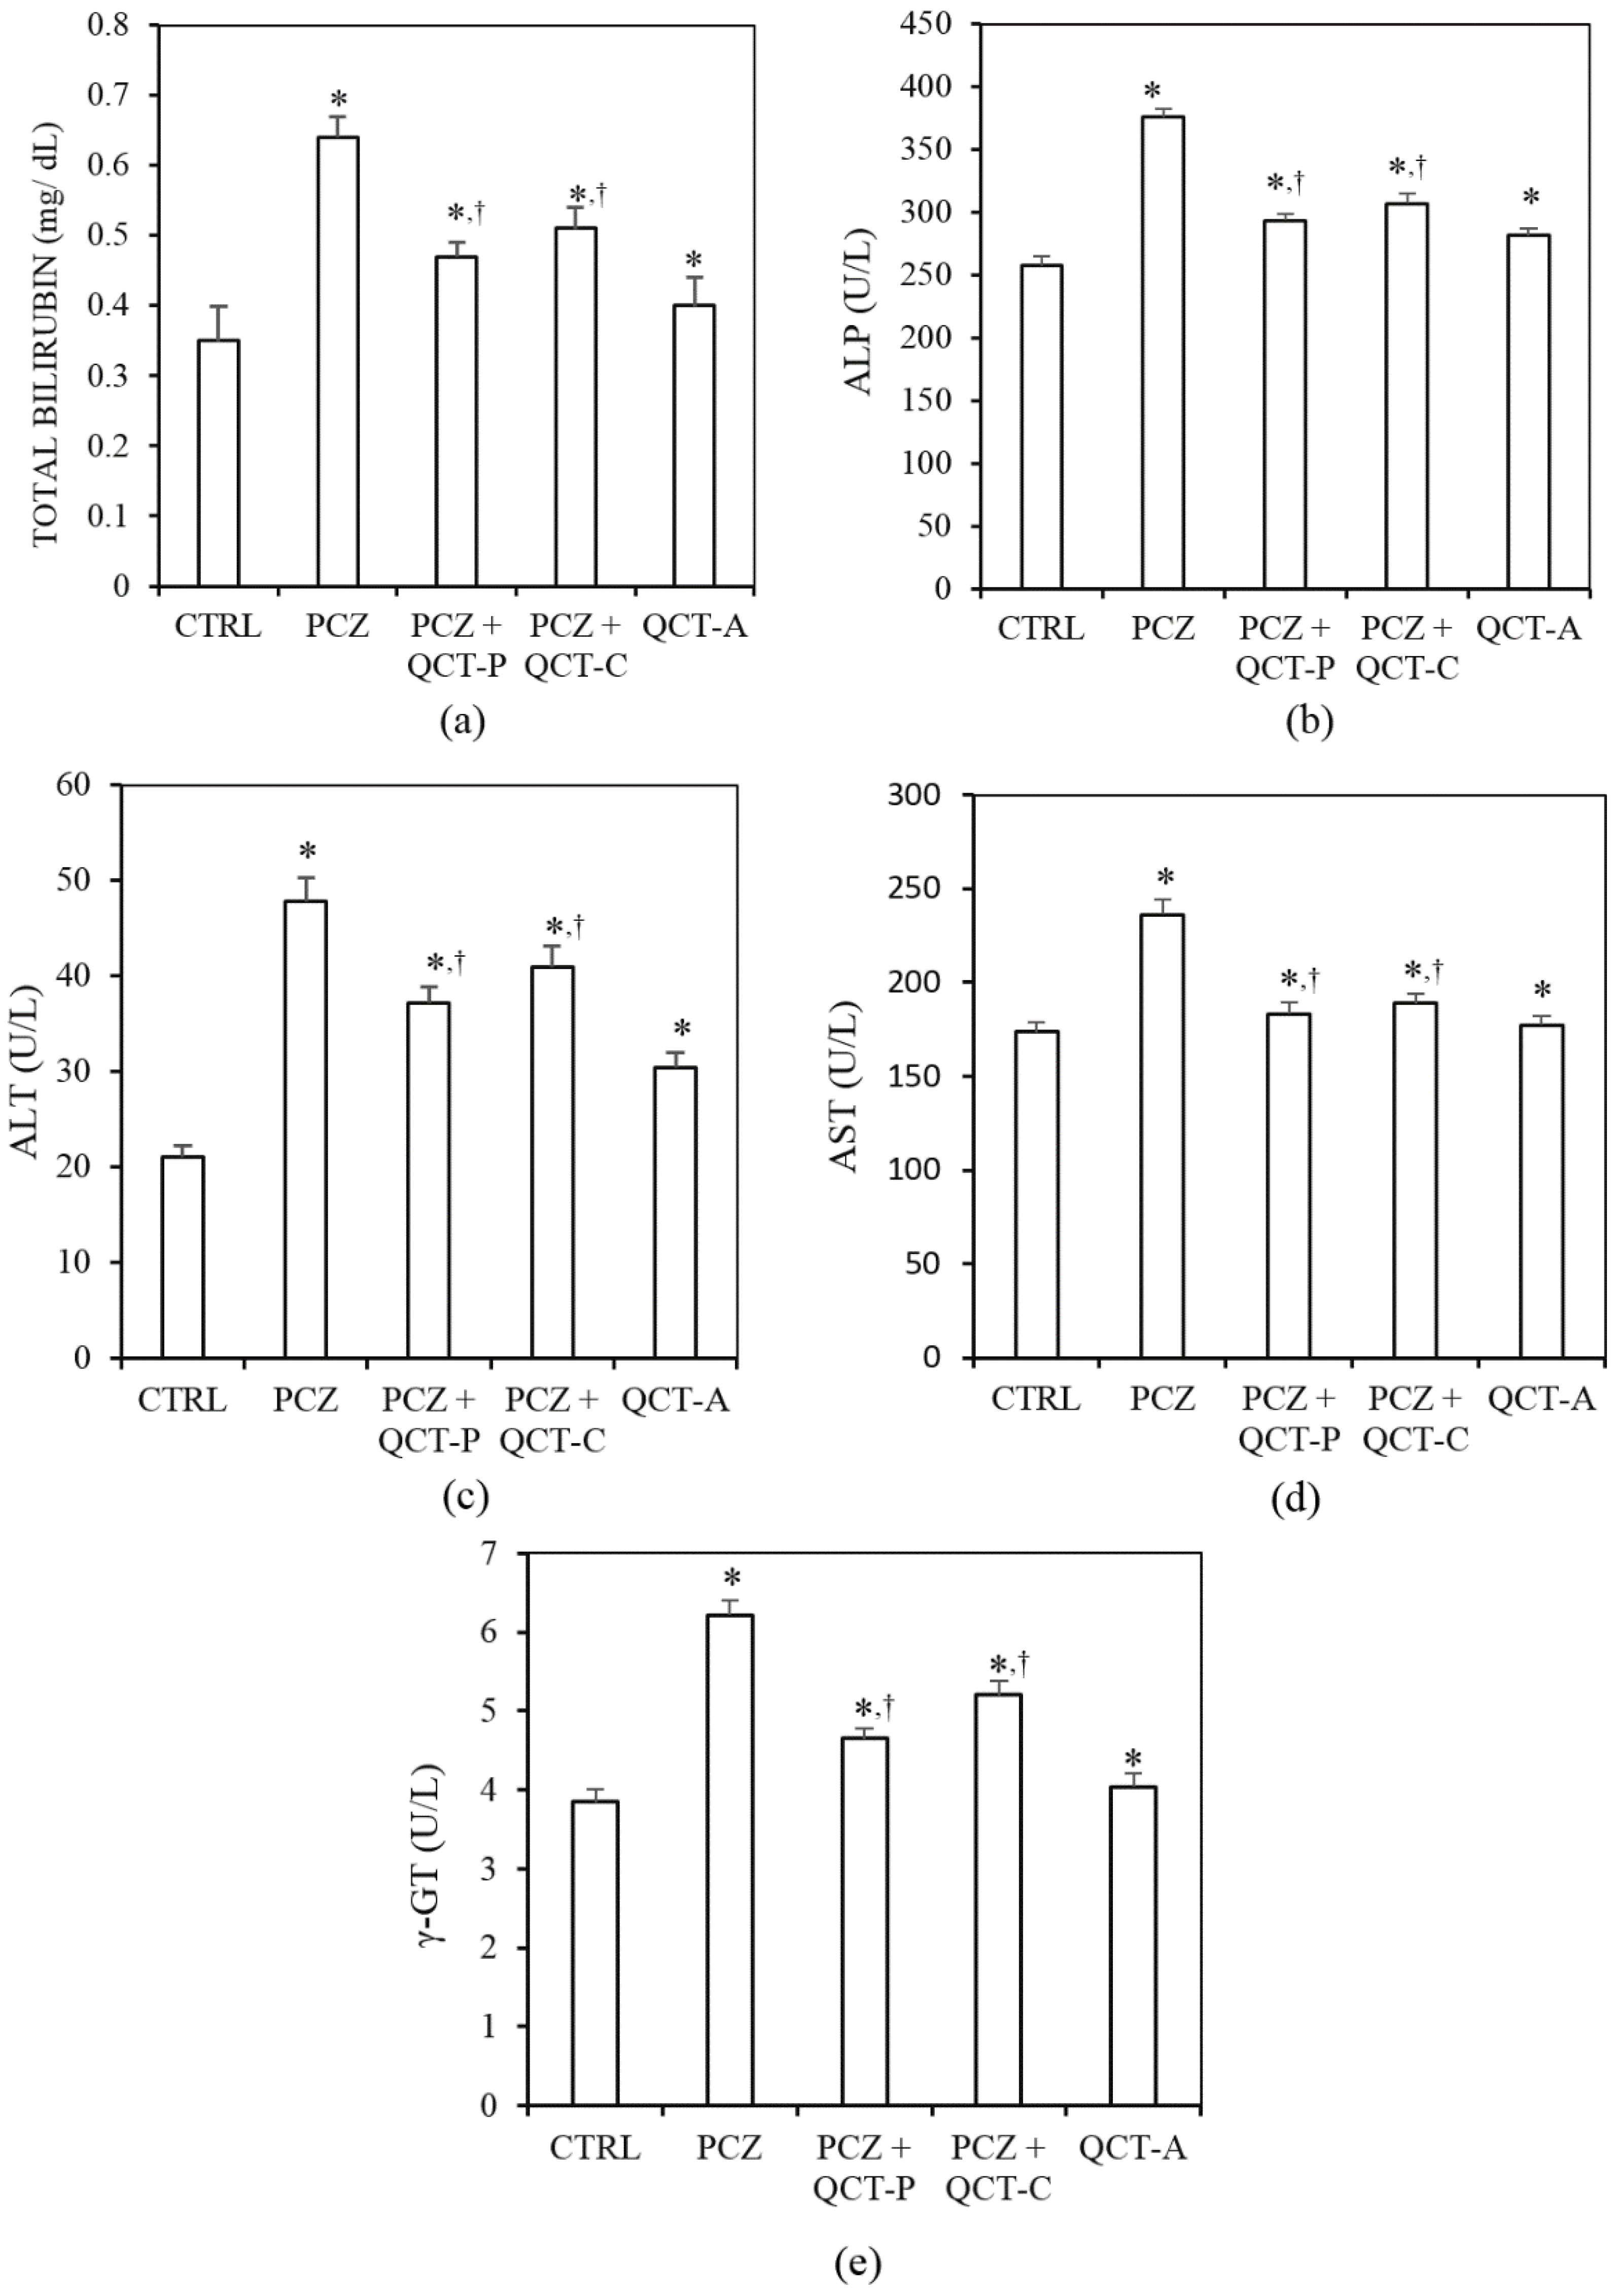
3.2. QCT Pre-Treatment and Co-Treatment Protects against PCZ-Induced Hepatotoxicity in Rats

The influence of QCT pre-treatment and co-treatment on PCZ-induced changes in biomarkers of hepatotoxicity in rats is presented in Figure 3. The plasma level of total bilirubin (TBILI) and alkaline phosphatase (ALP) activity (which are biomarkers of hepatobiliary damage) increased significantly (P < 0.05) in rats by 83.3% and 46.7% respectively following PCZ treatment (Figure 3a,b). However, the levels of TBILI and ALP activity were significantly ameliorated in the plasma of animals pre-treated or co-treated with QCT when compared with the PCZ group.
Figure 3. Protective effect of QCT pre-treatment and co-treatment against PCZ-induced changes in biomarkers of hepatotoxicity in rats. Data represent the means ± SD for five rats in each group; * significantly different from the CTRL; significantly different from PCZ (P < 0.05).
Antioxidants 04 00304 g003
PCZ treatment also caused a significant increase in the activities of alanine aminotransferase (ALT), aspartate aminotransferase (AST), and gamma glutamyl transferase (γ-GT) (biomarkers of hepatocellular toxicity) in the plasma of rats by 127%, 36% and 62% respectively compared to values in control (Figure 3c–e). Pre-treatment and co-treatment of QCT with PCZ significantly ameliorated the elevated activities of plasma ALT, AST, and γ-GT when compared to PCZ-treated group.

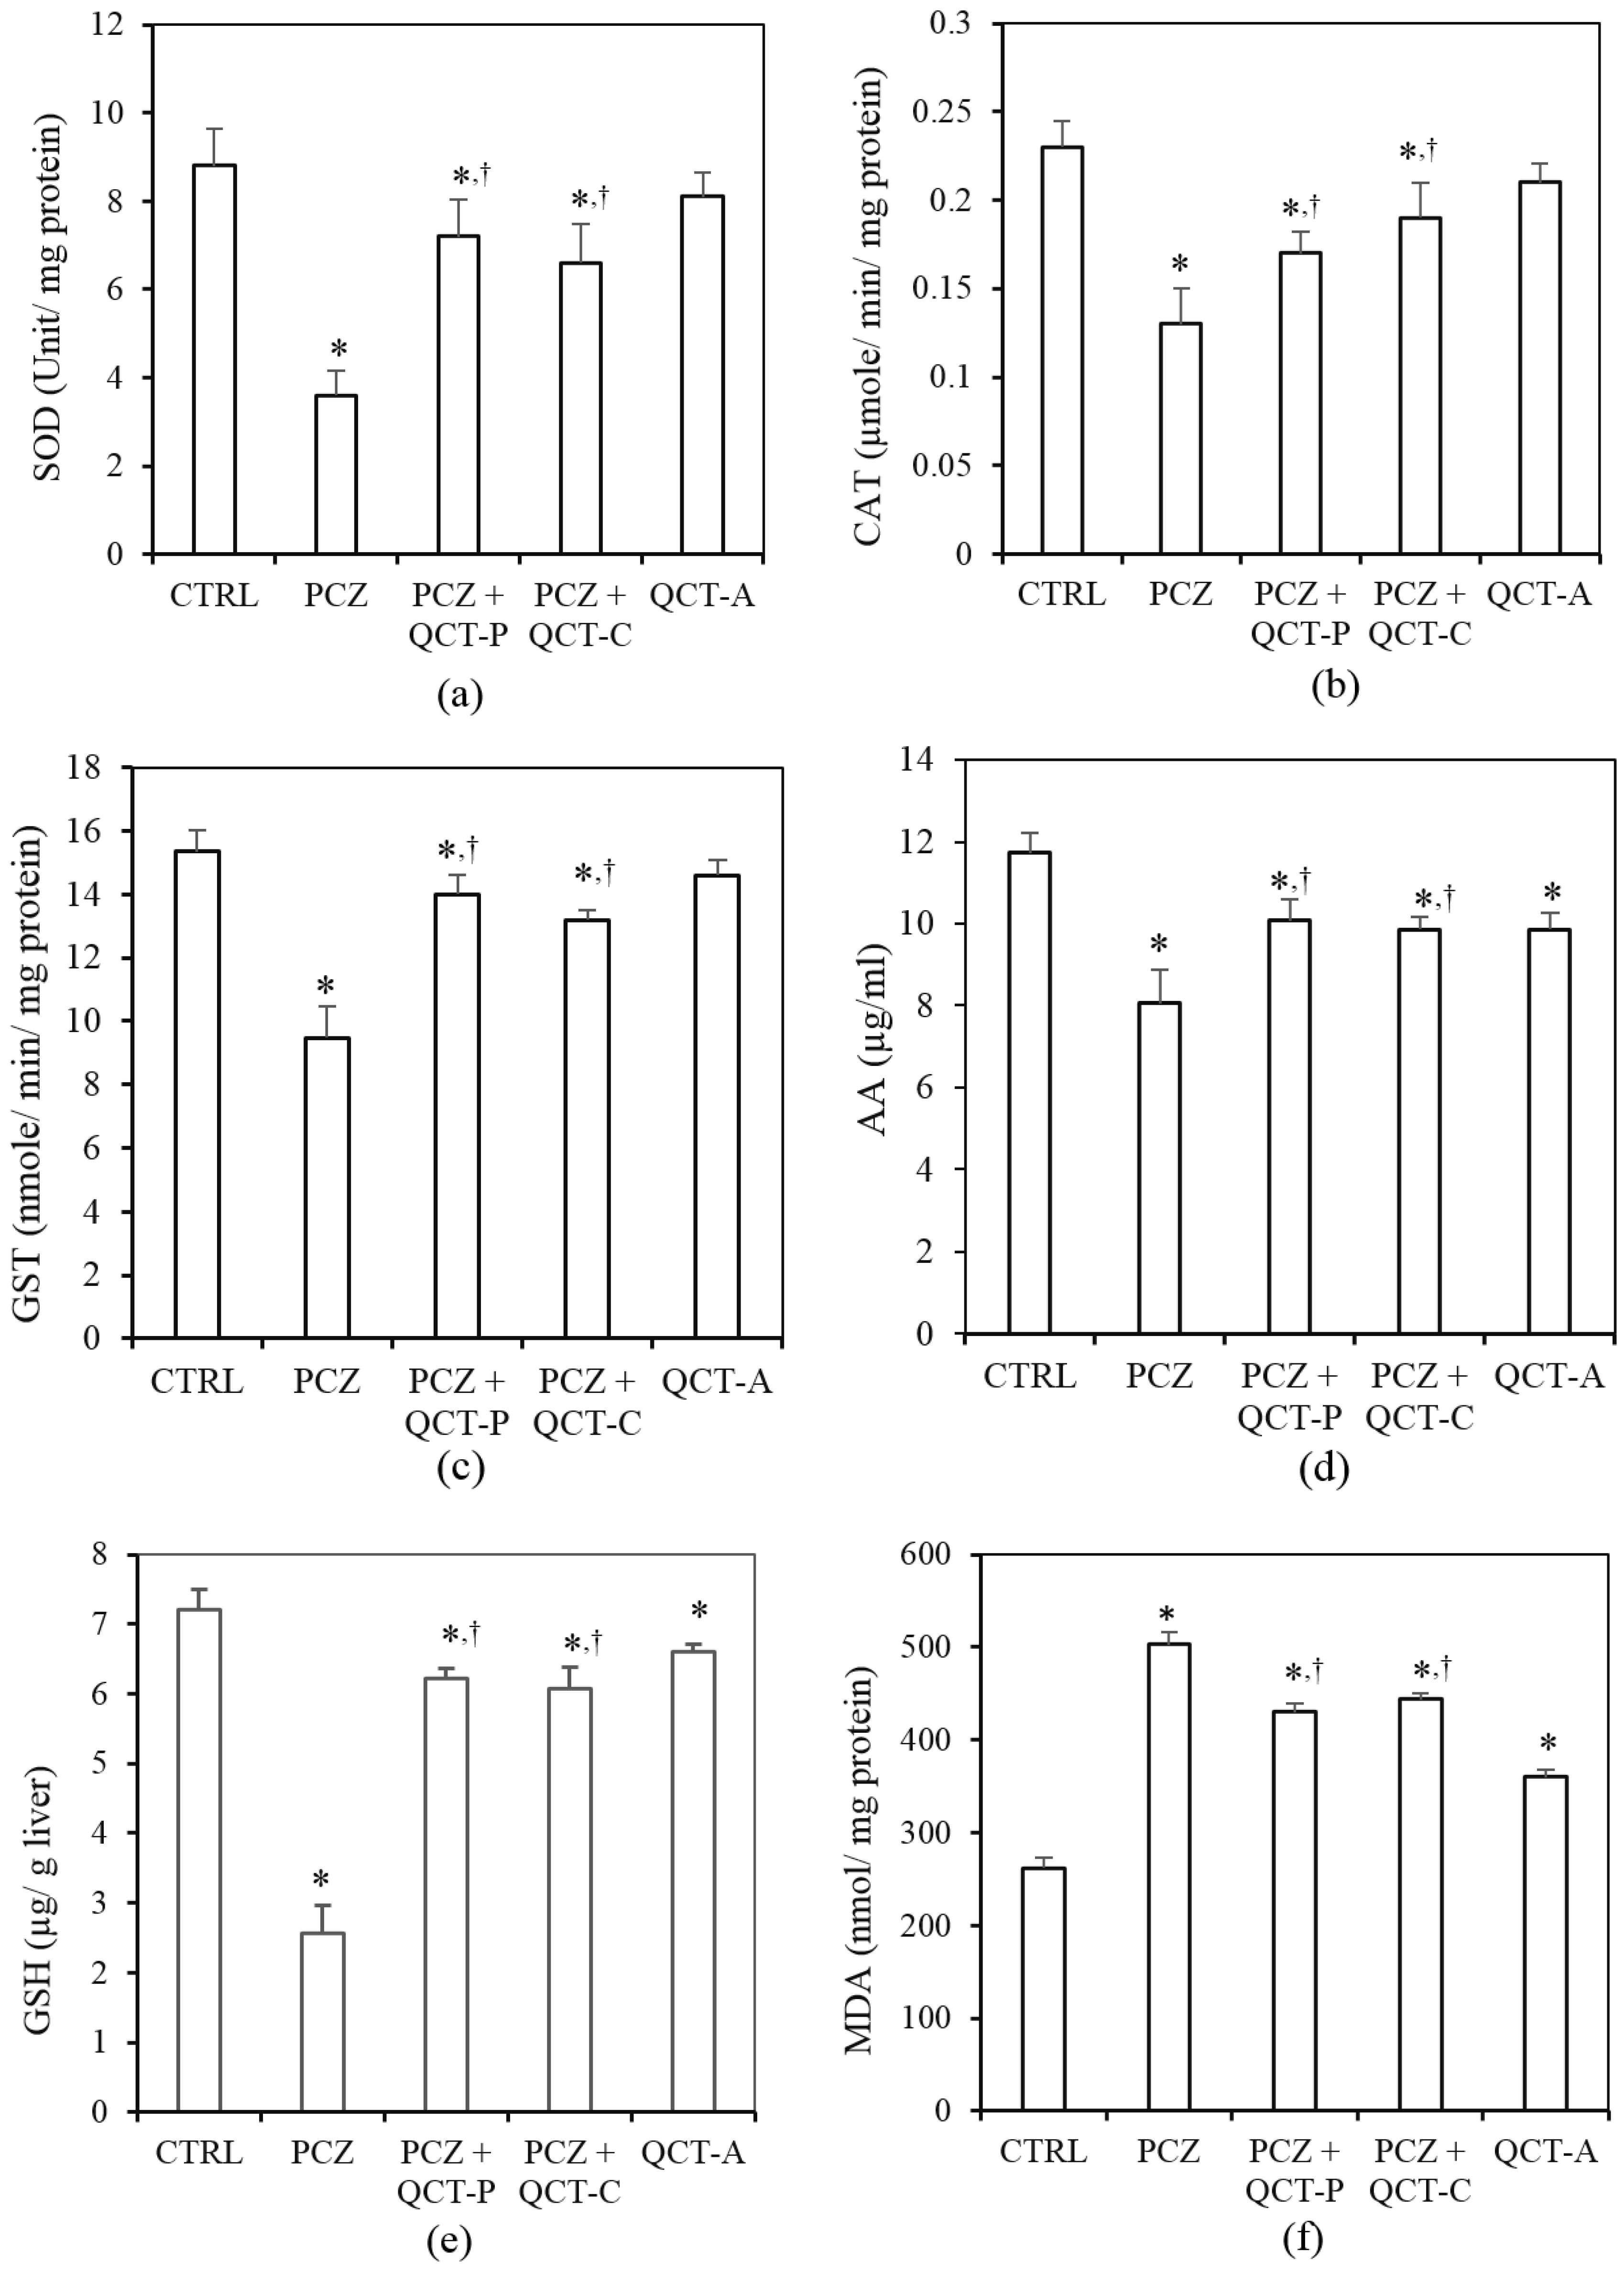
3.3. QCT Pre-Treatment and Co-Treatment Protects against PCZ-Induced Oxidative Stress in the Liver of Rats

The protective effect of QCT pre-treatment and co-treatment against PCZ-induced changes in hepatic biomarkers of oxidative stress in rats is presented in Figure 4. Hepatic SOD activity (Figure 4a) was significantly reduced in the PCZ group by 59.1% when compared with control (P < 0.05). Similarly, hepatic CAT activity (Figure 4b) was significantly decreased following PCZ-treatment, by 43.5% when compared with control. Hepatic GST activity (Figure 4c) was also significantly reduced by 38.3% in the PCZ-treated rats when compared with the control. However, QCT pre-treatment and co-treatment significantly ameliorated the PCZ-induced decrease in hepatic activities of SOD, CAT, and GST when compared with the PCZ group (P < 0.05).
The influence of PCZ and QCT pre- and co-treatment on hepatic levels of the non-enzymatic antioxidants, AA and GSH is shown in Figure 4d,e respectively. Following treatment with PCZ, the hepatic AA level was significantly (P < 0.05) decreased by 31.2% when compared with the control. Furthermore, PCZ caused a significant depletion of hepatic GSH by 64.3% when compared with the control. Conversely, pre-treatment and co-treatment with QCT significantly (P < 0.05) protects against the PCZ-induced decrease in hepatic AA and GSH levels when compared with the PCZ group.
Figure 4f shows the protective effect of QCT on PCZ-induced changes in hepatic malondialdehyde (MDA) level in rats. The hepatic MDA content rose significantly (P < 0.05) in the PCZ-treated rats by 90.8% when compared with the control. However, QCT pre-treatment and co-treatment attenuated the increase in hepatic MDA when compared with the PCZ-treated group.

4. Discussion

Drug-induced oxidative stress is a relevant side effect of most anticancer drugs, especially of alkylating agents. That is why the present study focused on the ameliorative potential of quercetin (QCT), against procarbazine (PCZ)-induced oxidative damage in rats. In our previous study, we observed the potential nephrotoxic, hepatotoxic, and pro-oxidant effect of an alkylating agent in the rat model [15]. Several studies have promoted QCT and its analogues as excellent antioxidants in vivo [21,25,44]. Separately from its antioxidant capacity, QCT also possesses antitumor activity against different cancer cell types [45,46,47]. While information regarding the potential interaction of QCT with PCZ is still lacking, data from previous studies suggest that QCT improved chemotherapeutic efficacy of most anticancer agents [48,49,50]. In a more recent study [51], QCT was found to enhance the antitumor activities of certain topoisomerase inhibitors.
Figure 4. Protective effect of QCT pre-treatment and co-treatment against PCZ-induced changes in hepatic biomarkers of oxidative stress in rats. Data represent the means ± SD for five rats in each group; * significantly different from the CTRL; significantly different from PCZ (P < 0.05).
Antioxidants 04 00304 g004
To establish the protective effect of QCT in PCZ-induced toxicity, biomarkers of nephrotoxicity, hepatotoxicity, and oxidative stress were assessed. Plasma urea and creatinine levels are established biomarkers of nephrotoxicity in human and animal subjects [52,53]. Urea and creatinine are metabolic products filtered freely from circulation by the kidney and an increase in plasma level of these substances is an indication of alteration in renal function [54]. Data from this study suggest that PCZ alters renal function leading to accumulation of these substances in the plasma of rats. The observed increase in plasma urea and creatinine in this study is consistent with a previous report on alkylating drugs [25]. Our results indicate that the natural flavonoid QCT protects the kidneys from the toxic damage caused by PCZ. QCT was reported previously as a potent nephroprotective agent in anticancer drug-induced nephrotoxicity [55,56].
The liver is involved in the metabolic transformation of drugs, which predisposes it to drug-induced damages. Plasma levels of TBILI as well as activities of the liver enzymes, ALT, AST, ALP, and γ-GT, are reliable markers of hepatotoxicity [57]. Bilirubin is present in the liver, bile, intestines, and the reticuloendothelial cells of the spleen while ALP and γ-GT are associated with the cell membrane [57]. Increase in plasma TBILI, ALP, and γ-GT is known to be associated with impairment of intrahepatic and extrahepatic bile flow (cholestasis), hepatobiliary injury, erythrocyte destruction or altered bilirubin metabolism [58,59]. The observed increase in plasma TBILI, ALP, and γ-GT is consistent with previous reports [9,60]. Plasma activities of ALT and AST are well established biomarkers of hepatocellular integrity in vivo [61]. Increase in the activities of ALT and AST in the plasma may have resulted from leakage from damaged hepatocytes [61]. In this study, pre- and co-treatment with QCT ameliorated the PCZ induced hepatic injuries in rats. Our findings also agree with previous findings showing the hepatoprotective activity of QCT [9,23,62].
Previous studies established a link between hepatotoxicity and oxidative stress [63,64], occasioning the consideration of the effect of PCZ on biomarkers of oxidative stress in vivo. Alkylating agents including PCZ are known to be associated with production of reactive oxygen species (ROS) leading to depletion of cellular detoxifying thiols and antioxidant enzymes [14,15]. In this study, PCZ caused a significant decrease in the activities of hepatic SOD, CAT, and GST. SOD catalyzes the rapid dismutation of superoxide radical to hydrogen peroxide and molecular oxygen while CAT converts the hydrogen peroxide formed in this process and other cellular processes into water and molecular oxygen [65]. GST on the other hand is involved primarily in the detoxification of xenobiotics in the liver [66] and it also forms a vital component of the antioxidant defense system [67]. The low molecular weight antioxidant molecules, AA and GSH, play a crucial role in cellular redox balance. Both AA and GSH are involved in scavenging free radicals in cells and are often the first line of defense against oxidation [68]. AA functions in the aqueous phase and is involved in the preservation of tocopherol in membranes and lipoproteins [69]. GSH acts as a cofactor for several enzymic antioxidants like glutathione peroxidase (GPx), glutathione-S-transferase, and is also involved in free radical scavenging activities in the cell [70]. The observed decrease in levels of these antioxidants caused by PCZ may predispose the liver to oxidative damage. This may also be connected to the observed elevation of liver enzymes in the plasma of animals in the PCZ group. In this study, QCT significantly improved the redox balance in the liver of rats which also corroborates earlier findings [15,71]. QCT and its metabolites possess the capacity to neutralize the free radicals from PCZ by donating electrons which can end the electron chain reactions [72]. QCT is one of the most abundant flavonoids in the human diet and is reported to exhibit a wide range of pharmacological activities [21,72], including hepatoprotection observed in the present study.
The phenomenon of lipid peroxidation (LPO) is a physiological event that occurs in normal cells to some extent. LPO is a well-established mechanism of cellular injury in animals, and is used as a marker of oxidative stress and tissue damage in vivo [73,74]. An increase in LPO (as shown by an increase in MDA level) was recorded following administration of PCZ. LPO is normally initiated by the attack of free radicals on unsaturated fatty acids [74] leading to the formation of a complex series of compounds including MDA, lipid peroxides, and reactive carbonyl compounds [75]. The fluid properties in biological membranes are due to the presence of polyunsaturated fatty acids (PUFAs) in phospholipids molecules located in both sites of the lipid bilayer [76]. Excessive membrane lipid peroxidation may result in cell disruption. The amelioration of hepatic LPO by QCT in the present study may be attributed to the quenching of free radicals, lipid peroxides, and promotion of antioxidants in the hepatocytes [77,78,79]. Flavonoids including QCT have been reported to interact with membrane lipid components, with a resultant protection of the membranes against oxidative damage [15,80,81,82], thereby preserving the normal cell functions.

5. Conclusions

In the present study, we demonstrated that QCT possesses the capacity to protect against PCZ-induced oxidative damage in rat tissues. This observation suggests a possible use of QCT as a supplement during a prolonged period of chemotherapy with drugs in the categories of PCZ.

Abbreviations

PCZ
Procarbazine (2 mg/ kg bw)
bw
Body weight
CTRL
Control
QCT
Quercetin
QCT-P
Quercetin pre-treated
QCT-C
Quercetin co-treated
QCT-A
Quercetin-alone
PMF
Post Mitochondrial Fraction
BSA
Bovine Serum Albumin
ALP
Alkaline phosphatase
ALT
Alanine aminotransferase
AST
Aspartate aminotransferase
γ-GT
Gamma glutamyl transferase
SOD
Superoxide dismutase
CAT
Catalase
GST
Glutathione-S-transferase
AA
Ascorbic acid
GSH
Reduced Glutathione
LPO
Lipid peroxidation
MDA
Malondialdehyde
ROS
reactive oxygen species
H2O2
hydrogen peroxide

Author Contributions

Ebenezer Tunde Olayinka, Ayokanmi Ore, Oluwatobi Adewumi Adeyemo, and Olaniyi Solomon Ola contributed to the study design, data analysis, and interpretation. Olaoluwa Oluwaseun Olotu and Roseline Chinonye Echebiri contributed to the experimental works. All authors prepared, read, and approved the final manuscript.

Conflicts of Interest

The authors declare that there is no conflict of interest.

References

  1. Fesler, M.J.; Becpker-Koepke, S.; Di Biscegilie, A.M.; Petruska, P.J. Procarbazine-induced hepatotoxicity: Case report and review of the literature. Pharmacotherapy 2010, 30, 540–544. [Google Scholar] [CrossRef] [PubMed]
  2. Rodriguez-Antona, C.; Ingelman-Sundberg, M. Cytochrome P450 pharmacogenetics and cancer. Oncogene 2006, 25, 1679–1691. [Google Scholar] [CrossRef] [PubMed]
  3. Dunn, D.L.; Lubet, R.A.; Prough, R.A. Oxidative Metabolism of N-lsopropyl-α-(2-methylhydrazino)-Ptoluamide Hydrochloride (Procarbazine) by Rat Liver Microsomes. Cancer Res. 1979, 39, 4555–4563. [Google Scholar] [PubMed]
  4. Swaffar, D.S.; Horstman, M.G.; Jaw, J.; Thrall, B.D.; Meadows, G.G.; Harker, W.G.; Yost, G.S. Methylazoxyprocarbazine, the Active Metabolite Responsible for the Anticancer Activity of Procarbazine against LI 210 Leukemia. Cancer Res. 1989, 49, 2442–2447. [Google Scholar] [PubMed]
  5. Sinha, B.K. Metabolic activation of procarbazine: Evidence for carbin-centered free radical intermediates. Biochem. Pharmacol. 1984, 33, 2777–2781. [Google Scholar] [CrossRef] [PubMed]
  6. Goria-Gatti, L.; Iannone, A.; Poli, G.; Albano, E. In vitro and in vivo evidence for the formation of methyl radical from procarbazine: A spin-trapping study. Carcinogenesis 1992, 13, 799–805. [Google Scholar] [CrossRef] [PubMed]
  7. Sinha, B.K.; Mason, R.P. Biotransformation of Hydrazine Dervatives in the Mechanism of Toxicity. J. Drug Metab. Toxicol. 2014, 5, 168–171. [Google Scholar]
  8. Wang, J.; Yi, J. Cancer cell killing via ROS: To increase or decrease, that is the question. Cancer Biol. Ther. 2008, 7, 1875–1884. [Google Scholar] [CrossRef] [PubMed]
  9. Olayinka, E.T.; Ore, A.; Ola, O.S.; Adeyemo, O.A. Protective Effect of Quercetin on Melphalan-Induced Oxidative Stress and Impaired Renal and Hepatic Functions in Rat. Chemother. Res. Prac. 2014, 2014, 1–8. [Google Scholar] [CrossRef]
  10. Fruehauf, J.P.; Meyskens, F.L., Jr. Reactive oxygen species: A breath of life or death? Clin. Cancer Res. 2007, 13, 789–794. [Google Scholar] [CrossRef] [PubMed]
  11. Sikic, B.I. Antineoplastic agents. In Mordern Pharmacology with Clinical Applications, 6th ed.; Craig, R., Stitzel, R.E., Eds.; Lippincott Williams & Wilkins: Philadelphia, PA, USA, 2004; p. 651. [Google Scholar]
  12. Price, P.; Thompson, H.; Bessell, E.M.; Bloom, H.J. Renal Impairment following the combined use of high-dose methotrexate and procarbazine. Cancer Chemother. Pharmacol. 1988, 21, 265–267. [Google Scholar] [CrossRef] [PubMed]
  13. McMaster, K.R.; Hennigar, G.R. Drug-induced granulomatous hepatitis. Lab. Investig. 1981, 44, 61–73. [Google Scholar] [PubMed]
  14. King, P.D.; Perry, M.C. Hepatotoxicity of Chemotherapy. The Oncol. 2001, 6, 162–176. [Google Scholar] [CrossRef]
  15. Yost, G.S.; Horstman, M.G.; El Walily, A.F.; Gordon, W.P.; Nelson, S.D. Procarbazine spermatogenesis toxicity: Deuterium isotope effect point to regioselective metabolism in mice. Toxicol. Appl. Pharmacol. 1985, 80, 316–322. [Google Scholar] [CrossRef] [PubMed]
  16. Alp, B.F.; Kesik, V.; Malkoc, E.; Yigit, N.; Saldir, M.; Babacan, O.; Akgul, E.O.; Poyrazoglu, Y.; Korkmazer, N.; Gulgun, M.; Erdem, O. The effect of melatonine on procarbazine induced testicular toxicity on rats. Syst. Biol. Reprod. Med. 2014, 60, 323–328. [Google Scholar] [CrossRef] [PubMed]
  17. Valko, M.; Rhodes, C.J.; Moncol, J.; Izakovic, M.; Mazur, M. Free radicals, metals and antioxidants in oxidative stress induced cancer. Chem.Biol. Interact. 2006, 160, 1–40. [Google Scholar] [CrossRef] [PubMed]
  18. Sikder, K.; Das, N.; Kesh, S.B.; Dey, S. Quercetin and B-sitosterol prevents high fat diet induced dyslipidemia and hepatotoxicity in swiss albino mice. Indian J. Exp. Biol. 2014, 52, 60–66. [Google Scholar] [PubMed]
  19. Magalingam, K.B.; Radhakrishnan, A.; Haleagrahara, N. Protective effects of flavonol isoquercitrin, against 6-hydroxy dopamine (6-OHDA)-induced toxicity in PC12 cells. BMC Res. Notes 2014, 7, 49–56. [Google Scholar] [CrossRef] [PubMed]
  20. Kinker, B.; Comstock, A.T.; Sajjan, U.S. Quercetin: A Promising Treatment for the Common Cold. J. Anc. Dis. Prev. Remedies 2014, 2, 1–3. [Google Scholar]
  21. Maalik, A.; Khan, F.A.; Mumtaz, A.; Mehmood, A.; Azhar, S.; Atif, M.; Karim, S.; Altaf, Y.; Tariq, I. Pharmacological Applications of Quercetin and Its Derivatives: A Short Review. Trop. J. Pharm. Res. 2014, 13, 1561–1566. [Google Scholar] [CrossRef]
  22. Ahmad, W.; Shaikh, S.; Nazam, N.; Lone, M.I. Protective Effects of Quercetin against Dimethoate-Induced Cytotoxicity and Genotoxicity in Allium sativum Test. Int. Sch. Res. Not. 2014, 2014. [Google Scholar] [CrossRef]
  23. Qader, G.I.; Aziz, R.S.; Ahmed, Z.A.; Abdullah, Z.F.; Hussain, S.A. Protective Effects of Quercetin against Isoniazid and Rifampicin Induced Hepatotoxicity in Rats. Am. J. Pharmacol. Sci. 2014, 2, 56–60. [Google Scholar]
  24. Takashima, K.; Matsushima, M.; Hashimoto, K.; Nose, H.; Sato, M.; Hashimoto, N.; Hasegawa, Y.; Kawabe, T. Protective effects of intratracheally administered quercetin on lipopolysaccharide-induced acute lung injury. Respir. Res. 2014, 15, 150–160. [Google Scholar] [CrossRef] [PubMed]
  25. Dong, Y.; Wang, J.; Feng, D.; Qin, H.; Wen, H.; Yin, Z.; Gao, G.; Li, C. Protective Effect of Quercetin against Oxidative Stress and Brain Edema in an Experimental Rat Model of Subarachnoid Hemorrhage. Int. J. Med. Sci. 2014, 11, 282–290. [Google Scholar] [CrossRef] [PubMed]
  26. Charles, B.; Simone, M.D., II; Nicole, L.; Simone, M.D.; Victoria Simone, R.N.; Charles, B.; Simone, M.D. Antioxidants and other nutrients do not interfere with chemotherapy or radiation therapy and can increase kill and increase Survival, Part 1. Altern. Ther. 2007, 13, 22–28. [Google Scholar]
  27. Sanchez-Gonzalez, P.D.; Lopez-Hernandez, F.J.; Perez-Barriocana, F.; Morales, A.I.; Lopez-Novoa, M. Quercetin reduces cisplatin nephrotoxicity in rats without compromising its anti-tumour activity. Nephrol. Dial. Transplant. 2011, 26, 3484–3495. [Google Scholar] [CrossRef] [PubMed]
  28. Sak, K. Chemotherapy and dietary phytochemical agents. Chemother. Res. Prac. 2012, 2012, 1–11. [Google Scholar] [CrossRef]
  29. Souliotis, V.L.; Valavanis, C.; Boussiotis, V.A.; Pangalis, G.A.; Kyrtopoulos, S.A. Comparative dosimetry of O6-methylguanine in humans and rodents treated with procarbazine. Carcinogenesis 1994, 15, 1675–1680. [Google Scholar] [CrossRef] [PubMed]
  30. National Research Council. Guide for the Care and Use of Laboratory Animals, 8th ed.; The National Academies Press: Washington, DC, USA, 2011. [Google Scholar]
  31. Krishnappa, P.; Venkatarangaiah, K.; Kumar, V.S.; Rajanna, S.; Kashi, R.; Gupta, P. Antioxidant and prophylactic effects of Delonix elata L., stem bark extracts, and flavonoid isolated quercetin against carbon tetrachloride-induced hepatotoxicity in rats. BioMed Res. Int. 2014, 2014. [Google Scholar] [CrossRef] [PubMed]
  32. Gornall, A.C.; Bardwawill, C.J.; David, M.M. Determination of serum protein by means of the biuret reaction. J. Biol. Chem. 1949, 177, 751–756. [Google Scholar] [PubMed]
  33. Jaffe, E.R. Oxidative Hemolysis, or What Made the Red Cell Break? N. Engl. J. Med. 1972, 286, 156–157. [Google Scholar] [CrossRef] [PubMed]
  34. Tietz, N.W. Clinical Guide to Laboratory Tests, 3rd ed.; W.B. Saunders Company: Philadelphia, PA, USA, 1995. [Google Scholar]
  35. Tietz, N.W.; Pruden, E.L.; Siggaard-Andersen, O. Liver function. In Tietz Textbook of Clinical Chemistry; Burtis, A.C., Ashwood, E.R., Eds.; WB Saunders: London, UK, 1994; pp. 1354–1374. [Google Scholar]
  36. Reltman, S.; Frankel, S.A. Colorimetric method for the determination of serum ALT and AST. Am. J. Clin. Pathol. 1957, 28, 56–63. [Google Scholar] [PubMed]
  37. Szasz, G. A kinetic photometric method for serum γ-glutamyl transpeptidase. Clin Chem. 1969, 15, 124–136. [Google Scholar] [PubMed]
  38. Jollow, D.J.; Mitchell, J.R.; Zampaghone, N.; Gillete, J.R. Bromobenzene induced liver necrosis, protective role of glutathione and evidence for 3,4-bromobenzene oxide as the hepatotoxic metabolite. Pharmacology 1974, 11, 151–169. [Google Scholar] [CrossRef] [PubMed]
  39. Jagota, S.K.; Dani, H.M. A new colorimetric technique for the estimation of vitamin C using Folin phenol reagent. Anal. Biochem. 1982, 127, 178–182. [Google Scholar] [CrossRef] [PubMed]
  40. Habig, W.A.; Pabst, M.J.; Jacoby, W.B. Glutathione trsansferases. The first enzymatic step in mercapturic acid formation. J. Biol. Chem. 1974, 249, 7130–7139. [Google Scholar] [PubMed]
  41. Misra, H.P.; Fridovich, I. The role of superoxide anion in the auto-oxidation of epinephrine and a simple assay for superoxide dismutase. J. Biol. Chem. 1972, 247, 3170–3175. [Google Scholar] [PubMed]
  42. Singha, A.K. Colorimetric assay of catalase. Anal. Biochem. 1972, 47, 389–394. [Google Scholar] [CrossRef] [PubMed]
  43. Varshney, R.; Kale, R.K. Effect of calmodulin antagonist on radiation induced lipid peroxidation in microsomes. Int. J. Radiat. Biol. 1990, 58, 733–743. [Google Scholar] [CrossRef] [PubMed]
  44. Alrawaiq, N.S.; Abdullah, A. A Review of Flavonoid Quercetin: Metabolism, Bioactivity and Antioxidant Properties. Int. J. PharmTech Res. 2014, 6, 933–941. [Google Scholar]
  45. Kanadaswami, C.; Lee, L.; Lee, P.H.; Hwang, J.; Ke, F.; Huang, Y.; Lee, M. The Antitumor Activities of Flavonoids. In vivo 2005, 19, 895–910. [Google Scholar] [PubMed]
  46. Zhang, H.; Zhang, M.; Yu, L.; Zhao, Y.; He, N.; Yang, X. Antitumor activities of quercetin and quercetin-5′,8-disulfonate in human colon and breast cancer cell lines. Food Chem. Toxicol. 2012, 50, 1589–1599. [Google Scholar] [CrossRef] [PubMed]
  47. Priya, E.S.; Selvakumar, K.; Bavithra, S.; Elumalai, P.; Arunkumar, R.; Singh, P.R.; Mercy, A.B.; Arunakaran, J. Anti-cancer activity of quercetin in neuroblastoma: An in vitro approach. Neurol. Sci. 2014, 35, 163–170. [Google Scholar] [CrossRef] [PubMed]
  48. Hoffman, M.J.; Fiebig, J.; Winterhalter, H.H.; Berger, B.R.; Grunicke, H. Enhancement of the antiproliferative activity of cis-diamminedichloroplatinum (II) by quercetin. Int. J. Cancer 1990, 45, 536–539. [Google Scholar] [CrossRef] [PubMed]
  49. Chen, J.; Kang, J.H. Quercetin and trichostatin A cooperatively kill human leukemia cells. Pharmazie 2005, 60, 856–860. [Google Scholar] [PubMed]
  50. Chan, S.; Yang, N.; Huang, C.; Liao, J.; Yeh, S. Quercetin Enhances the Antitumor Activity of Trichostatin a through Upregulation of p53 Protein Expression In Vitro and In Vivo. PLoS ONE 2013, 8, 1–10. [Google Scholar] [CrossRef]
  51. Samuel, T.; Fadlalla, K.; Mosley, L.; Katkoori, V.; Turner, T.; Manne, U. Dual-Mode Interaction between Quercetin and DNA-Damaging Drugs in Cancer Cells. Anticancer Res. 2012, 32, 61–71. [Google Scholar] [PubMed]
  52. Ferguson, M.A.; Waikar, S.S. Established and Emerging Markers of Kidney Function. Clin. Chem. 2012, 58, 4–14. [Google Scholar] [CrossRef]
  53. Simsek, A.; Tugcu, V.; Tasci, A.I. New Biomarkers for the Quick Detection of Acute Kidney Injury. ISRN Nephrology 2013, 2013. [Google Scholar] [CrossRef]
  54. George, G.S.; Wakasi, M.E.; Egoro, E. Creatinine and urea levels as critical markers in end-stage renal failure. Res. Rev.: J. Med. Health Sci. 2014, 3, 41–44. [Google Scholar]
  55. Behling, E.B.; Sendao, M.C.; Francescato, H.D.; Antunes, L.M.; Costa, R.S.; Bianchi Mde, L. Comparative study of multiple dosage of quercetin against cisplatin-induced nephrotoxicity and oxidative stress in rat kidneys. Pharmacol. Rep. 2006, 58, 526–532. [Google Scholar] [PubMed]
  56. Francescato, H.D.; Coimbra, T.M.; Costa, R.S.; Bianchi Mde, L. Protective effect of quercetin on the evolution of cisplatin-induced acute tubular necrosis. Kidney Blood Press Res. 2004, 27, 148–158. [Google Scholar] [CrossRef] [PubMed]
  57. Boone, L.; Meyer, D.; Cusick, P.; Ennulat, D.; Bolliger, A.P.; Everds, N.; Meador, V.; Elliott, G.; Honor, D.; Bounous, D.; et al. Selection and interpretation of clinical pathology indicators of hepatic injury in preclinical studies. Vet. Clin. Pathol. 2005, 34, 182–188. [Google Scholar] [CrossRef] [PubMed]
  58. Singh, A.; Bhat, T.K.; Sharma, O.P. Clinical Biochemistry of Hepatotoxicity. J. Clin. Toxicol. 2011. [Google Scholar] [CrossRef]
  59. Ramaiah, S.K. A toxicologist guide to the diagnostic interpretation of hepatic biochemical parameters. Food Chem. Toxicol. 2007, 45, 1551–1557. [Google Scholar] [CrossRef] [PubMed]
  60. Olayinka, E.T.; Ore, A.; Fashiku, K.A. Kolaviron and l-Ascorbic acid Ameliorates Chlorambucil-Induced Hepatic and Renal Toxicity in Rat. Int. J. Toxicol. Appl. Pharmacol. 2014, 4, 23–32. [Google Scholar]
  61. Amacher, D.E. Serum Transaminase Elevations as Indicators of Hepatic Injury Following the Administration of Drugs. Regul. Toxicol. Pharmacol. 1998, 27, 119–130. [Google Scholar] [CrossRef] [PubMed]
  62. Hozayen, W.G.; Abou-Seif, H.S.; Amin, S. Protective Effects of Ruitn and/or Hesperidin against Doxorubicin-Induced Hepatotoxicity. Int. J. Clin. Nutr. 2014, 2, 11–17. [Google Scholar]
  63. Yamamoto, T.; Kikkawa, R.; Yamada, H.; Horii, I. Identification of oxidative stress-related proteins for predictive screening of hepatotoxicity using a proteomic approach. J. Toxicol. Sci. 2005, 30, 213–227. [Google Scholar] [CrossRef] [PubMed]
  64. Oh, J.M.; Jung, Y.S.; Jeon, B.S.; Yoon, B.I.; Lee, K.S.; Kim, B.H.; Oh, S.J.; Kim, S.K. Evaluation of hepatotoxicity and oxidative stress in rats treated with tert-butyl hydroperoxide. Food Chem. Toxicol. 2012, 50, 1215–1221. [Google Scholar] [CrossRef] [PubMed]
  65. Valko, M.; Leibfritz, D.; Moncola, J.; Cronin, M.T.D.; Mazura, M.; Telser, J. Free radicals and antioxidants in normal physiological functions and human disease. Int. J. Biochem. Cell Biol. 2007, 39, 44–84. [Google Scholar] [CrossRef] [PubMed]
  66. Sherratt, P.J.; Hayes, J.D. Glutathione S-transferases. In Enzyme Systems that Metabolise Drugs and other Xenobiotics; Ioannides, C., Ed.; John Wiley & Sons: Chichester, UK, 2002; pp. 219–252. [Google Scholar]
  67. Morgenstern, R.; Zhang, J.; Johansson, K. Microsomal glutathione transferase: Mechanism and functional roles. Drug Metab. Rev. 2011, 43, 300–306. [Google Scholar] [CrossRef] [PubMed]
  68. Devasagayam, T.P.A.; Tilak, J.C.; Boloor, K.K.; Sane, K.S.; Ghaskadbi, S.S.; Lele, R.D. Free Radicals and Antioxidants in Human Health: Current Status and Future Prospects. JAPI 2004, 52, 794–804. [Google Scholar] [PubMed]
  69. Kojo, S. Vitamin C: Basic metabolism and its function as an index of oxidative stress. Curr. Med. Chem. 2004, 11, 1041–1064. [Google Scholar] [CrossRef] [PubMed]
  70. Masella, R.; di Benedetto, R.; Var, R.; Filesi, C.; Giovannini, C. Novel mechanisms of natural antioxidant compounds in biological systems: Involvement of glutathione and glutathionerelated enzymes. J. Nutr. Biochem. 2005, 16, 577–586. [Google Scholar] [CrossRef] [PubMed]
  71. Gautam, A.; Vijayaraghavan, R.; Pant, S.C.; Kumar, O.; Singh, S.; Kumar, H.T.S. Protective Effect of Quercetin against Sulphur Mustard-Induced Oxidative Stress in Mice. Def. Sci. J. 2007, 57, 707–720. [Google Scholar] [CrossRef]
  72. Hollman, P.C.H.; Trip, J.M.P.V.; Baysman, M.N.C.P.; Cagg, M.S.V.D.; Mengelers, M.J.B.; Vries, J.H.M.D.; Katan, M.B. Relative bioavailability of the antioxidant flavonoid quercetin from various food in man. FEBS Lett. 1997, 418, 152–156. [Google Scholar] [CrossRef] [PubMed]
  73. El-Beltagi, H.S.; Mohamed, H.I. Reactive Oxygen Species, Lipid Peroxidation and Antioxidative Defense Mechanism. Not. Bot. Horti Agrobo. 2013, 41, 44–57. [Google Scholar]
  74. Guéraud, F.; Atalay, M.; Bresgen, N.; Cipak, A.; Eckl, P.M.; Huc, L.; Jouanin, I.; Siems, W.; Uchida, K. Chemistry and biochemistry of lipid peroxidation products. Free Rad. Res. 2010, 44, 1098–1124. [Google Scholar] [CrossRef]
  75. Ayala, A.; Muñoz, M.F.; Argüelles, S. Lipid Peroxidation: Production, Metabolism, and Signaling Mechanisms of Malondialdehyde and 4-Hydroxy-2-Nonenal. Oxid. Med. Cell. Longev. 2014, 2014. [Google Scholar] [CrossRef] [PubMed]
  76. Catalá, A. Lipid peroxidation modifies the assembly of biological membranes “The Lipid Whisker Model”. Front. Physiol. 2015, 5. [Google Scholar] [CrossRef] [Green Version]
  77. Molina, M.F.; Sanchez-Reus, I.; Iglesias, I.; Benedi, J. Quercetin, a flavonoid antioxidant, prevents and protects against ethanol-induced oxidative stress in mouse liver. Biol. Pharm. Bull. 2003, 26, 1398–1402. [Google Scholar] [CrossRef] [PubMed]
  78. Mendes, V.; Costa, V.; Mateus, N. Involvement of the modulation of cancer cell redox status in the anti-tumoral effect of phenolic compounds. RSC Adv. 2015, 5, 1–9. [Google Scholar] [CrossRef]
  79. Jimenez, R.; Lopez-Sepulveda, R.; Romero, M.; Toral, M.; Cogolludo, A.; Perez-Vizcaino, F.; Duarte, J. Quercetin and its metabolites inhibit the membrane NADPH oxidase activity in vascular smooth muscle cells from normotensive and spontaneously hypertensive rats. Food Funct. 2015, 6, 409–414. [Google Scholar] [CrossRef] [PubMed]
  80. Verstraeten, S.V.; Frag, C.G.; Oteiza, P.I. Interactions of flavan-3-ols and procyanidins with membranes: Mechanisms and the physiological relevance. Food Funct. 2015, 6, 32–40. [Google Scholar] [CrossRef] [PubMed]
  81. Chen, X.; Zhang, Y.; Yang, L.; Zu, Y.; Lu, Q. Effects of rosmarinic acid on liver and kidney antioxidant enzymes, lipid peroxidation and tissue ultrastructure in aging mice. Food Funct. 2015, 6, 927–731. [Google Scholar] [CrossRef] [PubMed]
  82. Jagetia, G.C.; Rajanikant, G.K. Curcumin Stimulates the Antioxidant Mechanisms in Mouse Skin Exposed to Fractionated γ-Irradiation. Antioxidants 2015, 4, 25–41. [Google Scholar] [CrossRef]

