1. Introduction
Reactive oxygen species (ROS) are by-products of normal metabolism. They are produced in cells as a response to several factors, including oxidative and thermal stresses, ultraviolet light, chemical agents, and ionizing radiation. These species are known to play a dual role in biological systems, since they can be either harmful or beneficial to living systems [
1]. Positive effects of ROS involve physiological roles in cellular responses, such as in defense against infectious agents and in the function of a number of cellular signaling systems. One further beneficial example of ROS at low concentrations is the induction of a mitogenic response [
1].
A negative effect is that, in high concentrations, they lead to oxidative stress. This is described as a condition in which cellular antioxidant defenses are inadequate to completely inactivate the free radicals generated by an excessive production of ROS, loss of antioxidant defenses, or both [
2]. Oxidative stress can cause DNA damage, cell functions inhibition, lipid and protein peroxidation, and disturbance of glutathione levels. In addition, ROS contribute to the development of cancer, diabetes, atherosclerosis, inflammatory diseases, and ageing [
3].
It has been estimated that one human cell is exposed to approximately 1.5 × 10
5 oxidative hits a day from hydroxyl radicals and other such reactive species [
3]. The generation of various free radicals is closely linked with the participation of redox-active metals [
4]. The release of iron in the oxidative process is facilitated by
•O
2, and the free ion participates in the Fenton reaction, generating the highly reactive hydroxyl radical [
1,
5]. Iron-mediated formation of ROS leads to DNA damage and, therefore, appears to be important for the development of cancer, since cancer cells are known to grow rapidly in response to iron [
6]. Metal-induced generation of oxygen radicals results in the attack of not only DNA in the cell nucleus but also other cellular components involving polyunsaturated fatty acid residues of phospholipids, which are extremely sensitive to oxidation [
7]. Lipid peroxidation is an oxidative deterioration of polyunsaturated lipids, and it involves ROS and transition metal ions, leading to the yielding of a wide range of cytotoxic products, most of which are aldehydes, like malon-dialdehyde (MDA) and 4-hydroxynonrnal (HNE) [
8]. The oxidative state created by free radicals also deteriorates proteins with the introduction of carbonyl groups and the formation of protein-centered alkyl groups.
In order to contain the harmful effects of ROS, the body has natural antioxidants that are the cell’s defense mechanisms such as glutathione, alpha-lipoic acid, coenzyme Q, ferritin, uric acid, bilirubin, metallothionein,
l-carnitine, melatonin, enzymatic superoxide dismutase (SOD), catalase (CAT), glutathione peroxidases (GPXs), thioredoxins (TRX) and peroxiredoxins (PRXs) which scavenge reactive species [
9,
10,
11,
12,
13]. Despite the presence of the cell’s antioxidant defense system to counteract oxidative damage from ROS, oxidative damage accumulates during the life cycle and the natural defense could be overcome by the ROS [
9]. There is currently immense interest in natural antioxidants and their role in human health and nutrition [
14,
15,
16]. Considerable amount of data has been generated on antioxidant properties of food plants around the globe [
12,
17,
18]. Fruits, vegetables, and herbs attract great attention due to their high content of bioactive compounds with antioxidant characteristics such as phenolic compounds [
19,
20]. Phenolic compounds are large and heterogeneous groups of secondary plant metabolites that are distributed throughout the plant kingdom. Phenolic compounds include flavonoids, tannins, and phenolic acids [
21]. They have been implicated in a number of varied roles including ultra-violet (UV) protection, pigmentation, disease resistance, and nodule production.
Hypodaphnis zenkeri is a medium-sized tree of the Lauraceae family found mainly in tropical rain forests in Central and West Africa.
H. zenkiri is a tree reaching a height of 20 to 25 m [
22,
23]. Its bark is consumed as a spice in Cameroon and is also used in traditional medicine [
23,
24]. The aqueous/ethanol extract of the bark of
H. zenkiri have been postuled to possess quinones, tannins, terpenoids and reducing sugars with a great polyphenolic content and an antioxidant power in the 2,2-azinobis(3-ethylbenzthiazoline)-6-sulfonic acid (ABTS) assay [
22,
23,
24]. A previous study demonstrated that the bark of
H. zenkiri lowered blood glucose and ameliorated the lipid profile in triton W-1339 induced acute hyperlipidemic rats and rats fed with a high fat and high glucose diet [
23]. However the different phenolic compounds are still unknown and the mechanism that is responsible for the antioxidant and the protective effect on hepatic enzymes is not yet elucidated.
The present study aims at determining the phenolic profile of H. zenkiri by high performance liquid chromatography (HPLC), investigating the free radical scavenging potential on various free radicals, providing further information on its antioxidant potential and studying its protective effect against oxidative mediated free radical damage on a liver homogenate.
3. Results and Discussion
In order to reduce the oxidative damage induced by free radicals in biological systems, several dietary sources of antioxidants have been investigated. Phytochemicals such as phenolic compounds and some amino acids, have been found to have outstanding antioxidant properties against some free radical species [
37]. Regarding the increase of interest in natural antioxidant supplements from foods, medicinal plants, and spices, this study was designed to investigate the antioxidant properties of
H. zenkiri used in Cameroon as a spice in several dishes. Antioxidant activity cannot be measured directly but rather by the effects of the antioxidant in controlling the extent of oxidation [
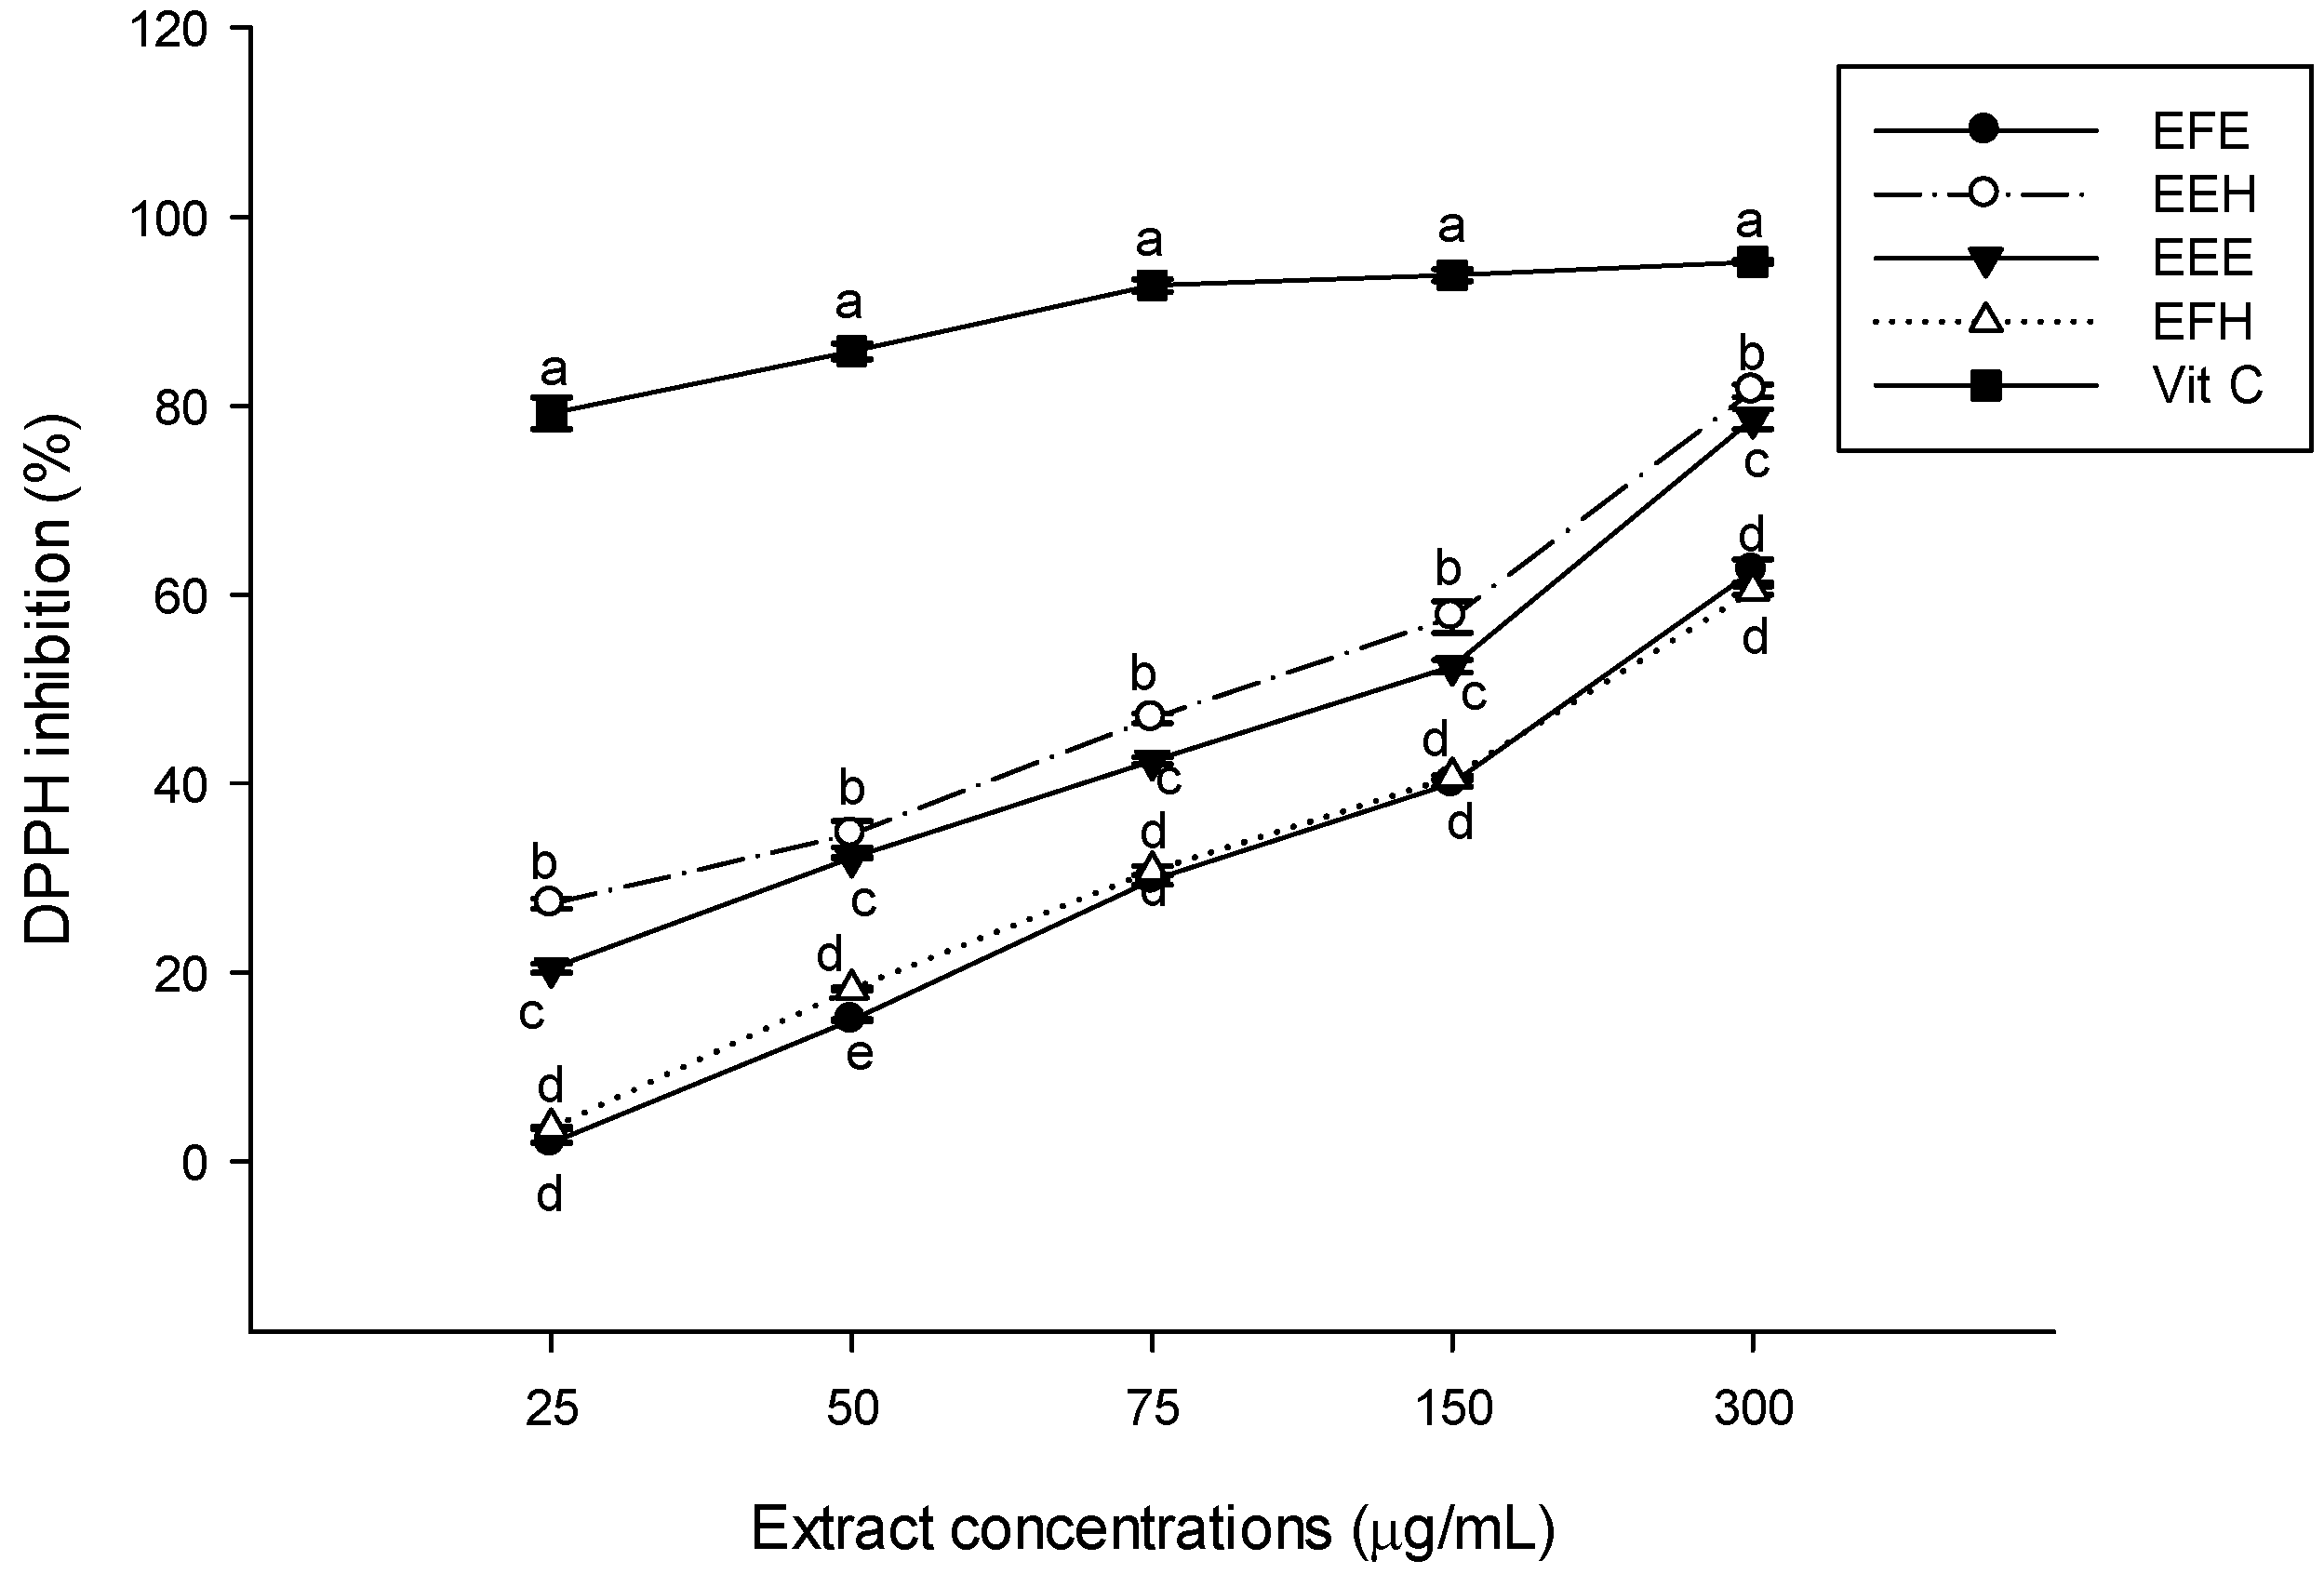
38]. A rapid, simple, and inexpensive method to measure antioxidant capacity of food involves the use of the free radical 2,2-diphenyl-1-picrylhydrazyl (DPPH). The results of the scavenging activity using DPPH has shown that EEH extract has the highest and most significant (
p < 0.05) scavenging potential among the extracts with a percentage of inhibition of 27.27% ± 0.45% at the concentration of 25 μg/mL to 81.61% ± 0.66% at 300 μg/mL followed by EEE (
Figure 1). However, this result is lower than the activity vitamin C, which was used as control. EFE and EFH showed the lowest scavenging powers at all the concentrations. Our results corroborate previous findings that stated that phenolic compounds generally exhibited significant scavenging effects against the DPPH free radical [
9,
38]. DPPH is widely used to test the ability of compounds to act as free radical scavengers or hydrogen donors. It has been used to quantify the antioxidants in complex biological systems. The DPPH method can be used for solid or liquid samples, and it is not specific to any particular antioxidant component, but applies to the overall antioxidant capacity of the sample. A measure of total antioxidant capacity helps in the understanding of functional properties of foods [
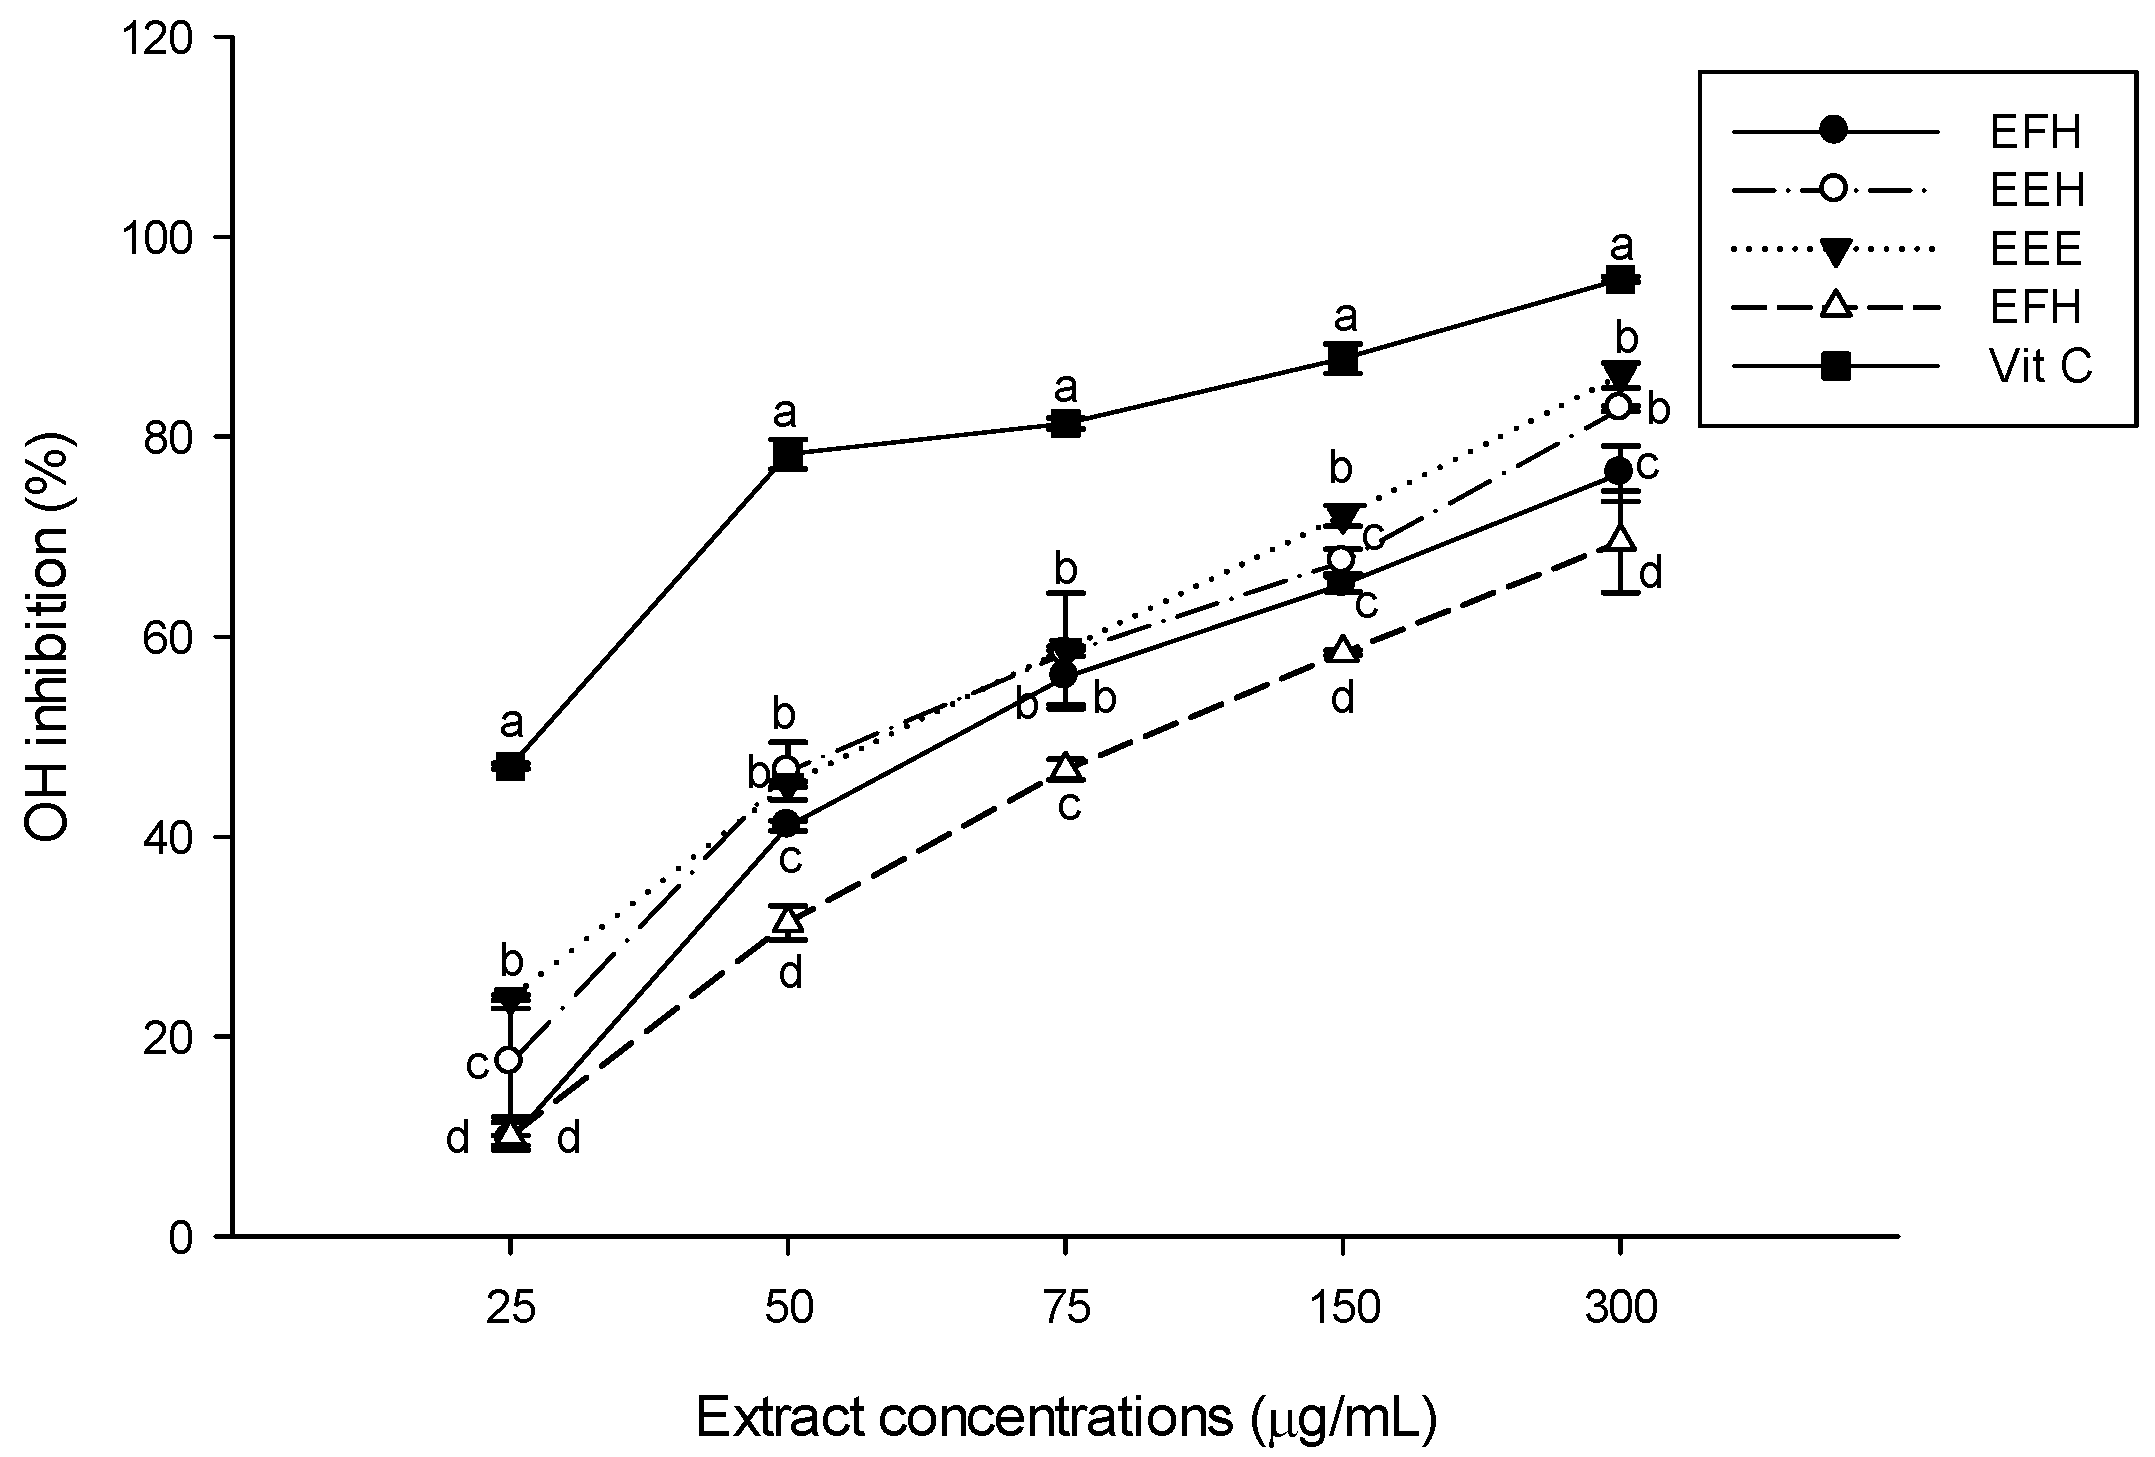
13]. The hydroxyl radical scavenging potential of the different extracts displayed in
Figure 2 demonstrated that all the tested extracts scavenged the OH radical with variable scavenging powers depending on the type of extract and the concentration. The inhibitory properties of EEE and EEH extracts increased from 23.86% ± 0.28% to 86.61% ± 1.25% and from 17.37% ± 5.42% to 82.61% ± 0.28%, respectively, demonstrating that they have almost similar and the highest scavenging power of the substances tested. Vitamin C showed the significant < highest (
p < 0.05) overall potential. Our results show that these plant extracts have the ability to inhibit the non-specific hydroxyl radical, preventing it from reacting with polyunsaturated fatty acid moieties of cell membrane phospholipids and thereby causing damage to cells [
39].
Figure 1.
2,2-diphenyl-1-picrylhydrazyl (DPPH) scavenging potential of the different plant extracts. Values are expressed as mean ± standard deviation (SD) of three replicates. In the same concentration the values affected with different letter are significantly different at p < 0.05. EEE: H. zenkeri (bark) ethanolic extract; EFE: H. zenkeri (leaves) ethanolic extract; EEH: H. zenkeri (bark) hydro-ethanolic extract; EFH: H. zenkeri (leaves) hydro-ethanolic extract; Vit C: Vitamin C.
Figure 2.
Hydroxyl radical (OH) scavenging potential of the different plant extracts. Values are expressed as mean ± SD of three replicates. In the same concentration the values affected with different letter are significantly different at p < 0.05. EEE: H. zenkeri (bark) ethanolic extract; EFE: H. zenkeri (leaves) ethanolic extract; EEH: H. zenkeri (bark) hydro-ethanolic extract; EFH: H. zenkeri (leaves) hydro-ethanolic extract; Vit C: Vitamin C.
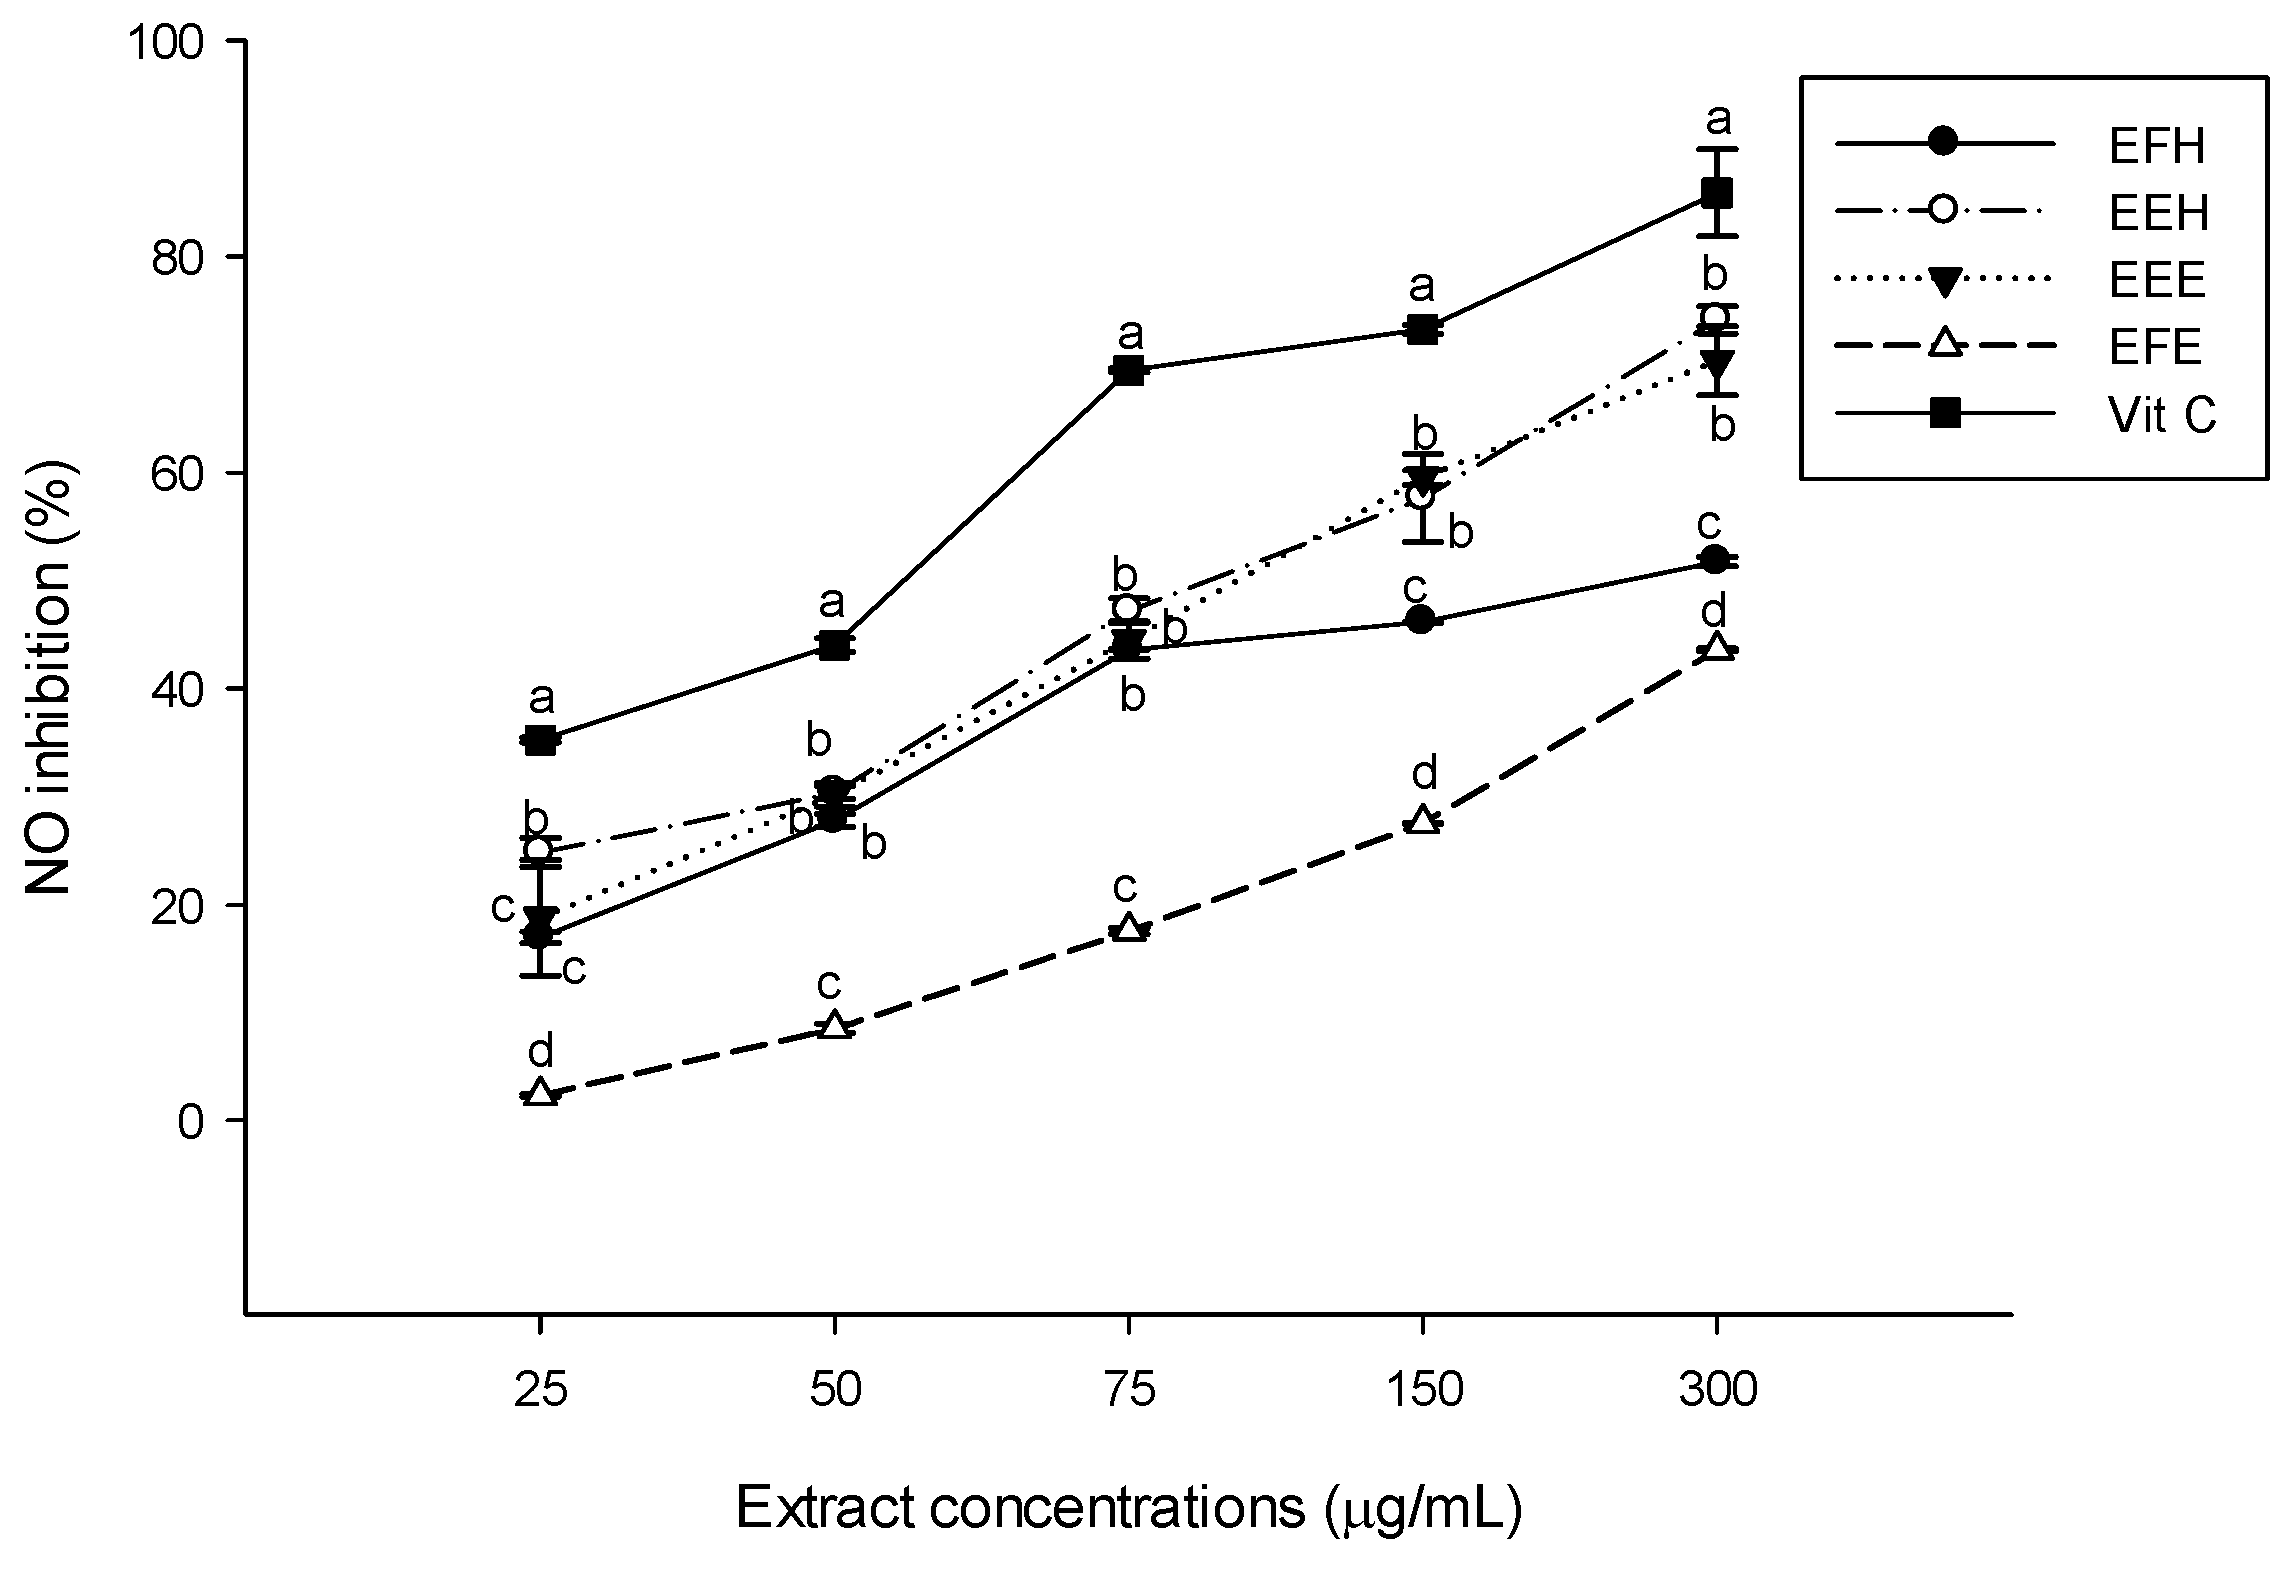
The nitric oxide (NO) scavenging assay measures the ability of the extract to chelate NO using the Griess reaction. The nitrite ions were generated from sodium nitroprusside in aqueous solution at a physiological pH, which reacted with oxygen [
39]. The different extracts scavenged the NO radical in a concentration-dependent manner (
Figure 3). Among the tested extracts, EEE and EEH were the significantly (
p < 0.05) most potent at all the concentrations but their NO scavenging capacities were lower than that of vitamin C. The lowest scavenging activity was shown by EFE. EFE therefore demonstrates the ability of
H zenkiri to be a potential free radical quencher.
Figure 3.
Nitric oxide radical (NO) scavenging potential of the different plant extracts. Values are expressed as mean ± SD of three replicates. In the same concentration the values labeled with different letters differ significantly at p < 0.05. EEE: H. zenkeri (bark) ethanolic extract; EFE: H. zenkeri (leaves) ethanolic extract; EEH: H. zenkeri (bark) hydro-ethanolic extract; EFH: H. zenkeri (leaves) hydro-ethanolic extract; Vit C: Vitamin C.
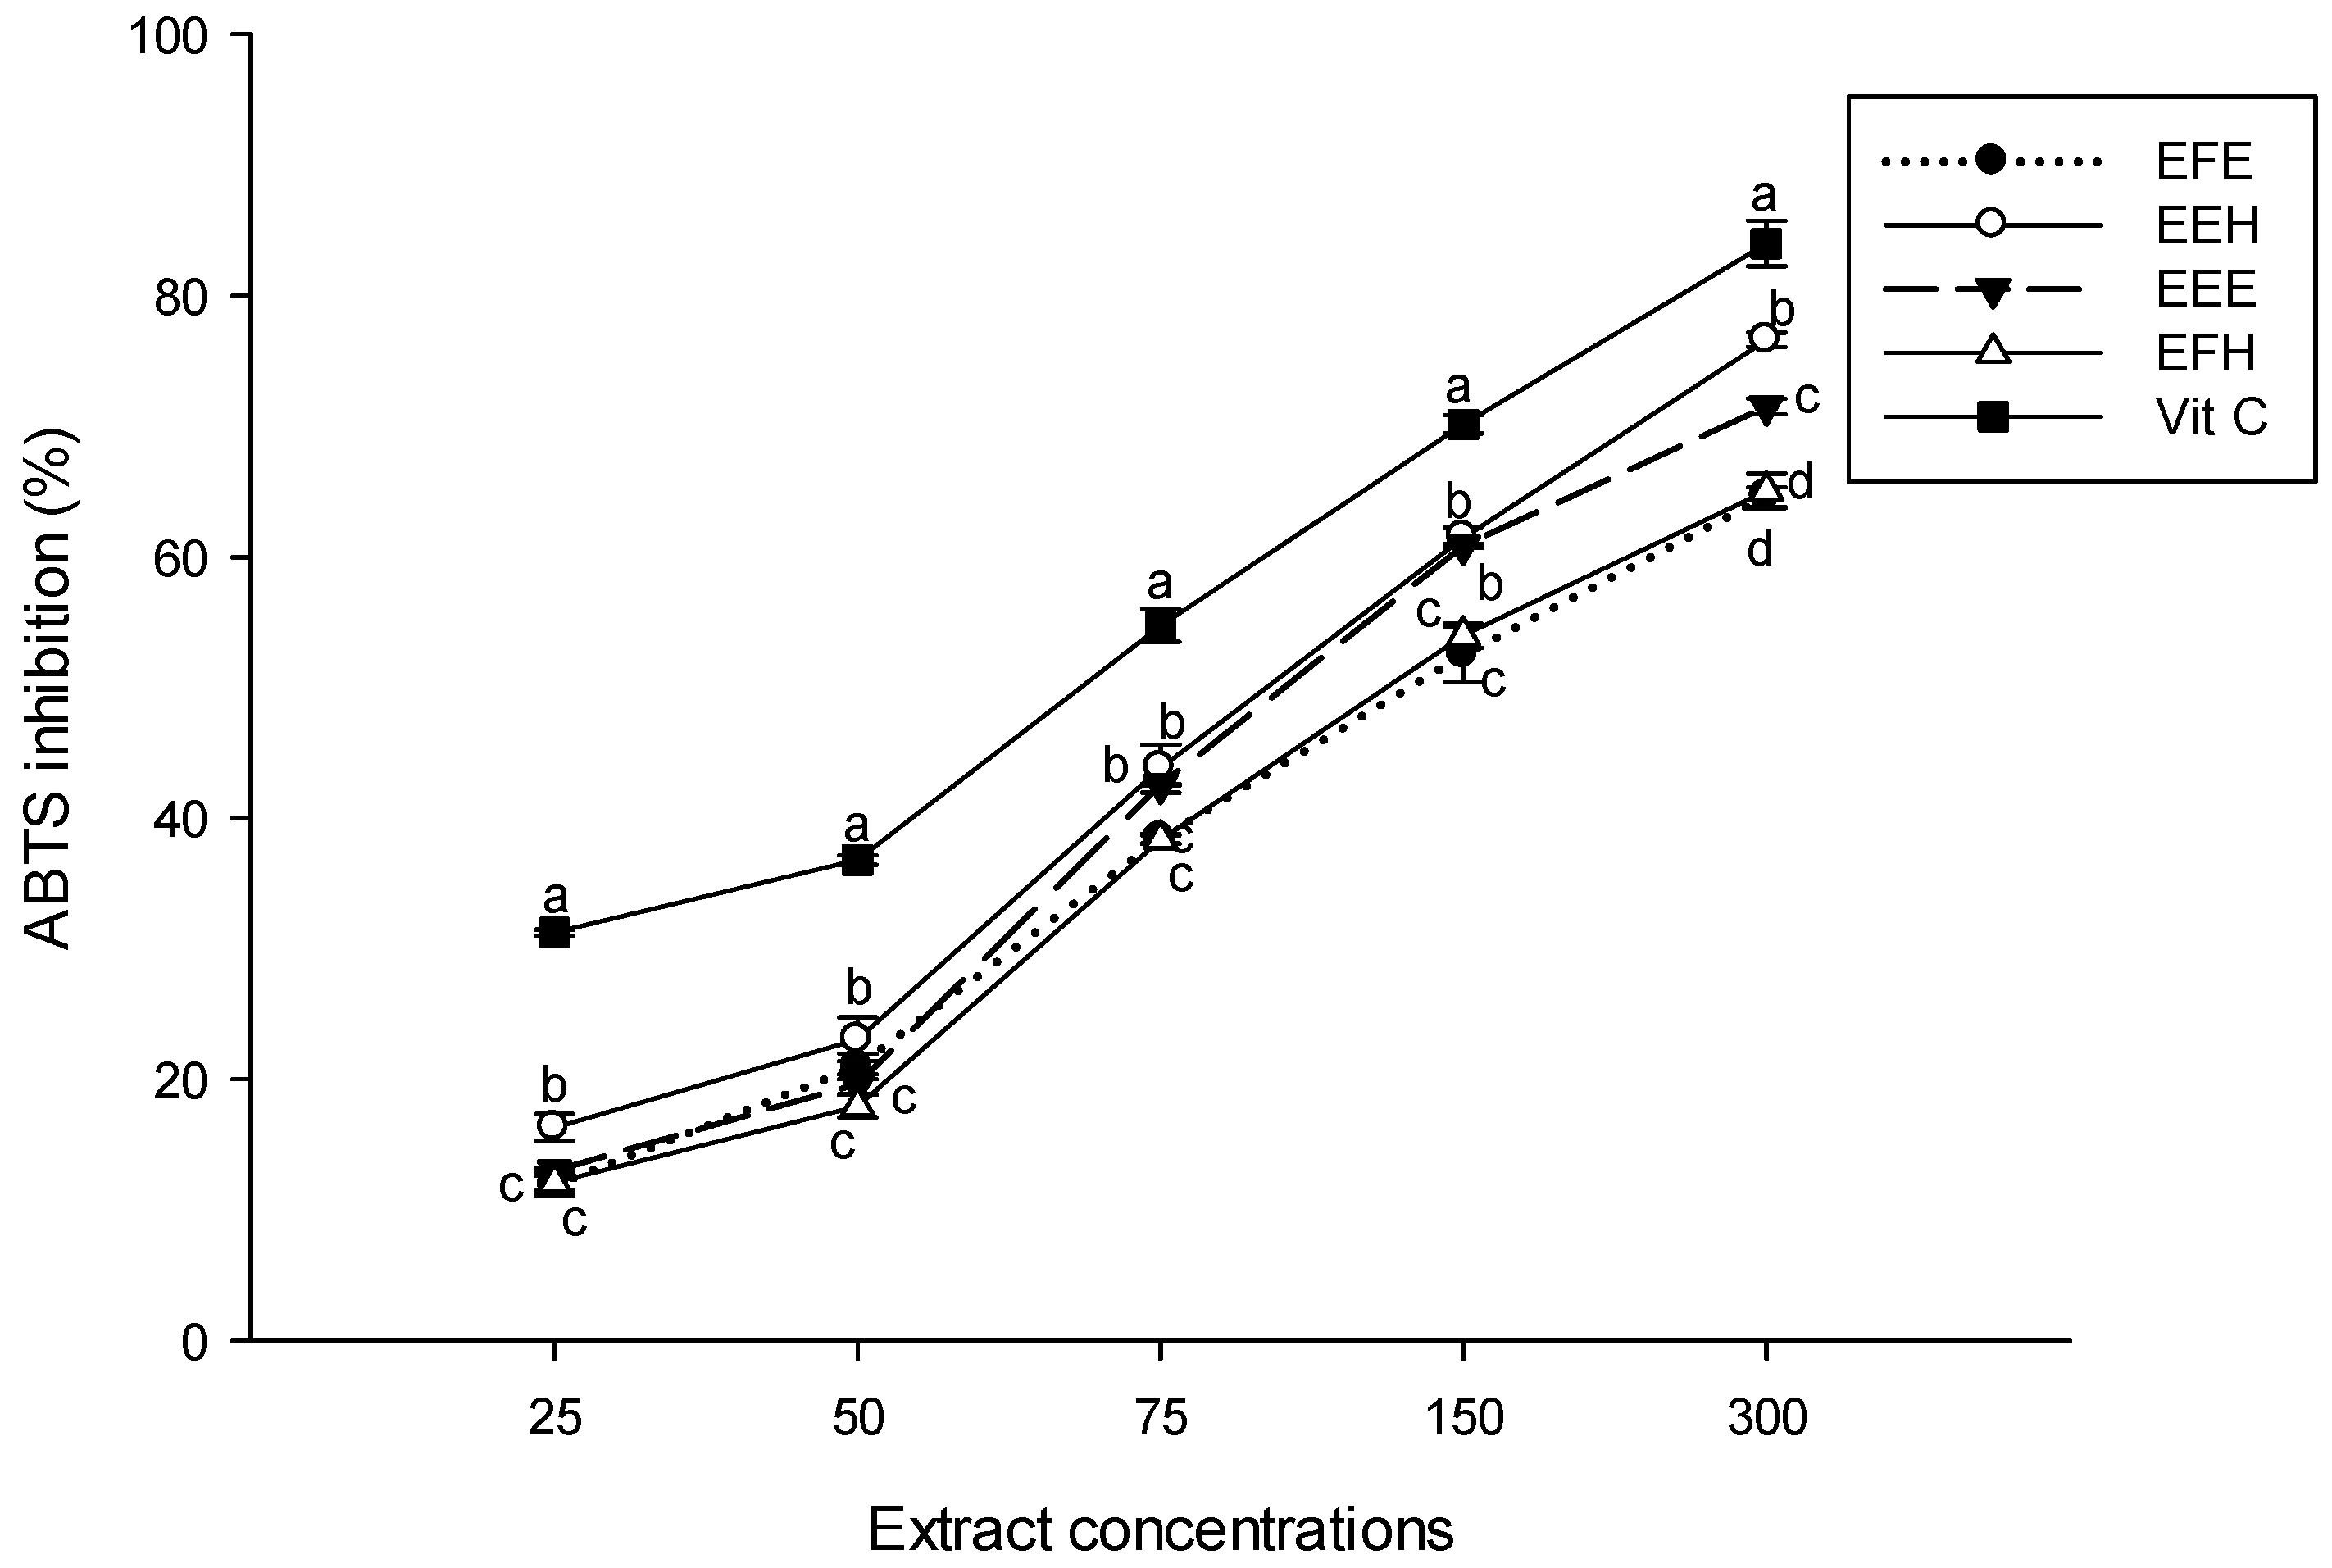
The ABTS method has the extra flexibility in that it can be used at different pH levels and is thus useful when studying the effect of pH on antioxidant activity of various compounds. It is also useful for measuring antioxidant activity of samples extracted in acidic solvents [
13]. The inhibitory potential on the ABTS radical of the extracts showed that all the tested samples inhibited the ABTS radical, and the inhibition percentage increased with concentration (
Figure 4). The extract EEH had a significantly (
p < 0.05) more powerful inhibitory potential while the EFH and EFE extracts had the lowest scavenging potentials at all the concentrations. This result suggests that our extracted phytochemicals could act as radical scavengers owing to their hydrogen and electron donating capacity and their ability to delocalize/stabilize the resulting phenoxyl radical within the structure [
40].
Figure 4.
The 2,2-azinobis(3-ethylbenzthiazoline)-6-sulfonic acid (ABTS) scavenging potential of the different plant extracts. Values are expressed as mean ± SD of three replicates. In the same concentration the values labeled with different letters differ significantly at p < 0.05. EEE: H. zenkeri (bark) ethanolic extract; EFE: H. zenkeri (leaves) ethanolic extract; EEH: H. zenkeri (bark) hydro-ethanolic extract; EFH: H. zenkeri (leaves) hydro-ethanolic extract; Vit C: Vitamin C.
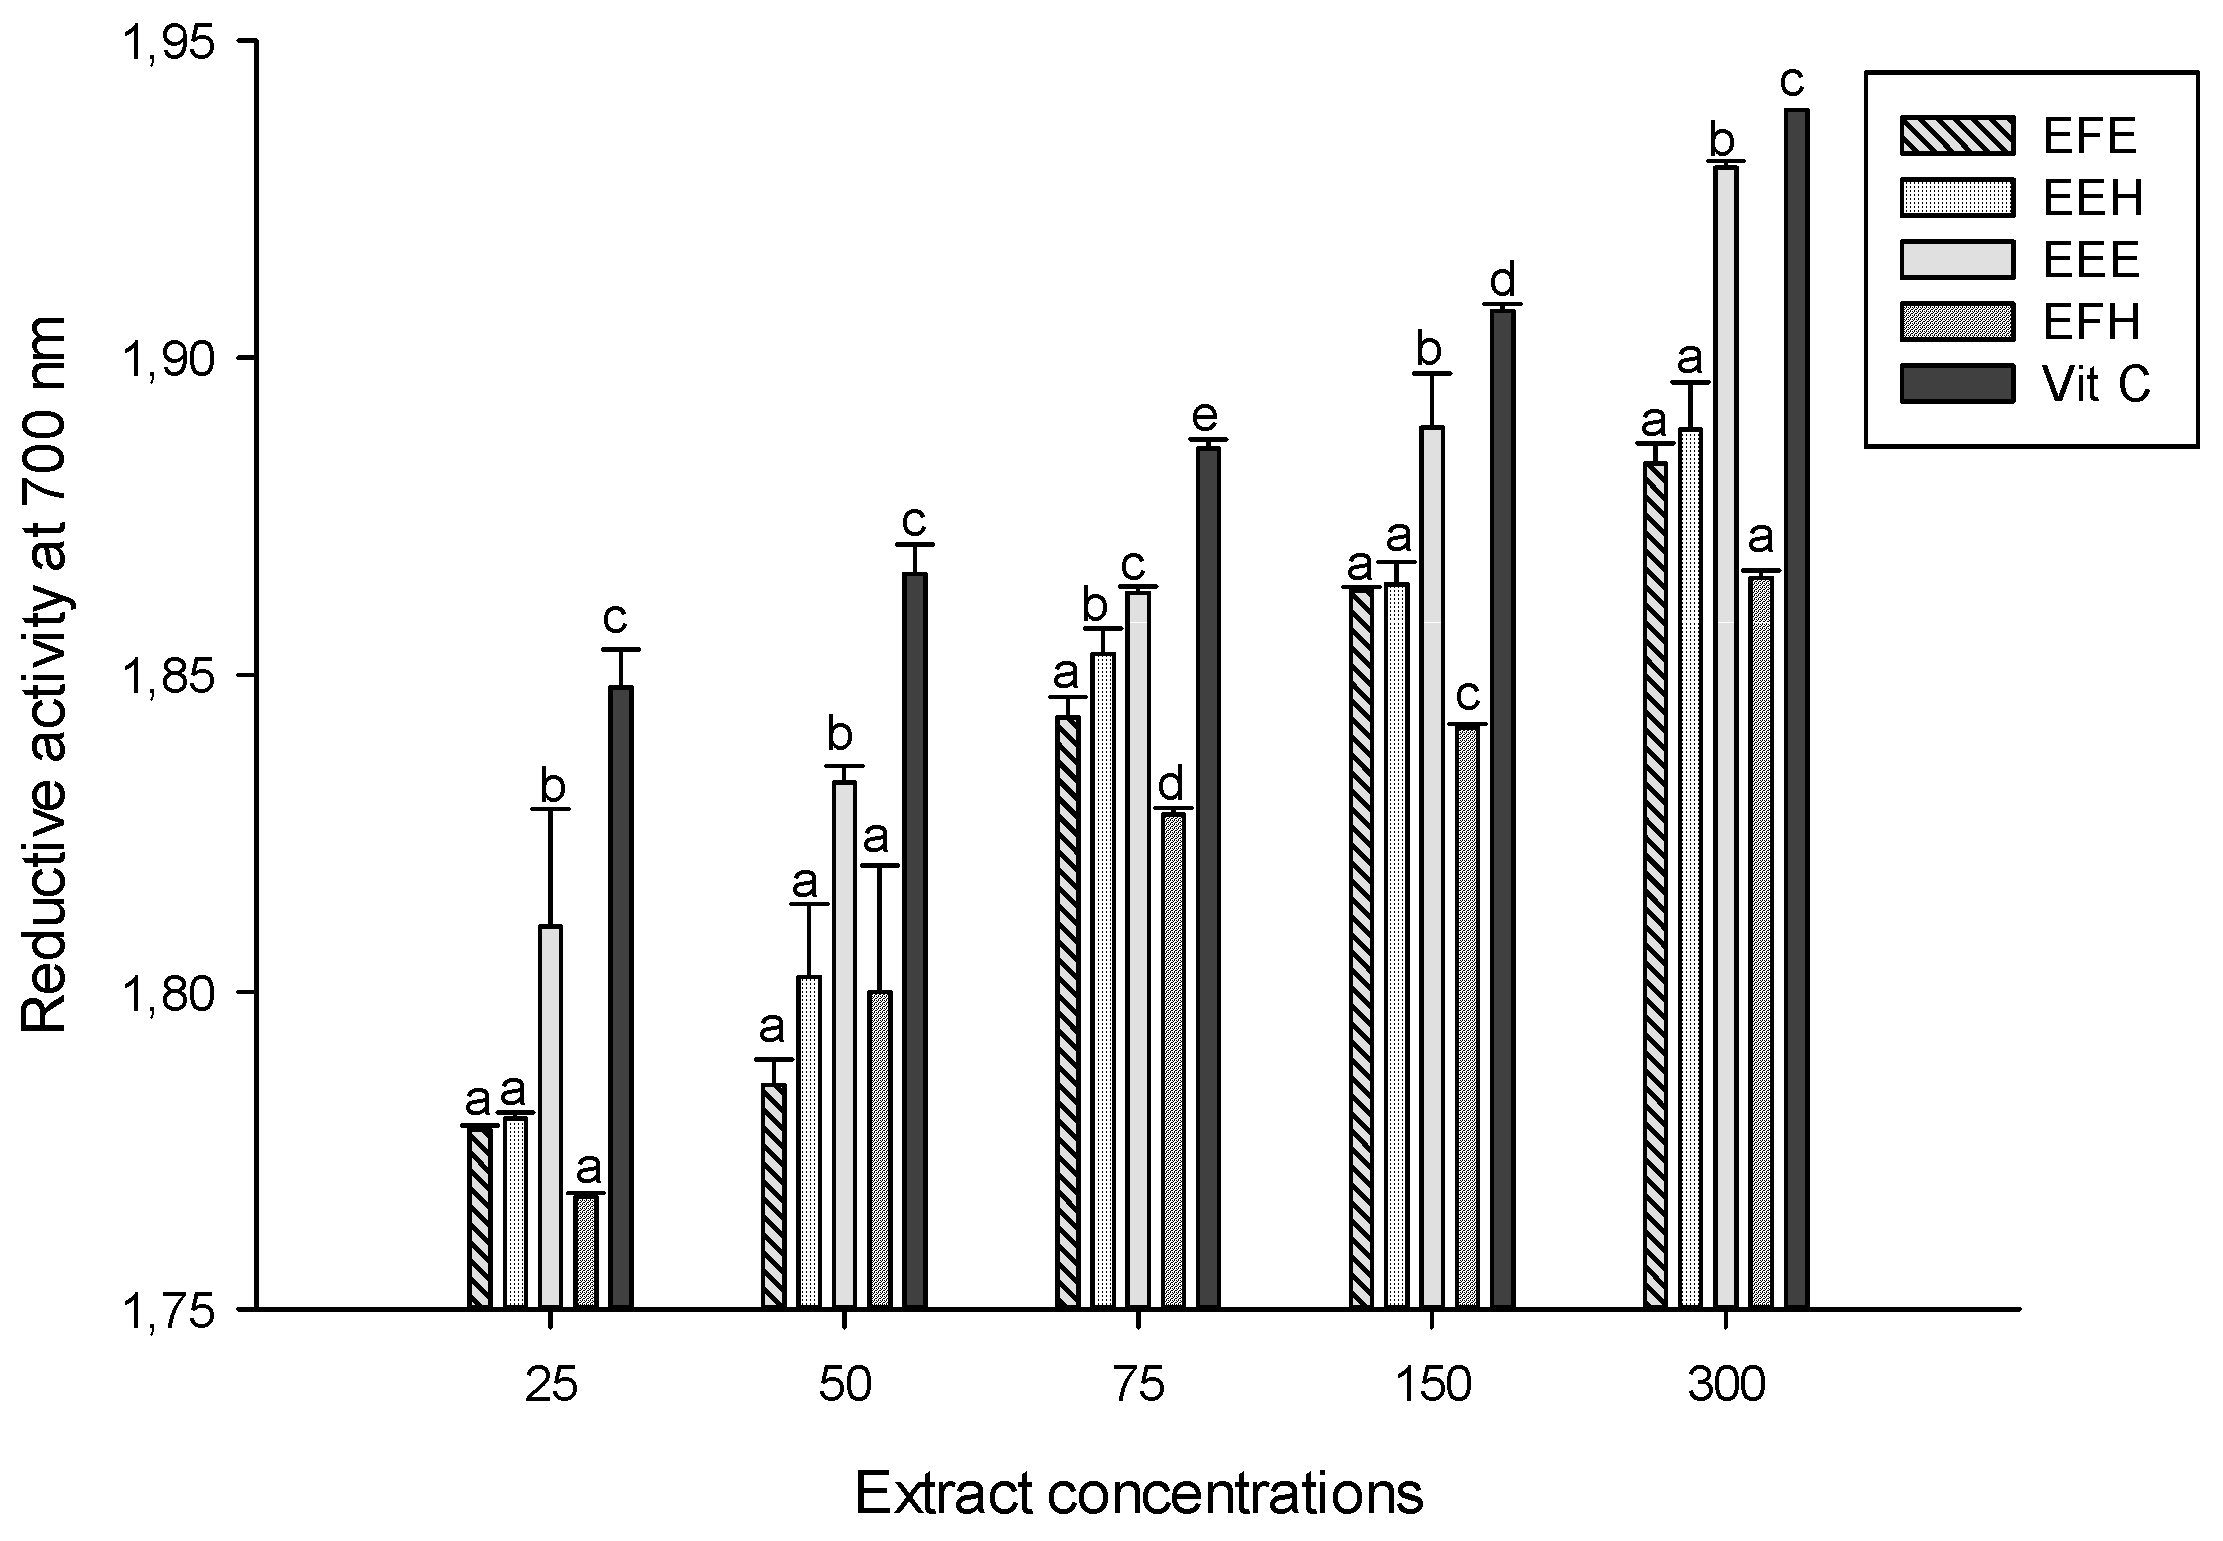
The reducing capacity of extracts may serve as an indicator of their potential antioxidant activity. Higher absorbance indicates a higher reducing power and higher antioxidant activity [
37]. The results of the reductive power of the different extracts revealed that the extract EEE had the highest activity of all extracts (
Figure 5). The other extracts exhibited poor activity and were not significantly (
p < 0.05) different at the concentrations that were used in this study. Vitamin C that was used as standard showed the highest activity at all the concentrations. This activity could be attributed to phenolic compounds that have been identified in these extracts.
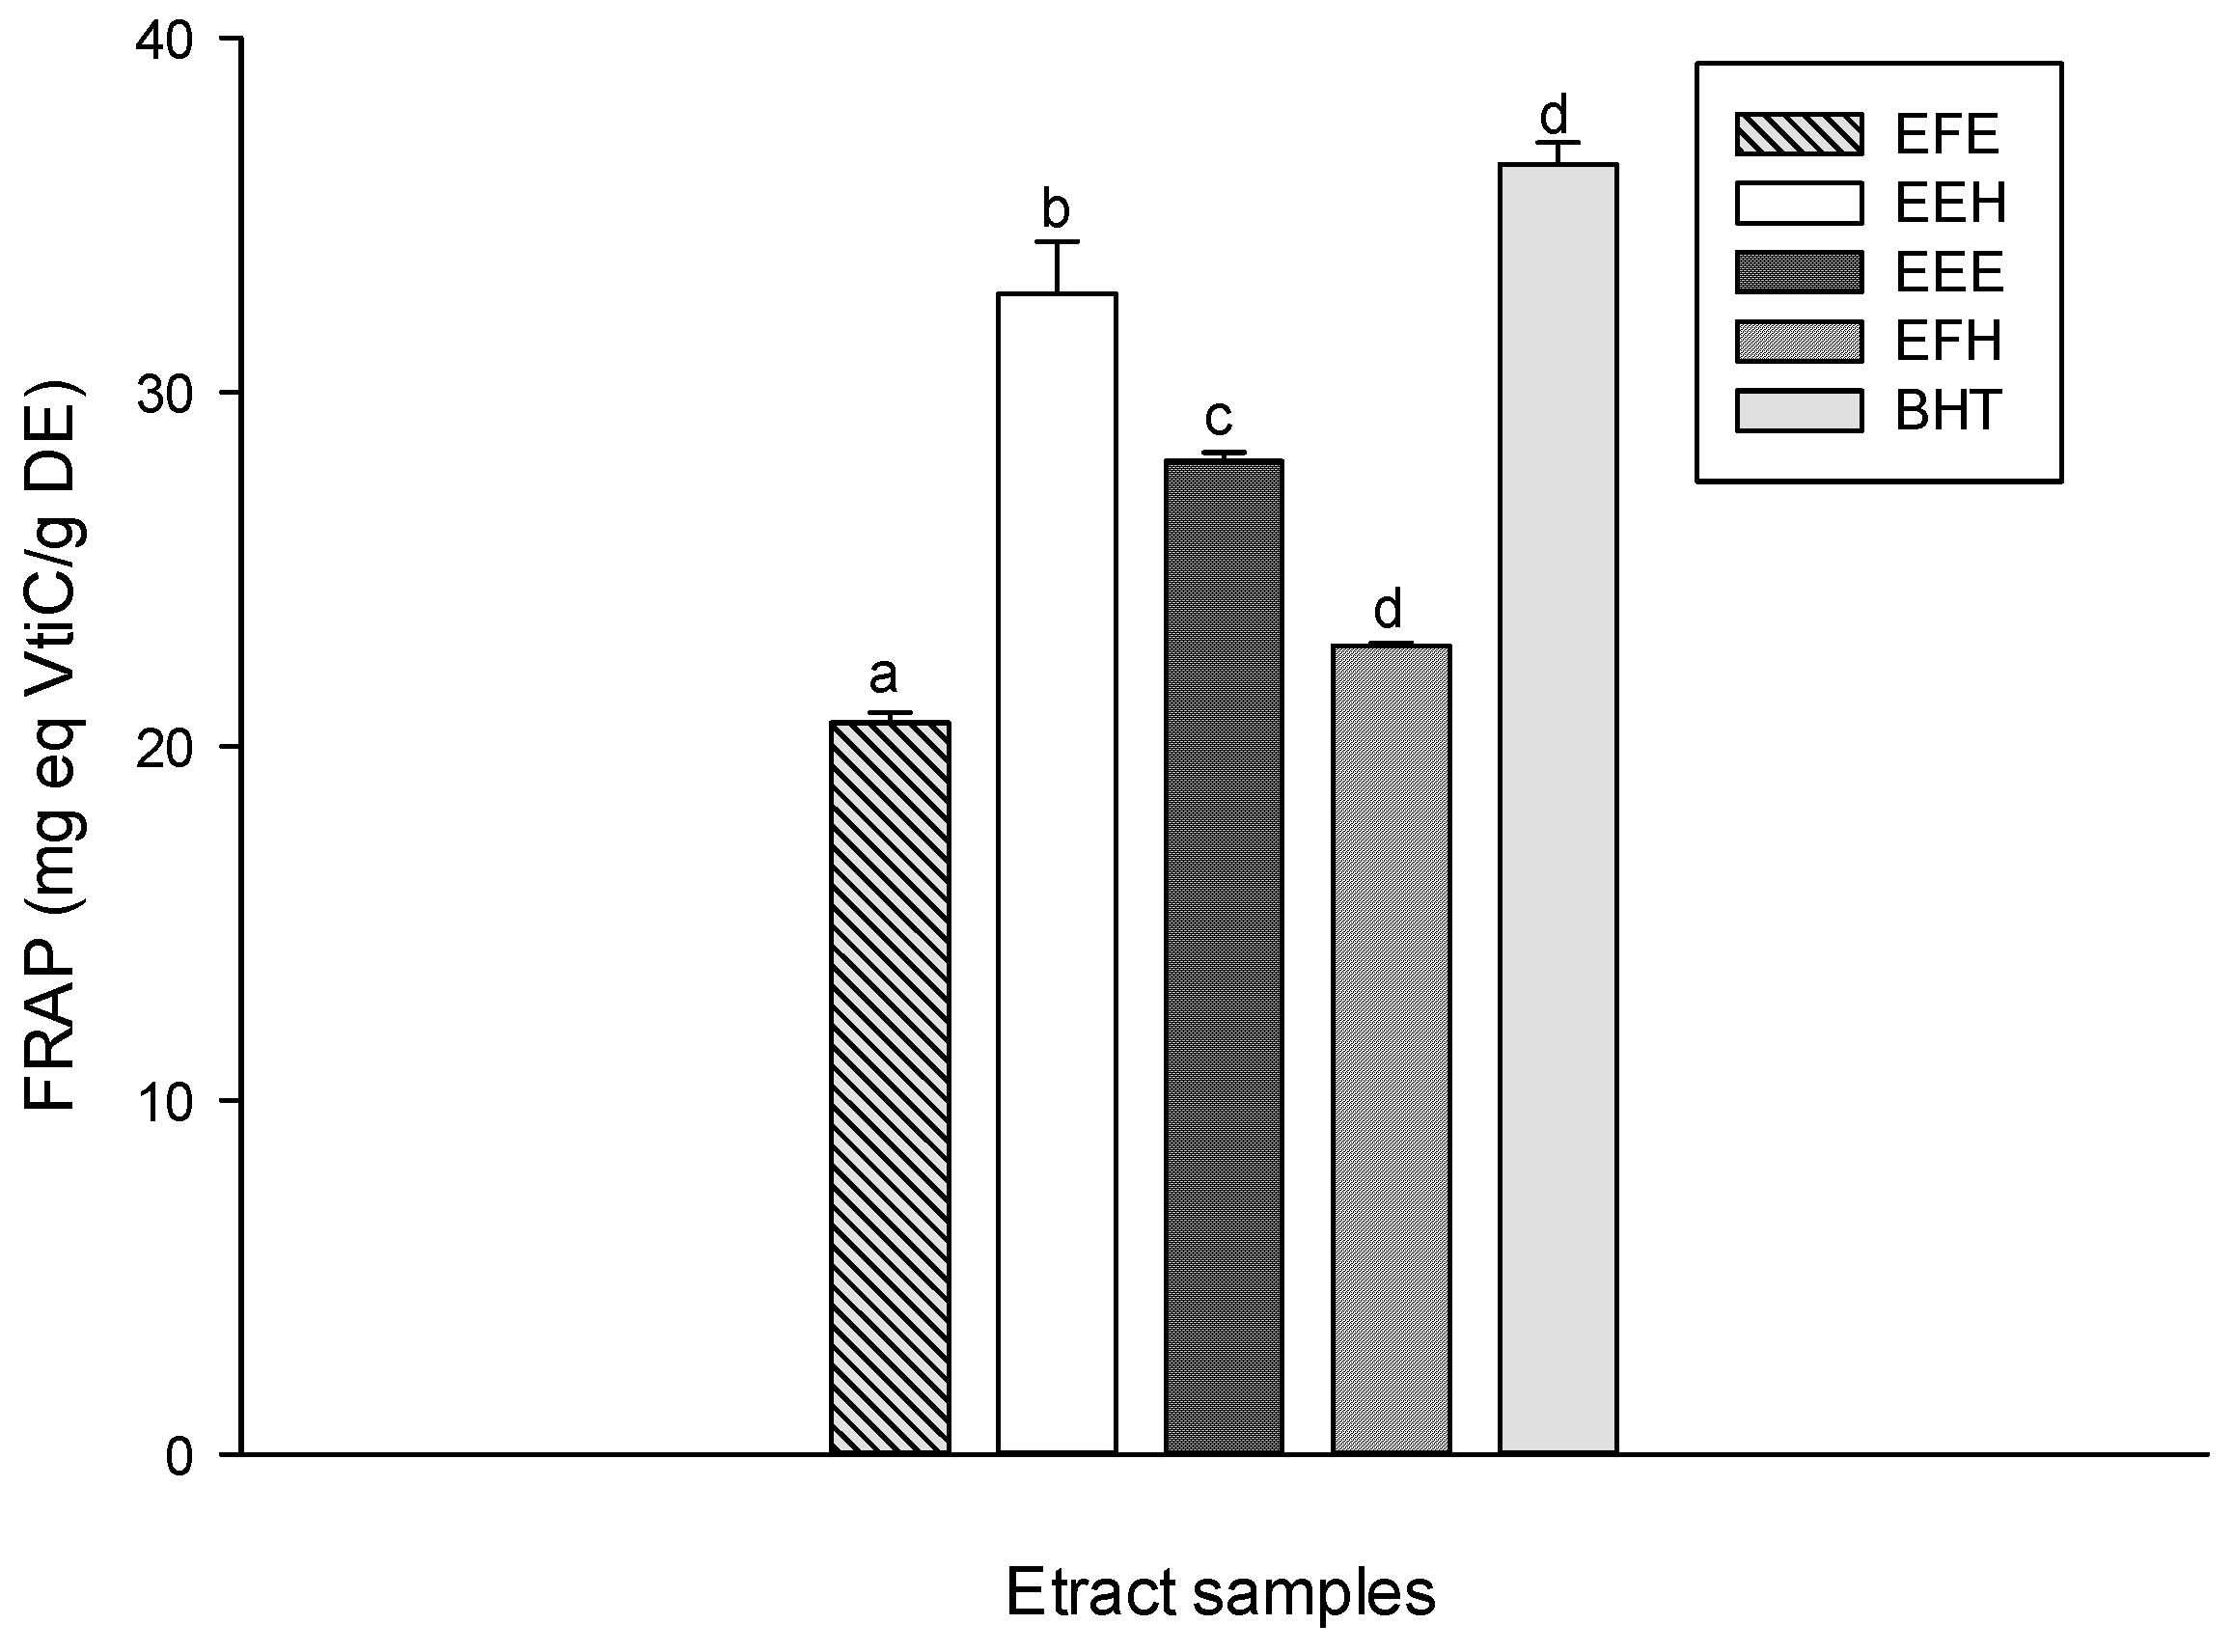
The ferric reducing antioxidant power (FRAP) method is based on the reduction of a ferroin analog, the Fe
3+ complex of tripyridyltriazine Fe(TPTZ)
3+, to the intensely blue colored Fe
2+ complex Fe(TPTZ)
2+ by antioxidants in acidic medium. The resulting FRAP activity is shown by the increase of the absorbance at 593 nm [
38]. The FRAP anti-oxidative power of the different tested extracts is represented in
Figure 6. These results show that EEH has the significantly (
p < 0.05) highest antioxidant power among the tested extracts (32.79 ± 1.46 mg eq Vit C/g DE) followed by EEE (28.05 ± 0.24 mg eq Vit C/g DE). The amount of Fe
3+ ions reduced to Fe
2+ ions varied with the concentration of phenols. The BHT used as standard had the highest and most significant (
p < 0.05) FRAP antioxidant power.
Figure 5.
Reductive activity of the different plant extracts. Values are expressed as mean ± SD of three replicates. In the same concentration the values labeled with different letters differ significantly at p < 0.05. EEE: H. zenkeri (bark) ethanolic extract; EFE: H. zenkeri (leaves) ethanolic extract; EEH: H. zenkeri (bark) hydro-ethanolic extract; EFH: H. zenkeri (leaves) hydro-ethanolic extract; Vit C: Vitamin C.
Figure 6.
Ferric reducing antioxidant power (FRAP) antioxidant activities of the different plant extracts. Values are expressed as mean ± SD of three replicates. The values labeled with different letters differ significantly different at p < 0.05. EEE: H. zenkeri (bark) ethanolic extract; EFE: H. zenkeri (leaves) ethanolic extract; EEH: H. zenkeri (bark) hydro-ethanolic extract; EFH: H. zenkeri (leaves) hydro-ethanolic extract; BHT: butylated hydroxyl toluene.
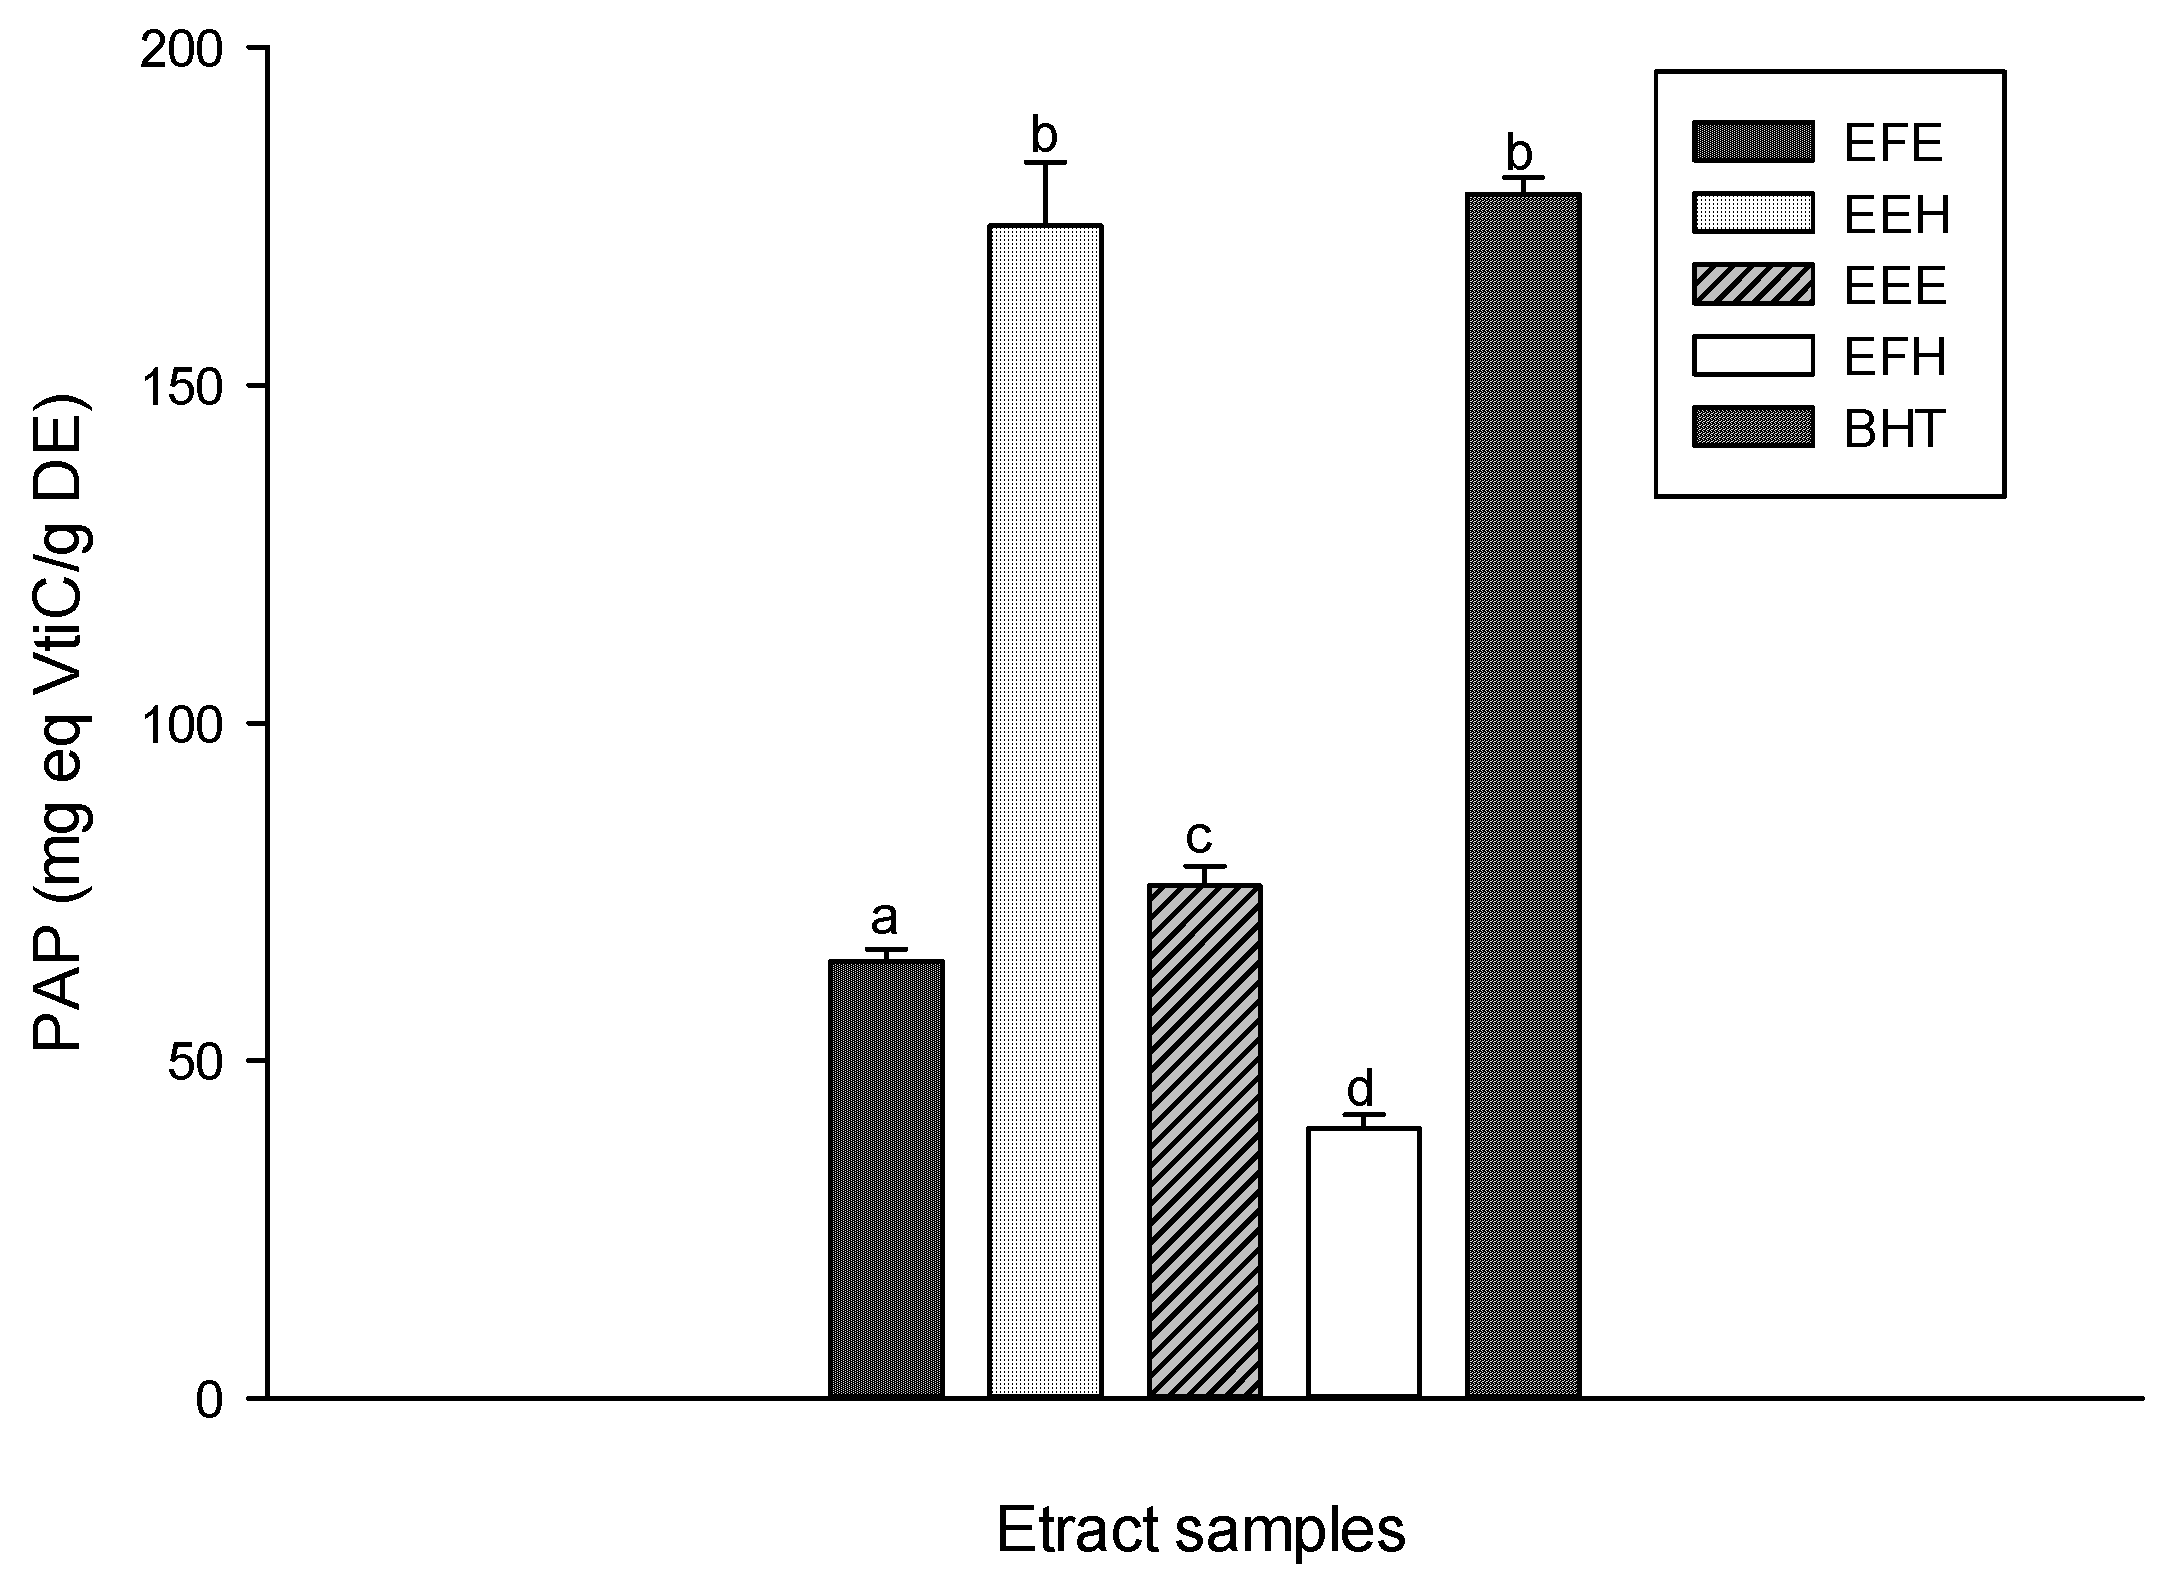
The results of the phosphomolybdenum antioxidative power (PAP) of the different samples presented in
Figure 7 showed that all the tested extracts had a PAP and that this property varied with the type of extract. The EEH extract showed the higher PAP among the extracts (173.58 ± 9.37 mg eq Vit C/g DE). The above results are similar to that of the BHT (178.26 ± 2.42 mg eq Vit C/g DE). These results support the hypothesis that our extract could act also as ion chelator.
Phenolic compounds are involved in repair and adaptive systems and can act preventively or therapeutically in various diseases [
40,
41].
Table 1 presents the phenolic composition of the different extracts. These results show that the extract EEH (21.77 ± 0.05 caffeic acid (CAE)/g DE) has the highest total phenol concentration followed by EEE (18.38 ± 0.09 CAE/g DE). Similar results were noted for flavonoids and flavonols. These results underline the high antioxidant activities observed in EEH and EEE extracts. There is a strong relationship between total phenolic and flavonoid contents and antioxidant, free radical scavenging activities in many plants although this depends on their proportions in the plants [
40].
Figure 7.
Phosphomolybdenum antioxidative power (PAP) of the different plant extracts. Values are expressed as mean ± SD of three replicates. The values labeled with different letters differ significantly at p < 0.05. EEE: H. zenkeri (bark) ethanolic extract; EFE: H. zenkeri (leaves) ethanolic extract; EEH: H. zenkeri (bark) hydro-ethanolic extract; EFH: H. zenkeri (leaves) hydro-ethanolic extract; BHT: butylated hydroxyl toluene.
Table 1.
Total phenol, flavonoid, and flavonol contents of the different plant extracts.
Table 1.
Total phenol, flavonoid, and flavonol contents of the different plant extracts.
| Samples | Phytochemicals |
|---|
| Total Phenols (mg CAE/g DE) | Flavonoids (mg QE/g DE) | Flavonols (mg CAE/g DE) |
|---|
| EEE | 18.38 ± 0.09 a | 2.58 ± 0.57 a | 1.10 ± 0.41 a |
| EEH | 21.77 ± 0.05 b | 3.34 ± 0.13 a | 1.47 ± 0.03 a |
| EFH | 10.70 ± 0.01 c | 1.40 ± 0.35 b | 0.71 ± 0.06 b |
| EFE | 7.21 ± 0.05 d | 0.50 ± 0.18 c | 0.27 ± 0.01 c |
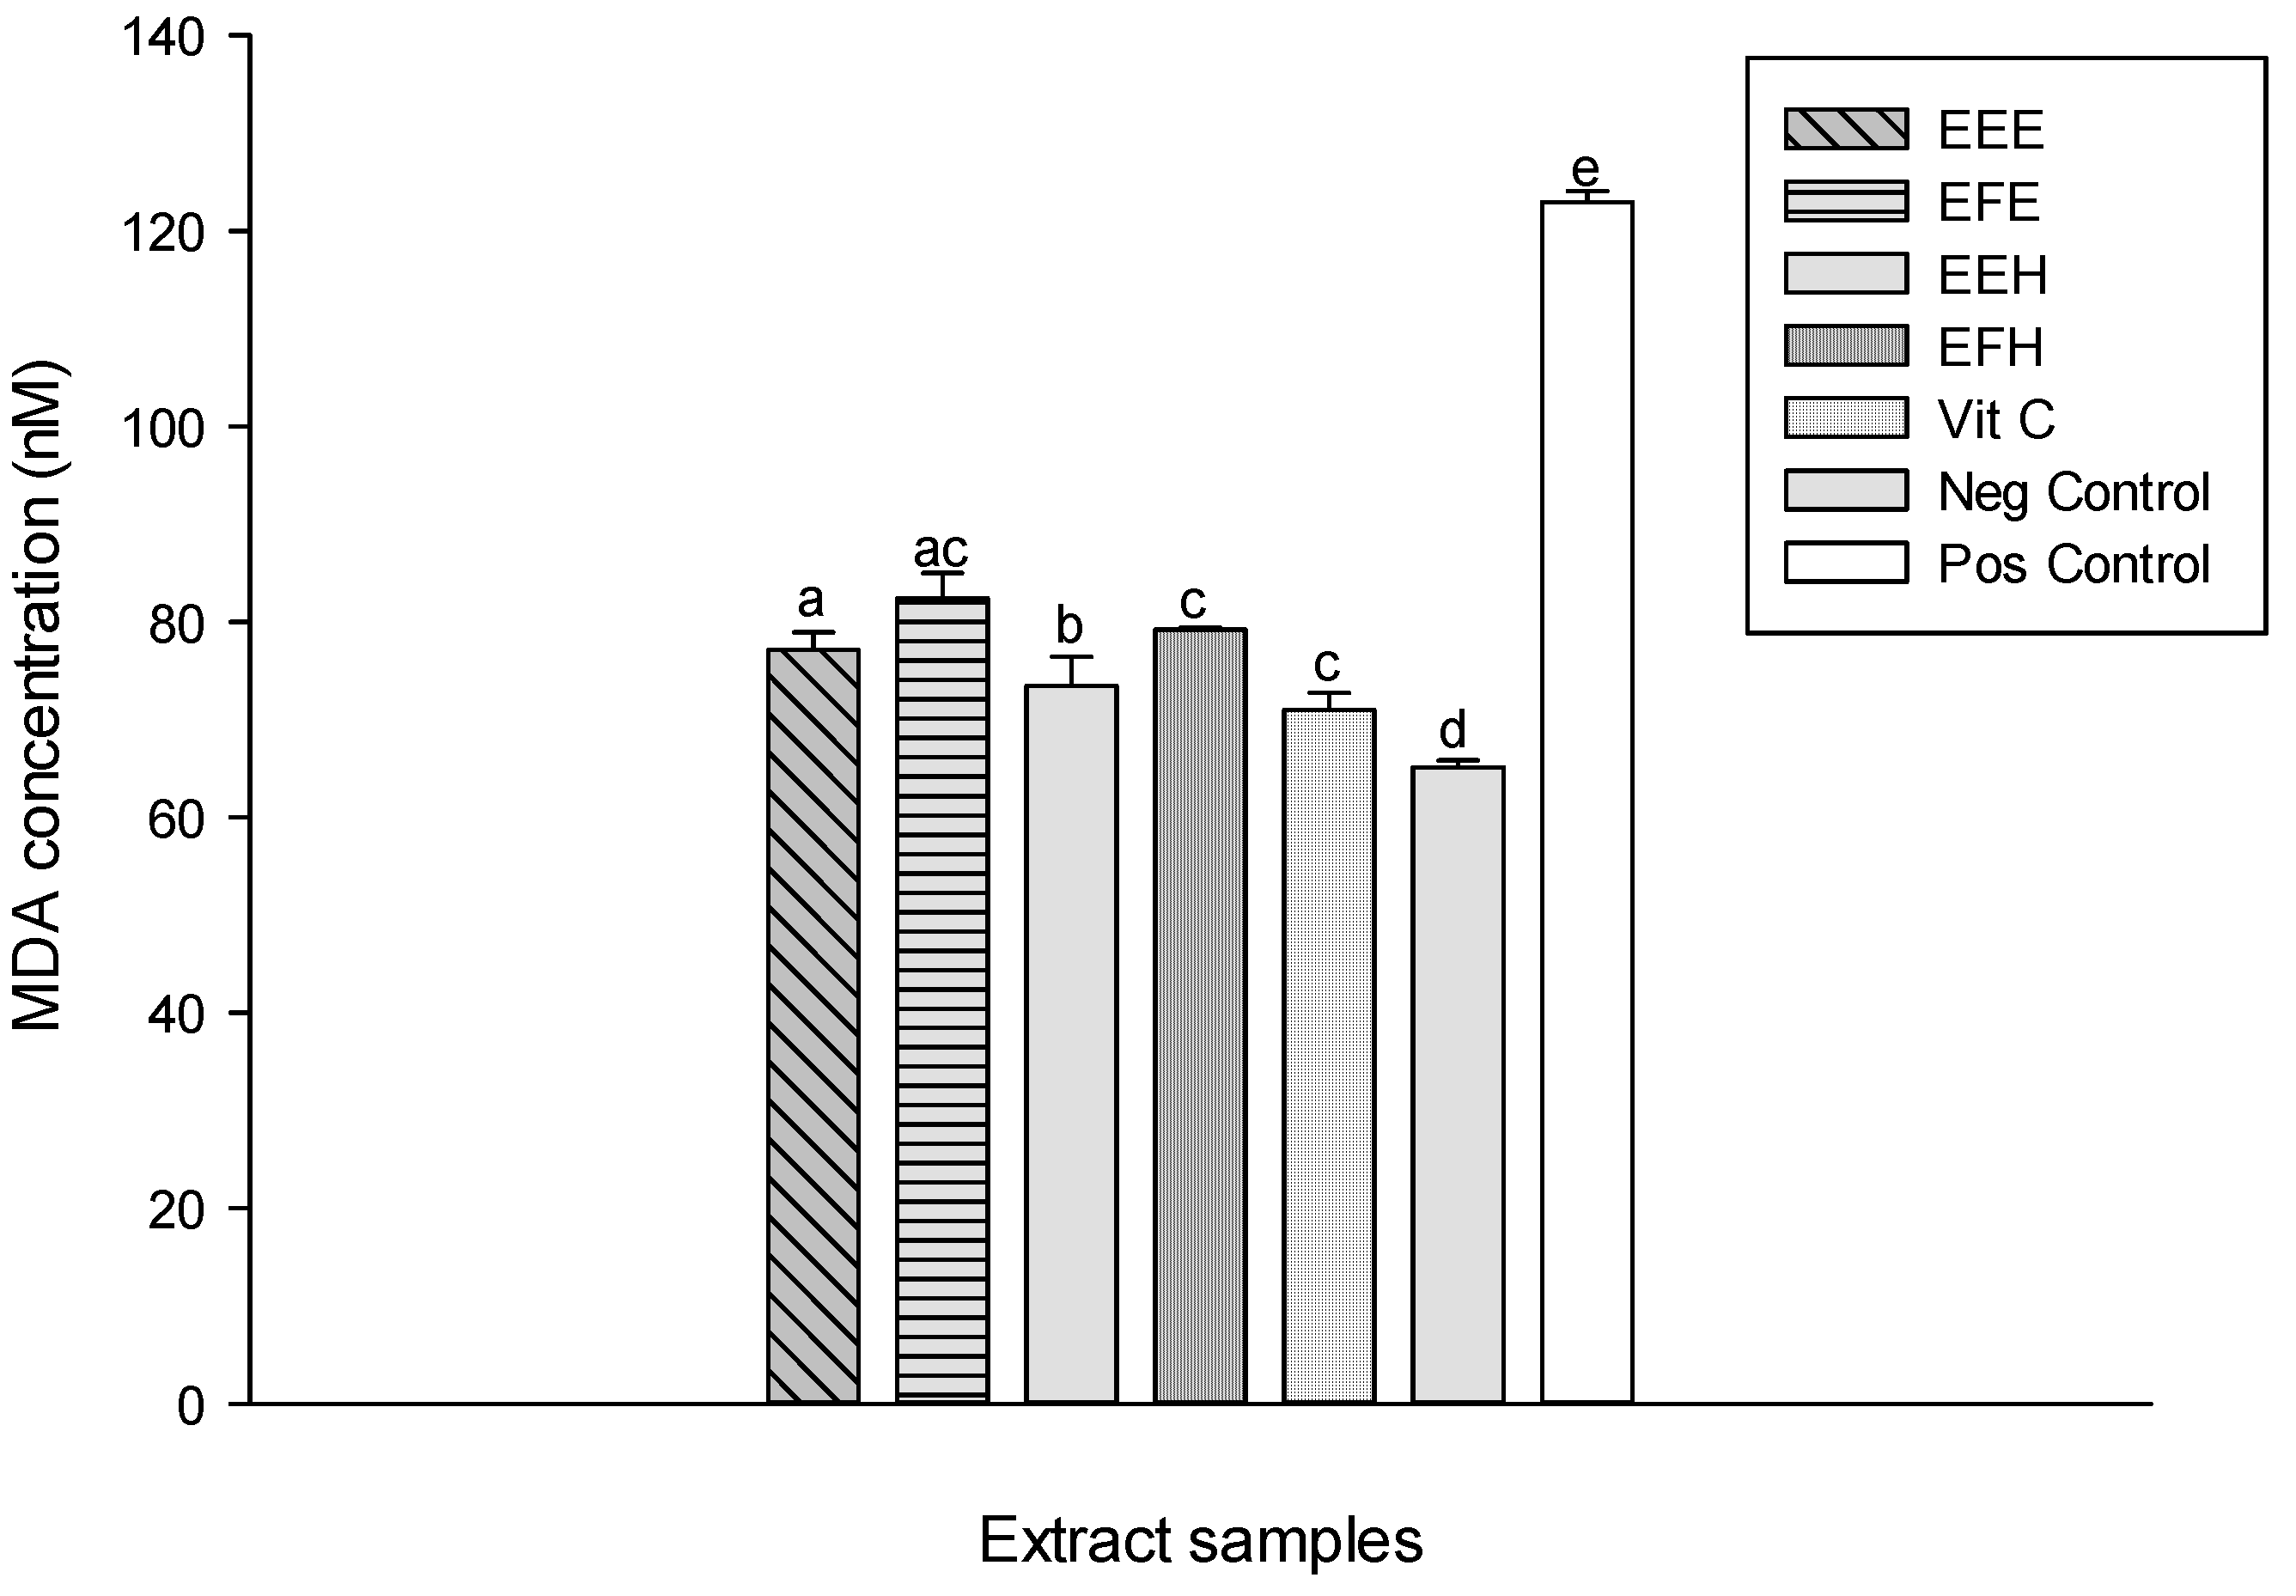
Lipid peroxidation is one of the major ways by which ROS cause cell damage since peroxidation results in changes in fluidity, membrane permeability, and alteration of functions of proteins that are embedded in the membrane [
42]. Natural products from medicinal plants can reduce this deleterious process [
10]. The protective effects of the extracts tested against lipid peroxidation are presented in
Figure 8. This result shows a significant (
p < 0.05) increase of the oxidant level (positive) (122.95 ± 2.42 nM) compared to the normal (negative) (65.13 ± 0.72 nM). The different tested extracts have shown the reduction in MDA level. The extract EEH has the most significant and highest inhibition (73.21 ± 3.02 nM) as demonstrated by its lowest MDA level. This result suggests that the polyphenol compounds present in the extract may either delay or inhibit the initiation step of lipid peroxidation by reacting with a lipid radical or by inhibiting their propagation step or by reacting with peroxyl or alkoxyl radicals [
38,
43]. Also, the antioxidants from the extracts may further interfere with chain propagation reactions by forming peroxy-antioxidant stable compounds [
38]. ROS damage macromolecules in cells and have been involved in the etiologies or manifestations of several pathological processes [
2,
44]. Antioxidant enzymes are capable of eliminating ROS and lipid peroxidation products, therefore, they can protect cells and tissues from oxidative damage. Antioxidant enzymes include SOD, catalase and peroxidases. SOD is a key enzyme in the natural defense against free radicals, and its determinant role has been described [
45]. It is well known that the superoxide ion (O
2−) is the starting point in the chain production of free radicals. At this early stage, superoxide dismutase inactivates the superoxide ion by transforming it into hydrogen peroxide (H
2O
2) [
45]. The SOD activity of the different tested samples showed an increase of the SOD activity of the different extracts compared to the oxidant 2.22 ± 0.16 UI/mg Prot. (
Figure 9). The extracts EEE and EEH showed the highest activities with values of 5.79 ± 0.02 UI/mg Prot and 6.13 ± 0.03 UI/mg Prot., respectively). This result suggests that our extracts contain molecules that enable them to act as secondary or preventative antioxidants that retard the rate of oxidation. These extracts may achieve this activity through several ways including the removal of substrate or singlet oxygen quenching therefore protecting the enzymes [
38]. Hydrogen peroxide (H
2O
2), a highly ROS, is produced as the result of SOD reactions [
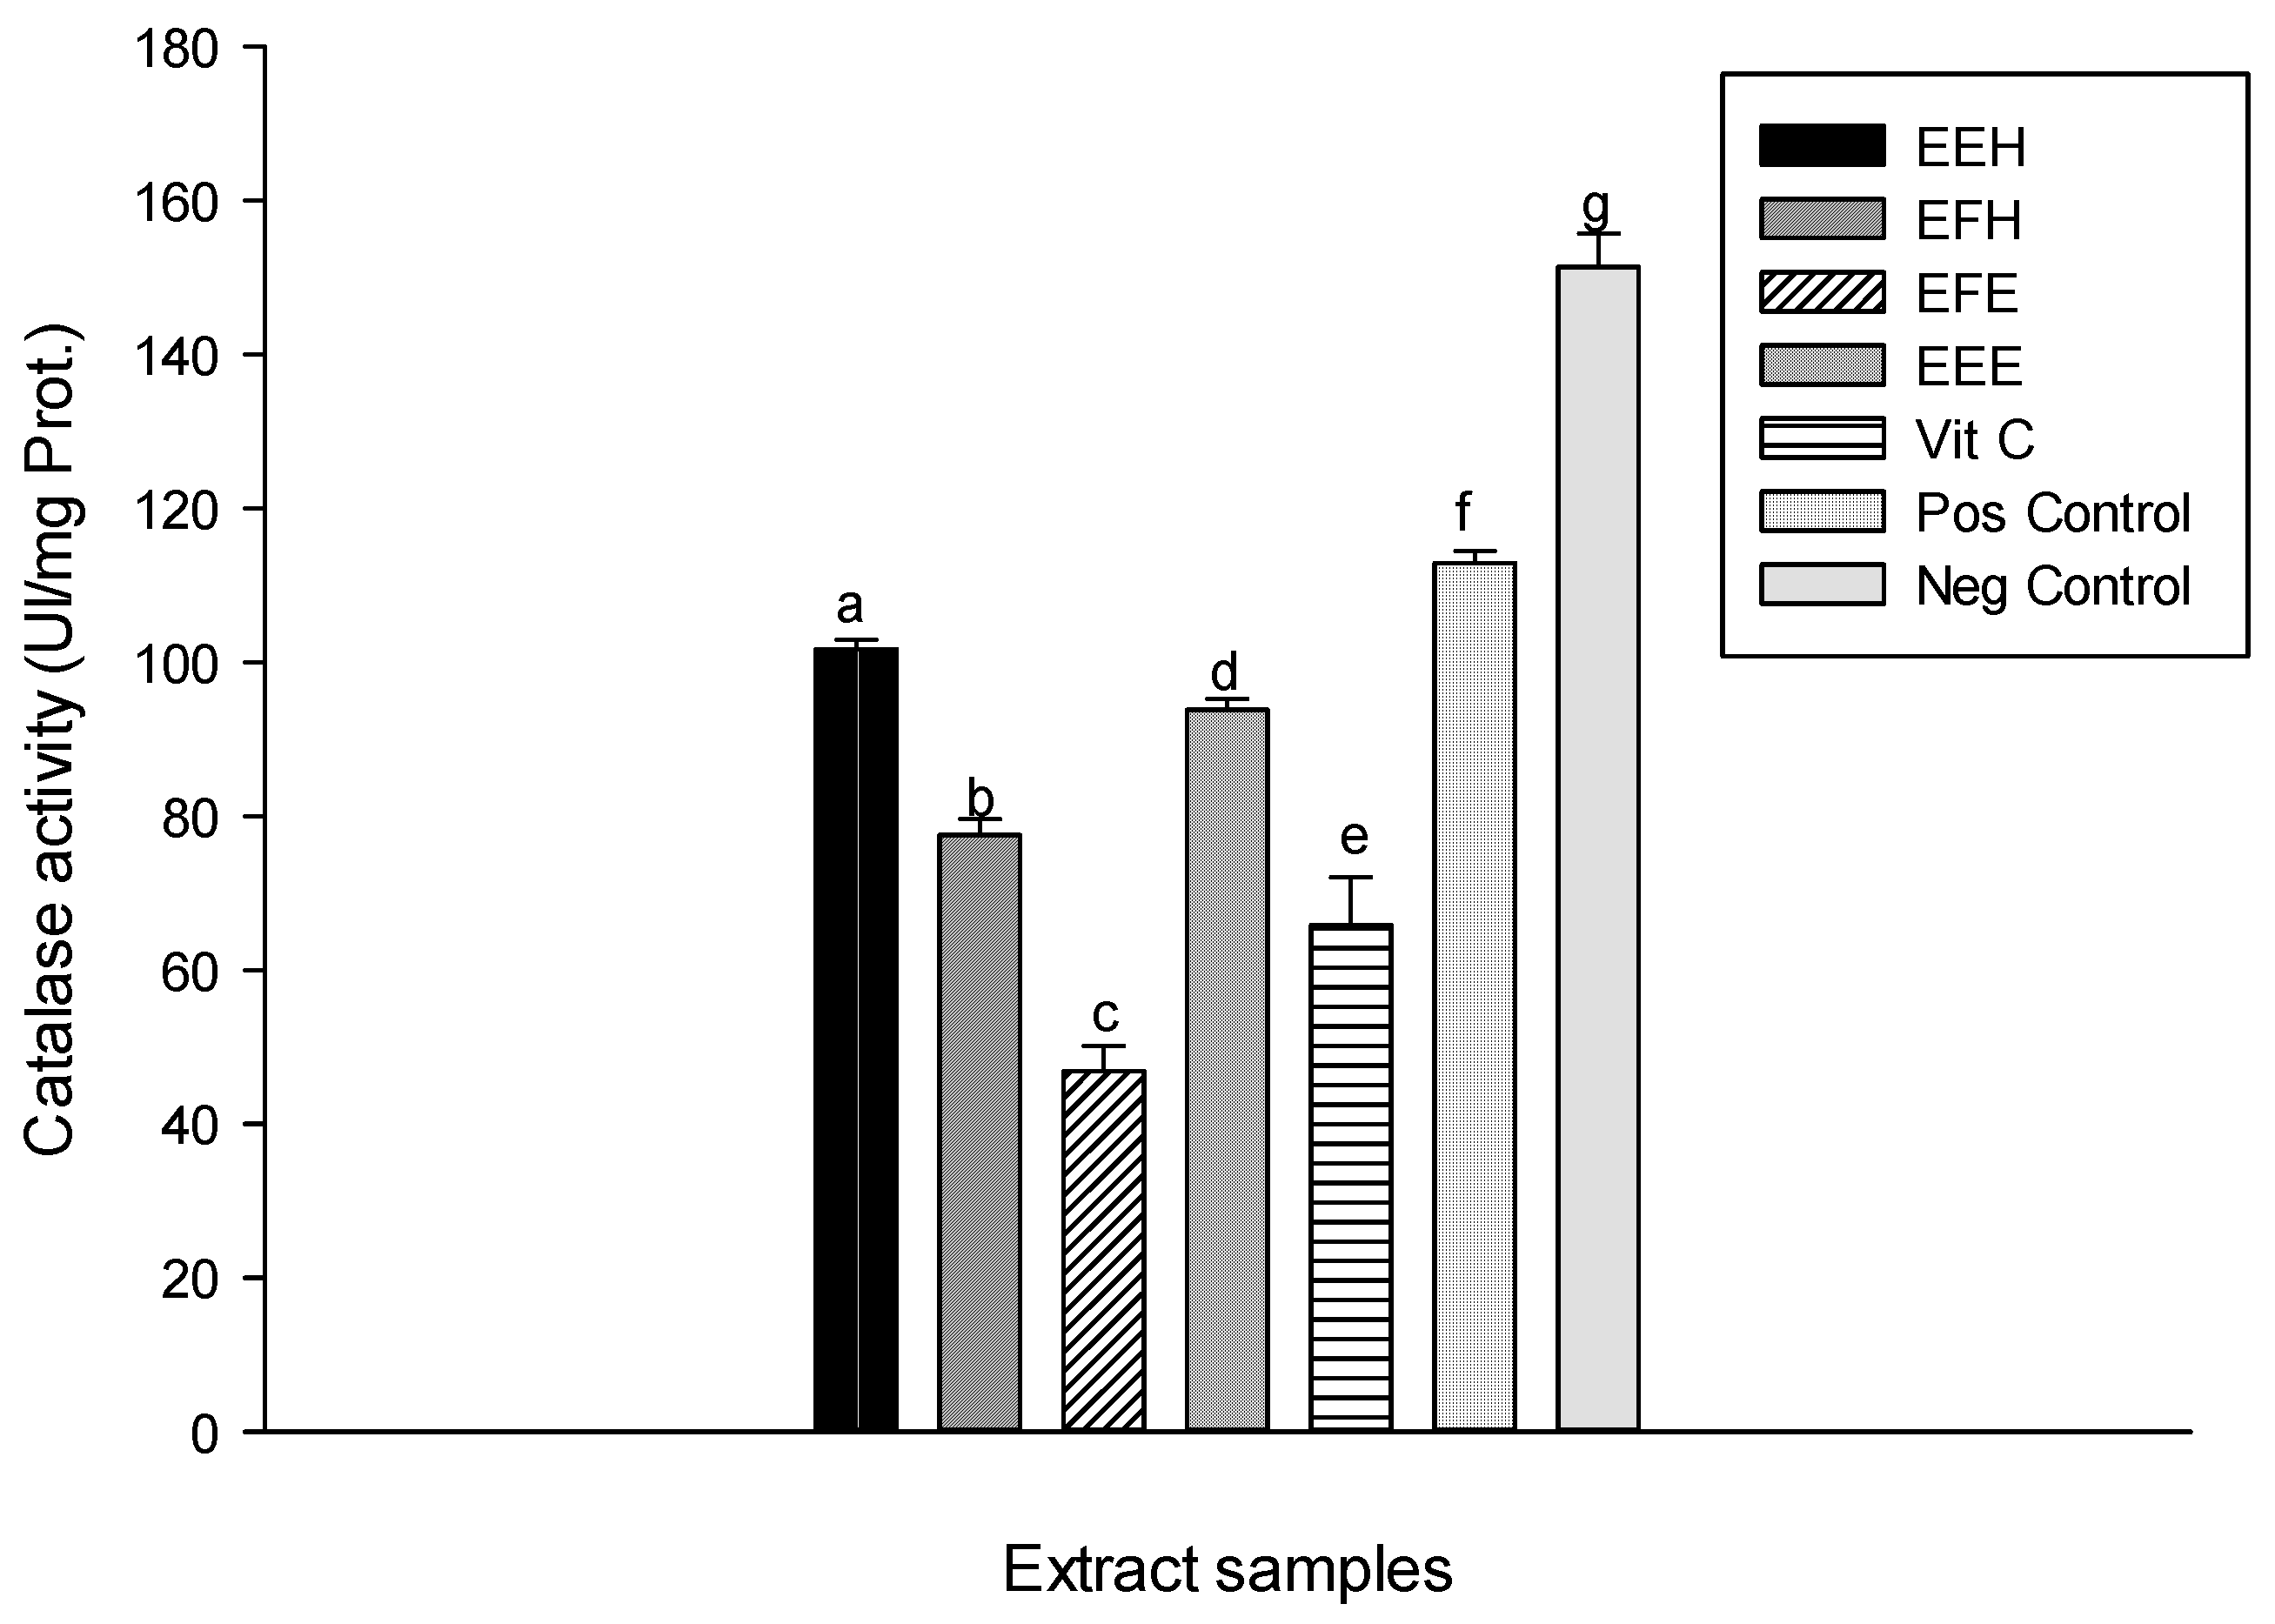
46]. The catalase activity recorded in the different groups is displayed in
Figure 10. This result shows a significant (
p < 0.05) decrease of the catalase activity in the oxidant (positive) (5.22 ± 0.92 UI/mg Prot.) compared to the negative (40.88 ± 2.66 UI/mg Prot.). This activity increases in the different extracts tested with the EEH extract showing the significant and higher activity (101.67 ± 0.92 UI/mg Prot.). The catalases provide protection against the toxic effects of H
2O
2 that is generated in respiring cells due to its catalytic function [
44,
47].
This protective potential of plant extracts against enzyme depletion has been attributed to phenolic compounds [
41]. Functionally, catalases are related to peroxidases which both degrade H
2O
2 to O
2 and H
2O [
44]. The protective effect of the different plant extracts on peroxidase activity is presented in
Figure 11. This result shows the increase of the peroxidase activity of different extracts compared to the oxidant (positive) control. Among the tested samples, the extracts EEH (9.25 ± 0.40 UI/mg Prot.) and EEE (8.97 ± 0.19 UI/mg Prot.) show similar results to vitamin C (9.38 ± 0.14 UI/mg Prot.). This result confirms that phenolic compounds can act as ion chelators and can, therefore, prevent the involvement of hydroxyl radical in Fenton reactions, which can generate higher concentrations of hydroxyl radicals that could in turn injure macromolecules such as enzymes [
10,
40].
Figure 8.
Protective properties of plant extracts against lipid peroxidation. Values are expressed as mean ± SD of three replicates. In the same column the values labeled with different letters differ significantly at p < 0.05. EEE: H. zenkeri (bark) ethanolic extract; EFE: H. zenkeri (leaves) ethanolic extract; EEH: H. zenkeri (bark) hydro-ethanolic extract; EFH: H. zenkeri (leaves) hydro-ethanolic extract; Vit C: Vitamin C. Pos Control: oxidant (positive) control. Neg Control: Normal (negative) control.
Figure 9.
Protective properties of plant extracts: SOD activity. Values are expressed as mean ± SD of three replicates. In the same column the values labeled with different letters differ significantly at p < 0.05. EEE: H. zenkeri (bark) ethanolic extract; EFE: H. zenkeri (leaves) ethanolic extract; EEH: H. zenkeri (bark) hydro-ethanolic extract; EFH: H. zenkeri (leaves) hydro-ethanolic extract; Vit C: Vitamin C. Pos Control: oxidant (positive) control. Neg Control: Normal (negative) control.
Figure 10.
Protective properties of plant extracts: catalase activity. Values are expressed as mean ± SD of three replicates. In the same column the values labeled with different letters differ significantly at p < 0.05. EEE: H. zenkeri (bark) ethanolic extract; EFE: H. zenkeri (leaves) ethanolic extract; EEH: H. zenkeri (bark) hydro-ethanolic extract; EFH: H. zenkeri (leaves) hydro-ethanolic extract; Vit C: Vitamin C. Pos Control: oxidant (positive) control. Neg Control: Normal (negative) control.
Figure 11.
Protective properties of plant extracts: peroxidase activity. Values are expressed as mean ± SD of three replicates. In the same column the values labeled with different letters differ significantly at p < 0.05. EEE: H. zenkeri (bark) ethanolic extract; EFE: H. zenkeri (leaves) ethanolic extract; EEH: H. zenkeri (bark) hydro-ethanolic extract; EFH: H. zenkeri (leaves) hydro-ethanolic extract; Vit C: Vitamin C. Pos Control: oxidant (positive) control. Neg Control: Normal (negative) control.
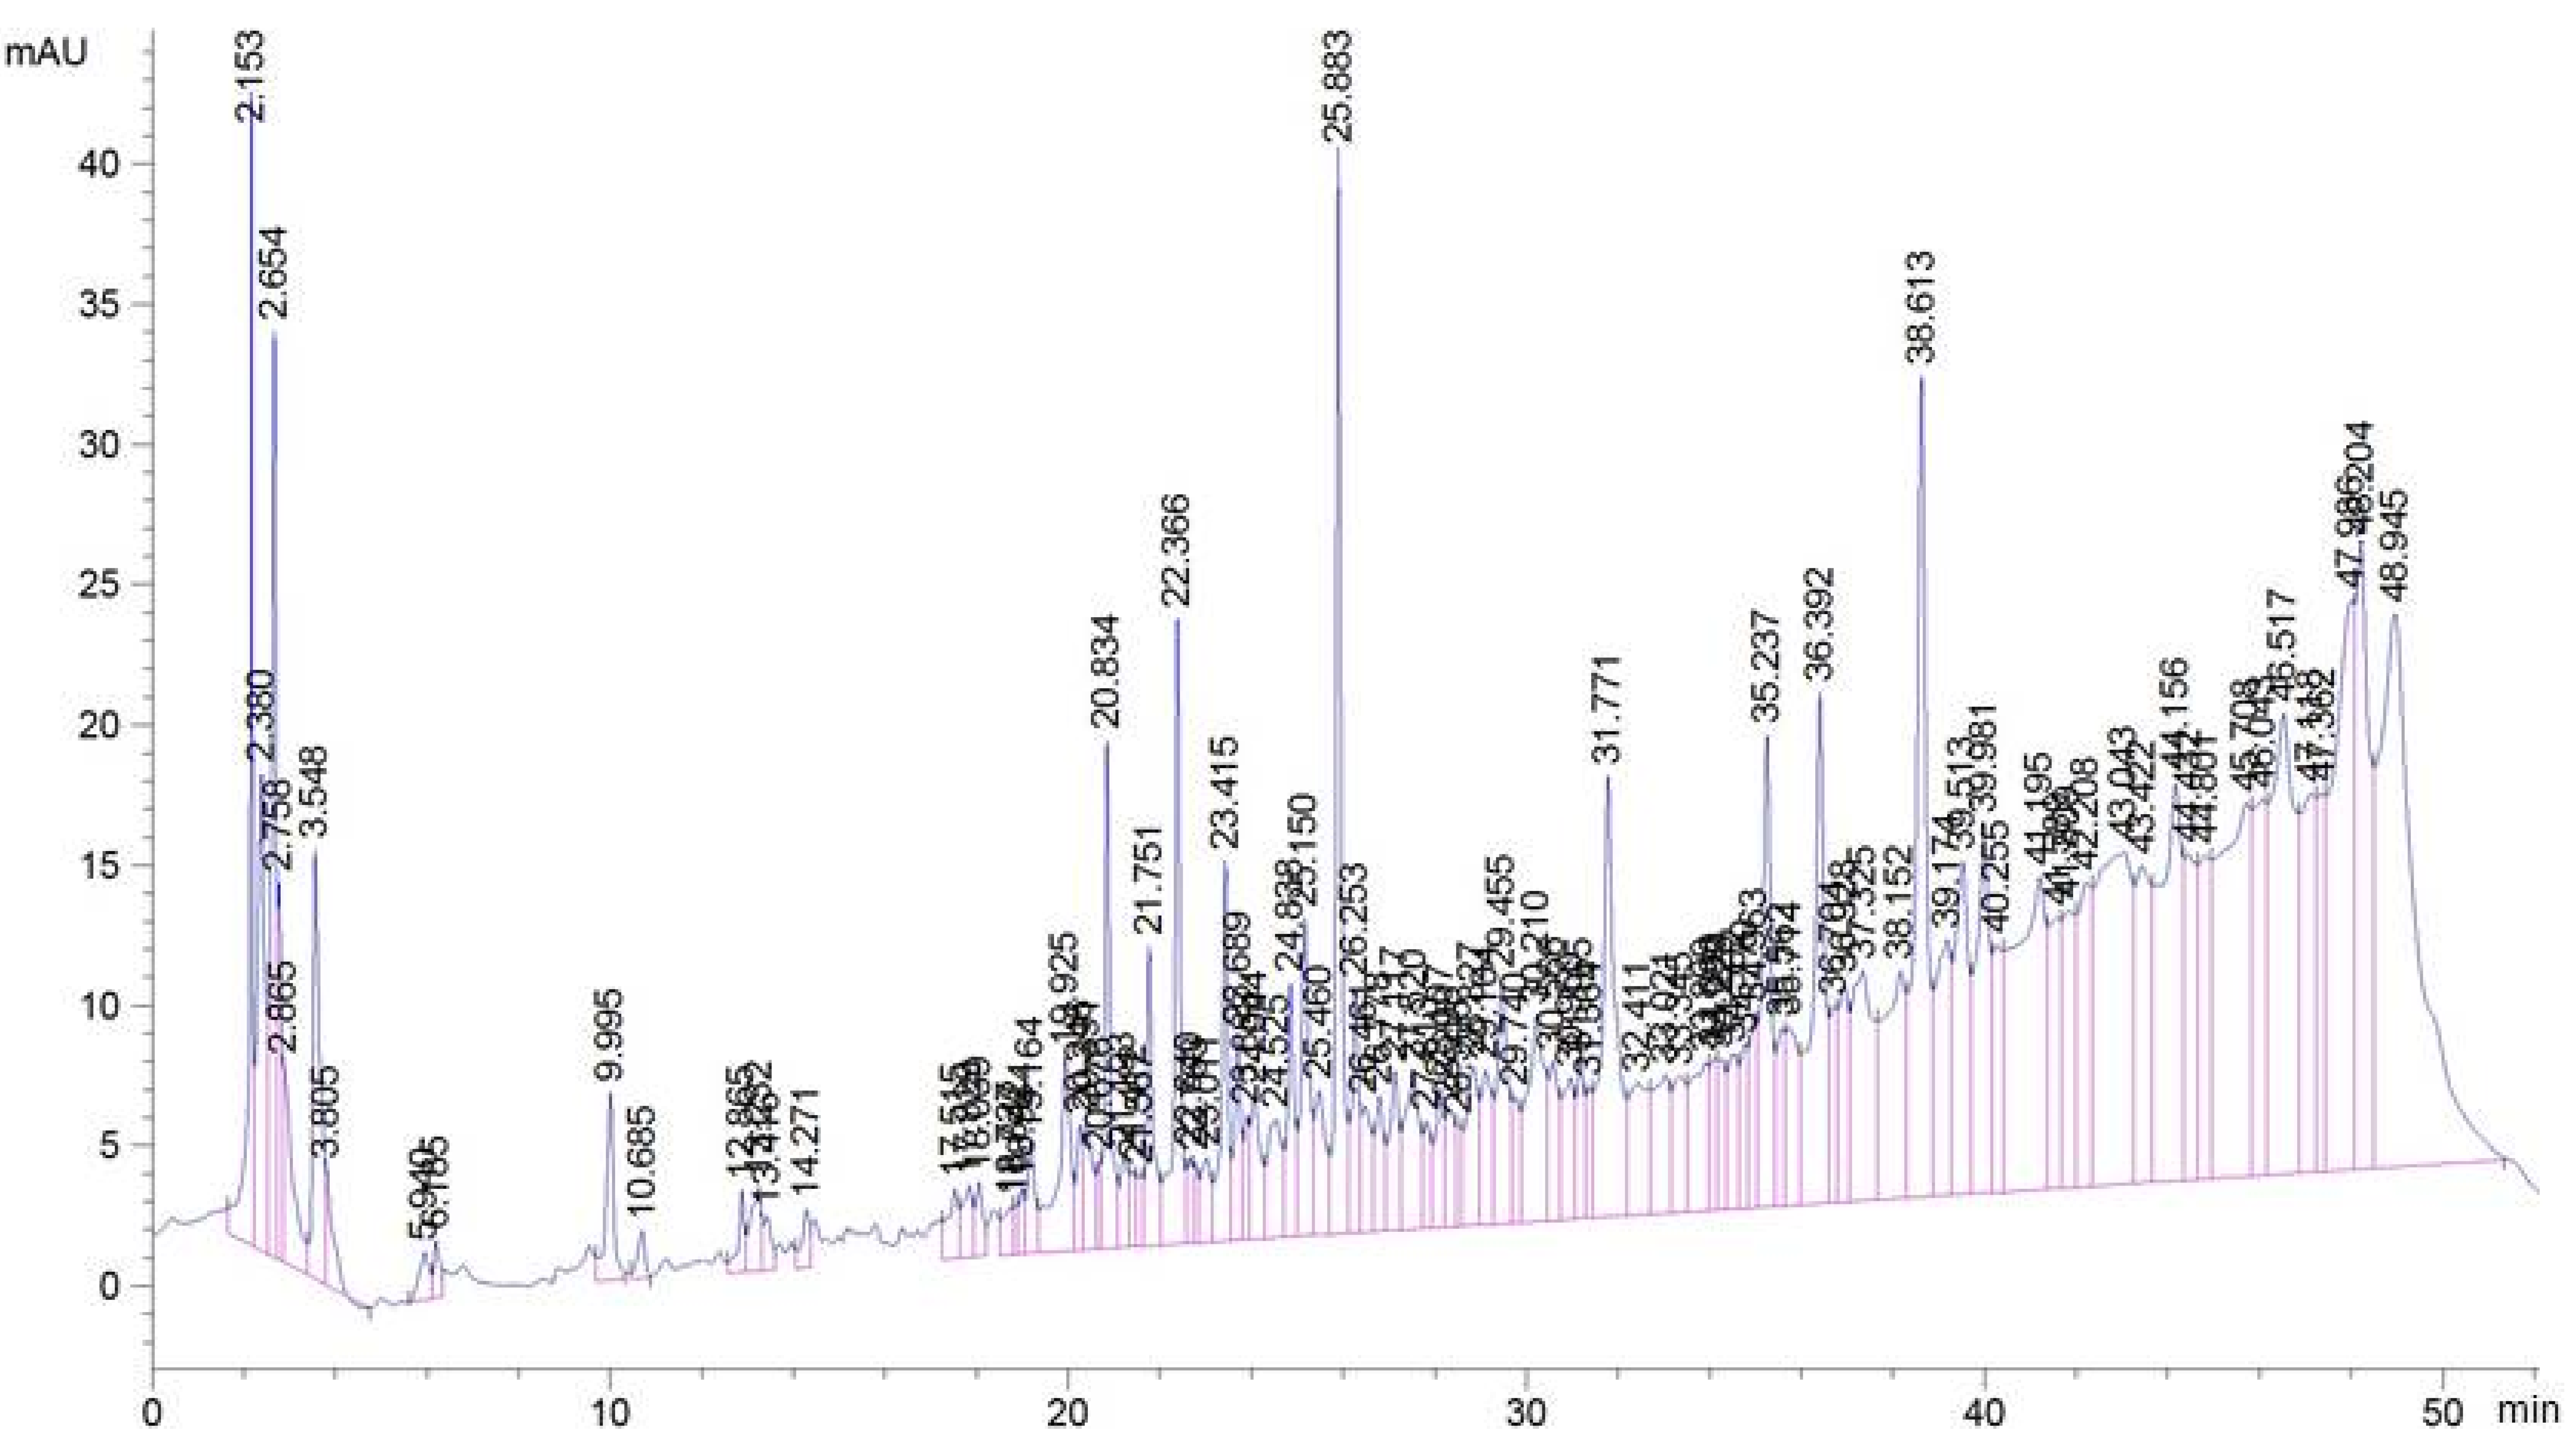
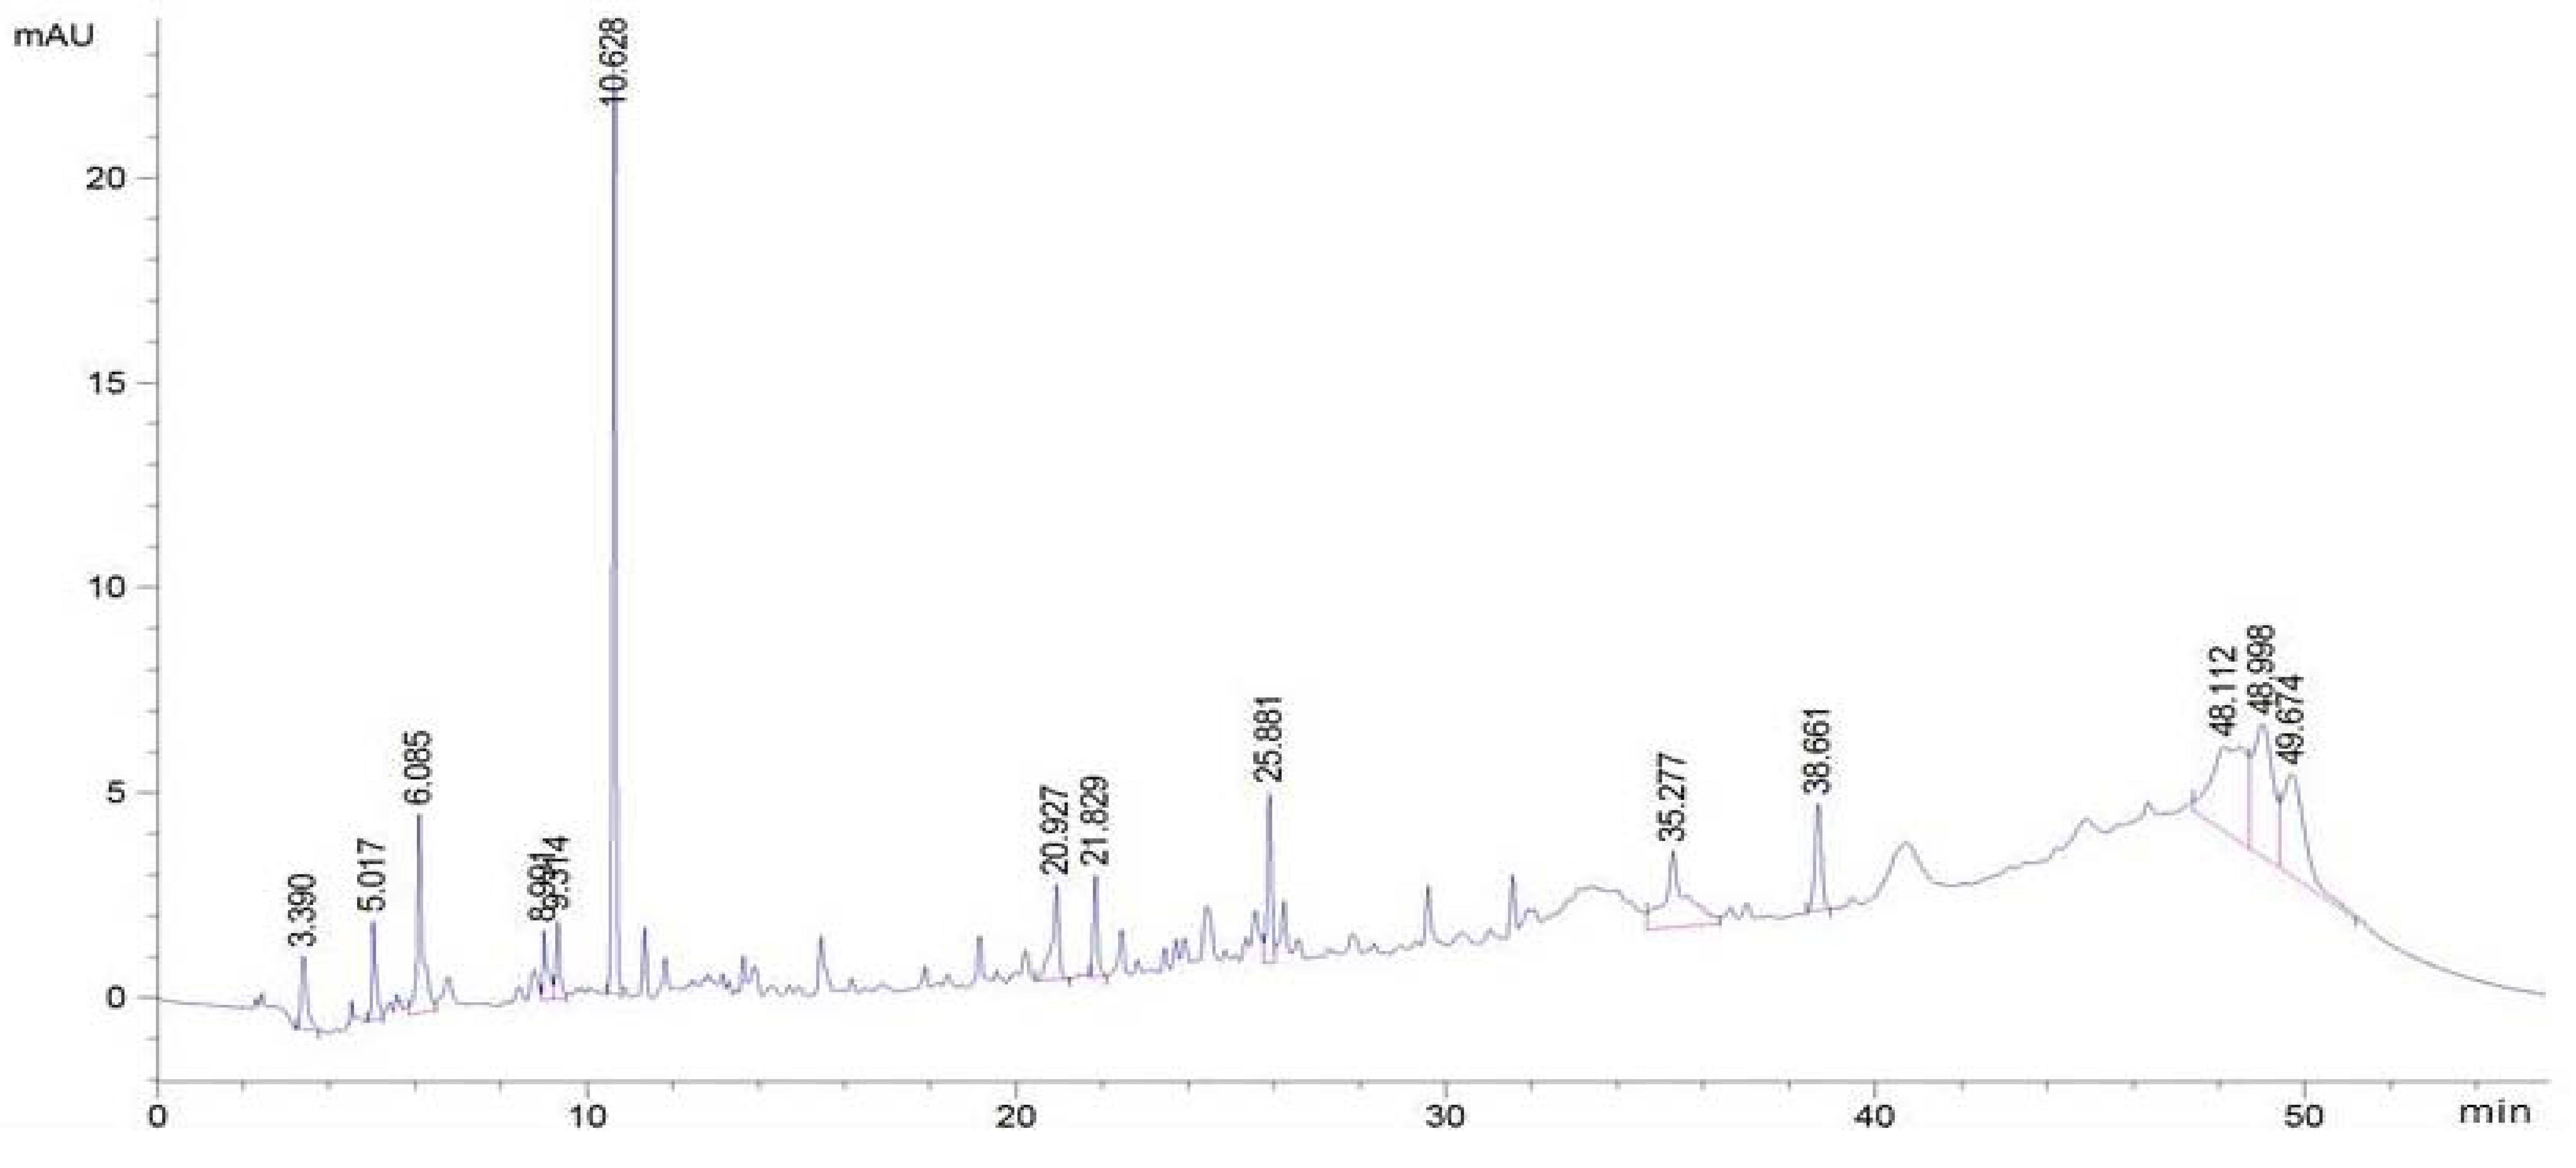
Various plants have been investigated to identify the presence of phenolic compounds using HPLC methods. The determination of phenolic compounds in the plant extracts helps to characterize them and to recognize their efficient uses as important plant resources [
48]. The identification of phenolic compounds in extracts of
H. zenkeri was carried out in this study and the phenolic compounds profile of the leaves and bark extracts are presented in
Figure 12 and
Figure 13 while the level of each identified phenol is shown in
Table 2. The results demonstrated that the levels of phenolic molecules were higher in the bark than the leaves (
Table 2). Three groups of polyphenols have been identified in the two samples. These include caffeic acid, OH-tyrosol acid, and Rutin, which were higher in the bark than in the leaves. The bark also possesses Quercetin, 3,4-OH benzoic acid, Eugenol, and Apigenin in higher concentrations than are found in the leaves. This result may explain the higher antioxidants potential observed in the bark samples of EEH and EEE compared to those of the leaves samples of EFH and EFE. However numerous pics that characterized other compounds have not been identified this could explain the activities observed in the leaves.
Table 2.
Level of phenolic compounds in the different plant parts.
Table 2.
Level of phenolic compounds in the different plant parts.
| Standards Polyphenols Characteristics | H. zenkeri (Barks) | H. zenkeri (Leaves) |
|---|
| A (mUA) | Conc (mg/g DW) | A (mUA) | Conc (mg/g DW) |
|---|
| 3,4-OH Benzoic Acid | 46.54 ± 0.00 | 184 ± 0.00 | 0.00 ± 0.00 | 0.00 ± 0.00 |
| Apigenin | 96.31 ± 0.00 | 0.02 ± 0.00 | 0.00 ± 0.00 | 0.00 ± 0.00 |
| Caffeic Acid | 323.24 ± 0.00 | 6.06 ± 0.00 | 29.84 ± 0.00 | 0.56 ± 0.00 |
| Catechine | 132.8 ± 0.00 | 9.65 ± 0.00 | 0.00 ± 0.00 | 0.00 ± 0.00 |
| Eugenol | 52.9 ± 0.00 | 15.29 ± 0.00 | 0.00 ± 0.00 | 0.00 ± 0.00 |
| Gallic Acid | 25.15 ± 0.00 | 0.64 ± 0.00 | 0.00 ± 0.00 | 0.00 ± 0.00 |
| O-Coumaric Acid | 97.43 ± 0.00 | 3.01 ± 0.00 | 0.00 ± 0.00 | 0.00 ± 0.00 |
| OH-Tyrosol | 71.4 ± 0.00 | 6.60 ± 0.00 | 16.87 ± 0.00 | 1.56 ± 0.00 |
| P-Coumaric acid | 122.74 ± 0.00 | 2.40 ± 0.00 | 0.00 ± 0.00 | 0.00 ± 0.00 |
| Quercetin | 233.88 ± 0.00 | 21.97 ± 0.00 | 0.00 ± 0.00 | 0.00 ± 0.00 |
| Rutin | 131.5 ± 0.00 | 11.07 ± 0.00 | 22.9 ± 0.00 | 1.93 ± 0.00 |
| Syringic Acid | 85.5 ± 0.00 | 2.12 ± 0.00 | 0.00 ± 0.00 | 0.00 ± 0.00 |
| Theobromine | 94.73 ± 0.00 | 3.18 ± 0.00 | 0.00 ± 0.00 | 0.00 ± 0.00 |
| Tyrosol | 111.02 ± 0.00 | 6.49 ± 0.00 | 0.00 ± 0.00 | 0.00 ± 0.00 |
| Vanillic Acid | 148.93 ± 0.00 | 4.76 ± 0.00 | 0.00 ± 0.00 | 0.00 ± 0.00 |
Figure 12.
High performance liquid chromatography (HPLC) chromatograms of phenolic extracts from the leaves of H. zenkeri recorded at 280 nm (TR: 19.10: 3,4-OH benzoic acid; 33.49: apigenin; 25.67: caffeic acid; 23.48: catechine; 29.43: eugenol; 14.38; gallic acid; 25.11: O-coumaric; 21.91:OH-tyrosol; 30.52: P-coumaric acid. 42.19: quercetin; 29.45: rutin; 25.55: syringic acid; 17.35: theobromine; 21.77: tyrosol and 25.27: vanillic acid).
Figure 13.
HPLC chromatograms of phenolic extracts from the barks of H. zenkeri recorded at 280 nm (TR: 19.10: 3,4-OH benzoic acid; 33.49:apigenin; 25.67: caffeic acid; 23.48: catechine; 29.43: eugenol; 14.38; gallic acid; 25.11: O-coumaric; 21.91:OH-tyrosol; 30.52: P-coumaric acid. 42.19: quercetin; 29.45: rutin; 25.55: syringic acid; 17.35: theobromine; 21.77: tyrosol and 25.27: vanillic acid.).


