1. Introduction
International genomic studies are revealing a growing number of genomic aberrations and aberrant pathways that are postulated to be important in a wide range of human diseases including cancer. The number of candidate “cancer genes” emerging from these efforts is especially daunting. However, the definitive functions of these aberrant genes and pathways must be established by experimental manipulation in laboratory models. Manipulation of gene expression levels using inhibitory RNAs (RNAi) is a key technique for this purpose. Large-scale nucleic acid synthesis techniques now enable convenient and low cost synthesis of thousands of RNAis so that assessment of the effects of manipulating the expression levels of thousands of genes is possible. Initial efforts in RNAi screening in mammalian cells were accomplished using automated strategies in which the effects of RNAi knockdown were assessed in multiwell format (usually 96- or 384-well plates). This required substantial laboratory instrumentation and automation, while the costs of RNAi reagent libraries were high. A strategy to miniaturize this process was first suggested by Sabatini
et al. [
1] and subsequently demonstrated with both siRNAs and shRNAs [
2,
3,
4,
5] before fully developed by Rantala
et al. [
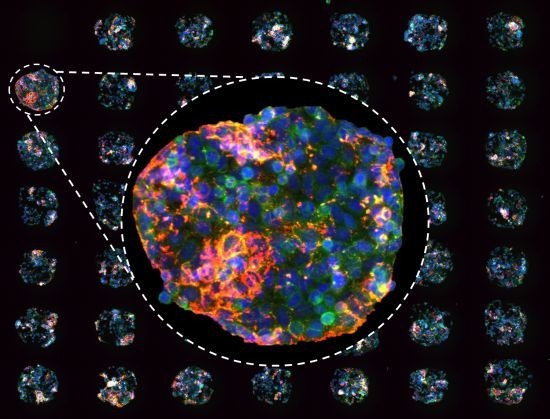
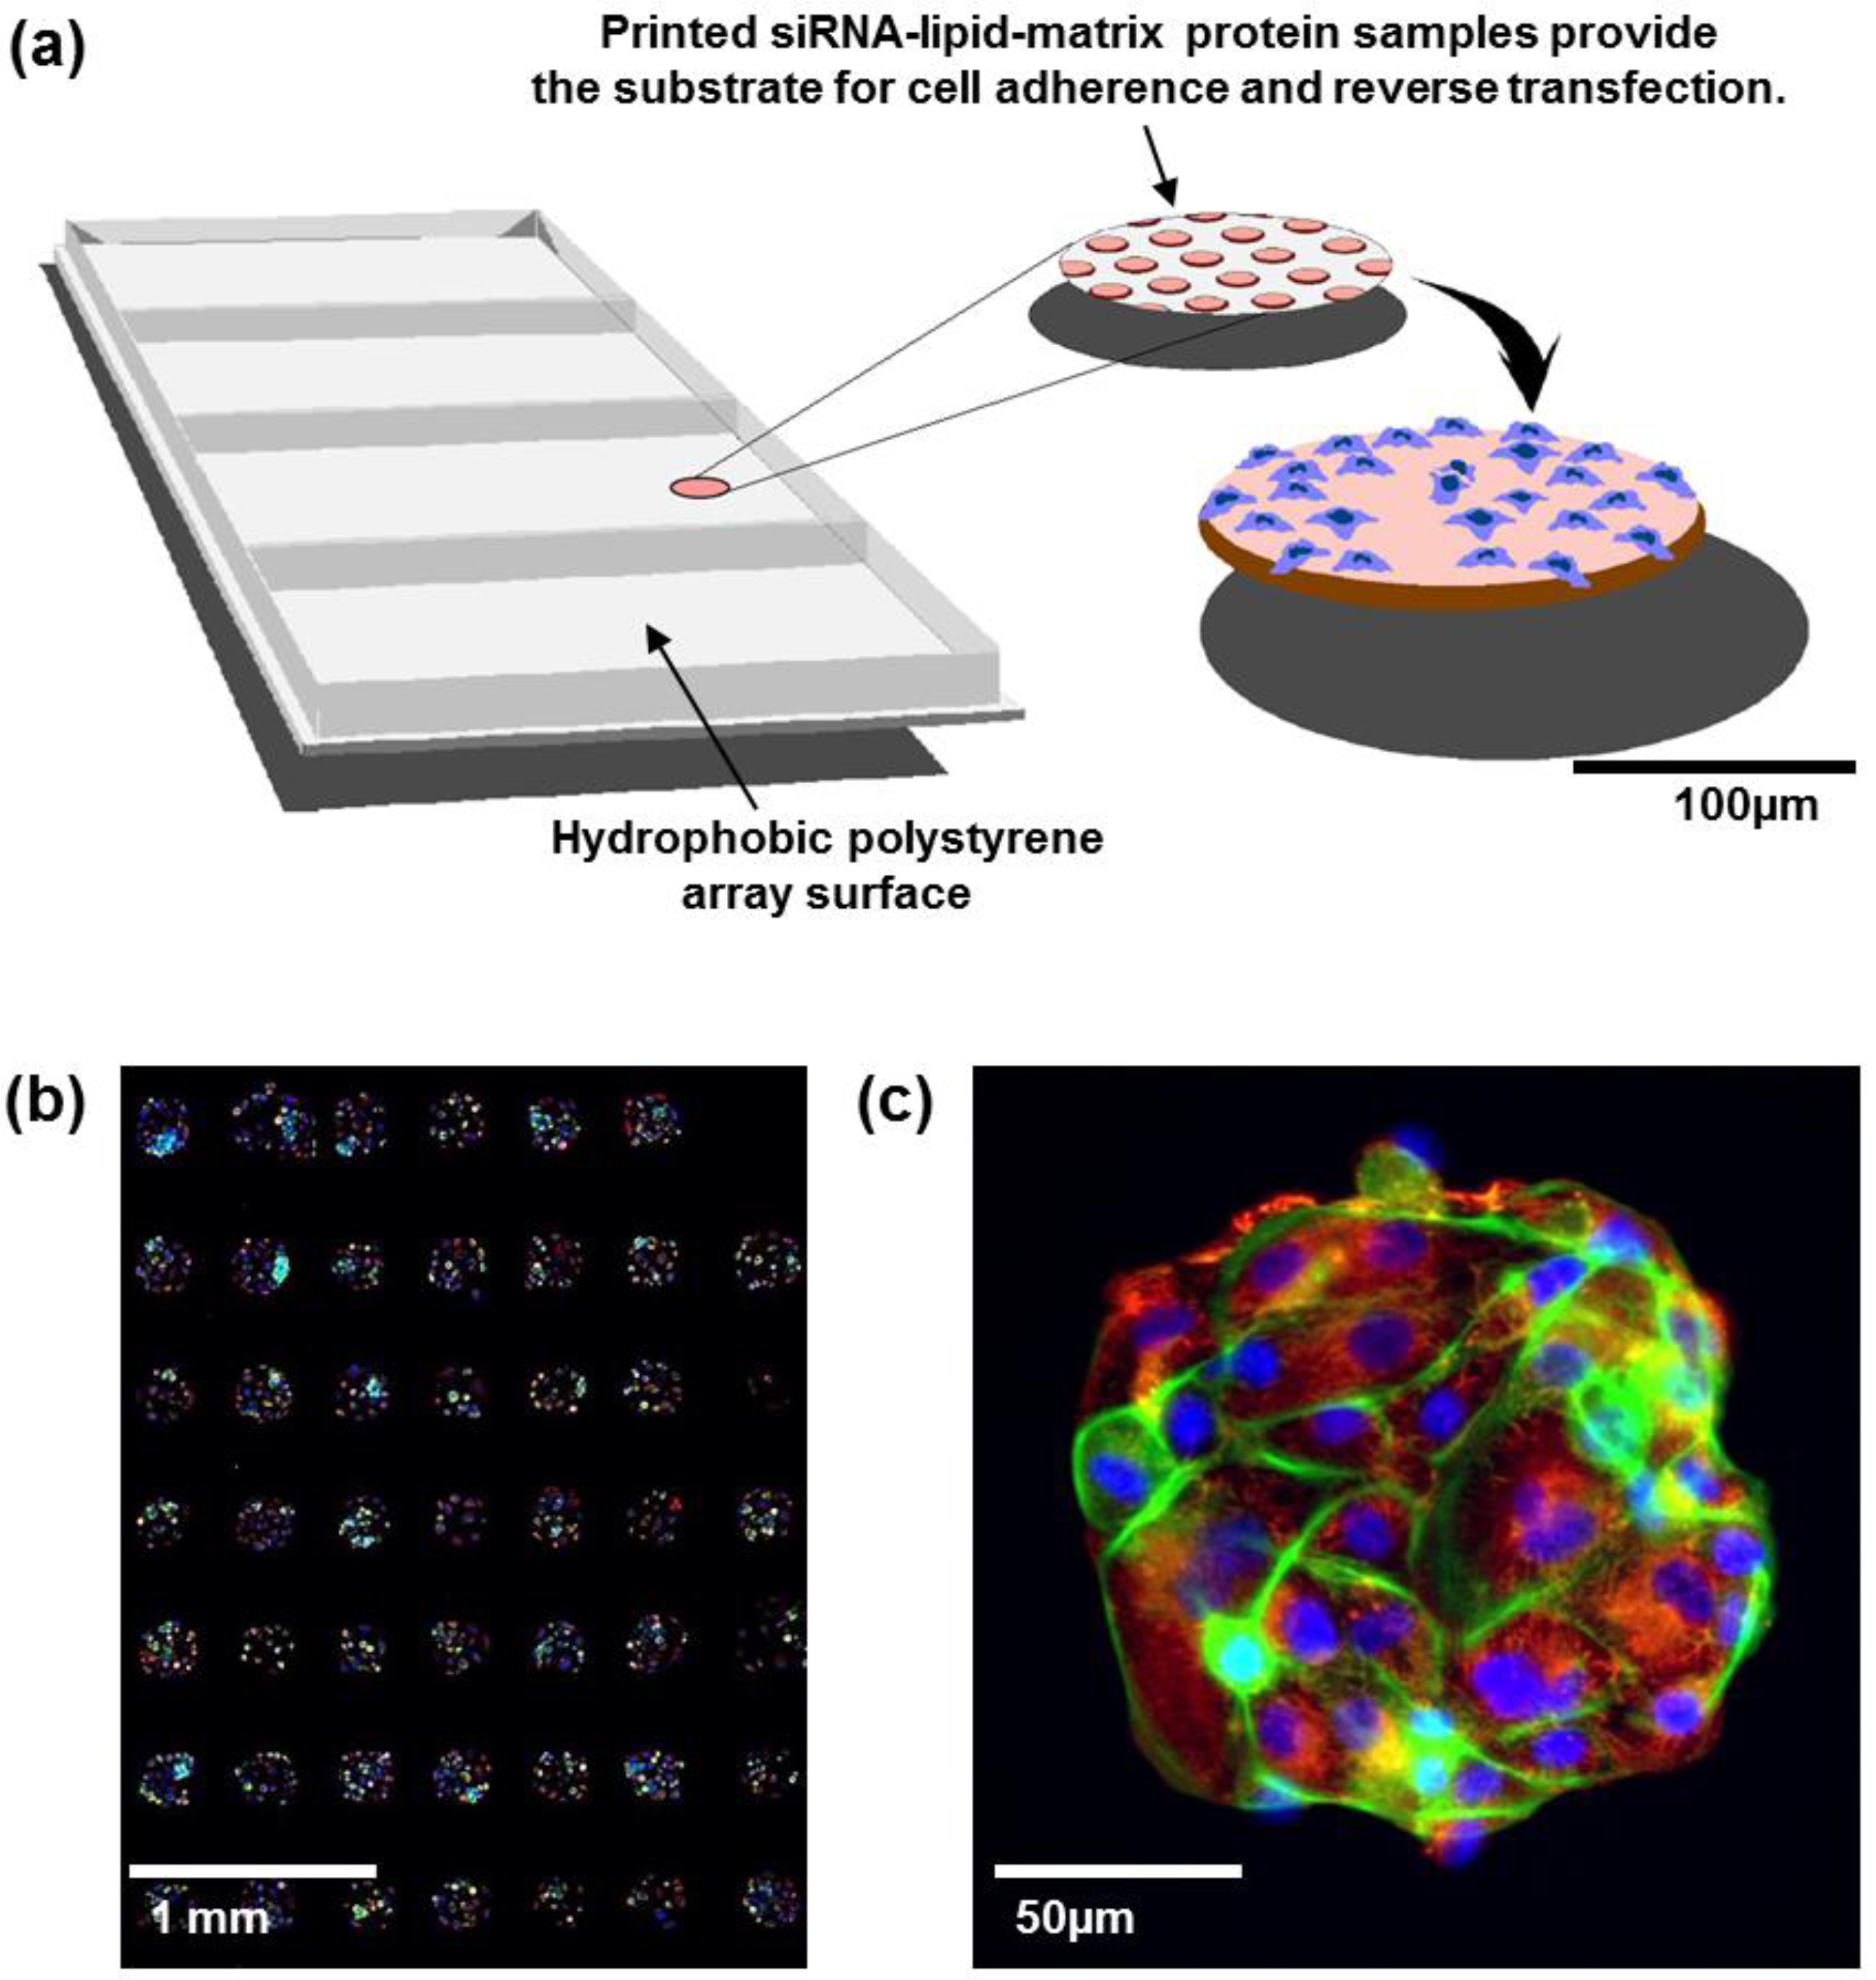
6]. In this process, individual RNAi oligonucleotides are printed in ~200 μm diameter spots separated by a few hundred micrometers (
Figure 1(a)). Each spot carries cell adherence promoting matrix proteins allowing spatially confined array patterning with cells growing only on the spots. Each spot can host up to a few hundred cells and contains a lipid transfection agent so that cells auto-transfect as they grow. This miniaturized platform provides an economical and robust alternative to multiwell screening systems for systematic assessment of gene function
in vitro. In a typical experiment, siRNA-lipid microarrays are covered with adherent cells in a culture medium for reverse transfection-mediated uptake of the siRNA [
6] or micro-RNA [
7] reagents from the spatially confined array spots. siRNAs usually are arrayed in triplicate in order to enable assessment of experimental reproducibility. Spot densities of ~1,000/cm
2 are routinely achieved on this platform so that responses to thousands of siRNAs can be robustly assessed in a single culture [
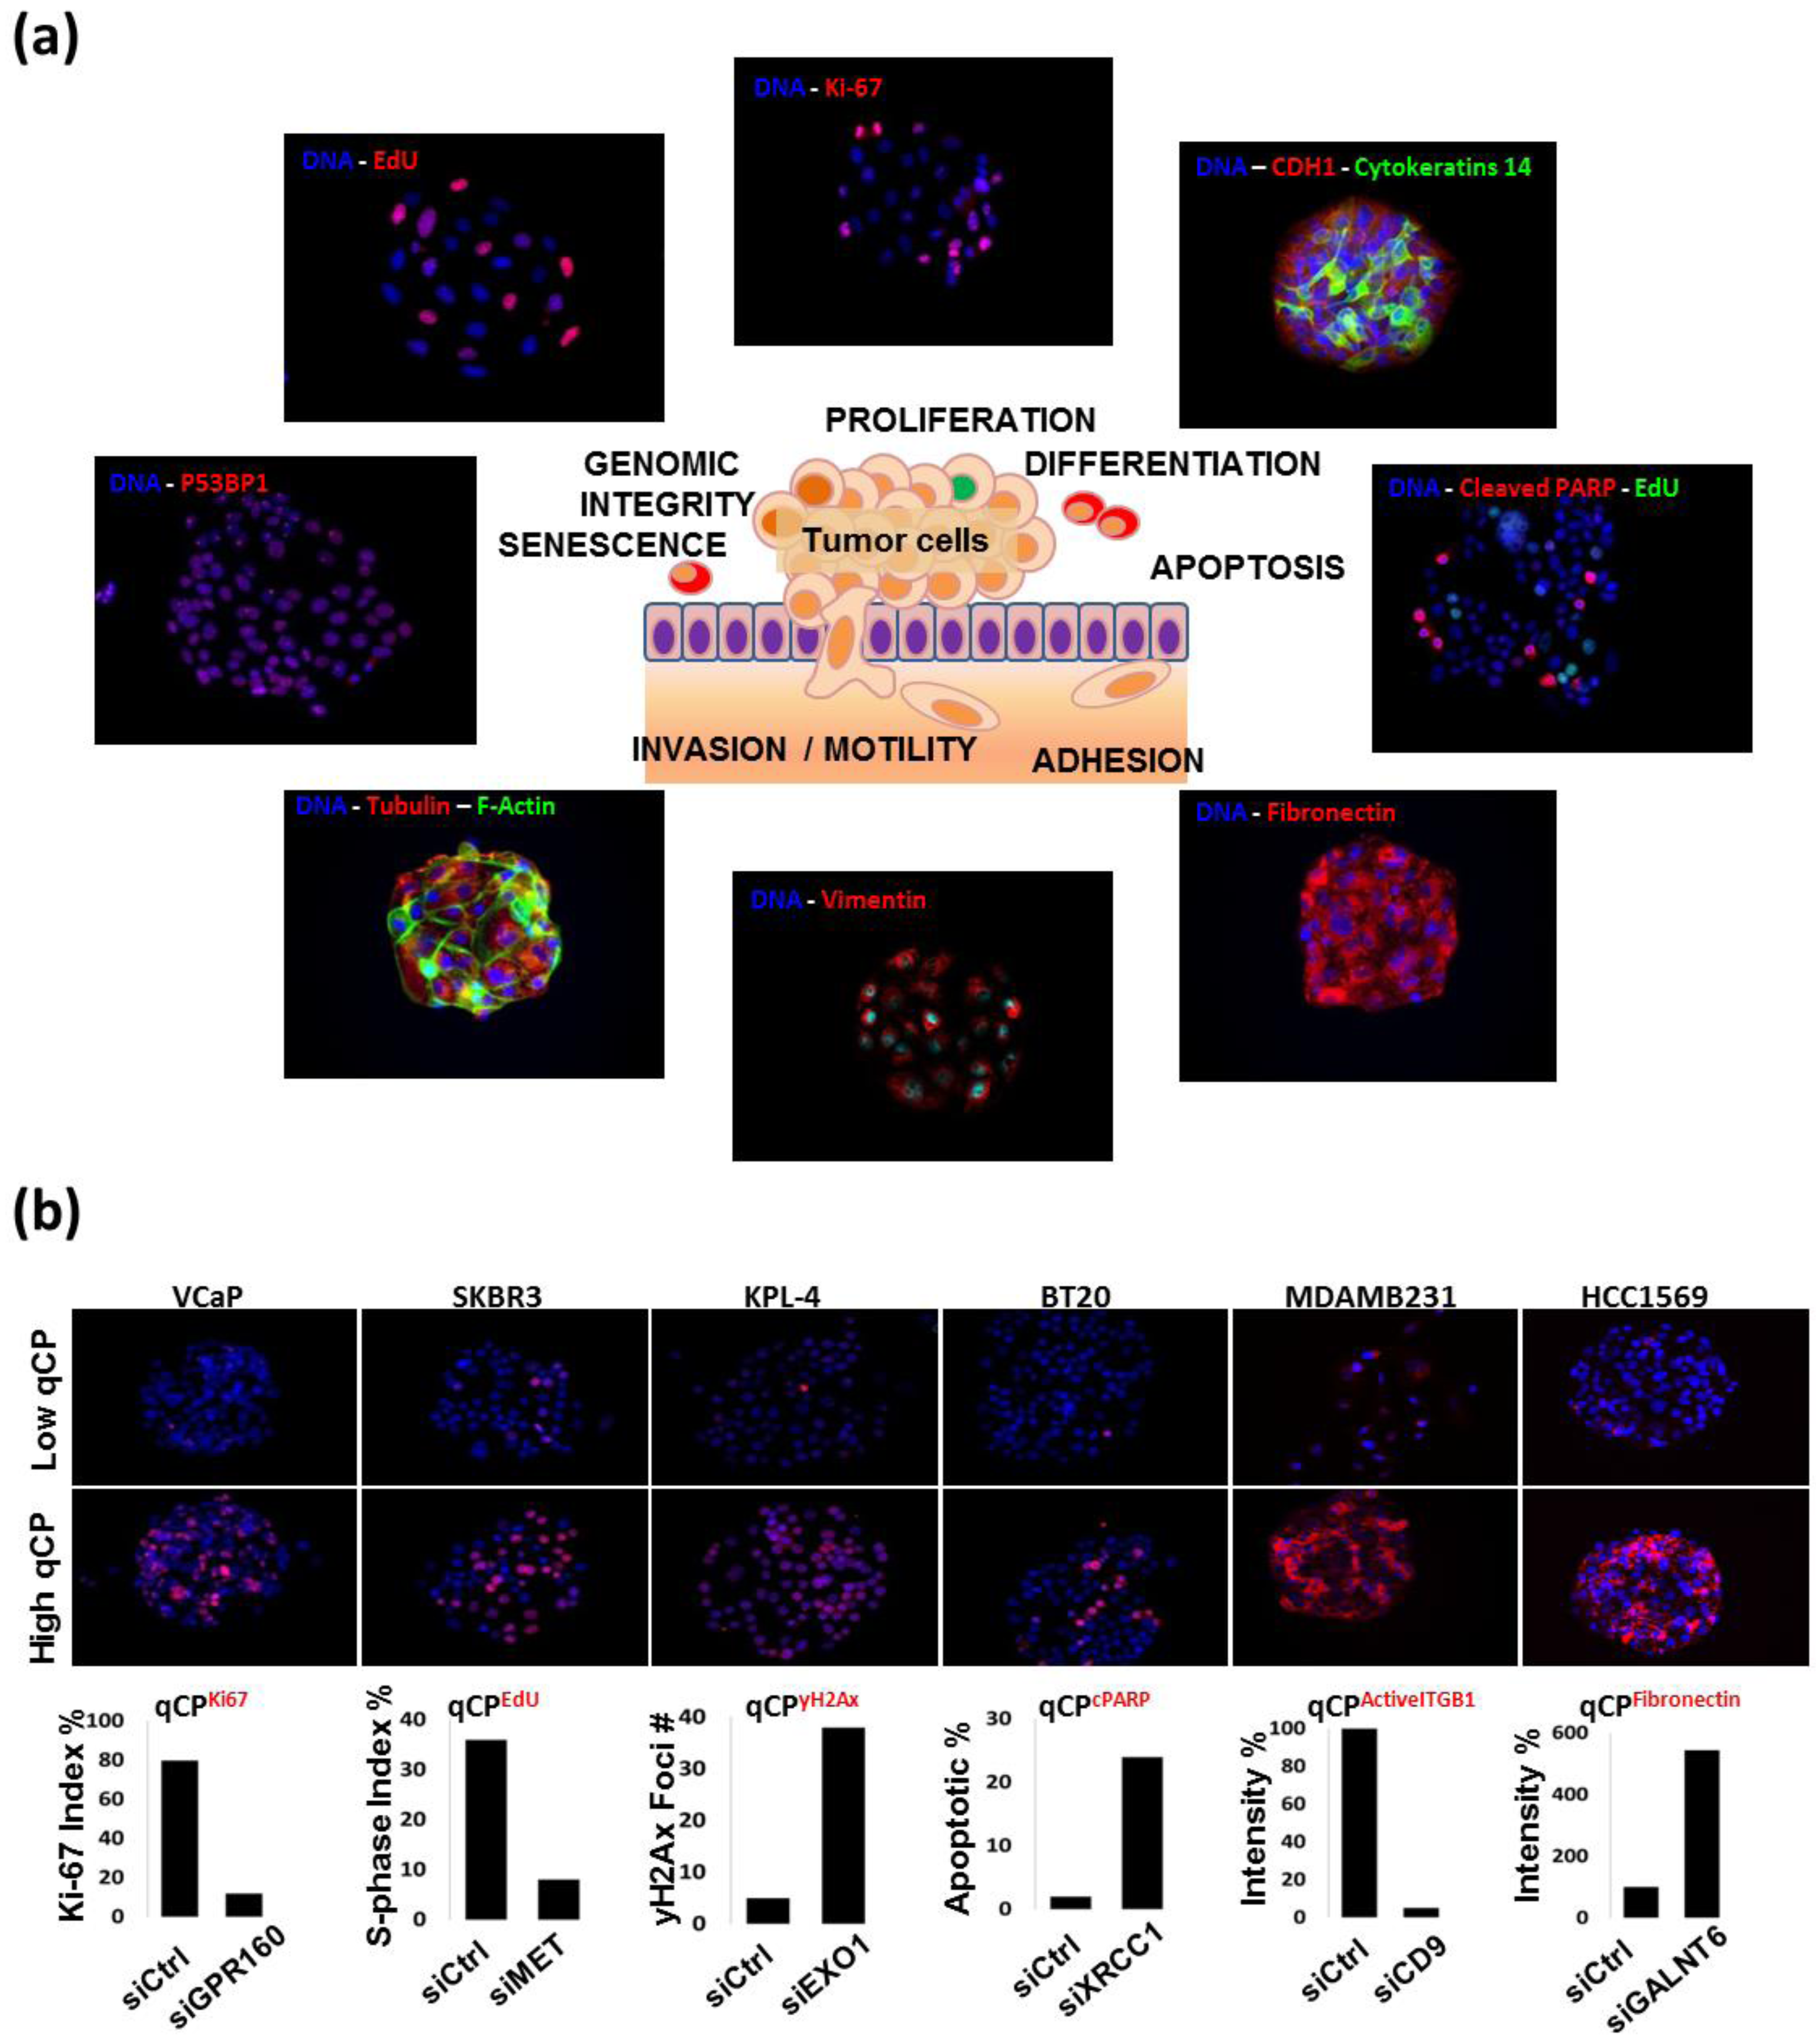
6]. The well-less and miniature format of the CSMA platform allows cells to be immunofluorescently stained for specific molecular response endpoints (e.g., molecular events associated with proliferation, apoptosis, differentiation status, senescence,
etc.) much as one would stain cells grown on a coverslip (
Figure 1(b,c)). Alternately, cells can be genetically engineered to express fluorescent response reporter constructs for time-resolved analyses [
6,
8].
The quantitative assessment of the impact of high-throughput RNAi knockdown on immunofluorescently stained molecular features—the subject of the present article—has already been applied in several cell biological studies, and the potential of the approach is only beginning to be realized. Early applications include analysis of the impact of specific RNAi-induced knockdowns on cellular abundance of protein complexes [
9], regulatory pathways [
10,
11], and changes in the spatial distribution of target proteins [
12]. We describe here experiments using siRNAs as RNAi reagents, but the platform appears readily extensible to assessment of effects of shRNAs [
13], miRNAs [
7] and cDNAs [
1]. The applications described herein illustrate how the CSMA platform can be used for efficient assessment of the roles that specific molecular entities or genomic aberrations play in many aspects of cancer pathophysiology. The ability to assess the impact of RNAi knockdown on endpoints such as differentiation, DNA repair activity, senescence and motility is a particular strength of the platform. The advantages of the platform relative to multiwell analysis approaches are the high analysis density which allows detailed analyses of responses to thousands of RNAis at low immunochemical reagent and cell culture cost and relatively high analysis speed. The disadvantages of the platform are the relatively small numbers of cells interrogated on each spot and the possibility that cells on one spot may be affected by a small amount of molecule secretion from cells on adjacent spots. Printing replicate spots to increase the number of cells analyzed can mitigate the former disadvantage and the latter can be mitigated by randomly positioning replicate spots across the culture surface so that each replicate is in close proximity to a different collection of other RNAi-perturbed cell spots. A typical experiment in which each RNAi is printed in triplicate provides analyses of sufficient cells to enable detection of RNAi effects that differ from the control by less than 10%. RNAi against genes like AURKB, CDK1, INCENP, KIF11 and PLK1 for which responses are well established are usually included as positive controls [
6,
8,
14] to confirm that the RNAi transfection efficiency is high. This is especially important when working with cell types that have not been previously analyzed using the CSMA platform [
6].
The advantages of assessing RNAi-induced changes using image cytometry following immunofluorescence staining—whether in CSMAs or in multiwell cultures—are substantial compared to strategies that assess bulk changes in cell number or metabolic activity (e.g., using the CellTiterGlow or MTT assays; [
15]) or that identify RNAi effects following bulk transfection (e.g., by assessing loss of cells carrying specific RNAis). Specifically, imaging allows for the following: (a) Quantitative measurement of the cellular abundance of specific target molecules for which a fluorescence reporter can be developed. These studies take advantage of a growing number of antibodies, aptamers or other affinity ligands that bind with high affinity and specificity to proteins or post-translationally modified variants that comprise regulatory networks. The availability of fluorescent reporter constructs that level the expression levels of specific proteins further increases the information that can be obtained; (b) Assessment of the intracellular distributions of the proteins or organelles of interest. This enables assessment endpoints such as the number of discrete DNA repair foci (a measure of DNA repair activity), assessment of the fraction of cells incorporating EdU, mitochrondrial morphology and assessment of mitotic apparatus shape; (c) Analysis of molecular proximity through the use of Förster resonance energy transfer assays (FRET) or antibody-based proximity ligation assays (PLA); (d) Assessment of molecular response heterogeneity between the cells in a single cell spot—for example, induced by cell–cell proximity and/or transient differentiation; (e) Multiplex analysis of multiple molecular and biological response endpoints. For example, multicolor analysis allows assessment of how RNAi manipulation changes the relationship between molecular pathway components (e.g., PI3K and MAPK pathway activities), and biological endpoints such as EdU incorporation or cell cycle distribution, motility, differentiation status and cell death [
7,
10,
11,
16,
17]; (f) Assessment of the impact of RNAi knockdown on responses to chemical, biological or microenvironmental perturbations. The platform is especially useful in identifying genes and pathways that influence responses to anticancer agents.
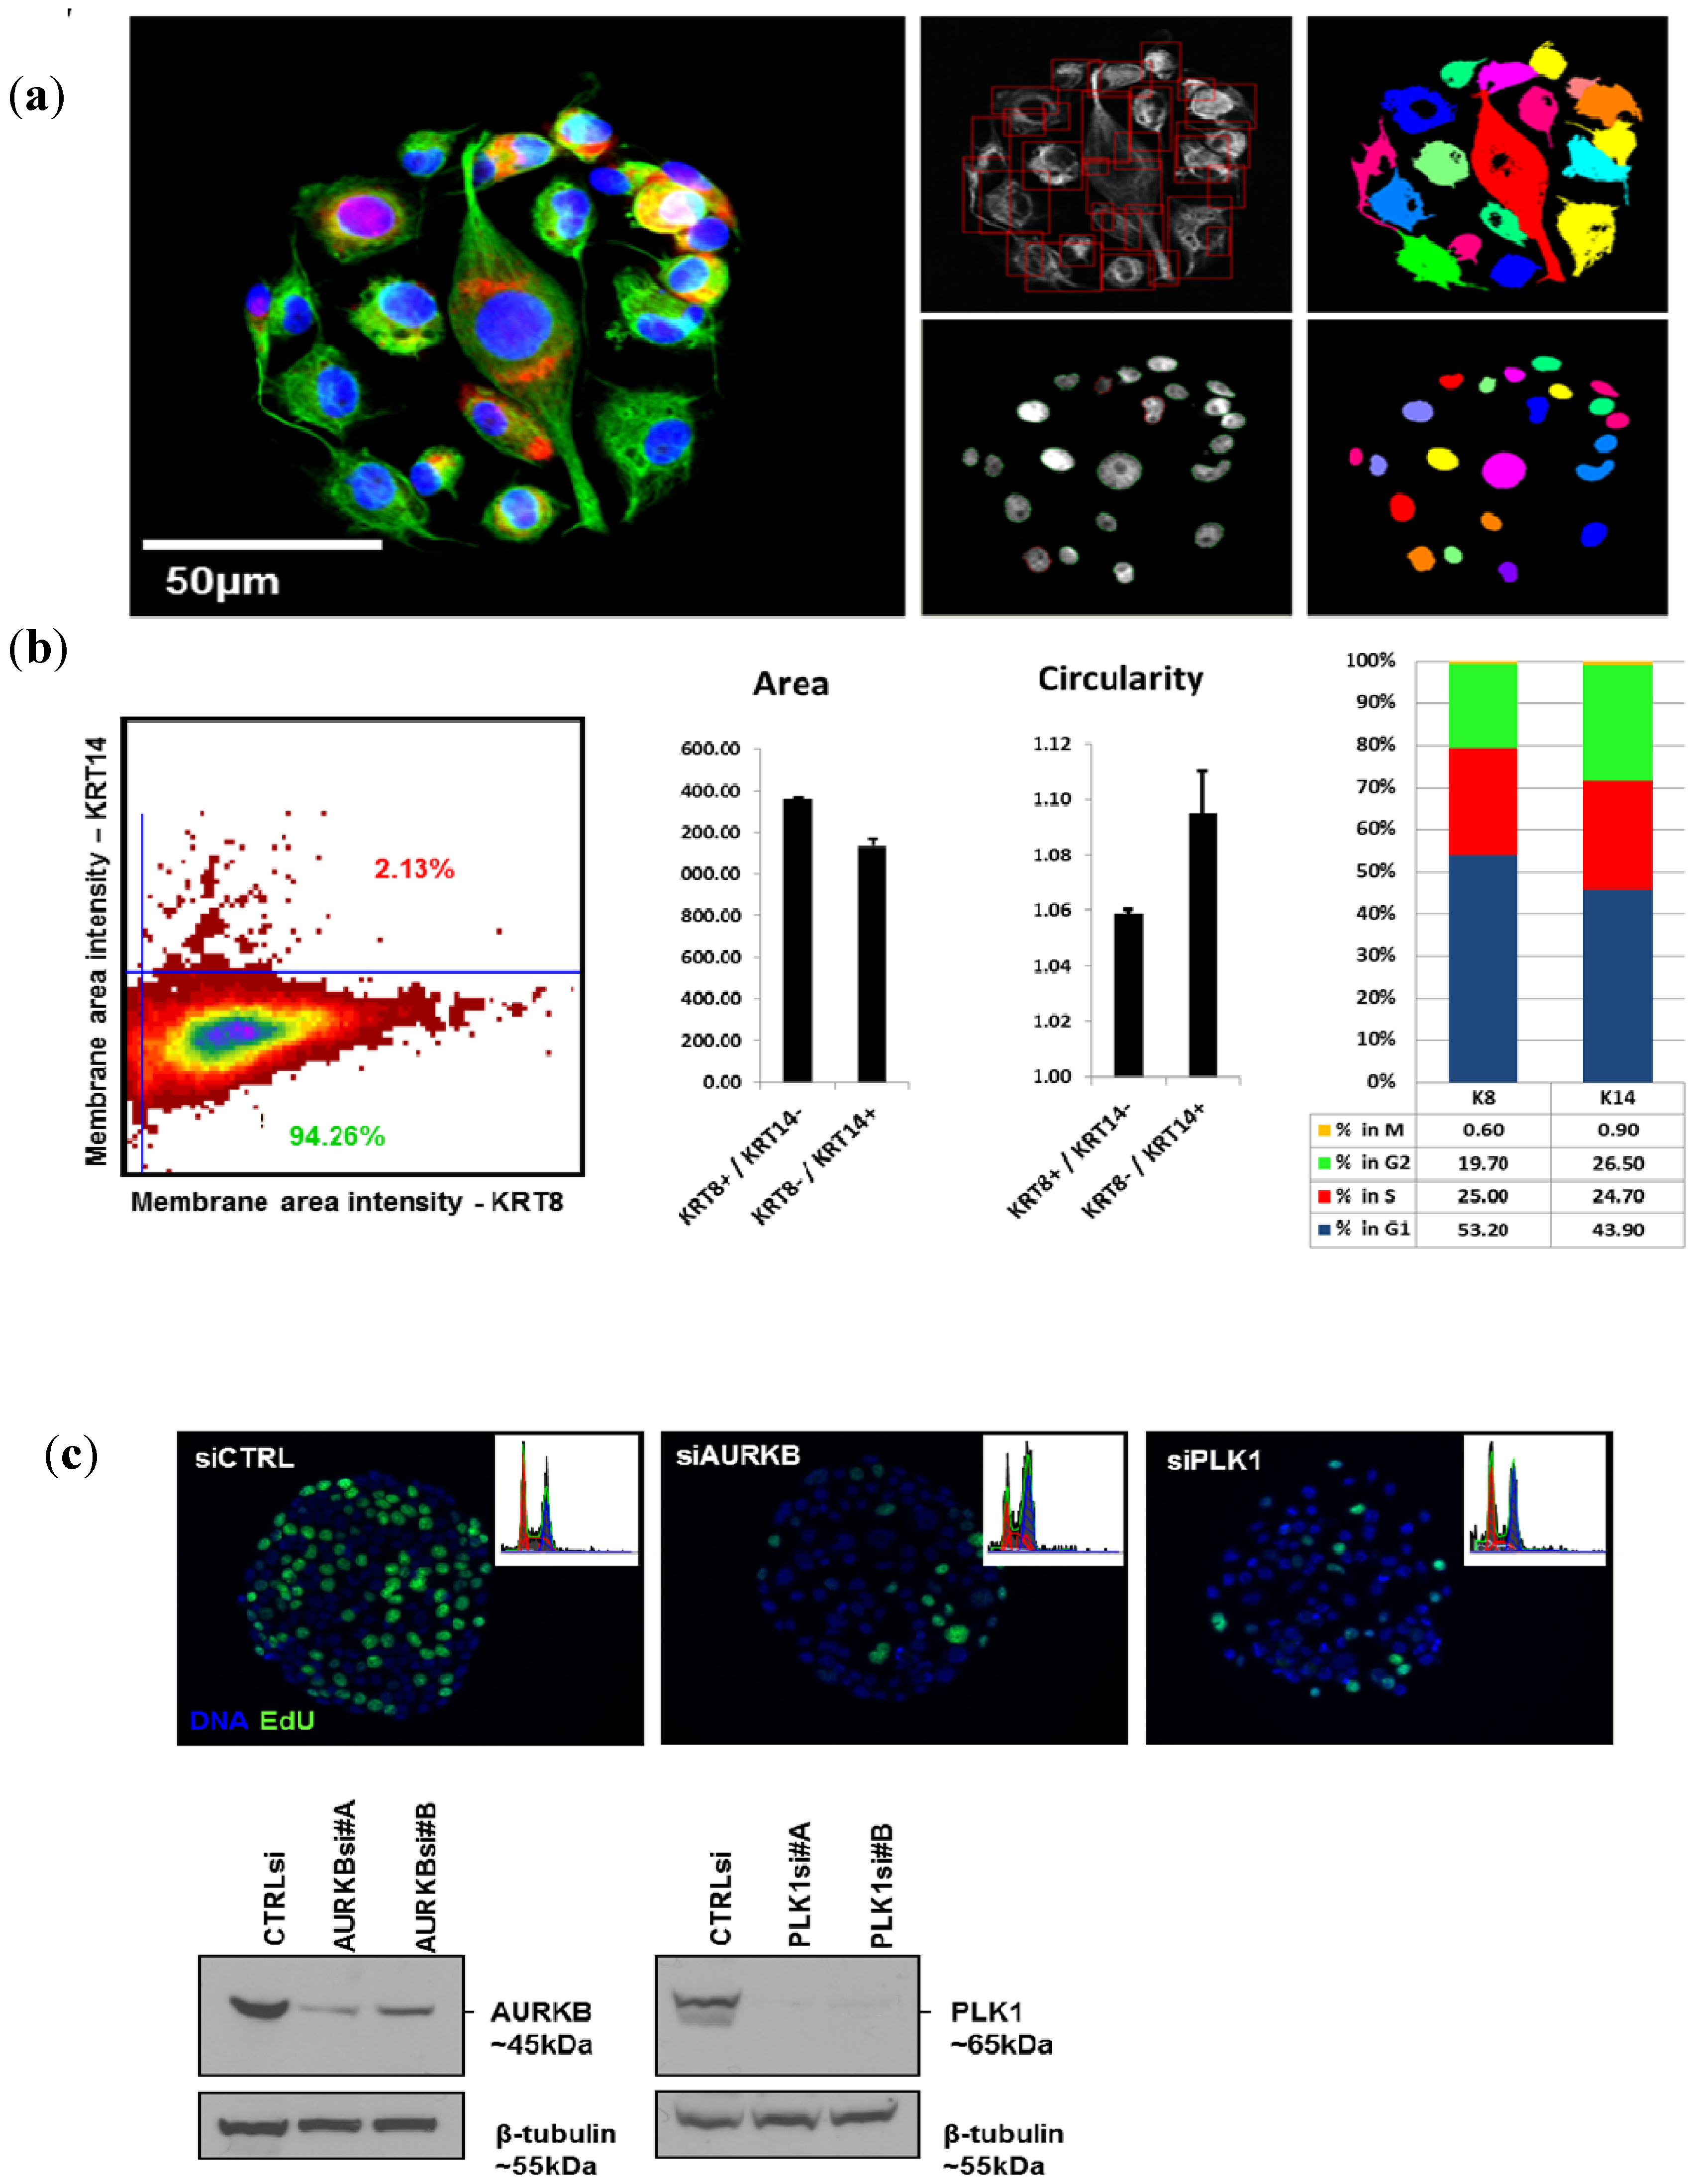
Figure 1.
(a) Cell spot microarrays (CSMAs) are produced by spotting siRNA samples mixed with transfection lipids and extra-cellular matrix proteins on a hydrophobic polystyrene surface in microplate sized vessels. This enables production of high density cell transfection microarrays with up to 1,000 siRNA samples/cm2. The slides are coated so that the cells adhere only to the spots containing the siRNAs. Transfer of the siRNAs to the cells occurs by reverse transfection during growth for a selected time, typically 48 to 72 h. (b) Multicolor image of immunofluorescently stained human kidney tumor cells following growth in CSMA format. The diameter of a cell spot is approximately 200 μm. (c) High resolution image of cells growing on one cell spot stained for DNA (blue), F-Actin (green) and beta-tubulin (red).
In the following sections, we describe fundamental aspects of image cytometry-based RNAi screening applications on CSMAs and review some of the basic methods. We also discuss in detail the custom assays established in our laboratory for analysis of quantitative cancer cell phenotypes. Finally, we conclude with an assessment of future developments of imaging-based RNAi analyses.
2. Experimental Section
2.1. Cells and Cell Culture
All cell lines grown on CSMAs were cultured according to the protocols recommended for the cell line. Primary kidney tumor cells were isolated from fresh patient surgical specimens obtained under an Institutional Review Board-approved protocol at Oregon Health and Science University (OHSU). These primary kidney cells, along with BT20, HCC1569, HCC1954, MDA-MB-468, U-2OS, KFr13, VCaP, and 22RV1 cells (ATCC, Manassos, VA, USA) were grown in RPMI-1640 (Gibco, Life Technologies, Grand Island, NY, USA) supplemented with 10% FBS, 10 µg/mL penicillin and streptomycin and 2 mM l-glutamine. HaCat, MFC7 and MDA-MB-231 cells were grown in DMEM (Gibco) supplemented with 10% FBS, 10 µg/mL penicillin and streptomycin and 2 mM L-glutamine. RWPE-1 (ATCC) cells were grown in Keratinocyte Serum Free Medium (K-SFM, Gibco) supplemented with 0.05 mg/mL BPE (bovine pituitary extract) and 5 ng/mL EGF. SKBR3 cells (ATCC) were grown in McCoy’s 5A medium (Gibco) supplemented with 10% FBS, 10 µg/mL penicillin and streptomycin, and 2 mM l-glutamine.
2.2. Preparation of Cell Spot Microarrays
Transfections with siRNAs and cell culture on the CSMAs were carried out as described previously [
6]. siRNAs against PLK1 and AURKB purchased from Qiagen as experimentally verified oligos were used for transfection validation experiments (PLK1 #A SI02223837, #B SI02223844; AURKB #A SI02622032, #B SI02622039). Briefly, the siRNAs and siLentFect (Bio-Rad) transfection reagent for array printing were prepared by mixing the lipid–siRNA samples with cold growth factor-reduced Matrigel (BD Biosciences, Bedford, MA, USA)—OptiMEM I (Gibco) solution resulting in final siRNA printing concentrations of 2.5 µM and 15% Matrigel. These solutions were printed as 200 µm diameter spots on the bottom of the wells of polystyrene microplates (typically 4 to 8 wells per plate, Nunc Brand, Roskilde, Denmark). The siRNA–Matrigel spots were allowed to polymerize for 30 min at room temperature and then stored at room temperature, desiccated and protected from light [
6]. Arrays were stored for several weeks before use under these conditions. Approximately 2 × 10
6 cells in 4.5 mL of growth medium were added to each array well (4-well plates) and allowed to adhere at +37 °C for 5–15 min. Cells were dispersed with non-trypsin cell detachment reagent HyQtase (HyClone, South Logan, UT, USA) prior to seeding on the CSMAs since this dispersal method enabled rapid adhesion to the array spots. Non-adherent cells were washed off and 4.5 mL of fresh medium was added per array well. siRNA transfer to the adherent cells took place during growth periods ranging from 48 to 144 h prior to staining and imaging.
2.3. Antibody Staining Procedure
Cells transfected with siRNAs during growth on CSMAs were immunofluorescently stained according to the following protocol. First the culture medium was aspirated carefully from each array well and the cells were fixed with 2% paraformaldehyde (Sigma-Aldrich, St. Louis, MO, USA) in PBS for 15 min at room temperature. Cells were then rinsed once briefly with 50 mM NH4Cl to quench any remainder of the paraformaldehyde fixative and washed 5 min with PBS. Cells were permeabilized with 0.3% Triton-X100 in PBS for 15 min at room temperature, washed once with PBS and blocked with 2% filtered BSA in PBS for 60 min at room temperature. After blocking, the arrays were washed 2 × 5 min with PBS, rinsed briefly with distilled H2O and air-dried. Array areas were inscribed with a hydrophobic border using a PAP-pen (Sigma-Aldrich) to reduce the amount of antibody used during staining. Cells were rinsed with 0.05% PBS-Tween 20 and stained with primary antibody in 2% BSA-PBS (100 μL per 20 × 20 mm array surface) for 1 h at room temperature or overnight at 4 °C. These arrays were washed 2 × 5 min with PBS and for 5 min with 0.05% PBS-Tween 20 and then stained with 100 μL of diluted Alexa fluorochrome-conjugated (Life Technologies) secondary antibodies. Secondary antibody incubation and parallel DAPI counterstaining was performed for 1 h at room temperature, followed by washing as described for primary antibodies. The stained arrays were then rinsed with distilled H2O, air-dried and stored for imaging. The cells were rehydrated for imaging by covering the arrays with PBS or by mounting under a coverslip using ProLong Gold anti-fade reagent (Life Technologies).
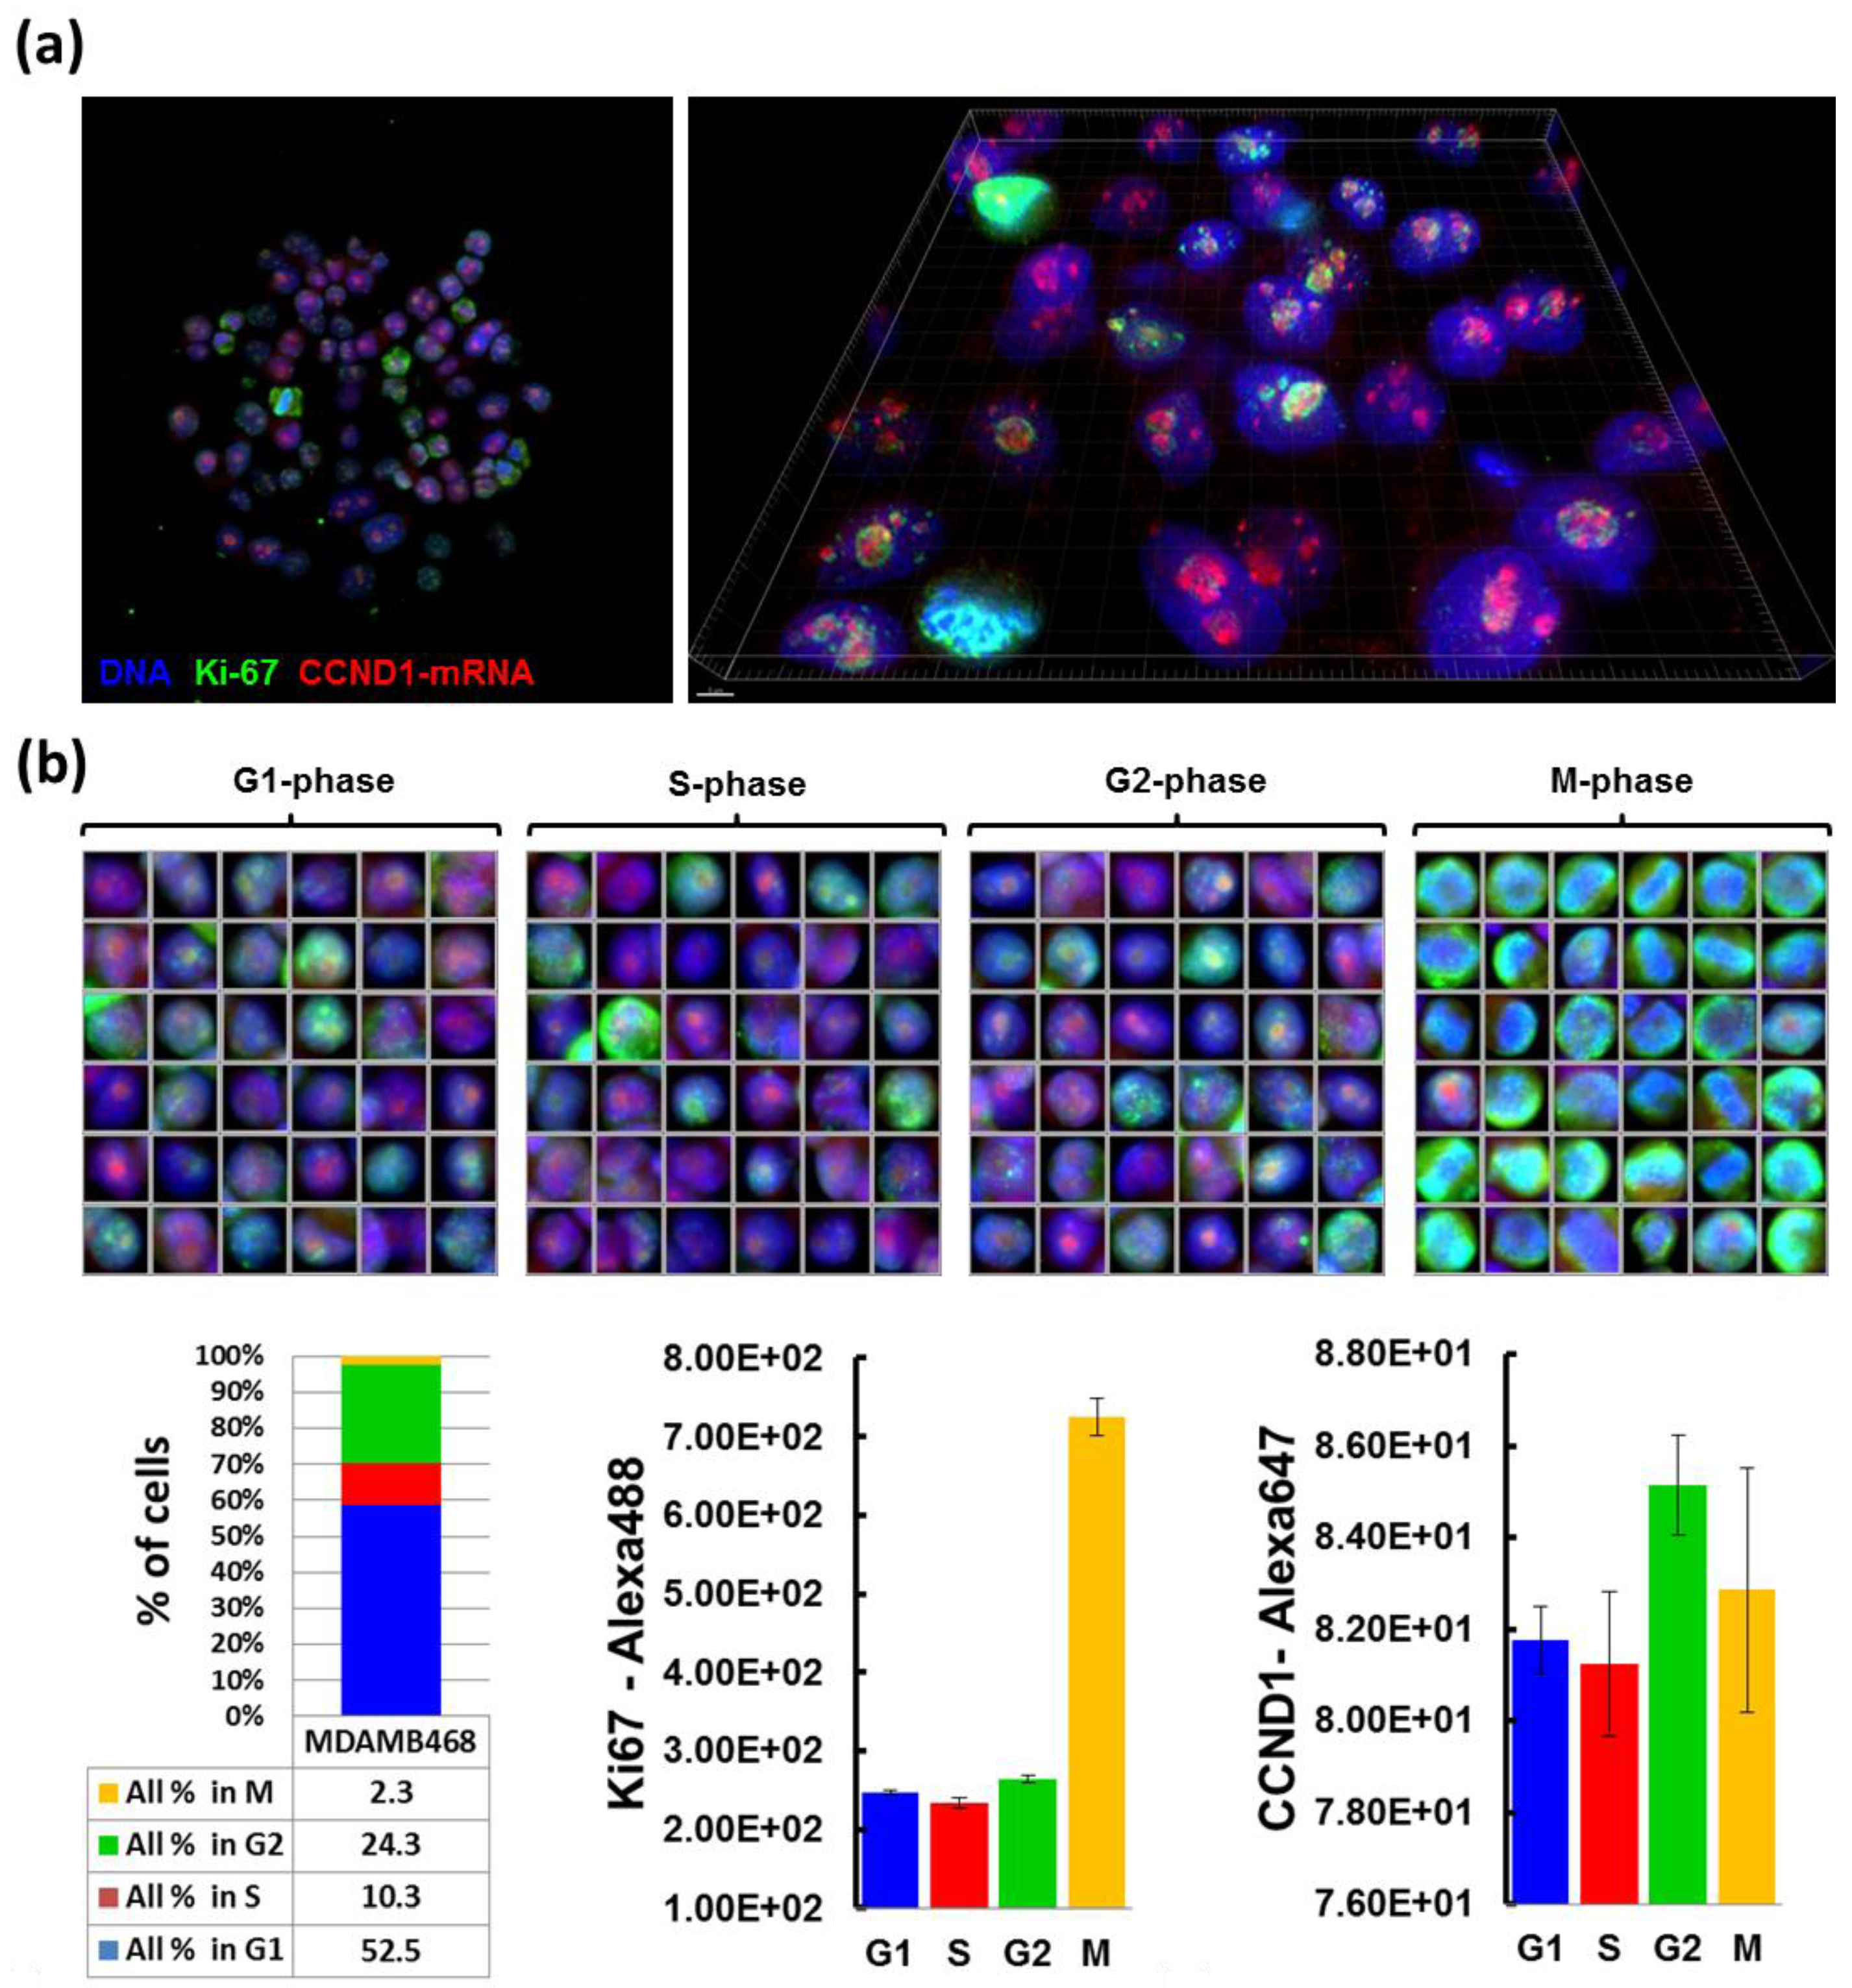
2.4. RNA Immuno-FISH Procedure
Cells grown on CSMAs were fixed in 4% formaldehyde in PBS for 10 min, permeabilized with 70% ethanol at 4 °C for 1 h, and prehybridized with wash buffer (2× SSC, 10% formamide) at room temperature for 10 min. Cells were then incubated in parallel with cyclin D1 antisense-oligonucleotide probe-sets labeled with Cy-5 and anti-Ki67 antibody (1:300, Abcam, Cambridge, MA, USA) in hybridization solution (10% Dextran sulfate, 2× SSC, 10% formamide) at 37 °C overnight in a dark/humid chamber, and incubated with wash buffer at 37 °C for 30 min twice. Secondary antibody incubation (Alexa488-conjugated goat anti-rabbit antibody in the hybridization solution) was carried out at room temperature for 1 h, followed by incubation with wash buffer for 30 min, with DAPI for nuclear staining, and with 2× SSC. Cells on arrays were mounted in Prolong Gold anti-fade reagent (Life Technologies). Probe sets for CCND1 mRNA detection were designed using a Stellaris™ Probe Designer version 1.0 [
18]. They were composed of 48 different 20 mer DNA oligonucleotides, each complementary to a different region of CCND1 mRNA, targeting sequences with 45% GC content, separating at least two bases between oligonucleotides. Images of 0.2 µm optical sections were acquired using Deltavision CoreDV Automated Widefield microscopy (Applied Precision™, 60× objective, NA = 1.42) with a Nikon Coolsnap ES2 HQ camera. These images were processed with deconvolution software to subtract blurred lights or to reassign them back to sources, and reconstructed into 3D image using IMARIS™ software (Bitplane, South Windsor, CT, USA).
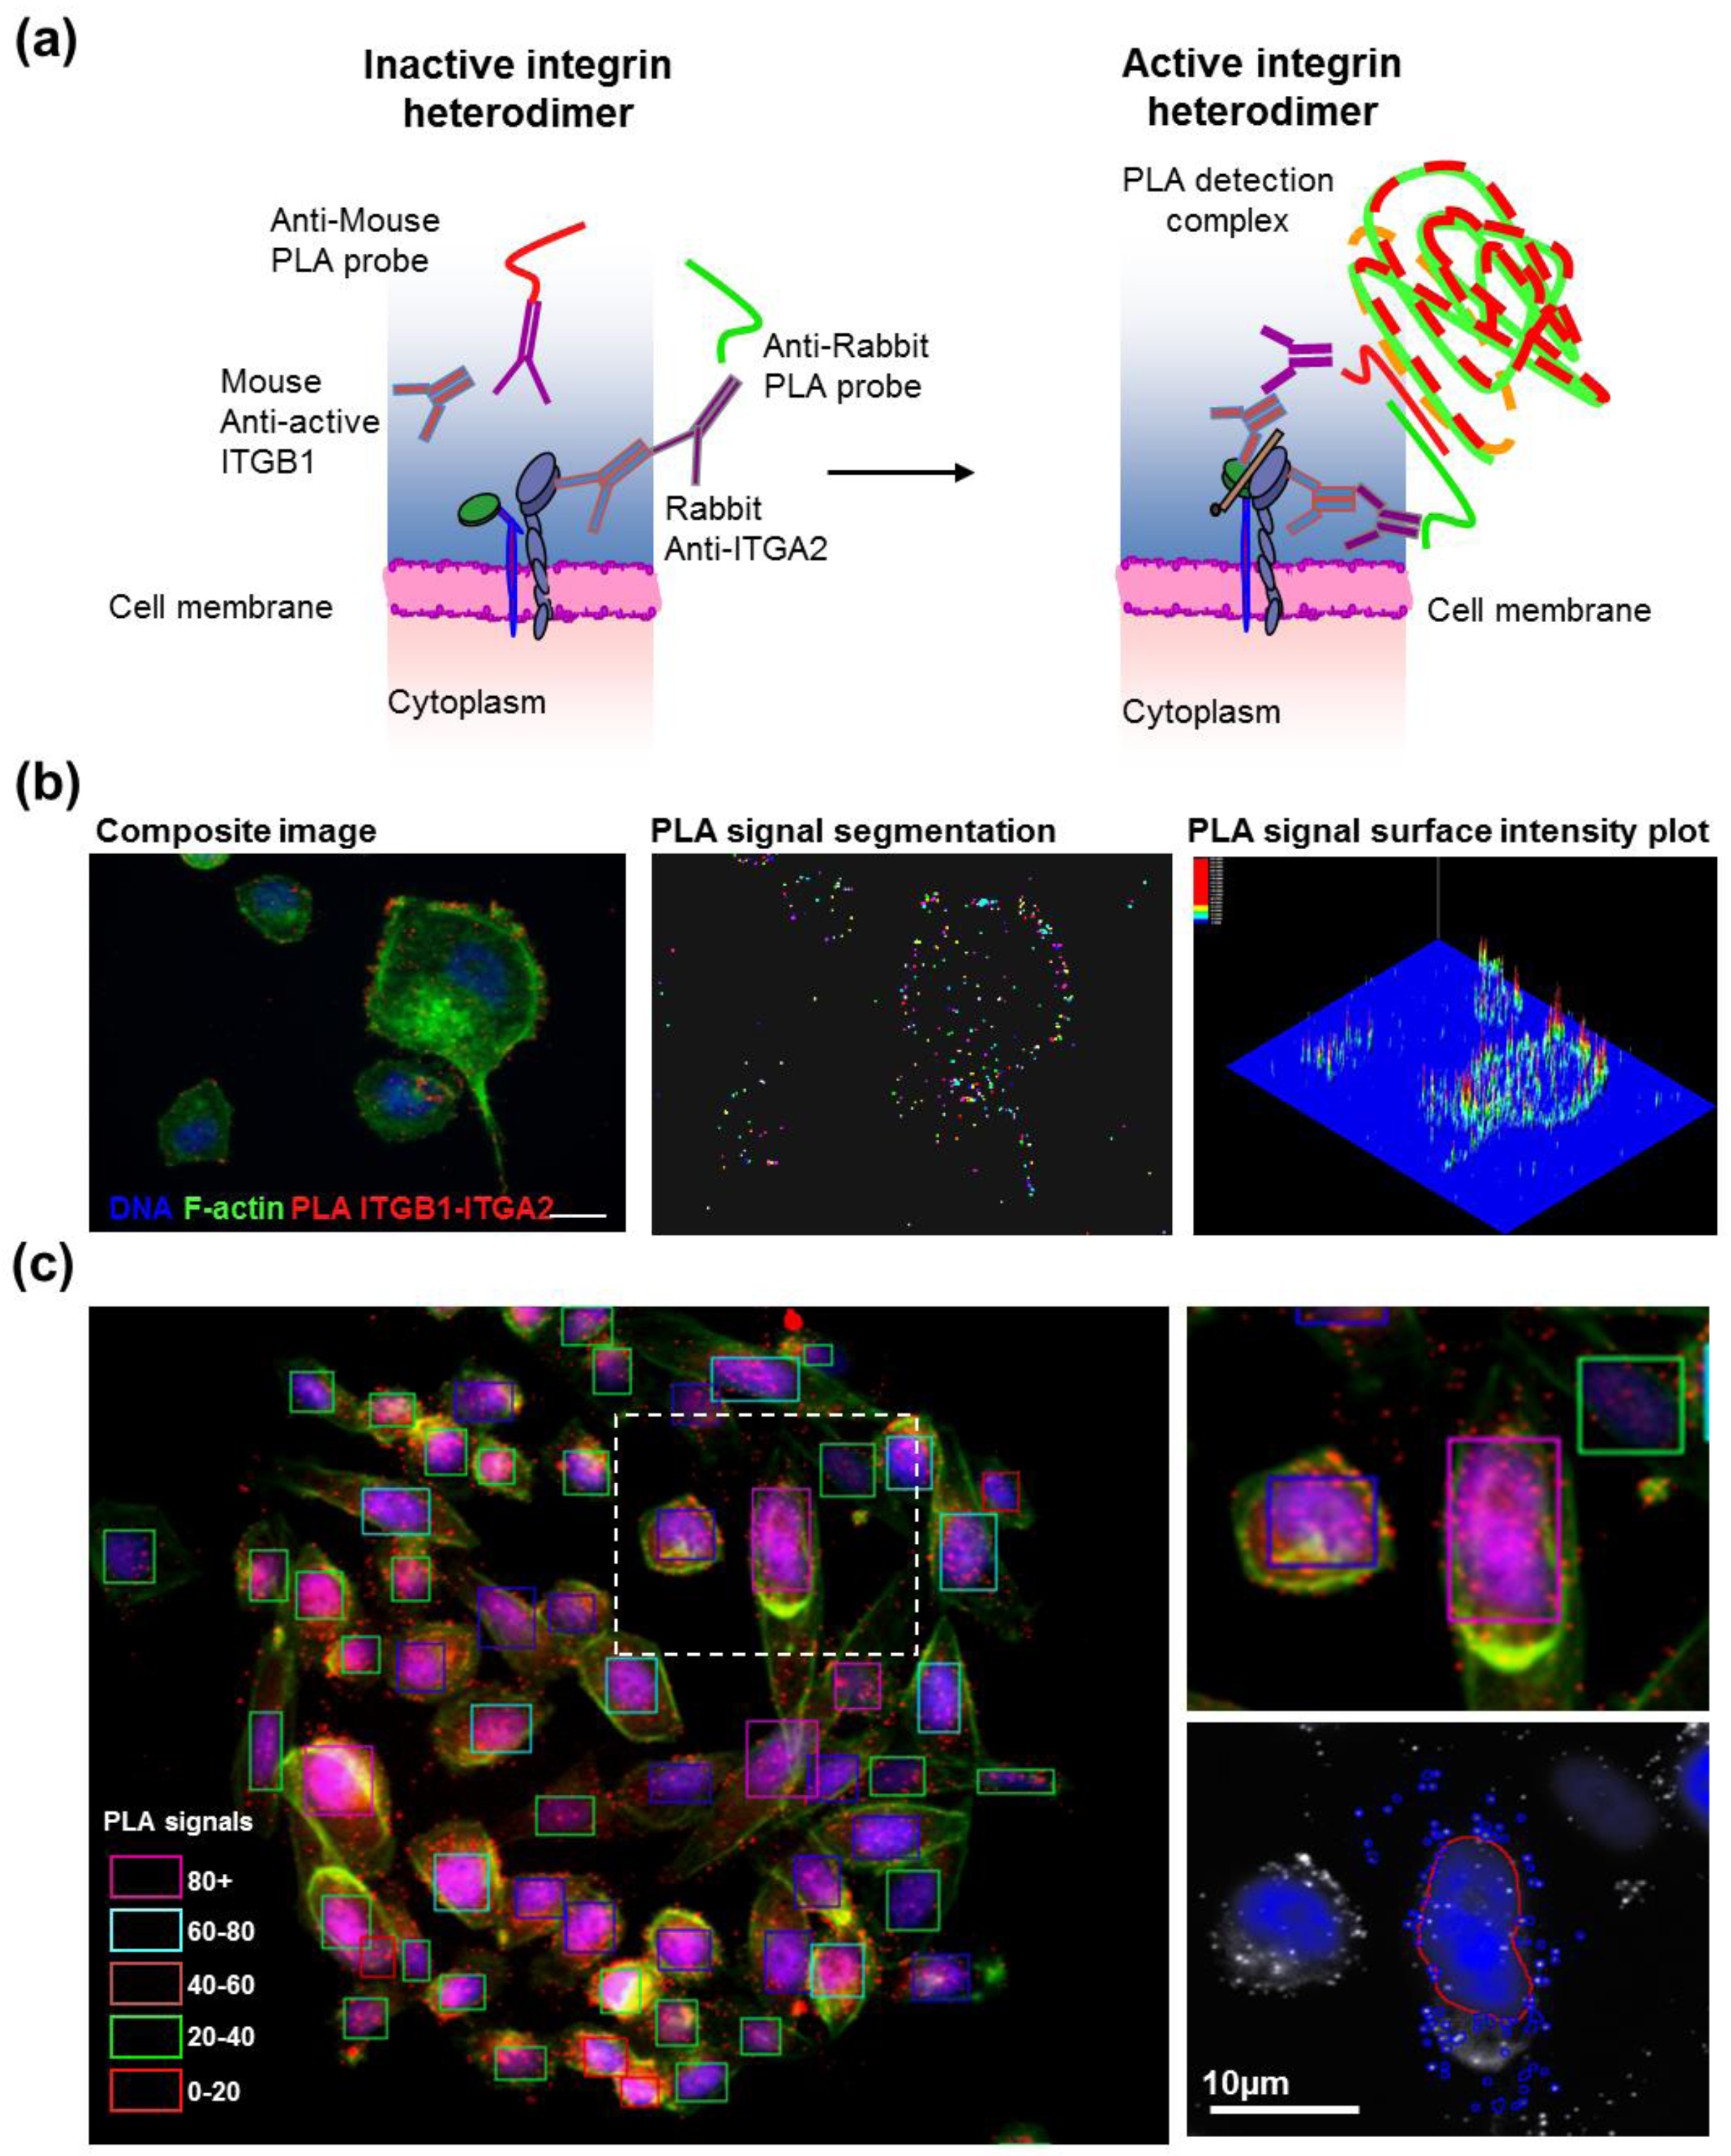
2.5. Antibody-Based Proximity Ligation Assay for in situ Protein–Protein Interaction Analysis
After transfection, cells grown on CSMA were fixed and stained according to the manufacturer instructions for the DuoLink II PLA kit (Olink, Uppsala, Sweden) with a minor change in PLA probe dilution. The primary antibodies were diluted 1:200 in 2% BSA-PBS and incubated overnight at 4 °C (ITGB1; Abcam 12G10, ITGA2; Millipore AB1936). The PLA probe antibodies were diluted 1:20 in 2% BSA-PBS supplemented with the PLA blocking concentrate and incubated for 2 h at 37 °C. The array surfaces were circumscribed with a hydrophobic border drawn with a PAP-pen (Sigma-Aldrich) to minimize antibody and PLA detection reagent consumption. Cells were counterstained for filamentous actin using fluorescently labeled phalloidin (Alexa488, Life Technologies) and DNA (DAPI). Images for each spot in the CSMAs were acquired automatically using an Olympus scan^R imager and image analysis software (Olympus-SIS, Münster, Germany) was used to quantify PLA levels in individual cells.
2.6. Western Blot Analysis
Western blot analysis of total cell lysates prepared from cells transfected on CSMAs with 384 replicate spots of a single control or targeting siRNA were fractionated on SDS-polyacrylamide gels and transferred to nitrocellulose membranes (Whatman Inc., Kent, UK). The membranes were blocked against non-specific binding using 5% skim milk. Membranes were probed with primary antibodies (PLK1, Abcam; AURKB, Abcam) overnight at 4 °C. Equal loading was confirmed by probing the same filter with a specific antibody for β-tubulin or β-actin (1:5,000, Abcam). Signals were revealed with horseradish peroxidase-coupled secondary anti-mouse or anti-rabbit IgG antibodies (1:1,000; Sigma-Aldrich).
2.7. Imaging and Analysis
Array imaging was performed using an Olympus scan^R integrated imager and image analysis suite (Olympus-SIS, Münster, Germany) equipped with a Hamamatsu ORCA-R2 CCD digital camera (Hamamatsu Photonics K.K., Tokyo, Japan). The Olympus scan^R system is an inverted microscope designed for fully automated image acquisition of biological samples in high-density sample platforms such as CSMA plus image analysis algorithms for feature quantification. Each spot on a CSMA was imaged individually with a 20× LUCPLFLN NA 0.40 objective using specific filter sets for DAPI, Alexa488, Alexa568 and Alexa647 dyes (Semrock, Inc., Rochester, NY, USA). The scan^R image analysis software suite was also used for quantitative analysis of image features. Analysis capabilities included cell/particle counting, protein expression analysis with immunofluorescence quantitation, subcellular particle quantitation assays, cell cycle analysis, and protein localization and co-localization assays. Image features quantified for cell populations using the scan^R software were further analyzed using FCS Express 3.0 software (De Novo Software, Los Angeles, CA, USA). The effects of each siRNA knockdown on each specific response endpoint were assessed by comparing image parameters (e.g., total fluorescence intensity per cell, fraction of cells incorporating EdU or number of segmented spots per cell) with comparable image parameters measured for cells transfected with a non-targeting scrambled control siRNA.


