Testing a Microarray to Detect and Monitor Toxic Microalgae in Arcachon Bay in France

Abstract
:1. Introduction
2. Experimental Section
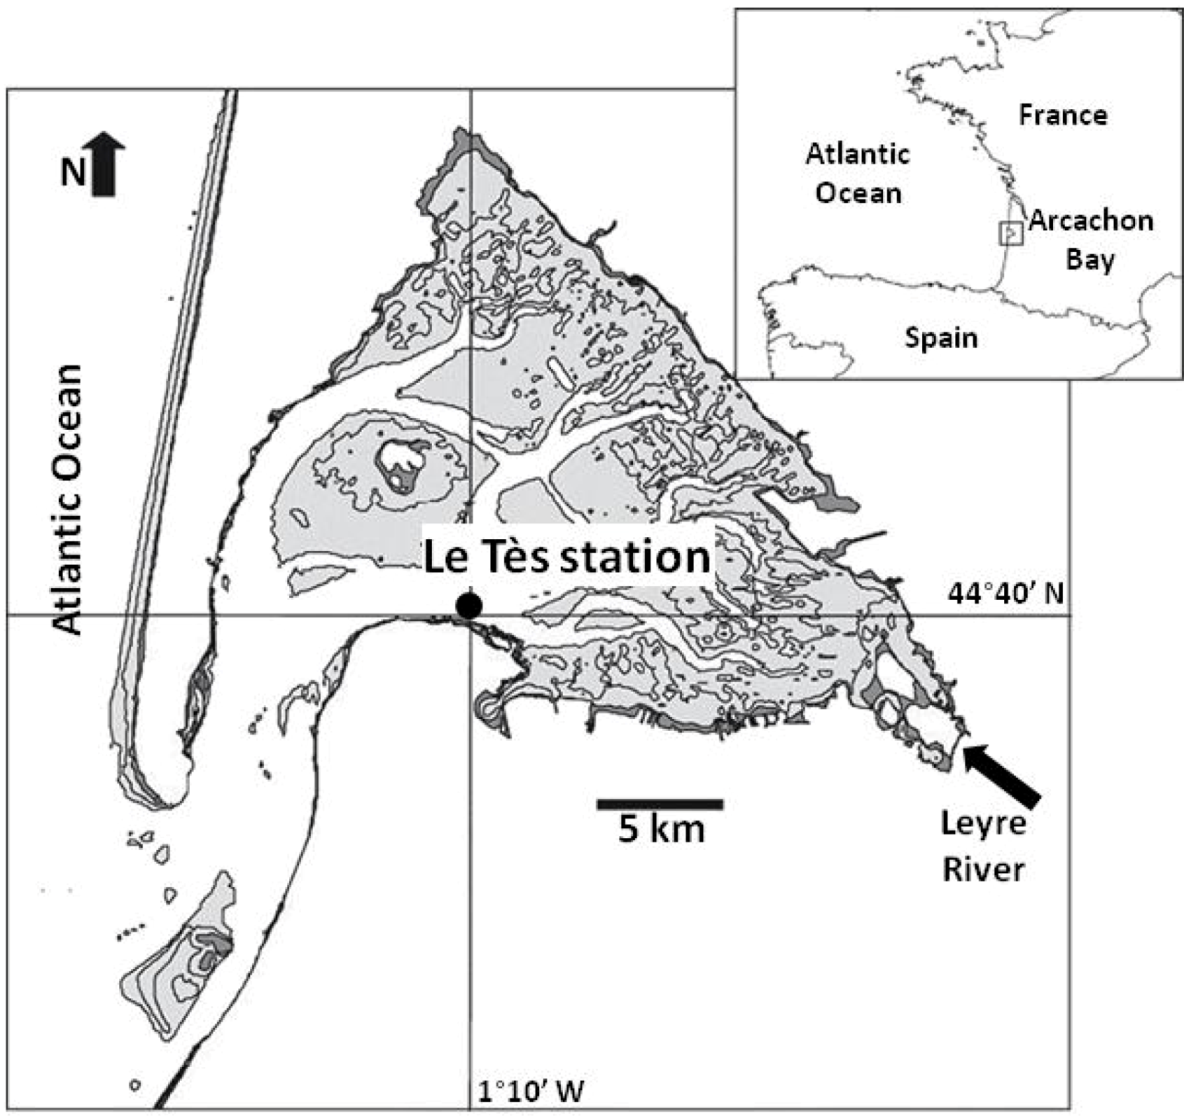
2.1. Field Sampling

| Sample name | Sample date | Volume filtered (L) | Total RNA extracted (µg) | DoL |
|---|---|---|---|---|
| 1A | 24/07/2011 | 3.3 | 7.46 | 2.2 |
| 2A | 08/08/2011 | 3.0 | 9.48 | 2.0 |
| 3A | 22/08/2011 | 3.3 | 9.52 | 1.9 |
| 4A | 04/10/2011 | 3.25 | 10.66 | 2.2 |
| 6A | 20/10/2011 | 3.3 | 13.82 | 2.2 |
2.2. RNA Extraction
2.3. RNA Labeling and Fragmentation
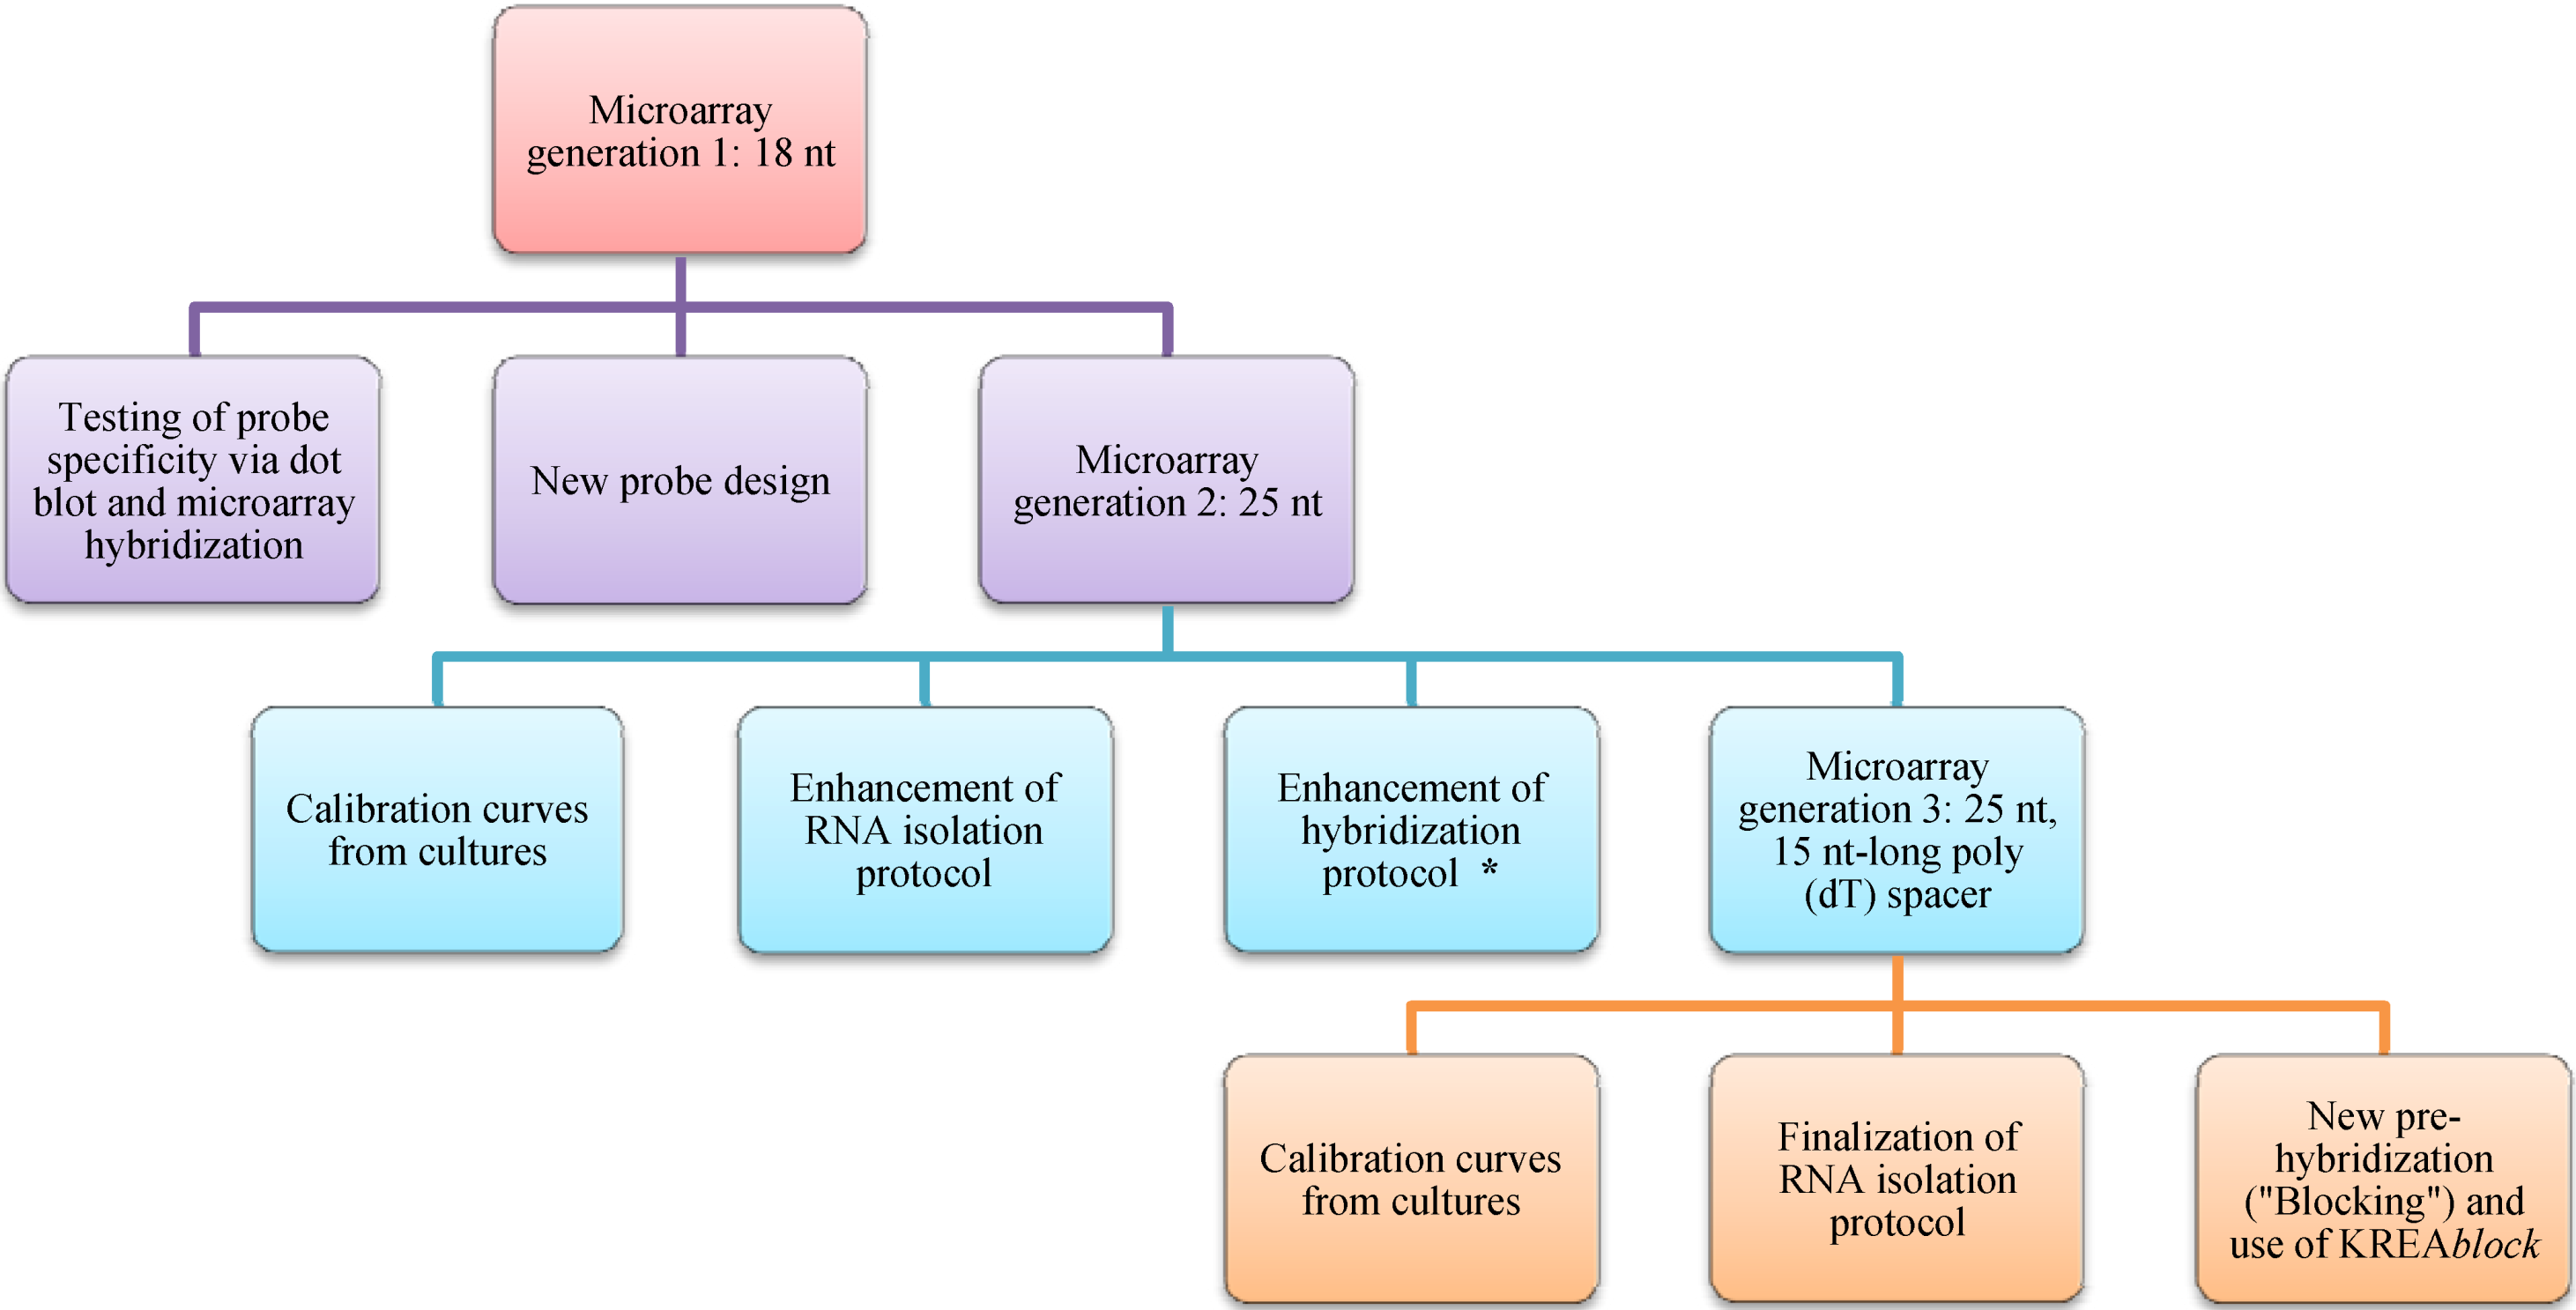
2.4. Microarray Design
| Probe Name | Targeted Taxon | Gene |
|---|---|---|
| Controls | ||
| DunGS02_25_dT | Dunaliella spp. | 18S |
| DunGS05_25_dT | Dunaliella spp. | 18S |
| Higher group-level probes | ||
| EukS_328_25_dT | Eukaryotes | 18S |
| EukS_1209_25_dT | Eukaryotes | 18S |
| HeteroS01_25_dT | Heterokonta | 18S |
| PrymS01_25_dT | Prymnesiophyta | 18S |
| Class-level probes | ||
| PrymS03_25_dT | Prymnesiophyceae | 18S |
| DinoB_25_dT | Dinophyceae (incl. Apicomplexa) | 18S |
| DinoE12_25_dT | Dinophyceae (incl. Apicomplexa) | 18S |
| Clade-level probes | ||
| DphyexacutaFS01_25_dT | Dinophysiaceae (Dinophysis + Phalacroma) | 18S |
| DphyFS02_25_dT | Dinophysiaceae (Dinophysis + Phalacroma) | 18S |
| PdeliD02_25_dT | P. delicatissima all clades | 28S |
| Clade 01new_25_dT | Prymnesium B1 clade | 18S |
| Clade01old_25_dT | Prymnesium | 18S |
| ProroPKD01_25_dT | Prorocentrum planktonic clade | 28S |
| ProroFPS01 | Prorocentrum planktonic clade | 18S |
| ProroFBS02_25_dT | Prorocentrum benthic clade | 18S |
| ProroFBS01 | Prorocentrum benthic clade | 18S |
| Genus-level probes | ||
| PsnGS01_25_dT | Pseudo-nitzschia | 18S |
| PsnGS02_25_dT | Pseudo-nitzschia + Fragilariopsis | 18S |
| PSN+FRAGS02-25new_dT | Pseudo-nitzschia + Fragilariopsis | 18S |
| PSN no pungens_25_dT | Pseudo-nitzschia no pungens | 18S |
| PSN + some Frags_25_dT | Pseudo-nitzschia + some Fragilariopsis | 18S |
| KareGD01_25_dT | Karenia | 28S |
| AlexGD01_25_dT | Alexandrium | 28S |
| DphyGD01_25_dT | Dinophysis in part | 28S |
| DphyGD02_25_dT | Dinophysis | 28S |
| PschGS01_25_dT | Pseudochattonella (genus) | 18S |
| PschGS04_25_dT | Pseudochattonella (genus) | 18S |
| PschG05_25_dT | Pseudochattonella (genus) | 18S |
| DphyGS01_25_dT | Dinophysis genus sensu stricto | 18S |
| DphyGS02_25_dT | Dinophysis genus sensu stricto | 18S |
| DphyGS03_25_dT | all Dinophysis and Phalacroma | 18S |
| DphyGS04_25_dT | all Dinophysis | 18s |
| KargeD01_25_dT | Karlodinium genus | 28S |
| AzaGD01_dT | Azadinium genus | 28S |
| AzaGD03_dT | Azadinium genus | 28S |
| AzaGS01_dT | Azadinium genus | 18S |
| AzaGS02_dT | Azadinium genus | 18S |
| Species-level probes | ||
| AtamaS01_25_dT | Alexandrium NA,WE,TA, species complex | 18S |
| AminuS01_25_dT | Alexandrium minutum | 18S |
| ATNA_D01_25_dT | A. tamarense (North America) | 28S |
| ATNA_D02_25_dT | A. tamarense (North America) | 28S |
| ATTA _D01_25_dT | A. tamarense (Temperate Asian) | 28S |
| AostD01 _25_dT | A. ostenfeldii | 28S |
| AostS02 _25_dT | A. ostenfeldii | 18S |
| CpolyS01_25_dT | Chrysochromulina polylepis | 18S |
| PparvD01_25_dT | Prymnesium parvum | 28S |
| Prymparv01_25_dT | Prymnesium parvum | 18S |
| KbreD03_25_dT | Karenia mikimotoi and brevis | 28S |
| KbreD04_25_dT | K. mikimotoi and brevis | 28S |
| KmikiD01_25_dT | K. mikimotoi | 28S |
| KbreD05_25 | K. brevis | 28S |
| LSKbre0548A25_dT | K. mikimotoi and brevis | 28S |
| KmGcS06_25_dT | K. mikimotoi, Gymnodinium catenatum, cf. Chatonella sp. | 18S |
| KbreD03c_25_dT | Competitor K. mikimotoi and brevis | 18S |
| KbreD04_25c_dT | Competitor K. mikimotoi and brevis | 28S |
| SSKbre1448A25_dT | K. brevis | 18S |
| SSKbre1448A25c_dT | K. brevis | 18S |
| LSKBre0548A25c_dT | K. brevis | 28S |
| SSGcat0826A27_dT | Gymnodinium catenatum | 18S |
| LSGcat0270A24_dT | G. catenatum | 28S |
| GcateS01_25_dT | G. catenatum | 18S |
| KveneD01_25_dT | Karlodinium veneficum | 28S |
| KveneD02_25_dT | Karlodinium veneficum | 28S |
| KveneD03_25_dT | Karlodinium veneficum | 28S |
| KveneD04_25_dT | Karlodinium veneficum | 28S |
| KveneD05_25_dT | Karlodinium veneficum | 28S |
| KveneD06_25_dT | Karlodinium veneficum | 28 |
| PlimaS01_25_dT | Prorocentrum lima | 18S |
| PlimaFD01_2_dT5 | P. lima | 28S |
| PmicaD02_25_dT | P. micans | 28S |
| PminiD01_25_dT | P. minimum | 28S |
| PmacuS01 | P. maculosum and belizeanum | 18S |
| PmacuD01 | P. maculosum | 28S |
| PmacuD02 | P. maculosum | 28S |
| PrathD01 | P. rathymum and mexicanum | 28S |
| PrathD02 | P. rathymum and mexicanum | 28S |
| DacumiD02_25_dT | Dinophysis acuminata, dens and sacculus | 28S |
| DacutaD02_25_dT | Dinophysis acuta and fortii | 28S |
| DacumiS01_25_dT | Dinophysis acuminata | 18S |
| DacutaS01_25_dT | Dinophysis acuta | 18S |
| DnorvS01_25_dT | Dinophysis norvegica | 18S |
| PausserD01_25_dT | Pseudo-nitzschia australis and seriata | 28S |
| PmulausD01_25_dT | P. australis and multistriata | 28S |
| PcaserausD02_25_dT | P. australis, seriata, deli2 | 28S |
| PcaserausD03_25_dT | P. australis, seriata, calliantha | 28S |
| PfraucalD02_25_dT | P. fraudulenta, subfraudulenta, calliantha | 28S |
| PcaciD01_25_dT | P. caciantha | 28S |
| PcaciD02_25_dT | P. caciantha | 28S |
| PcaciD04_25_dT | P. caciantha | 28S |
| Pcal1D01_25_dT | P. calliantha | 28S |
| PmanD01_25_dT | P. manii | 28S |
| Pman2D02_25_dT | P. manii | 28S |
| Pman2D03_25_dT | P. manii | 28S |
| Pman2D05_25_dT | P. manii | 28S |
| Pdel4D01_25_dT | P. cf. delicatissima Clade4 | 28S |
| Pdel4D02_25_dT | P. cf. delicatissima Clade4 | 28S |
| Pdel3B_25_dT | P. delicatissima clade 3 + micropora | 28S |
| Pdel3A_25_dT | P. delicatissima clade 3 + micropora | 28S |
| CompPdel3_25_dT | Competitor Pdel3A | 28S |
| Pdel1D01_25_dT | P. delicatissima Clade1 | 28S |
| Pcaldel2D01_25_dT | P. delicatissima Clade2 | 28S |
| PcaldelD03_25_dT | P. delicatissima Clade2 and calliantha | 28S |
| Pdel4D03_25_dT | P. delicatissima Clade4 | 28S |
| PgalaD01_25_dT | P. galaxiae | 28S |
| PgalaD02_25_dT | P. galaxiae | 28S |
| PgalaD04_25_dT | P. galaxiae | 28S |
| PmultS01_25_dT | P. multiseries | 18S |
| PmultD02_25_dT | P. multiseries | 28S |
| PmultcalD01_25_dT | P. multiseries and calliantha | 28S |
| PmultcalD03_25_dT | P. multiseries and calliantha | 28S |
| PmultcalD04_25_dT | P. multiseries and calliantha | 28S |
| PcalfrauD04_25_dT | P. fraudulenta and multistriata | 28S |
| PmulaD03_25_dT | P. multistriata | 28S |
| PmulacalD02_25_dT | P. multistriata and calliantha | 28S |
| PpdeD01_25_dT | P. pseudodelicatissima and cuspidata | 28S |
| PpdeD02_25_dT | P. pseudodelicatissima and cuspidata | 28S |
| PpungcalS01_25_dT | P. pungens and calliantha | 18S |
| PpungcalD02_25_dT | P. pungens and calliantha | 28S |
| PpungcalD04_25_dT | P. pungens and calliantha | 28S |
| PsercalD01_25_dT | P. seriata and calliantha | 28S |
| CtoxS05_25_dT | cf. Chatonella sp. | 18S |
| CtoxiS07_25_dT | cf. Chatonella sp. | 18S |
| CtoxiS09_25_dT | cf. Chatonella sp. | 18S |
| PfarD01_25_dT | Pseudochattonella farcimen | 28S |
| PverD01_25_dT | Pseudochattonella verruculosa | 28S |
| SSHaka0193A25_dT | Heterosigma akashiwo | 18S |
| SSHaka0200A25_dT | H. akashiwo | 18S |
| LSHaka0544A25b_dT | H. akashiwo | 28S |
| LSHaka0268A25_dT | H. akashiwo | 28S |
| LSHaka0544A25c_dT | H. akashiwo | 28S |
| LSHaka0548A25_dT | H. akashiwo | 28S |
| LSHaka0329A25_dT | H. akashiwo | 28S |
| LSHaka0358A24_dT | H. akashiwo | 28S |
2.6. Microarray Hybridization
2.7. Data Analysis
3. Results and Discussion
3.1. Species Composition during Sampling Period Based on Cell Counts
| Species | 1A | 2A | 3A | 4A | 6A |
|---|---|---|---|---|---|
| Cryptomonadales | 50.700 | 331.500 | 181.400 | 194.100 | 36.400 |
| Chaetoceros spp. | 59.000 | 1.841.200 | 629.100 | 4.400 | 40.600 |
| Asterionellopsis glacialis | 19.000 | 32.400 | 0 | 27.800 | 446.400 |
| Nitzschia spp. | 1.200 | 400 | 600 | 11.000 | 73.200 |
| Species | 1A | 2A | 3A | 4A | 6A |
|---|---|---|---|---|---|
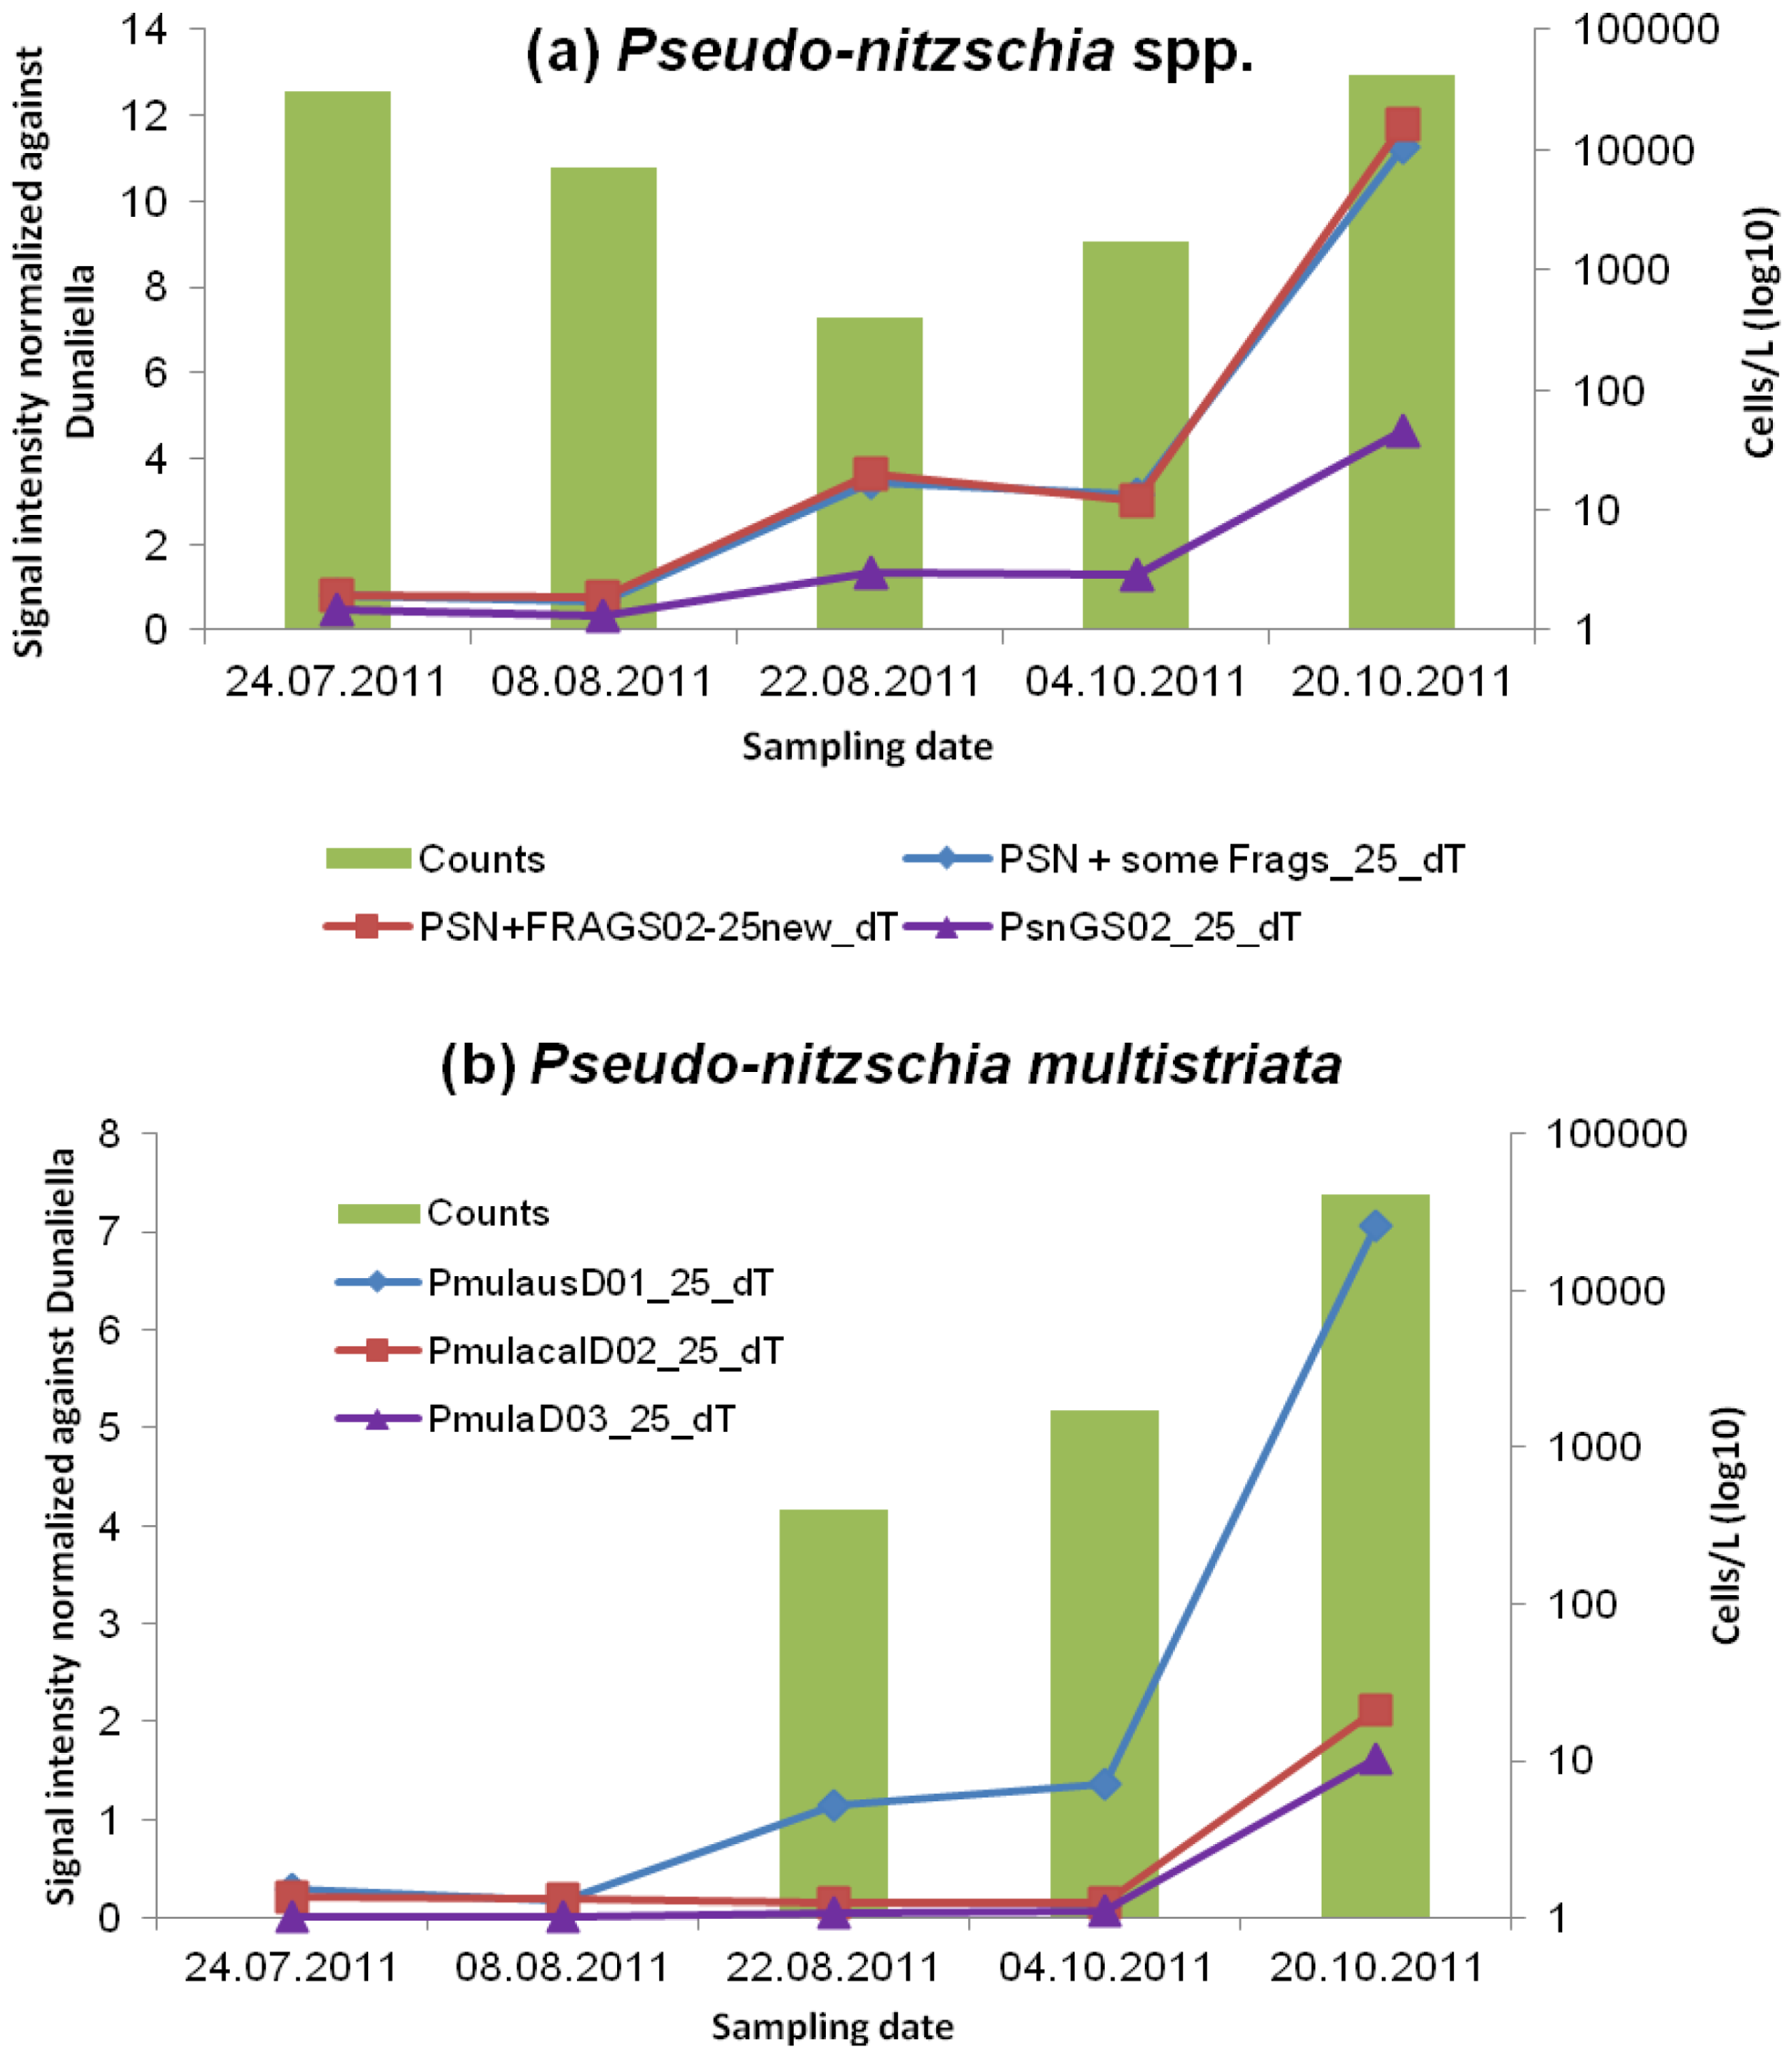
| Pseudo-nitzschia spp. | 30,200 | 7,000 | 0 | 0 | 800 |
| Pseudo-nitzschia multistriata | 0 | 0 | 400 | 1,700 | 40,600 |
| Prorocentrum minimum, balticum, cordatum | 0 | 400 | 0 | 400 | 0 |
| Heterosigma akashiwo | 0 | 0 | 0 | 600 | 400 |
| Alexandrium spp. | 20 | 0 | 0 | 0 | 0 |
| Dinophysis caudata | 0 | 0 | 0 | 0 | 30 |
3.2. Relations between Microarray Signal, Cell Counts and Detection of Toxins
3.2.1. Pseudo-nitzschia and ASP Toxins
| STX | Okadaic Acid, DTXS | Domoic Acid | ||||
|---|---|---|---|---|---|---|
| (PSP) | (DSP) | (ASP) | ||||
| Sampling Date | Multi SPR | ELISA | Multi SPR | ELISA | Multi SPR | ELISA |
| 24.07.2011 | − | − | − | − | − | − |
| 08.08.2011 | − | − | − | + | − | − |
| 22.08.2011 | − | + | − | + | − | − |
| 04.10.2011 | − | + | − | + | − | + |
| 20.10.2011 | + | + | − | + | − | + |
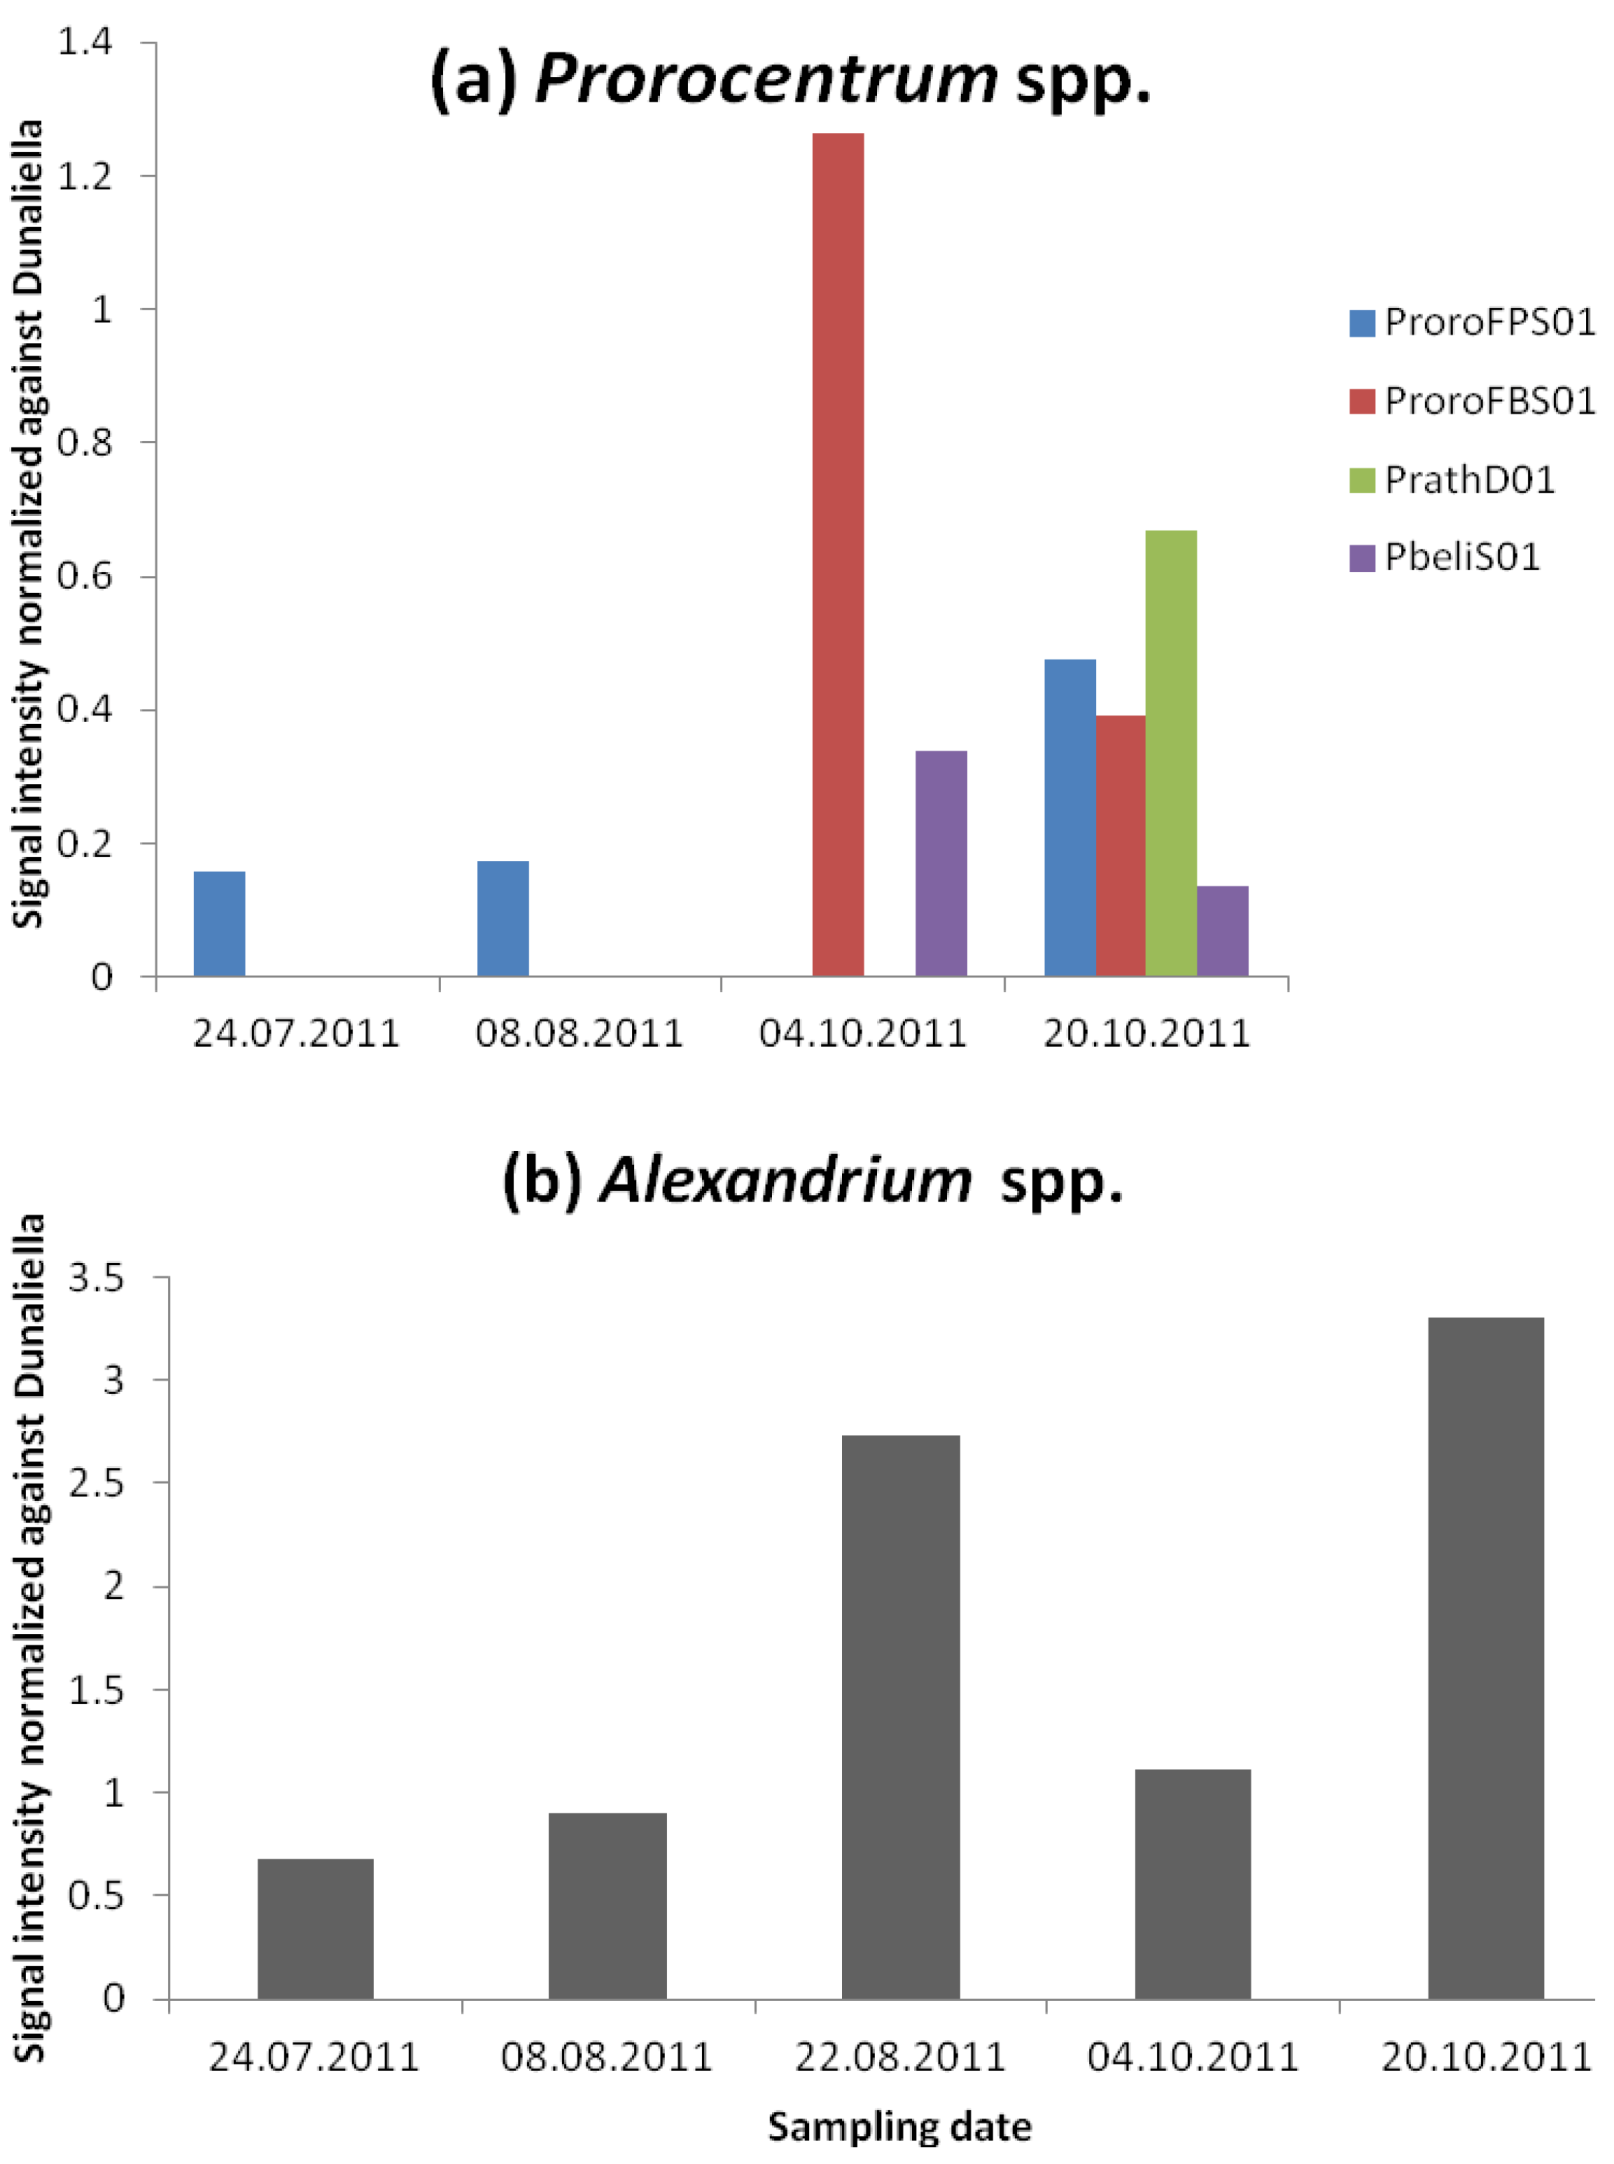
3.2.2. Dinophysis and Prorocentrum and DSP Toxins
3.2.3. Alexandrium and PSP Toxins
3.2.4. Heterosigma akashiwo
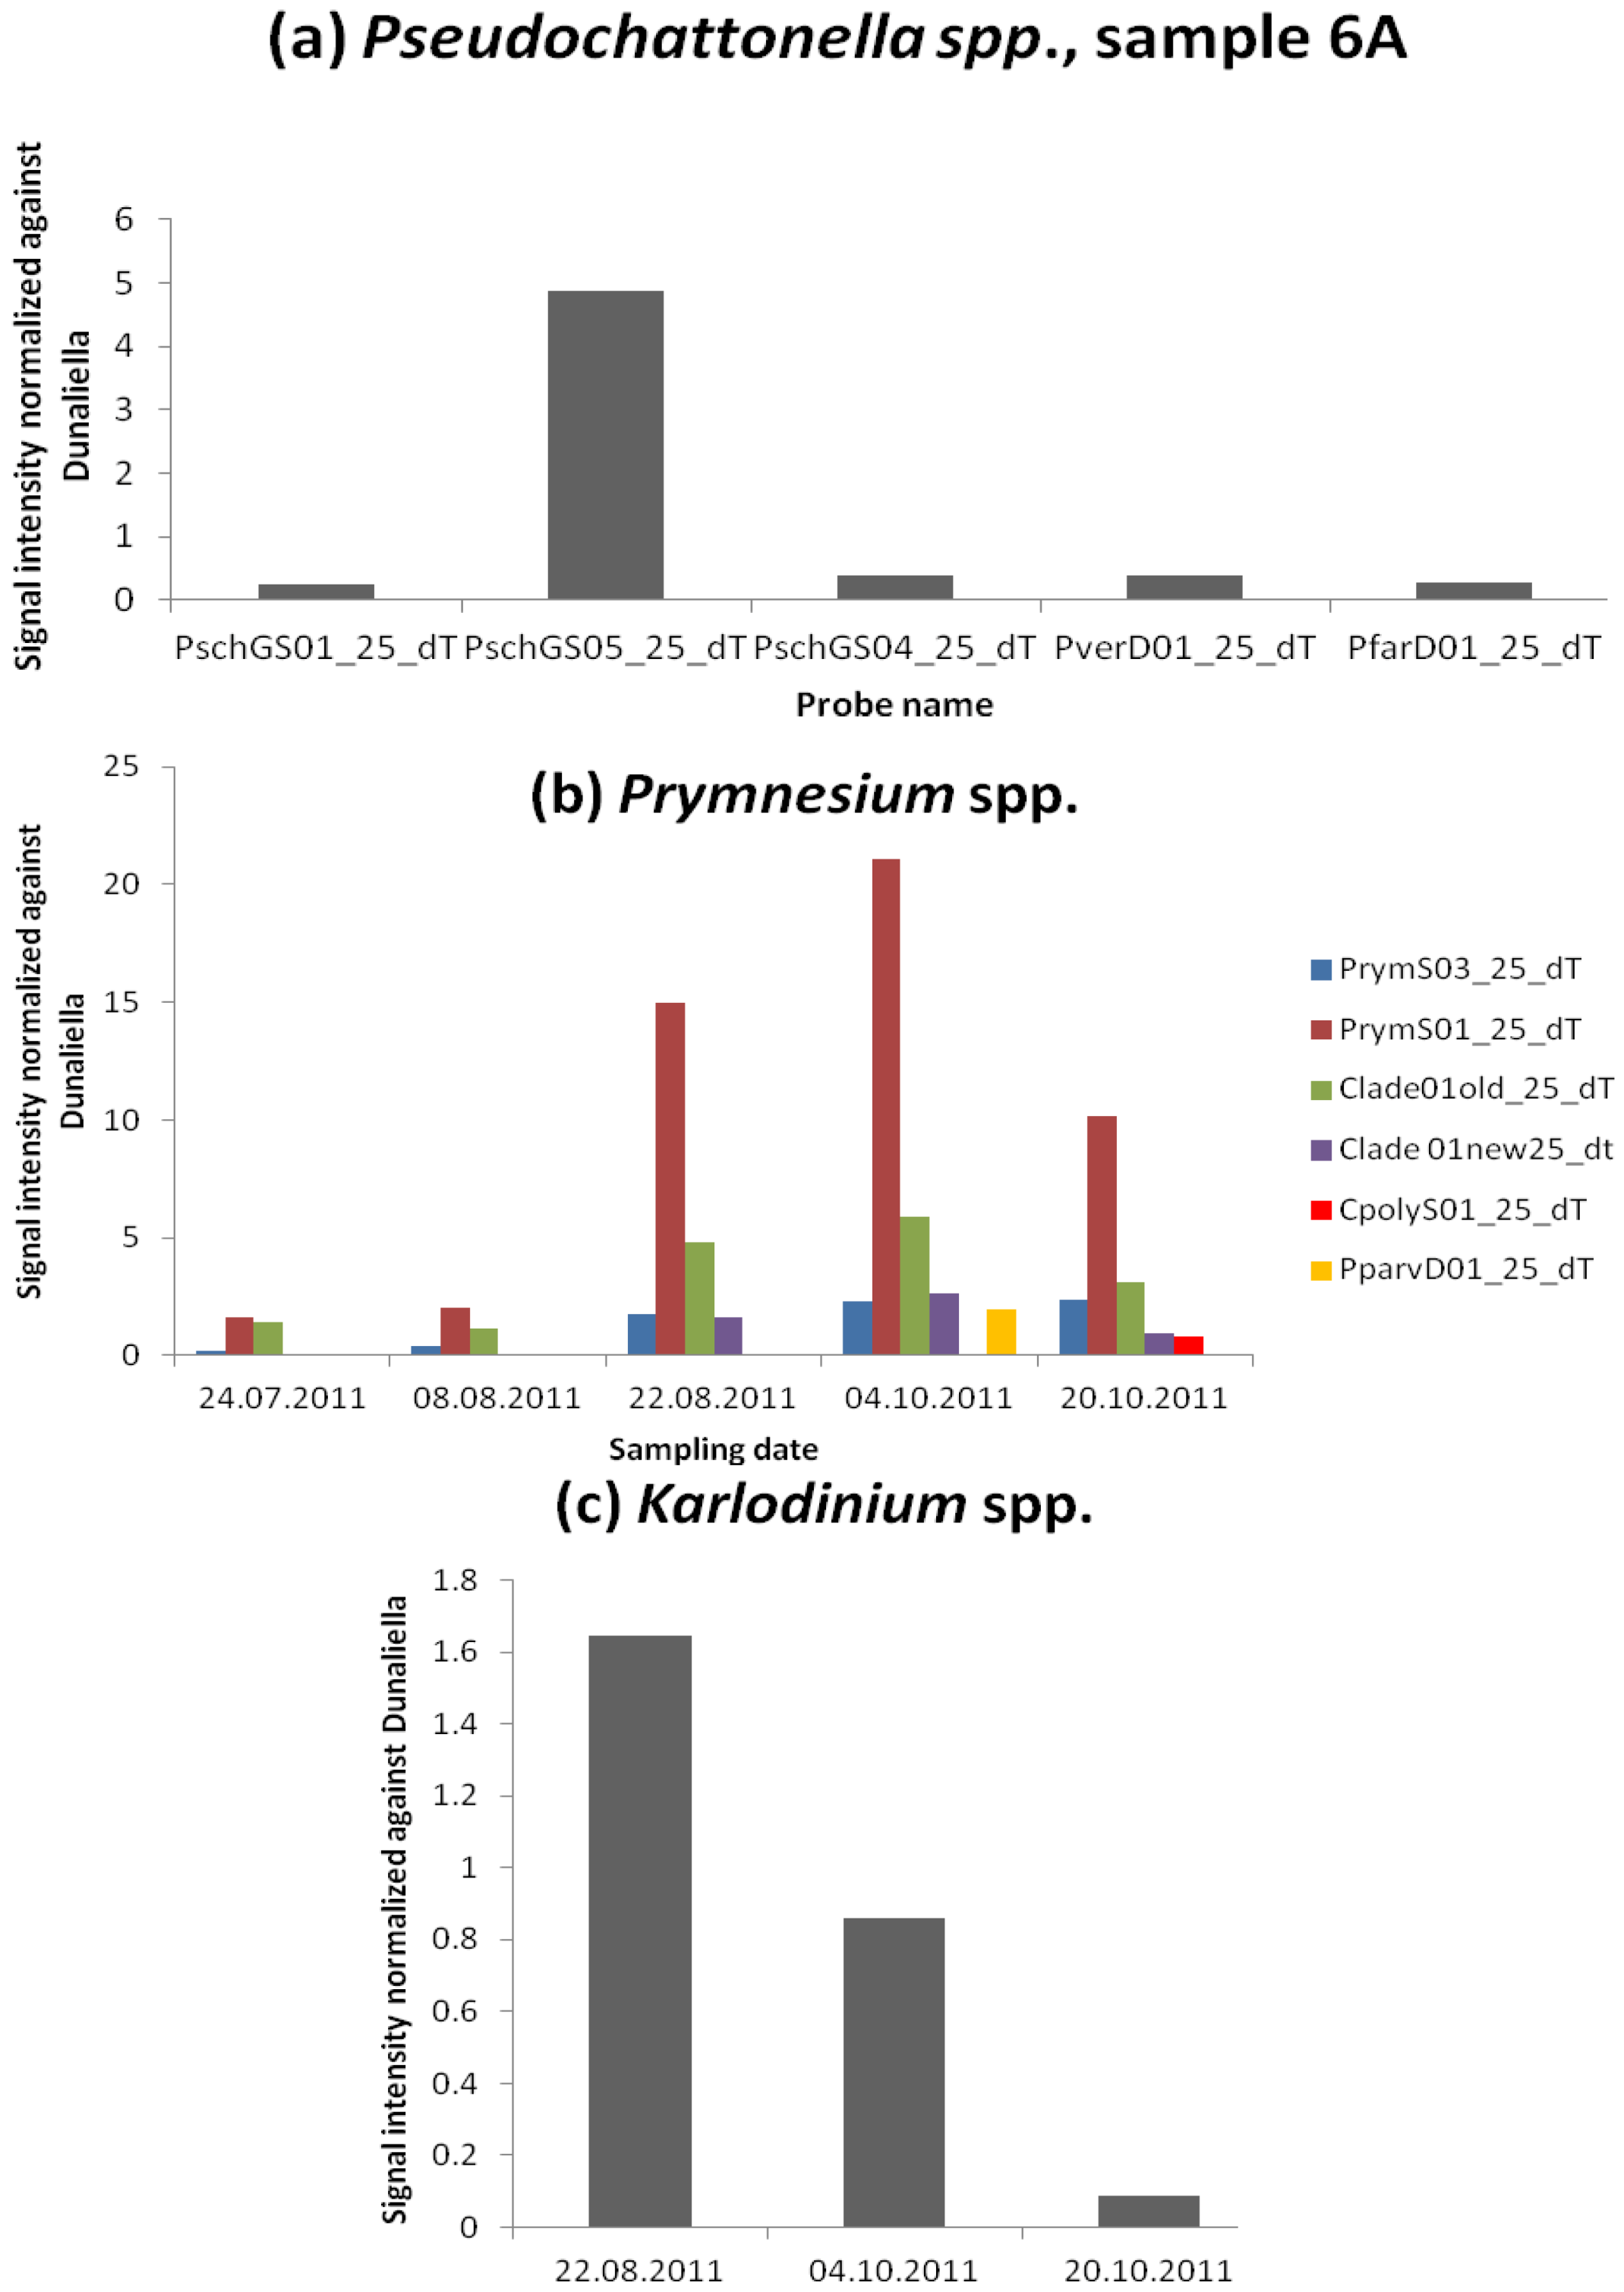
3.2.5. Species Unfound by Cell Counts but Identified with Microarray and Hierarchy File
Fish Killing Species

Azaspiracid Shellfish Poisoning (AZP) Toxins Producer
Other PSP Toxins
4. Conclusions
Acknowledgments
Appendix
| * Alexandrium | 20 | 0 | 0 | 0 | 0 |
| * Dinophysis caudata | 0 | 0 | 0 | 0 | 30 |
| Dinophysis tripos | 20 | 0 | 0 | 0 | 0 |
| Gymnodiniaceae | 0 | 400 | 3,800 | 1,800 | |
| Katodinium | 100 | 0 | 0 | 0 | 0 |
| Gyrodinium | 0 | 100 | 100 | 200 | 200 |
| Gyrodinium spirale | 0 | 200 | 0 | 100 | 0 |
| Prorocentrum micans | 0 | 100 | 0 | 0 | 0 |
| * Prorocentrum minimum + balticum + cordatum | 0 | 400 | 0 | 400 | 0 |
| Prorocentrum triestinum | 0 | 0 | 200 | 800 | 400 |
| Protoperidinium | 0 | 200 | 0 | 800 | 600 |
| Protoperidinium bipes | 0 | 400 | 5,400 | 600 | 0 |
| Protoperidinium steinii + pyriforme | 0 | 0 | 100 | 0 | 0 |
| Protoperidinium diabolus | 0 | 0 | 200 | 0 | 0 |
| Heterocapsa niei | 0 | 100 | 1000 | 0 | 0 |
| Gonyaulax | 0 | 0 | 100 | 0 | 0 |
| Scrippsiella + Ensiculifera + Pentapharsodinium + Bysmatrum | 0 | 200 | 2,600 | 1,000 | 1,800 |
| Torodinium | 0 | 0 | 100 | 100 | 200 |
| Amphidinium | 0 | 0 | 0 | 200 | 0 |
| Heterocapsa triquetra | 0 | 0 | 200 | 0 | 0 |
| Peridiniales | 400 | 0 | 0 | 1,200 | 1,000 |
| Peridiniaceae | 0 | 0 | 1,400 | 0 | 0 |
| Peridinium quinquecorne | 0 | 400 | 3,200 | 0 | 0 |
| Euglena | 1A | 2A | 3A | 4A | 6A |
| Euglenaceae | 0 | 600 | 400 | 0 | 0 |
| Eutreptiaceae | 0 | 0 | 0 | 2,200 | 0 |
| Eutreptiella | 2,400 | 5,000 | 4,000 | 0 | 3,600 |
| Cryptomonads | 1A | 2A | 3A | 4A | 6A |
| Cryptomonadales | 50,700 | 331,500 | 181,400 | 194,100 | 36,400 |
| Diatoms | 1A | 2A | 3A | 4A | 6A |
| Centrales | 0 | 0 | 0 | 0 | 400 |
| Rhizosolenia imbricata + styliformis | 0 | 100 | 0 | 0 | 0 |
| Rhizosolenia setigera + pungens | 0 | 0 | 0 | 600 | 1000 |
| Proboscia alata | 0 | 100 | 0 | 0 | 0 |
| Corethron | 0 | 0 | 0 | 100 | 0 |
| Paralia sulcata | 600 | 0 | 0 | 400 | 0 |
| Thalassiosira | 0 | 0 | 0 | 2,400 | 7,000 |
| Thalassiosira rotula | 0 | 0 | 0 | 0 | 400 |
| Corethron | 0 | 0 | 0 | 0 | 1,200 |
| Chaetoceros | 56,200 | 1,821,400 | 627,900 | 0 | 13,400 |
| Chaetoceros decipiens | 2,800 | 19,800 | 1,200 | 3,200 | 6,800 |
| Chaetoceros curvisetus + debilis + pseudocurvisetus | 0 | 0 | 0 | 1200 | 19,800 |
| Chaetoceros danicus | 0 | 0 | 0 | 0 | 600 |
| Lithodesmium | 200 | 5,300 | 7,000 | 3,600 | 6,800 |
| Leptocylindrus danicus | 6,200 | 1,600 | 0 | 3,800 | 12,200 |
| Leptocylindrus minimus | 0 | 4,800 | 0 | 0 | 6200 |
| Cerataulina pelagica | 400 | 1,000 | 5,400 | 2,800 | |
| Dactyliosolen fragilissimus | 1,000 | 4,600 | 1200 | 1,000 | 4,400 |
| Guinardia striata | 1,100 | 0 | 0 | 0 | 1,800 |
| Guinardia flaccida | 100 | 0 | 0 | 0 | 0 |
| Guinardia delicatula | 0 | 0 | 0 | 0 | 1,400 |
| Skeletonema costatum | 0 | 3,600 | 500 | 0 | 1,000 |
| Odontella regia | 0 | 0 | 0 | 0 | 600 |
| Biddulphia alternans | 0 | 0 | 0 | 0 | 600 |
| Eucampia zodiacus | 0 | 0 | 0 | 0 | 1,400 |
| Hemiaulus | 400 | 1,100 | 0 | 0 | 0 |
| Lauderia | 400 | 0 | 0 | 0 | 0 |
| Pennales | 3,800 | 600 | 200 | 2,000 | 4,200 |
| * Pseudo-nitzschia large width, seriata complex (australis + fraudulenta + seriata + subpacifica) | 30,200 | 200 | 0 | 0 | 0 |
| * Pseudo-nitzschia narrow width, delicatissima complex (calliantha + delicatissima + pseudodelicatissima) | 0 | 6,800 | 0 | 0 | 0 |
| * Pseudo-nitzschi, slender group, seriata complex (multiseries + pungens) | 0 | 0 | 0 | 0 | 800 |
| * Pseudo-nitzschia sigmoid group (multistriata) | 0 | 0 | 400 | 1,700 | 40,600 |
| Thalassionema nitzschioides | 0 | 2,200 | 0 | 1,200 | 12,600 |
| Pleurosigma + Gyrosigma | 0 | 0 | 100 | 600 | 600 |
| Nitzschia | 0 | 0 | 0 | 1,1000 | 72,800 |
| Nitzschia longissima | 1200 | 400 | 600 | 0 | 400 |
| Cylindrotheca closterium | 6,600 | 16,400 | 25,350 | 0 | 2,600 |
| Asterionellopsis glacialis | 19,000 | 32,400 | 0 | 2,7800 | 446,400 |
| Licmophora | 0 | 0 | 0 | 100 | 0 |
| Cocconeis | 0 | 0 | 0 | 400 | 200 |
| Heterokonts | 1A | 2A | 3A | 4A | 6A |
| *Heterosigma akashiwo | 0 | 0 | 0 | 600 | 400 |
| Dictyocha | 0 | 0 | 100 | 400 | 200 |
| 1A (24.07.2011) | 2A (08.08.2011) | 3A (22.08.2011) | 4A (04.10.2011) | 6A (20.10.2011) | ||||||
|---|---|---|---|---|---|---|---|---|---|---|
| TI | STDEV | TI | STDEV | TI | STDEV | TI | STDEV | TI | STDEV | |
| PSN + some Frags_25_dT | 571,661 | 283,278 | 462,375 | 261,002 | 376,328 | 136,949 | 328,723 | 64,836 | 1,234,899 | 246,612 |
| PSN+FRAGS02-25new_dT | 570,012 | 278,217 | 483,590 | 235,672 | 374,378 | 107,819 | 328,689 | 73,975 | 1,236,907 | 237,510 |
| PsnGS02_25_dT | 366,160 | 122,407 | 269,644 | 59,512 | 176,231 | 40,406 | 154,926 | 102,545 | 527,093 | 47,698 |
| PmulacalD02_25_dT | 201,918 | 30,724 | 189,923 | 53,609 | 35,294 | 18,226 | 35,985 | 14,234 | 253,037 | 27,753 |
| PmulaD03_25_dT | 66,635 | 5,760 | 71,895 | 9,951 | 37,380 | 15,172 | 18,590 | 10,183 | 212,033 | 22,236 |
| PmulausD01_25_dT | 240,310 | 36,151 | 168,879 | 19,588 | 154,874 | 31,009 | 181,673 | 30,966 | 784,727 | 91,653 |
| ProroFPS01 | 169,269 | 31,916 | 160,601 | 35,392 | 58,362 | 14,735 | 78,983 | 19,111 | ||
| ProroFBS01 | 113,540 | 137,560 | 67,434 | 189,17 | ||||||
| PrathD01 | 108,027 | 8,344 | ||||||||
| PbeliS01 | 60,137 | 58,069 | 21,412 | 24,719 | ||||||
| AlexGD01_25_dT | 477,054 | 82,900 | 555,744 | 276,647 | 270,780 | 352,356 | 154,715 | 37,017 | 389,966 | 29,238 |
| PschGS01_25_dT | 63,769 | 9,284 | ||||||||
| PschGS04_25_dT | 547,515 | 98,442 | ||||||||
| PschGS05_25_dT | 47,371 | 12,185 | ||||||||
| PverD01_25_dT | 70,207 | 10,052 | ||||||||
| PfarD01_25_dT | 51,096 | 8,260 | ||||||||
| PrymS01_25_dT | 1,062,712 | 223,123 | 1,208,456 | 400,071 | 1,285,690 | 372,848 | 1,592,062 | 501,853 | 1,127,413 | 97,605 |
| PrymS03_25_dT | 184,896 | 64,536 | 262,141 | 132,584 | 204,940 | 51,019 | 231,062 | 63,987 | 285,495 | 49,415 |
| Clade01old_25_dT | 935,860 | 146,759 | 707,441 | 135,777 | 487,530 | 194,120 | 521,791 | 172,448 | 353,814 | 29,352 |
| Clade 01new25_dt | 217,043 | 82,294 | 293,107 | 86,528 | 141,925 | 34,971 | ||||
| CpolyS01_25_dT | 112,327 | 9,400 | 122,730 | 29,900 | ||||||
| PparvD01_25_dT | 133,275 | 251,500 | ||||||||
| KargeD01_25_dT | 138,096 | 195,135 | 90,368 | 92,796 | 17,867 | 11,278 | ||||
References
- Hallegraeff, G.M. Harmful algal blooms: A global overview. In Manual on Harmful Marine Microalgae; IOC-UNESCO: Paris, France, 2003; Volume 11, pp. 25–49. [Google Scholar]
- Moestrup, Ø.; Akselman, R.; Cronberg, G.; Elbraechter, M.; Fraga, S.; Halim, Y.; Hansen, G.; Hoppenrath, M.; Larsen, J.; Lundholm, N.; Nguyen, L.N.; Zingone, A. IOC-UNESCO Taxonomic Reference List of Harmful Micro Algae. Available online: http://www.marinespecies.org/HAB (accessed on 24 December 2012).
- Yasumoto, T.; Murata, M.; Oshima, Y.; Sano, M.; Matsumoto, G.K.; Clardy, J. Diarrhetic shellfish toxins. Tetrahedron 1985, 41, 1019–1025. [Google Scholar] [CrossRef]
- Cotterill, F.P.D. Systematics, biological knowledge and environmental conservation. Biodivers. Conserv. 1995, 4, 183–205. [Google Scholar] [CrossRef]
- Gómez, F. Phytoplankton invasions: Comments on the validity of categorizing the non-indigenous dinoflagellates and diatoms in European seas. Mar. Pollut. Bull. 2008, 56, 620–628. [Google Scholar] [CrossRef]
- DeSantis, T.Z.; Stone, C.E.; Murray, S.R.; Moberg, J.P.; Andersen, G.L. Rapid quantification and taxonomic classification of environmental DNA from both prokaryotic and eukaryotic origins using a microarray. FEMS Microbiol. Lett. 2005, 245, 271–278. [Google Scholar] [CrossRef]
- DeSantis, T.Z.; Brodie, E.L.; Moberg, J.P.; Zubieta, I.X.; Piceno, Y.M.; Andersen, G.L. High-density universal 16S rRNA microarray analysis reveals broader diversity than typical clone library when sampling the environment. Microbial Ecol. 2007, 53, 371–383. [Google Scholar]
- Yergeau, E.; Arbour, M.; Brousseau, R.; Juck, D.; Lawrence, J.R.; Masson, L.; Whyte, L.G.; Greer, C.W. Microarray and real-time PCR analyses of the responses of high-arctic soil bacteria to hydrocarbon pollution and bioremediation treatments. Appl. Environ. Microbiol. 2009, 75, 6258–6267. [Google Scholar]
- Gescher, C.; Metfies, K.; Medlin, L.K. The ALEX CHIP—Development of a DNA chip for identification and monitoring of Alexandrium. Harmful Algae 2008, 7, 485–494. [Google Scholar] [CrossRef]
- Brodie, E.L.; DeSantis, T.Z.; Joyner, D.C.; Baek, S.M.; Larsen, J.T.; Andersen, G.L.; Hazen, T.C.; Richardson, P.M.; Herman, D.J.; Tokunaga, T.K.; Wan, J.M.; Firestone, M.K. Application of a high-density oligonucleotide microarray approach to study bacterial population dynamics during uranium reduction and reoxidation. Appl. Environ. Microbiol. 2006, 72, 6288–6298. [Google Scholar]
- Brodie, E.L.; DeSantis, T.Z.; Parker, J.P. M.; Zubietta, I.X.; Piceno, Y.M.; Andersen, G.L. Urban aerosols harbor diverse and dynamic bacterial populations. PNAS 2007, 104, 299–304. [Google Scholar]
- Delehanty, J.B.; Ligler, F.S. A microarray immunoassay for simultaneous detection of proteins and bacteria. Anal. Chem. 2002, 74, 5681–5687. [Google Scholar] [CrossRef]
- Lee, D.-Y.; Seto, P.; Korczak, R. DNA microarray-based detection and identification of waterborne protozoan pathogens. J. Microbiol. Meth. 2010, 80, 129–133. [Google Scholar] [CrossRef]
- Lewis, J.; Medlin, L.K.; Raine, R. MIDTAL (Microarrays for the Detection of Toxic Algae): A Protocol for a Successful Microarray Hybridisation and Analysis, 1st ed; Gantner Verlag: Liechtenstein, Germany, 2012. [Google Scholar]
- Medlin, L.K.; Schmidt, K. Molecular probes improve the taxonomic resolution of cryptophyte abundance in Arcachon Bay. Vie et Milieu 2010, 60, 9–15. [Google Scholar]
- Kegel, J.U.; Del Amo, Y.; Medlin, L.K. Introduction to project MIDTAL: Its methods and samples from Arcachon Bay, France. Environ. Sci. Pollut. Res. 2012. [Google Scholar] [CrossRef]
- Campbell, K.; McGrath, T.; Sjölander, S.; Hanson, T.; Tidare, M.; Jansson, O.; Moberg, A.; Mooney, M.; Elliott, C.; Buijs, J. Use of a novel micro-fluidic device to create arrays for multiplex analysis of large and small molecular weight compounds by surface plasmon resonance. Biosens. Bioelectron. 2011, 26, 3029–3036. [Google Scholar] [CrossRef]
- Ludwig, W.; Strunk, O.; Westram, R.; Richter, L.; Meier, H.; Yadhukumar, H.; Buchner, A.; Lai, T.; Steppi, S.; Jobb, G.; et al. ARB: A software environment for sequence data. Nucl. Acid. Res. 2004, 32, 1363–1371. [Google Scholar]
- Metfies, K.; Borsutzki, P.; Gescher, C.; Medlin, L.K.; Frickenhaus, S. Phylochipanalyser—A program for analysing hierarchical probe sets. Mol. Ecol. Resour. 2008, 8, 99–102. [Google Scholar] [CrossRef] [Green Version]
- Dittami, S.M.; Edvardsen, B. GPR-Analyzer: A simple tool for quantitative analysis of hierarchical multispecies microarrays. Environ. Sci. Pollut. Res. 2012. [Google Scholar] [CrossRef]
- Hasle, G.R. Nitzschia and Fragilariopsis Species Studied in the Light and Electron Microscopes. II. The Group Pseudonitzschia; Universitetsforlaget: Oslo, Norway, 1965. [Google Scholar]
- Hasle, G.R.; Syvertsen, E.E. Marine diatoms. In Identifying Marine Phytoplankton; Academic Press: San Diego, CA, USA, 1997; pp. 5–385. [Google Scholar]
- McNamee, S.; Elliott, C.; Delahaut, P.; Campbell, K. Multiplex biotoxin surface plasmon resonance method for marine biotoxins in algal and seawater samples. Environ. Sci. Pollut. Res. 2012. [Google Scholar] [CrossRef]
- Taylor, J.; Kegel, J.U.; Lewis, J.; Medlin, L.K. Validation of the detection of Alexandrium spp using specific RNA probes tested in a microarray format: Calibration of signal based on variability of RNA content with environmental conditions. Harmful Algae 2013. submitted. [Google Scholar]
- Blanco, E.P.; Hagström, J.; Salomon, P.S.; Graneli, E. Detection of Heterosigma akashiwo (Hada) using specific RNA probes: Variability of RNA content with environmental conditions. Harmful Algae 2013. submitted. [Google Scholar]
- Dittami, S.M.; Hostyeva, V.; Egge, E.S.; Kegel, J.U.; Eikrem, W.; Edvardsen, B. Seasonal dynamics of harmful algae in outer Oslofjorden monitored by microarray, qPCR, and microscopy. Environ. Sci. Pollut. Res. 2013. [Google Scholar] [CrossRef]
- Naustvoll, L.-J. NOBANIS—Invasive Alien Species Fact Sheet Pseudochattonella farcimen—From: Online Database of the North Eurpean and Baltic Network on Invasive Alien Species—NOBANIS. Available online: http://www.nobanis.org (accessed on 24 December 2012).
- Glé, C.; Del Amo, Y.; Sautour, B.; Laborde, P.; Chardy, P. Variability of nutrients and phytoplankton primary production in a shallow macrotidal coastal ecosystem (Arcachon Bay, France). Estuar. Coast. Shelf Sci. 2008, 76, 642–656. [Google Scholar] [CrossRef]
- McCoy, G.R.; Touzet, N.; Fleming, G.T.; Raine, R. An evaluation of the applicability of microarrays for monitoring toxic algae in Irish coastal waters. Environ. Sci. Pollut. Res. 2012. [Google Scholar] [CrossRef]
- Swan River Trust Karlodinium Micrum Algal Bloom, March 2005. Fact Sheet. Available online: http://www.wa.canoe.org.au/?Page=7808 (accessed on 24 December 2012).
- Tillmann, U.; Elbrächter, M.; Krock, B.; John, U.; Cembella, A. Azadinium spinosum gen. et sp. nov. (Dinophyceae) identified as a primary producer of azaspiracid toxins. Eur. J. Phycol. 2009, 44, 63–79. [Google Scholar]
- Tillmann, U.; Elbrächter, M.; John, U.; Krock, B.; Cembella, A. Azadinium obesum (Dinophyceae), a new nontoxic species in the genus that can produce azaspiracid toxins. Phycologia 2010, 49, 169–182. [Google Scholar] [CrossRef]
- Tillmann, U.; Elbrächter, M.; John, U.; Krock, B. A new non-toxic species in the dinoflagellate genus Azadinium: A. poporum sp. nov. Eur. J. Phycol. 2011, 46, 74–87. [Google Scholar] [CrossRef]
- Tillmann, U.; Salas, R.; Gottschling, M.; Krock, B.; O’Driscoll, D.; Elbrächter, M. Amphidoma languida sp. nov. (Dinophyceae) reveals a close relationship between Amphidoma and Azadinium. Protist 2012, 163, 701–719. [Google Scholar]
© 2013 by the authors; licensee MDPI, Basel, Switzerland. This article is an open access article distributed under the terms and conditions of the Creative Commons Attribution license (http://creativecommons.org/licenses/by/3.0/).
Share and Cite
Kegel, J.U.; Del Amo, Y.; Costes, L.; Medlin, L.K. Testing a Microarray to Detect and Monitor Toxic Microalgae in Arcachon Bay in France. Microarrays 2013, 2, 1-23. https://doi.org/10.3390/microarrays2010001
Kegel JU, Del Amo Y, Costes L, Medlin LK. Testing a Microarray to Detect and Monitor Toxic Microalgae in Arcachon Bay in France. Microarrays. 2013; 2(1):1-23. https://doi.org/10.3390/microarrays2010001
Chicago/Turabian StyleKegel, Jessica U., Yolanda Del Amo, Laurence Costes, and Linda K. Medlin. 2013. "Testing a Microarray to Detect and Monitor Toxic Microalgae in Arcachon Bay in France" Microarrays 2, no. 1: 1-23. https://doi.org/10.3390/microarrays2010001