
A Real-Time Magnetoencephalography Brain-Computer Interface Using Interactive 3D Visualization and the Hadoop Ecosystem

Abstract
:1. Introduction

1.1. Scientific Literature Review of MEG/EEG and Hadoop
1.2. Background
- Brain-machine interfaces
- ○
- Pilots and flight control
- ○
- Vigilance monitoring for air force, navy, or ground troop vehicles
- ○
- Speech recognition [21]
- ○
- Clinical settings: Monitoring patient mental states and providing feedback
- ○
- Education: Improving vigilance, attention, learning, and memory
- Monitoring mental processes (“reading the mind”)
- ○
- Detecting deception (FBI, CIA, other law enforcement agencies)
- ○
- Predicting behavior
- ○
- Detecting brain-based predispositions to certain mental tendencies (the brain version of Myers-Briggs)
- ○
- Likelihood of improving with one type of training versus another
- ○
- Likelihood of performing better under specific circumstances
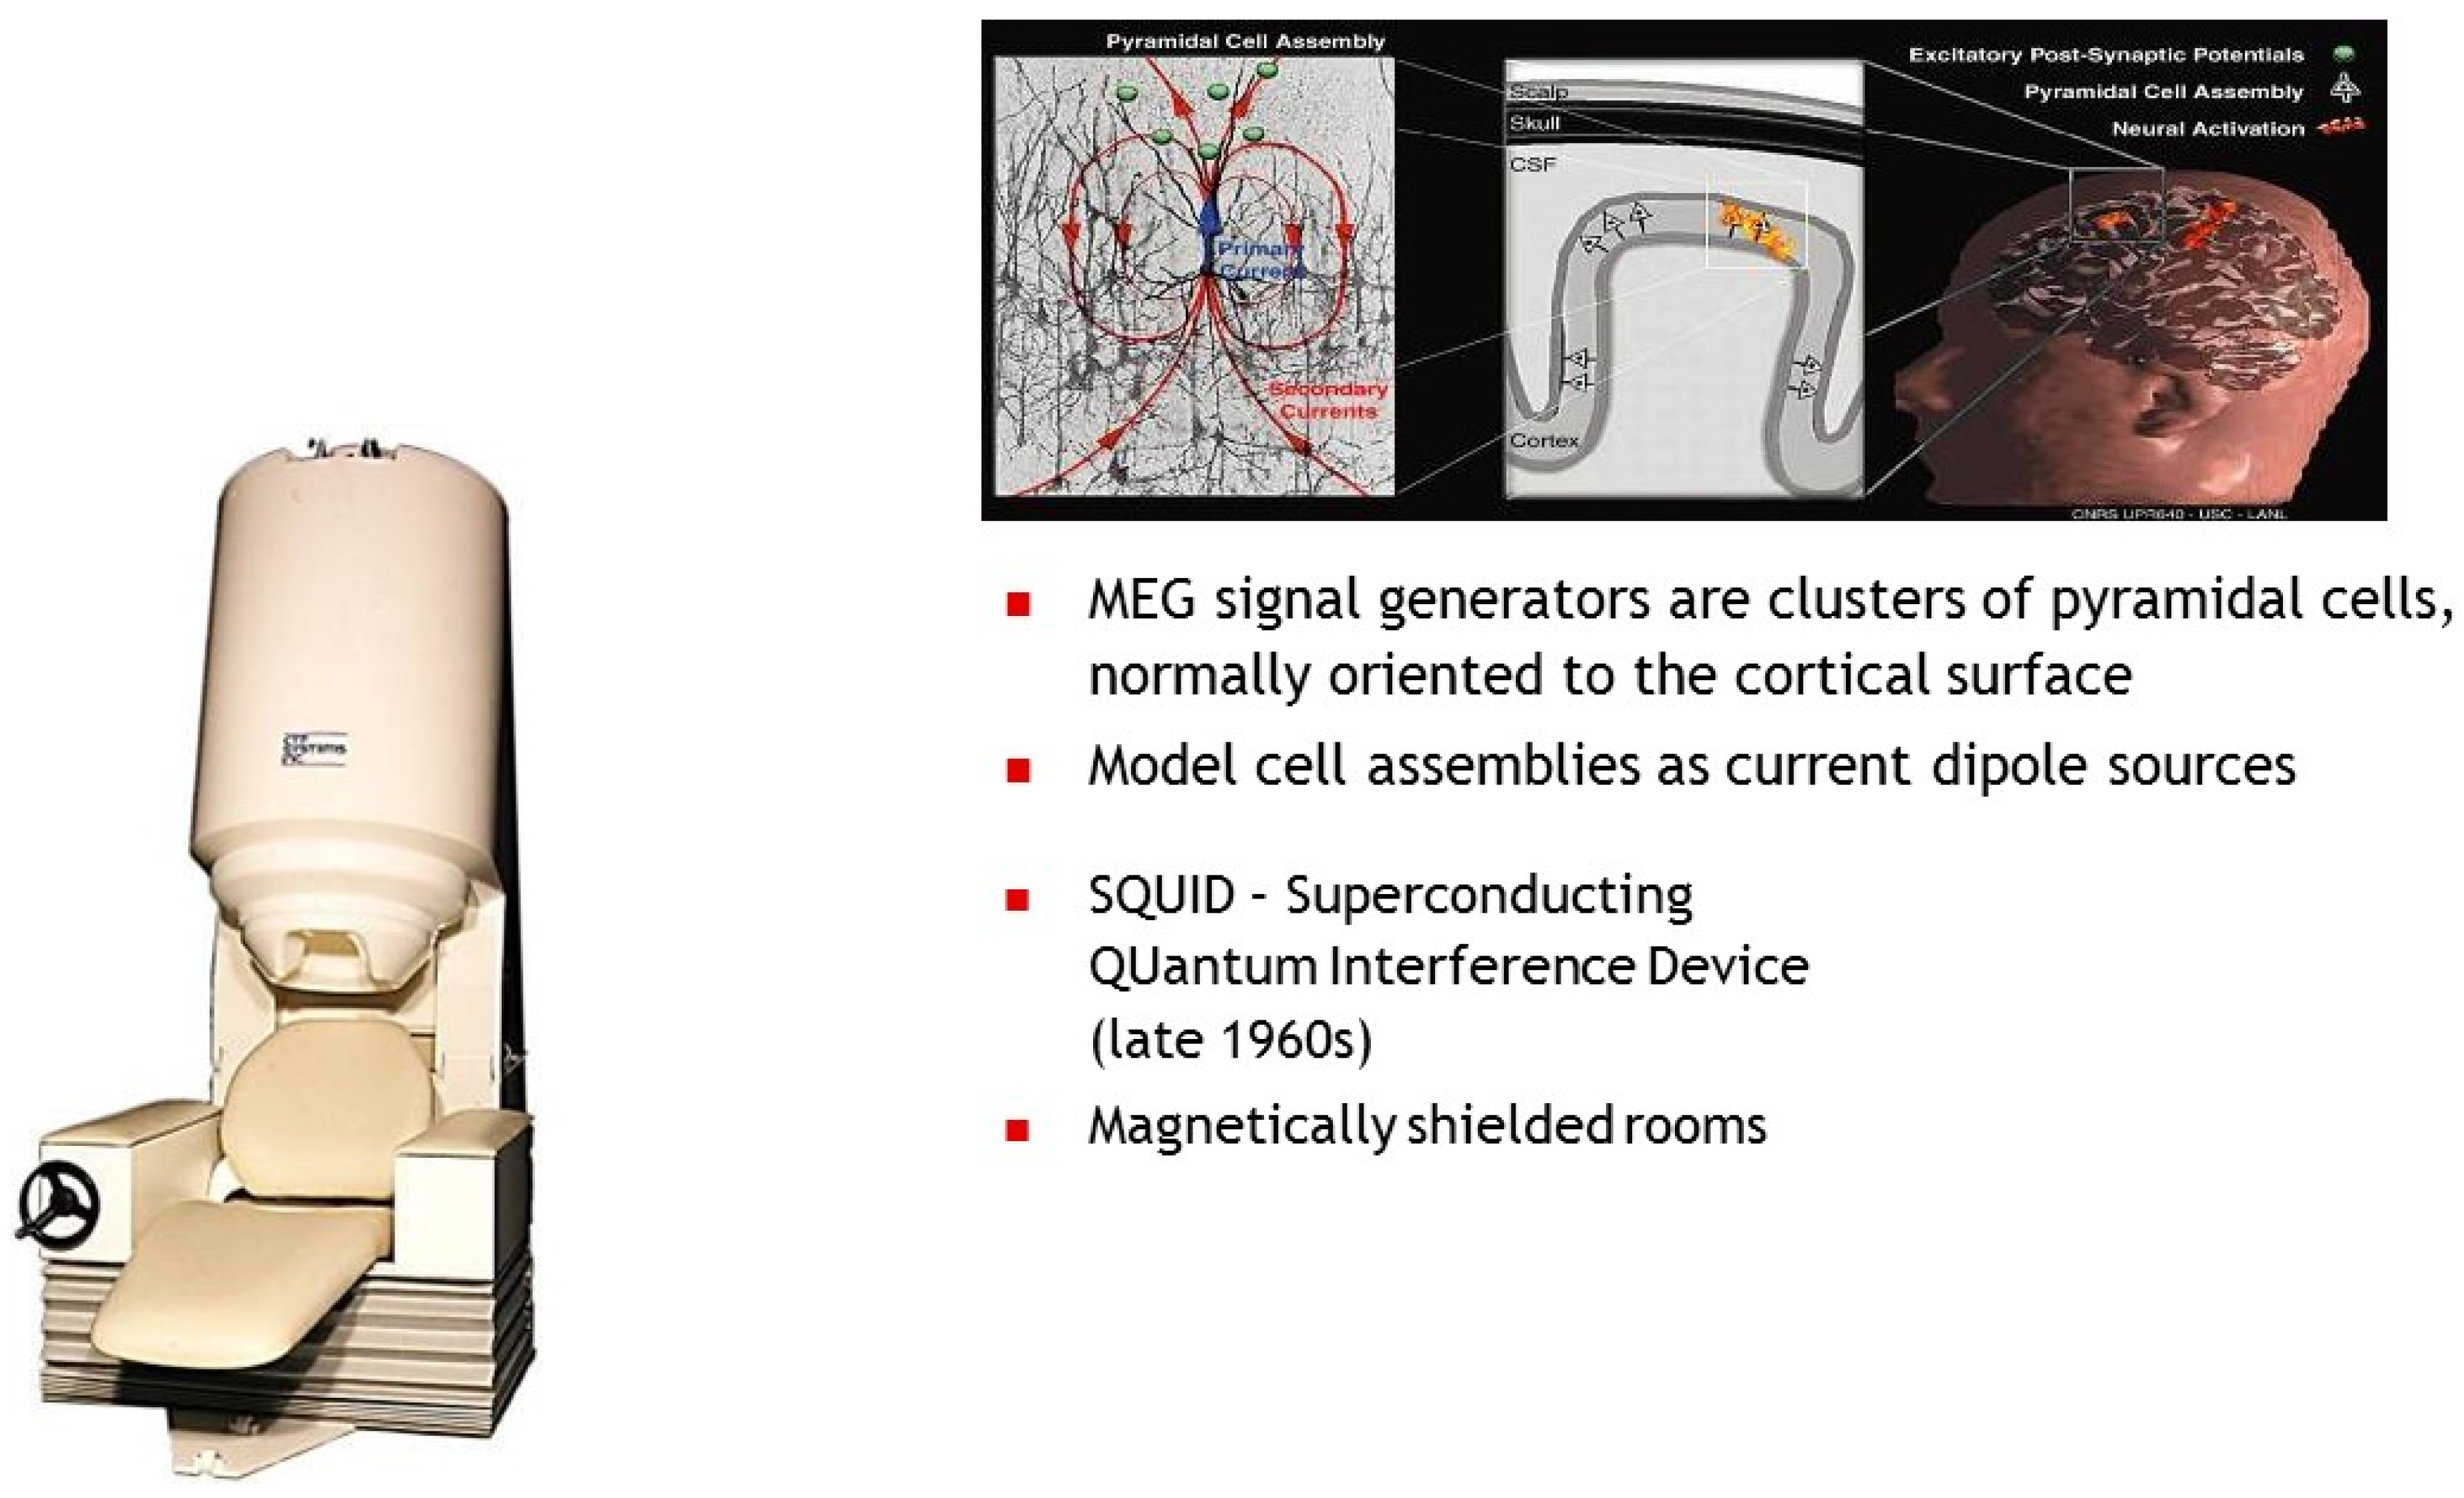
1.3. Magneto Encephalography (MEG)
- Alzheimer’s disease
- Cognitive disorders (autism, learning disorders, Down syndrome)
- Mental disorders (schizophrenia, depression, dementia)
- Migraine headaches and chronic pain
- Multiple sclerosis
- Parkinson’s disease
- Stroke
- Traumatic brain injury
- Treatment of high-risk pregnancies
1.4. UCSF MEG System
2. Experimental Section
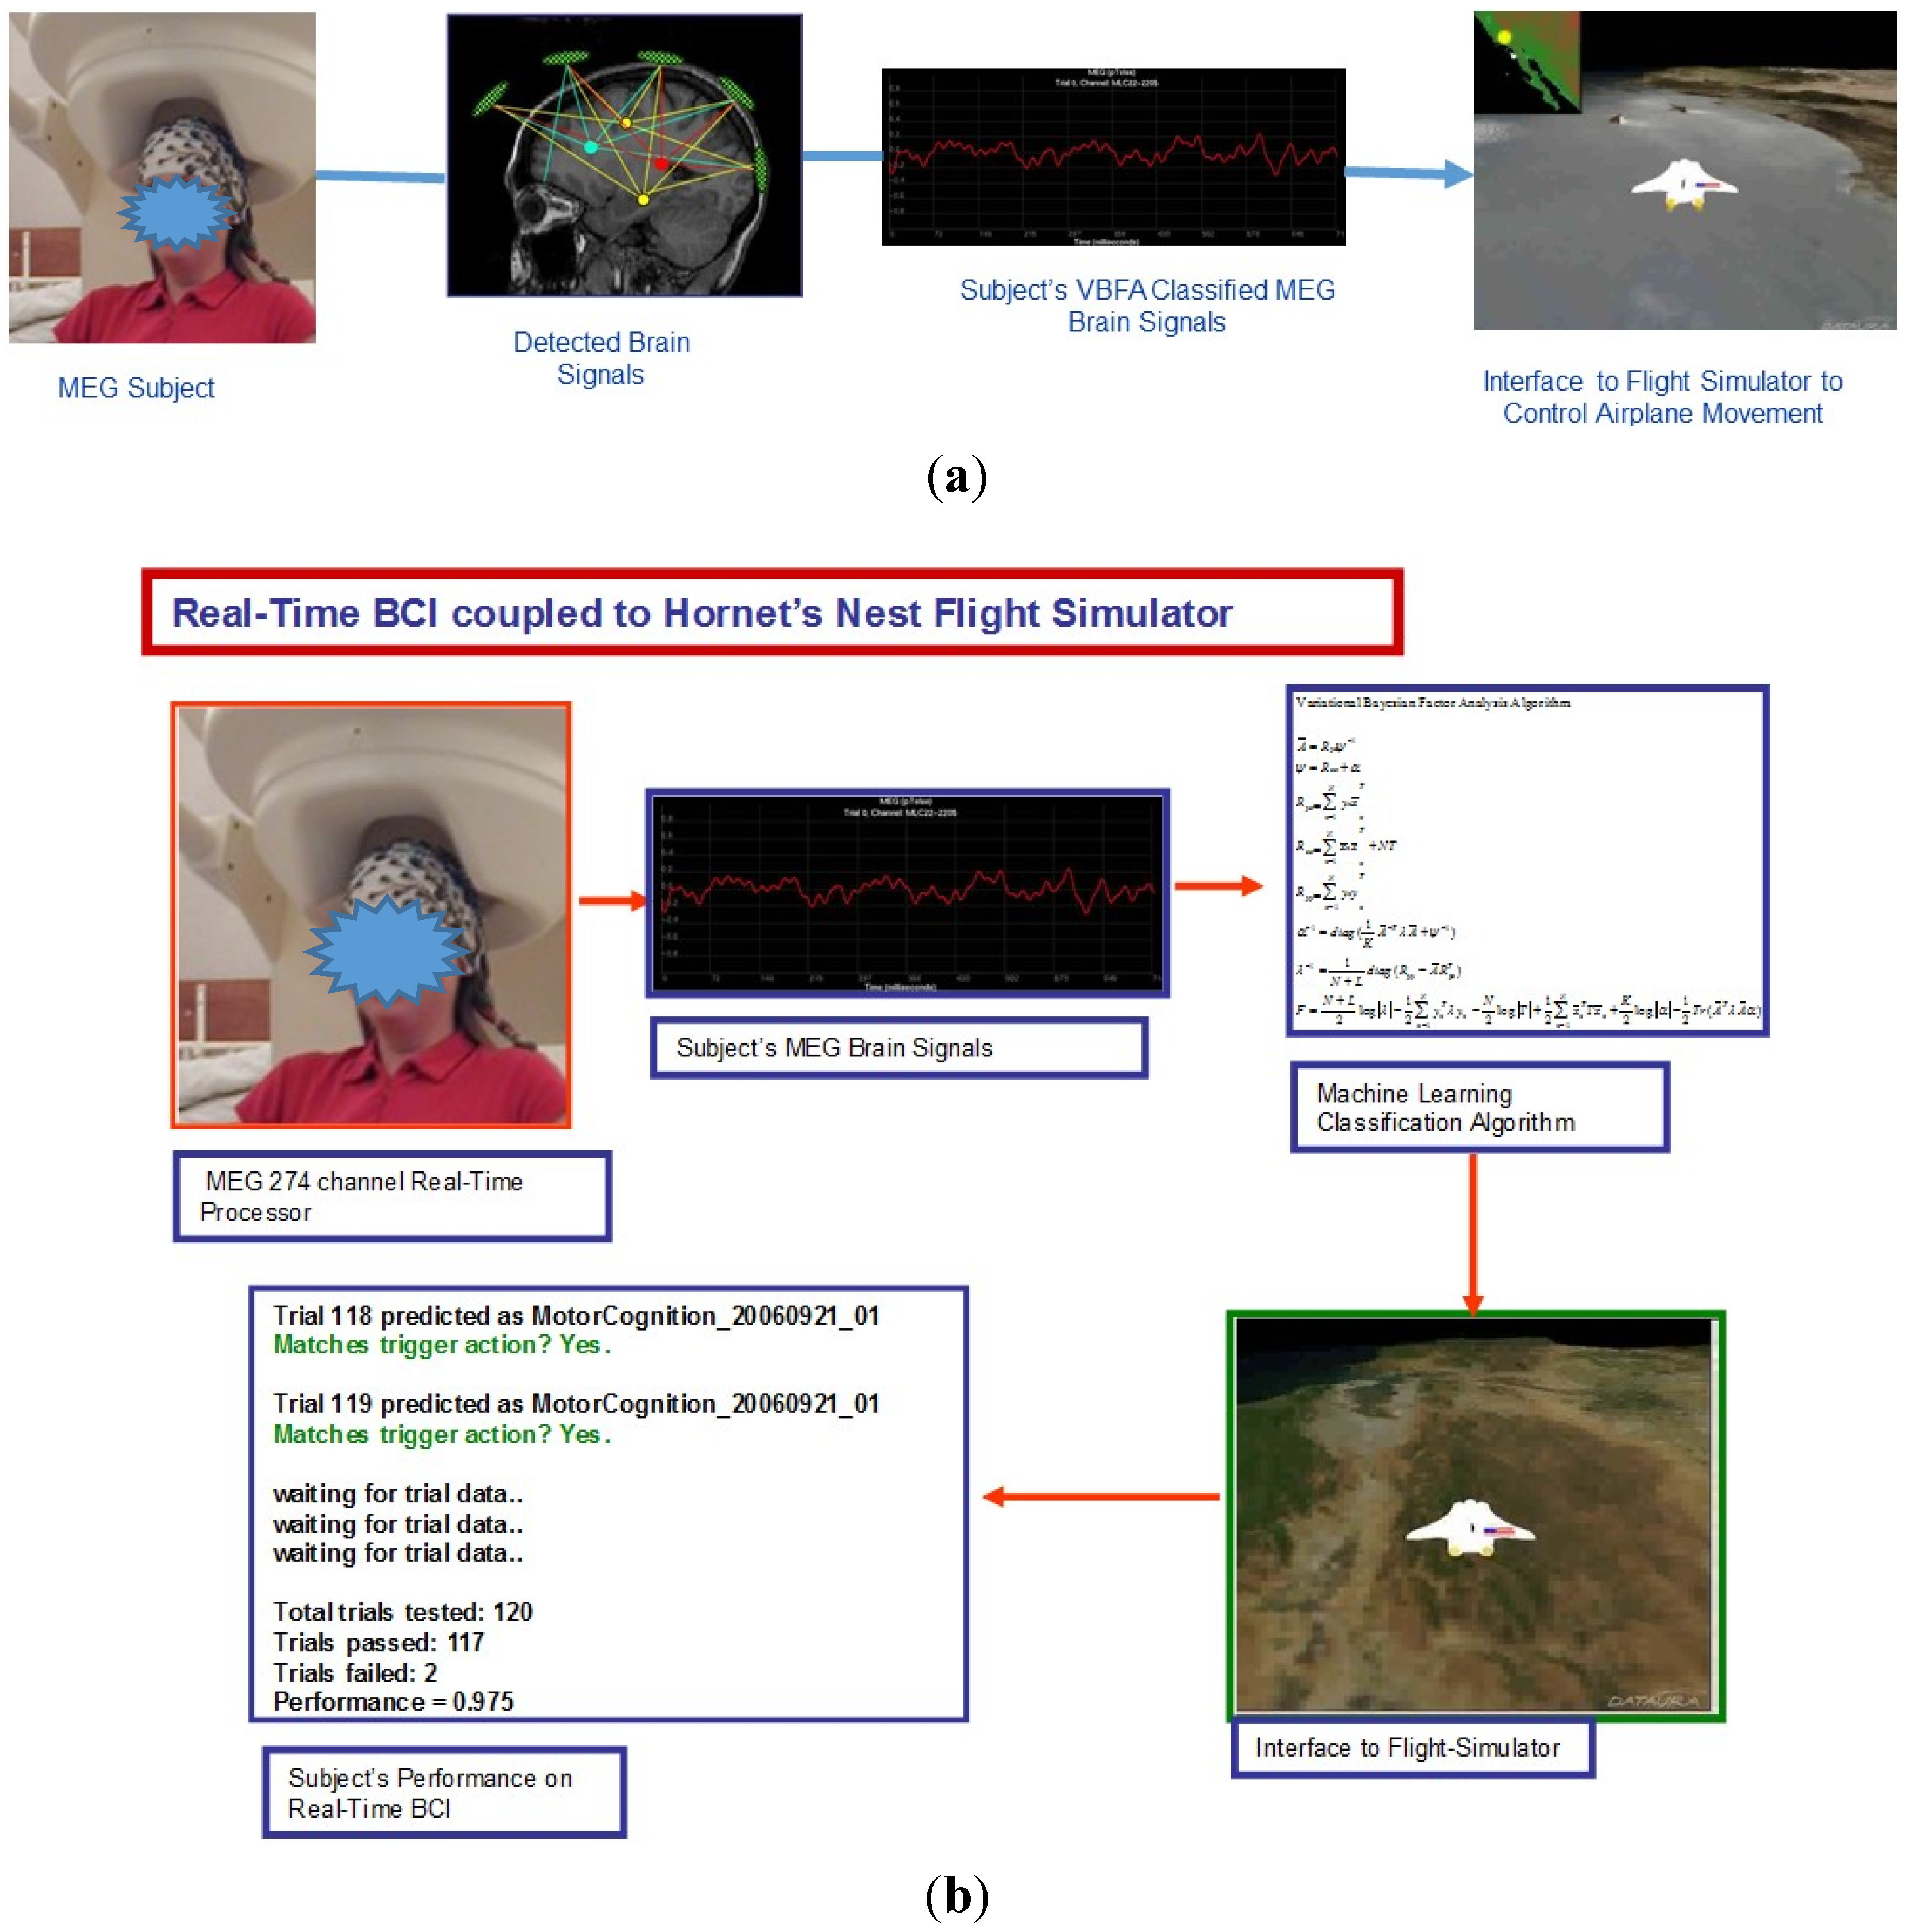
2.1. Brain-computer Interface Utilizing the VBFA Algorithm

2.2. Why Big Data Analysis for Healthcare and Brain-computer Interface Technology?
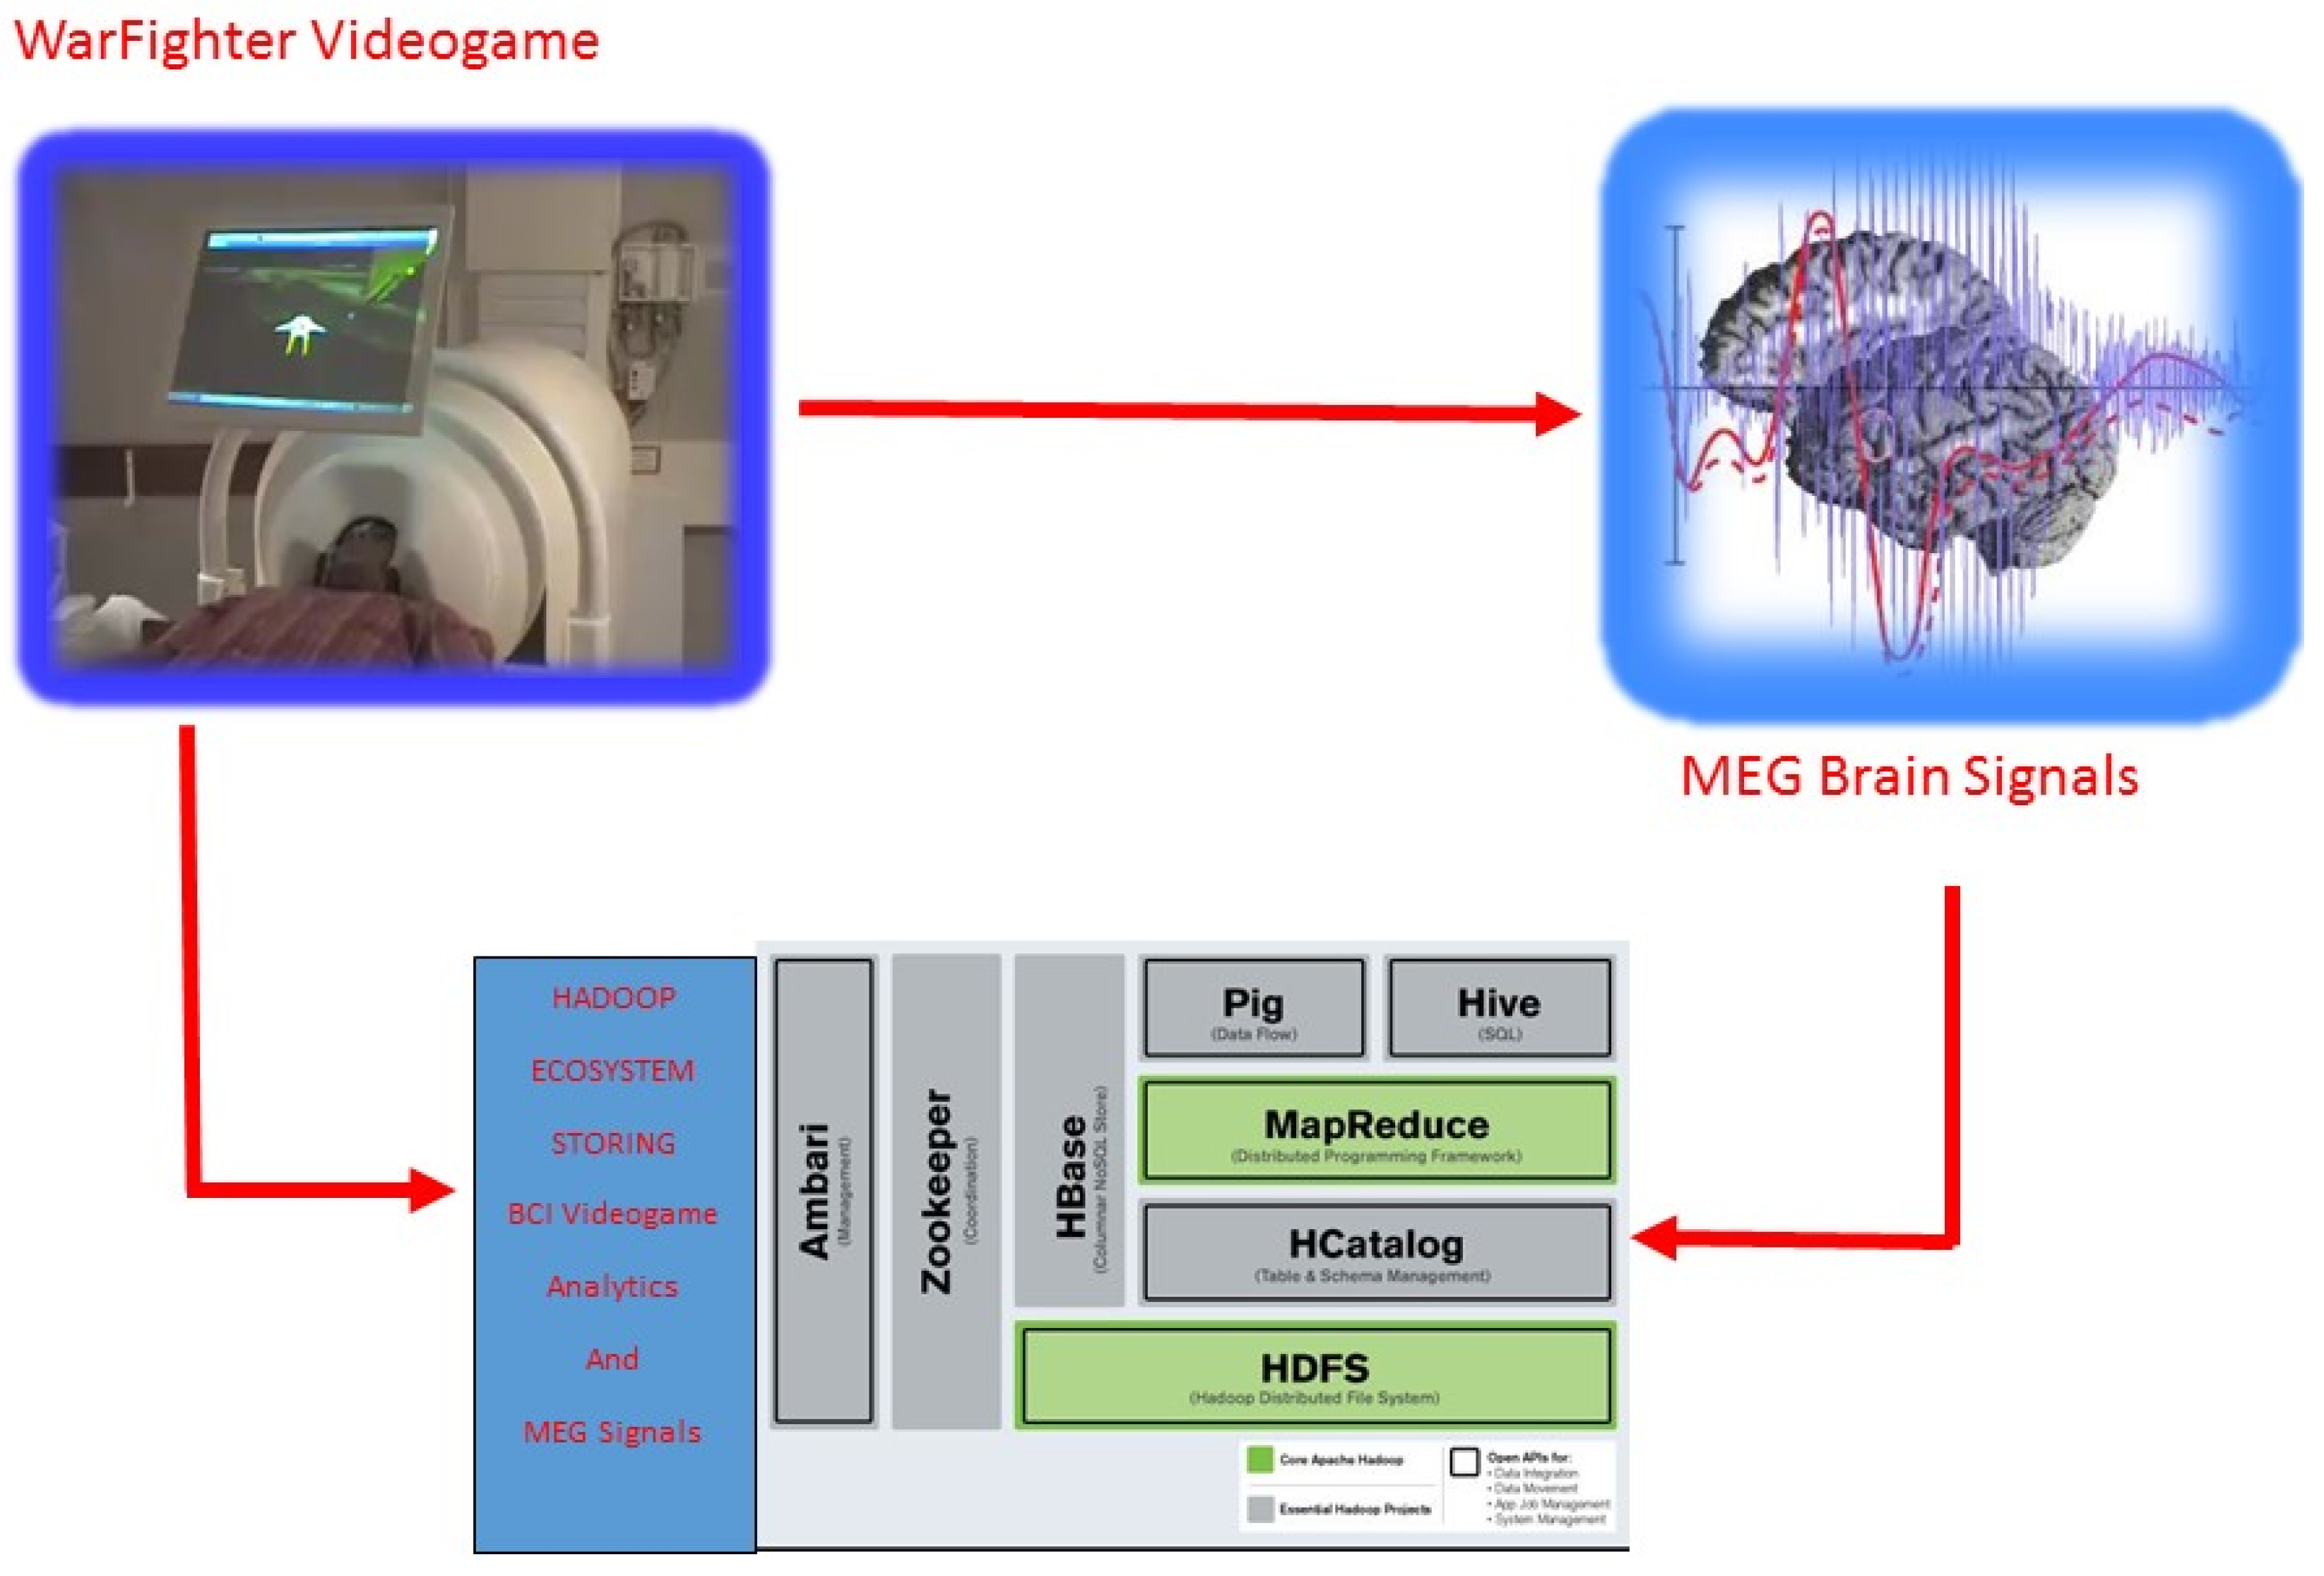
2.3. Hadoop Ecosystem
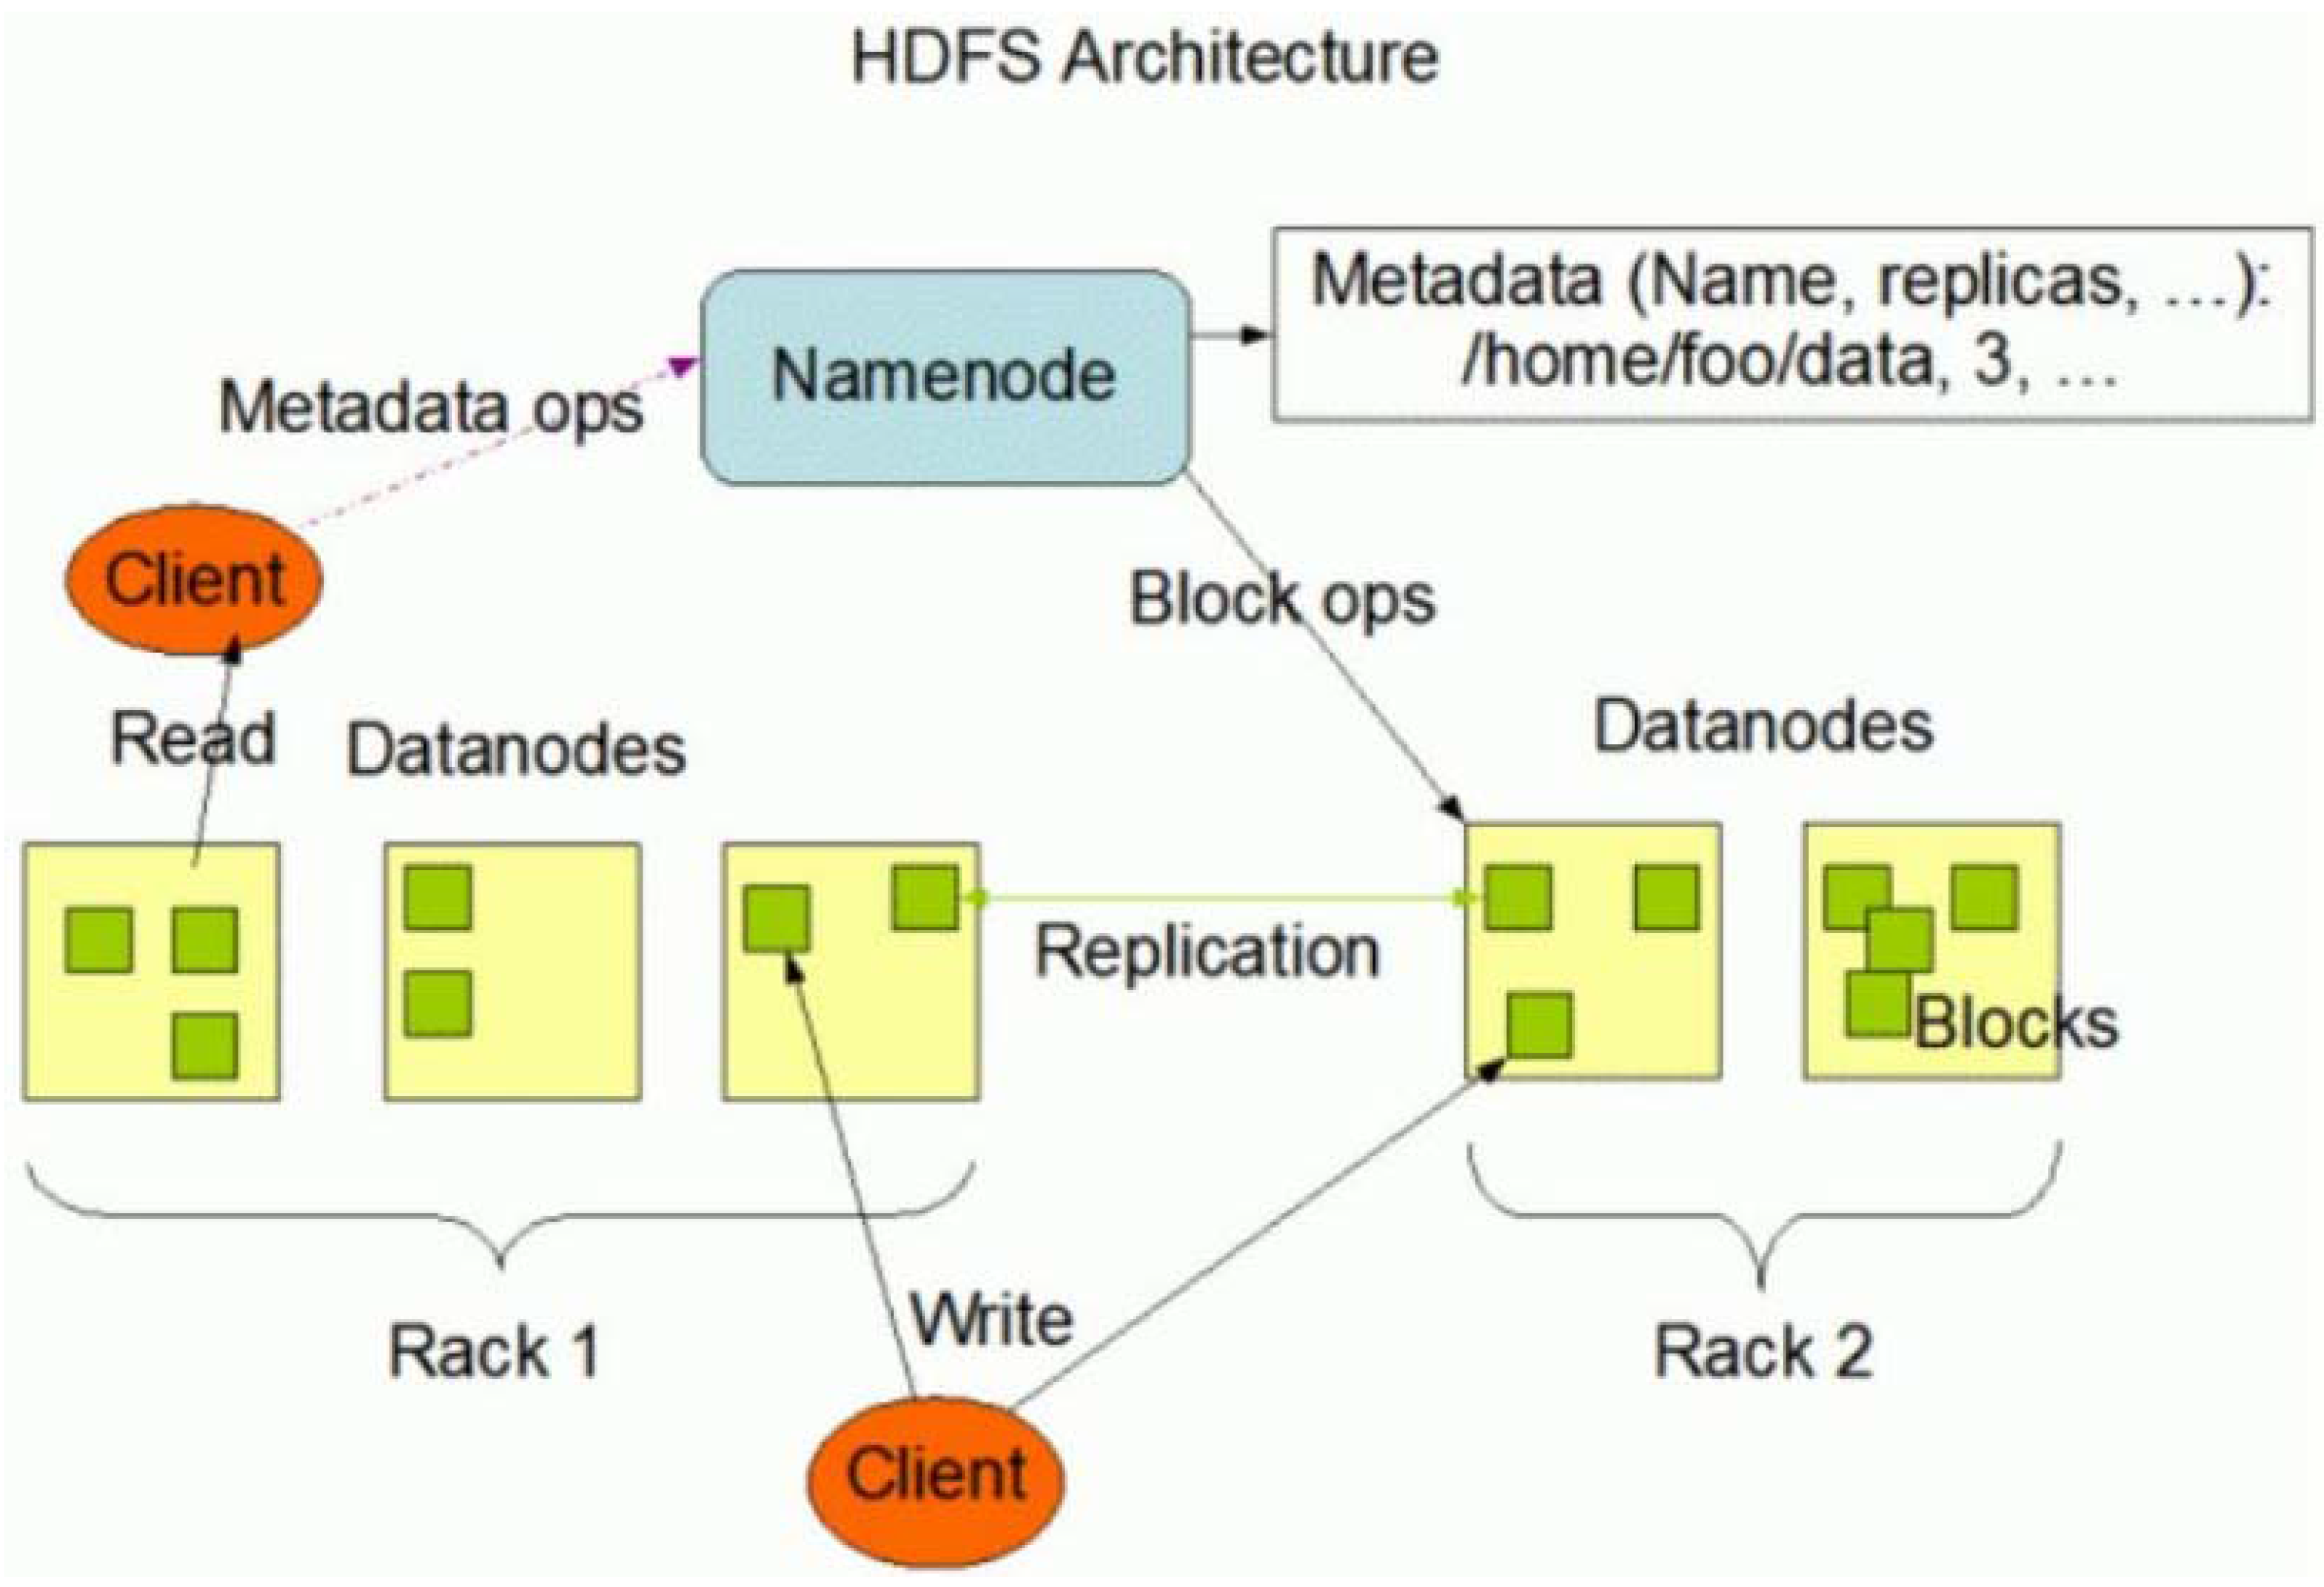
- Hadoop Distributed File System (HDFS)
- MapReduce
- HBase and Zookeeper
- Pig
- 1.)
- The Hadoop Distributed File System (HDFS) is a way to store and analyze large static data files across multiple machines as opposed to a single machine holding the entire disk capacity of the aggregated files. HDFS uses data replication and distribution of the data and is created to be fault-tolerant. A file is loaded into HDFS and is replicated and split into units called blocks, which are typically 64 MB of data and processed and stored across a cluster of nodes or machines called DataNodes. HDFS uses the Master and Slave architecture where the Master (NameNode) is responsible for management of metadata and execution of jobs to the DataNodes (Figure 5).
- 2.)
- MapReduce is a computational paradigm for parallel processing using two sequences of execution. First the map phase is a set of key-value pairs and the necessary function is executed over the key-value pairs to produce another interposed key-value pairs. The last application is the reduce phase where the interposed key-value pairs are aggregated by a key and the values are combined together to a final reduction output (Figure 6). In Hadoop, files are split using an input format. An input split is a byte-oriented view of a chunk of the file to be loaded by a map task. Using MapReduce for medical and sensory imaging is becoming a tool of choice, particularly because medical imaging is multi-dimensional data which MapReduce can logically split the data into records and input splits correctly [30,31].
- 3.)
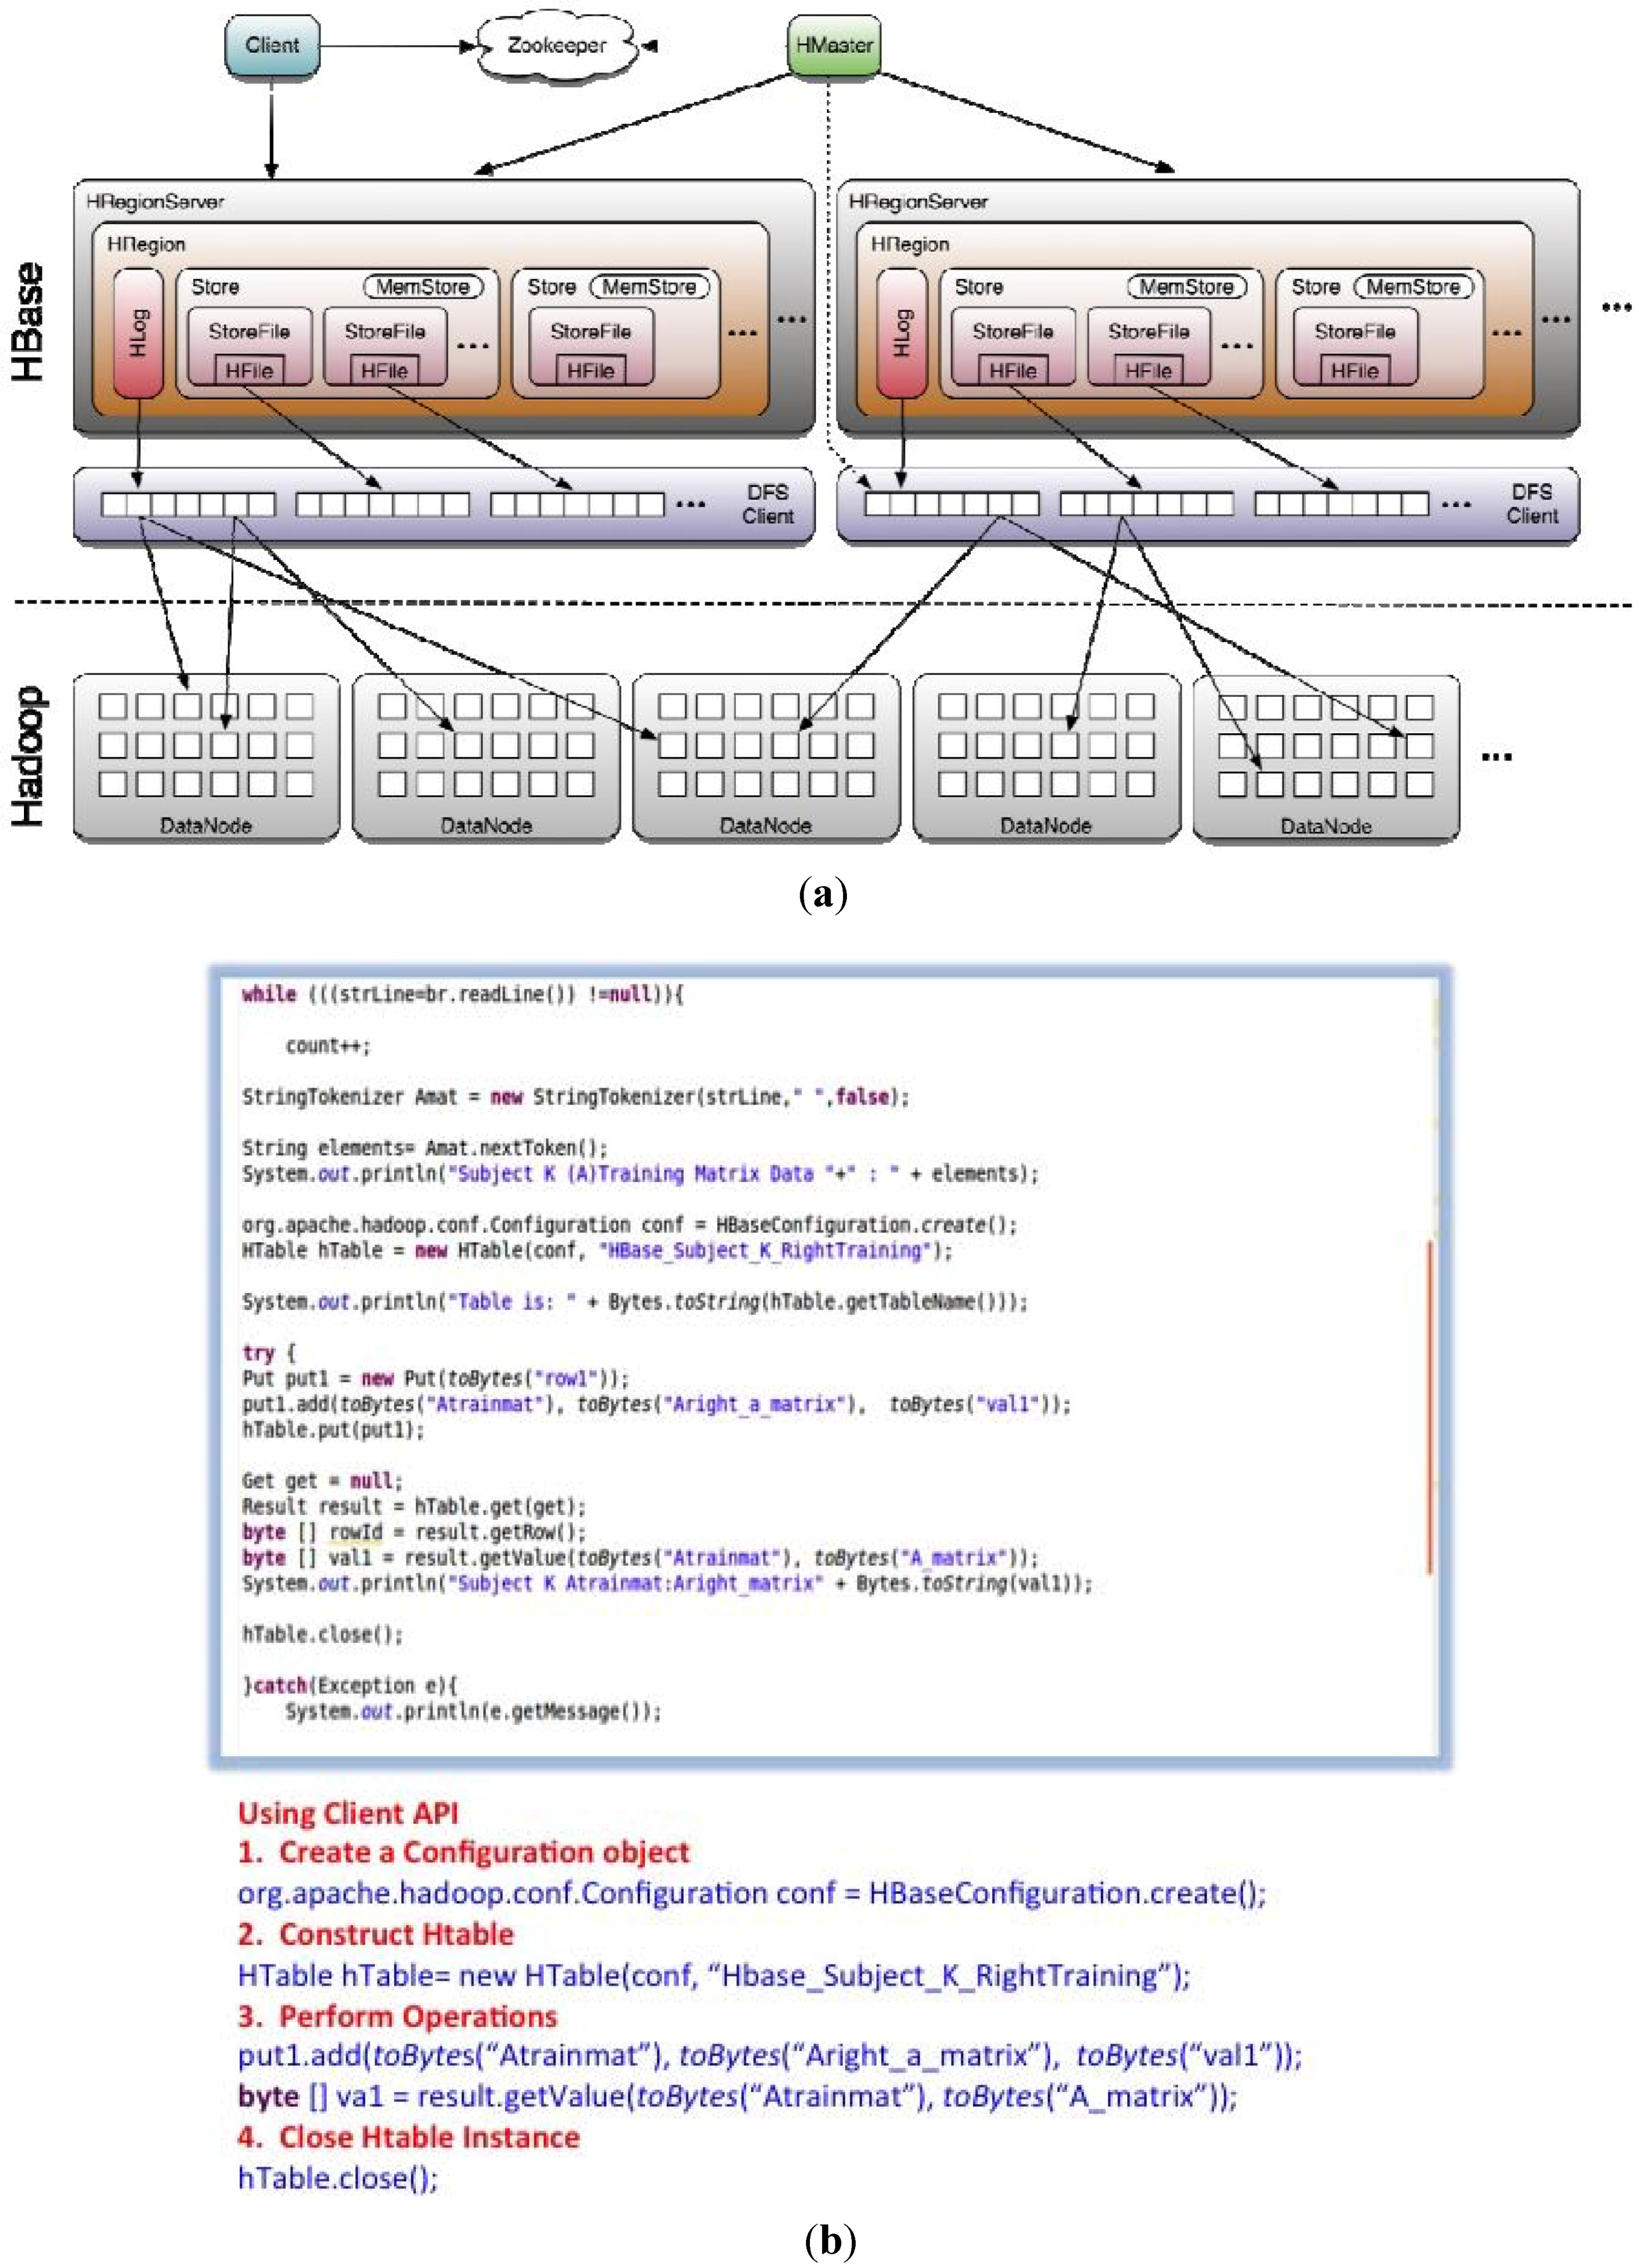
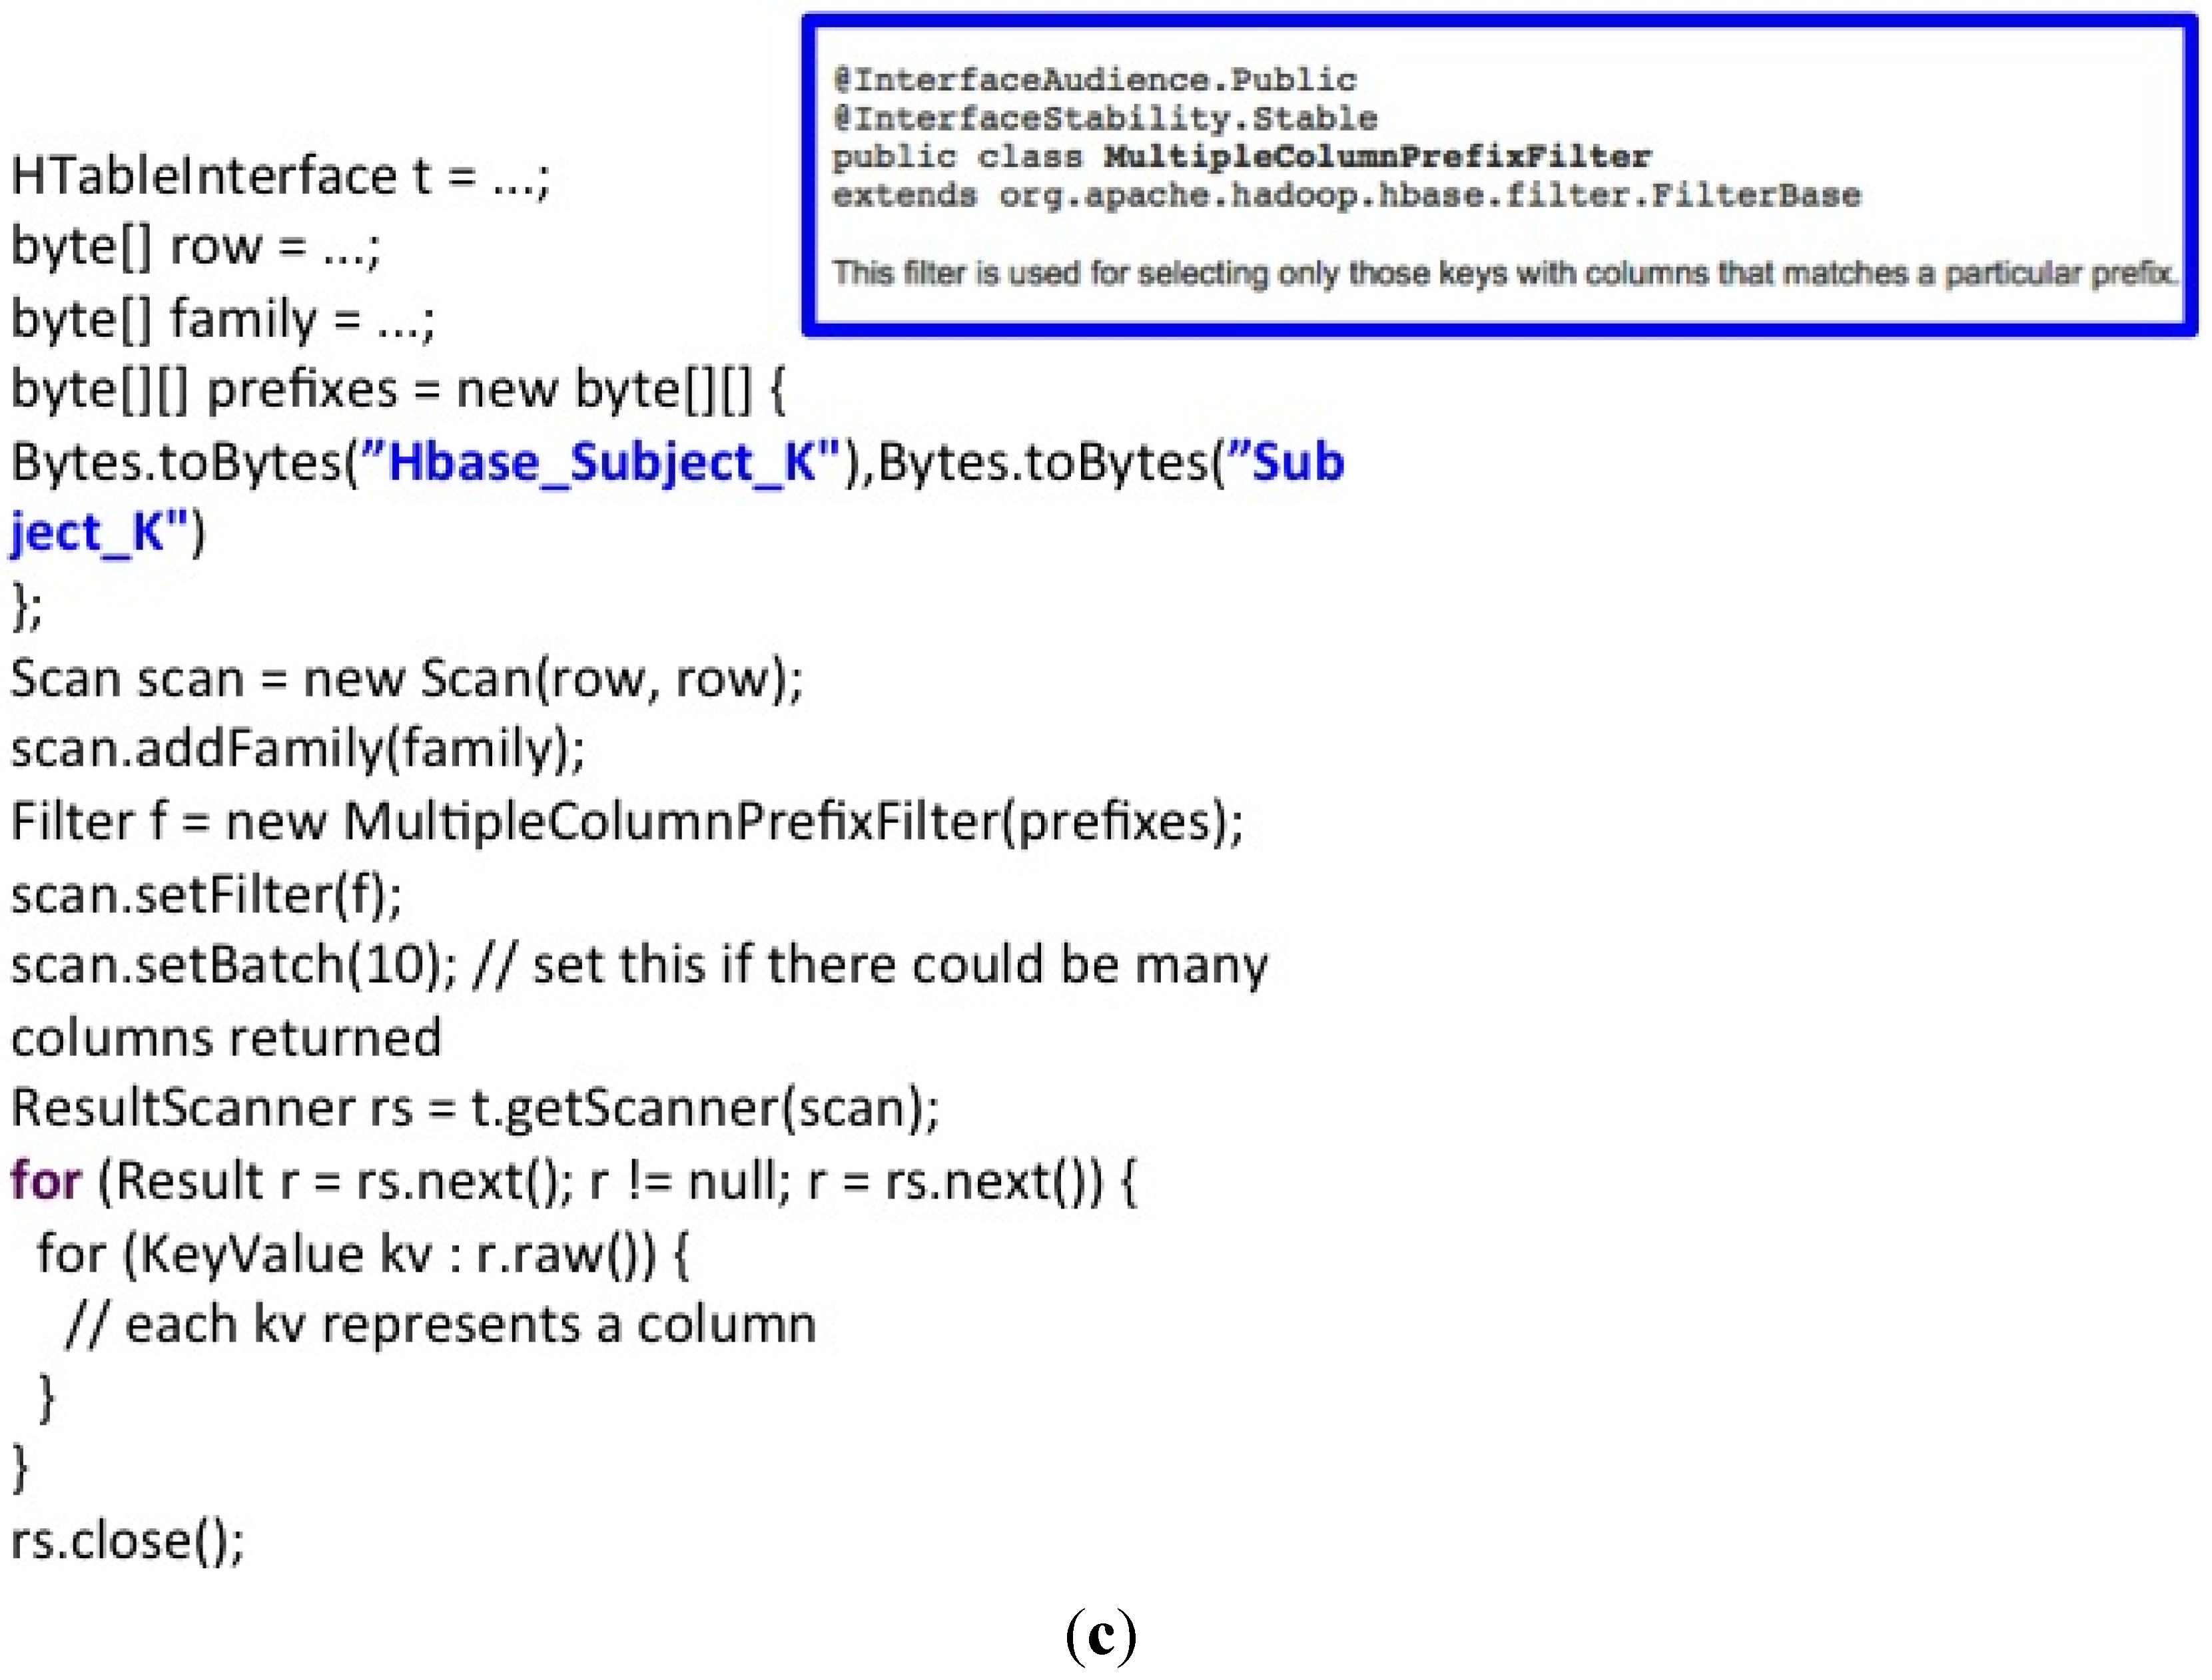
- HBase is a distributed column-oriented database built on top of HDFS to provide storage for Hadoop Distributed Computing using ZooKeeper as a service for maintaining configuration information of the HRegionServers shown in Figure 7a, based on a “master” and “slave” node architecture.


- 4.)
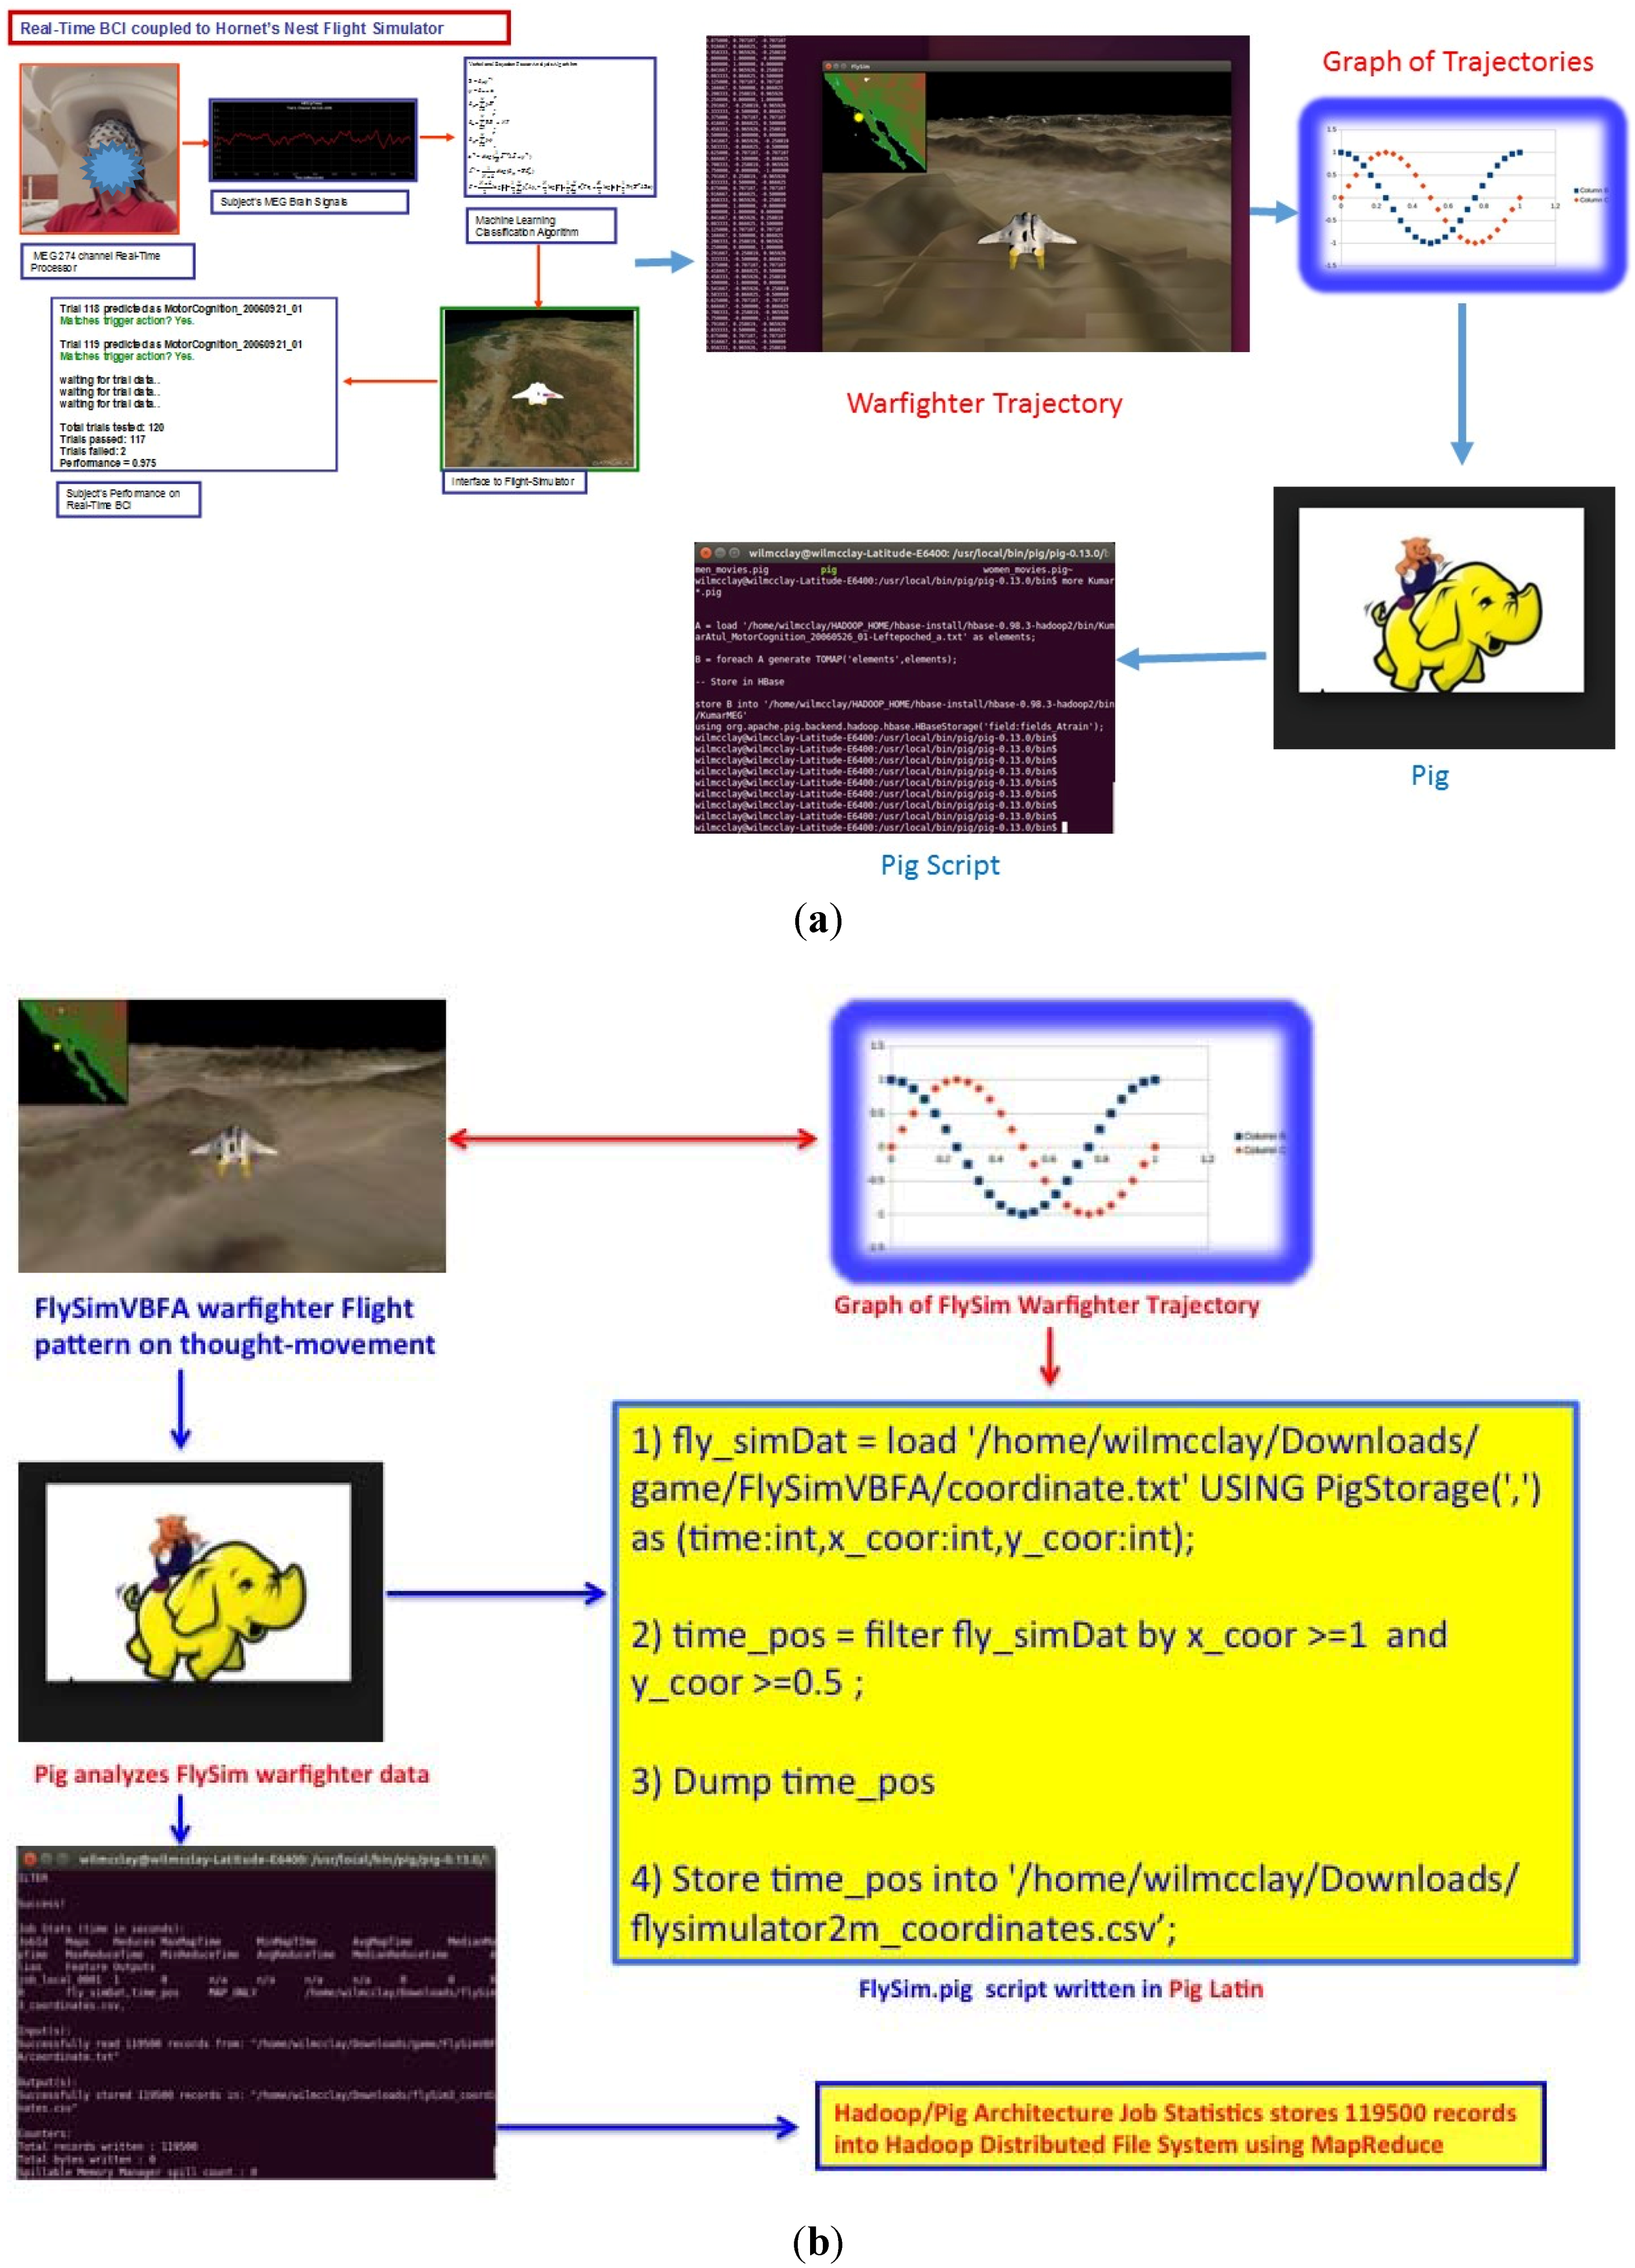
- Pig is a simple-to-understand, novel, and elegant data flow language used in the analysis of large data sets. Additionally, Pig is a higher-layer of abstraction of MapReduce and the Pig system deciphers the higher-level language into a sequence of MapReduce jobs [30]. The benefits of using Apache Pig is its ease and applicability to analyzing unstructured data, for instance MEG SQUID sensors which can fail during real-time processing while playing the BCI warfighter simulator. Moreover, in Figure 8, we used Pig for ETL (Extraction Transformation Load) processing of videogame analytics as an underpinning of Pig exemplary power as a data flow-language.
- 1)
- fly_simDat = load “/home/wilmcclay/Downloads/game/FlySimVBFA/coordinate.txt” USING PigStorage(“,”) as (time:int,x_coor:int,y_coor:int);
- 2)
- time_pos = filter fly_simDat by x_coor >= 1 and y_coor >= 0.5;
- 3)
- DUMP time_pos
- 4)
- Store time_pos into “/home/wilmcclay/Downloads/flysimulator2m_coordinates.csv”;
3. Results
4. Conclusions
Acknowledgments
Author Contributions
- Wilbert A. McClay (WAM) designed the system and performed all of the Java Coding in the Hadoop Ecosystem utilizing HBase for subject NoSql databasing and analysis, developed the Pig scripts, conducted the experiments, analyzed data and tested the VBFA algorithms, translated the Matlab code to C/C++ with Andy Haas, wrote the Lawrence Livermore National Laboratory TechBase grant to acquire funding for the Brain Computer Interface project, and wrote the Journal of Brain Sciences manuscript.
- Yusuf Ozbek assisted with Journal of Brain Sciences manuscript edits.
- Andy Haas and Nancy Yadav developed the Hornet’s Nest Flight Simulator videogame.
- Hagaii Attias is an expert in machine learning, developed, and designed the VBFA algorithms used in this paper.
- Srikantan S. Nagarajan is an expert in machine learning, developed, and designed and tested the VBFA algorithms used in this paper, designed and conducted the experiments analyzed initial datasets, acquired HIPAA approval with WAM for subject analysis, and assisted with Journal of Brain Sciences manuscript writing.
Conflicts of Interest
References and Notes
- Guger Technologies—g.tec Medical Engineering—g.MOBIlab Mobile Laboratories at Sierningstrasse 14, Schiedlberg, Österreich (Austria).g.tec developed the first commercially available BCI system in 1999 and now sells this system in more than 60 countries worldwide. Our products work with all major BCI approaches (motor imagery, P300, SSVEP and slow cortical potentials).
- Sekihara, K.; Sahani, M.; Nagarajan, S.S. A simple nonparametric statistical thresholding for MEG spatial-filter source reconstruction images. Neuroimage 2005, 27, 368–376. [Google Scholar] [CrossRef] [PubMed]
- Kaelber, D.; Pan, E.C. The value of personal health record (PHR) systems. AMIA Annu. Symp. Proc. 2008, 2008, 343–347. [Google Scholar]
- Attias, H. Independent factor analysis with temporally structured factors. Adv. Neural Inform. Process. Syst. 2000, 12, 386–392. [Google Scholar]
- Garrett, D.; Peterson, D.A.; Anderson, C.W.; Thaut, M.H. Comparison of linear, nonlinear, and feature selection methods for EEG signal classification. IEEE Trans. Neural Syst. Rehabil. Eng. 2003, 11, 141–144. [Google Scholar] [CrossRef] [PubMed]
- Muller, K.-R.; Anderson, C.; Birch, G. Linear and nonlinear methods for brain-computer interfaces. IEEE Trans. Neural Syst. Rehabil. Eng. 2003, 11, 162–165. [Google Scholar] [CrossRef] [PubMed]
- Nagarajan, S.S.; Attias, H.; Hild, K.; Sekihara, K. A graphical model for estimating stimulus-evoked brain responses from magnetoencephalography data with large background brain activity. Neuroimage 2006, 30, 400–416. [Google Scholar] [CrossRef] [PubMed]
- Attias, H. Planning by probabilistic inference. In Proceedings of the Ninth International Workshop on Artificial Intelligence and Statistics, Key West, FL, USA, 3–6 January 2003.
- Attias, H. Learning in high dimensions: Modular mixture models. In Proceedings of the Eighth International Workshop on Artificial Intelligence and Statistics, Key West, FL, USA, 4–7 January 2001; pp. 144–148.
- Hämäläinen, M.; Hari, R.; Ilmoniemi, R.J.; Knuutila, J.; Lounasmaa, O.V. Magnetoencephalography: Theory, instrumentation, and applications to noninvasive studies of the working human brain. Rev. Mod. Phys. 1993, 65, 413–497. [Google Scholar] [CrossRef]
- Wolpaw, J.; Birbaumer, N.; McFarland, D.; Pfurtscheller, G.; Vaughan, T. Brain-computer interfaces for communication and control. Electroencephalogr. Clin. Neurophysiol. 2002, 113, 767–791. [Google Scholar] [CrossRef]
- Chulis, K. Big Data Analytics for Video, Mobile, and Social Game Monetization: Understand and Influence Profitable Consumer Behavior; IBM Corporation: Armonk, NY, USA, 2012. [Google Scholar]
- Martin, S.; Wolfgang, R.; Martin, B. Adaptive SVM-Based Classification Increases Performance of a MEG-Based Brain-Computer Interface (BCI); Springer-Verlag: Berlin, Germany, 2012. [Google Scholar]
- Sekihara, K.; Hild, K.; Nagarajan, S.S. Influence of high-rank background interference on adaptive beamformer source reconstruction. In Proceedings of the International Conference for Bioelectromagnetism and Brain Electromagnetic Tomography and Non-invasive Functional Source Imaging, United States, April 2005.
- Suhail, K. Technical Seminar on “Emotiv Epoc/EEG/BCI”. Available online: http://www.slideshare.net/psycllone/emotiv-epoceegbci (accessed on 29 March 2011).
- Attias, H. ICA, graphical models, and variational methods. In Independent Component Analysis: Principles and Practice; Roberts, S., Everson, R., Eds.; Cambridge University Press: Cambridge, UK, 2001; pp. 95–112. [Google Scholar]
- Long, C.J.; Purdon, P.L.; Temereanca, S.; Desal, N.U.; Hamalainen, M.S.; Brown, E.N. State-space solutions to the dynamic magnetoencephalography inverse problem using high performance computing. Ann. Appl. Stat. 2011, 5, 1207–1228. [Google Scholar] [CrossRef] [PubMed] [Green Version]
- Wang, L.; Chen, D.; Ranjan, R.; Khan, S.U.; Kolodziej, J.; Wang, J. Parallel processing of massive EEG Data with MapReduce. In Proceedings of the IEEE 18th International Conference on Parallel and Distributed Systems, Singapore, 17–19 December 2012.
- Wang, Y.; Goh, W.; Wong, L.; Montana, G. Random forests on hadoop for genome-wide association studies of multivariate neuroimaging phenotypes. BMC Bioinform. 2013, 14 (Suppl. S16). [Google Scholar] [CrossRef] [PubMed]
- Mellinger, J.; Schalk, G.; Braun, C.; Preissi, H.; Rosenstiel, W.; Birbaumer, N.; Kubler, A. An MEG-based brain-computer interface (BCI). Neuroimage 2007, 36, 581–593. [Google Scholar] [CrossRef] [PubMed]
- Yuan, P.; Wang, Y.; Wu, W.; Xu, H.; Gao, X.; Gao, S. Study on an online collaborative BCI to accelerate response to visual targets. In Proceedings of the 34th Annual International Conference of the IEEE Engineering in Medicine and Biology Society (EMBC), San Diego, CA, USA, 28 August–1 September 2012; pp. 1736–1739.
- Georgopoulos, A.P.; Langheim, F.J.; Leuthold, A.C.; Merkle, A.N. Magnetoencephalographic signals predict movement trajectory in space. Exp. Brain Res. 2005, 167, 132–135. [Google Scholar] [CrossRef] [PubMed]
- Gross, J.; Ioannides, A.A. Linear transformations of data space in MEG. Phys. Med. Biol. 1999, 44, 2081–2097. [Google Scholar] [CrossRef] [PubMed]
- Lal, T.N.; Schröder, M.; Hill, N.J.; Preissl, H.; Hinterberger, T.; Mellinger, J.; Bogdan, M.; Rosenstiel, W.; Hofmann, T.; Birbaumer, N.; et al. A brain computer interface with online feedback based on magnetoencephalography. In Proceedings of the 22nd International Conference on Machine Learning, Bonn, Germany, 7–11 August 2005; pp. 465–472.
- Attias, H. A variational bayesian framework for graphical models. Adv. Neural Inform. Process. Syst. 2000, 12, 209–215. [Google Scholar]
- Wolpaw, J.; McFarland, D. Control of a two-dimensional movement signal by a noninvasive brain-computer interface in humans. Proc. Natl. Acad. Sci. 2004, 101, 17849–17854. [Google Scholar] [CrossRef] [PubMed]
- Millán, J.R.; Rupp, R.; Müller-Putz, G.R.; Murray-Smith, R.; Giugliemma, C.; Tangermann, M.; Vidaurre, C.; Cincotti, F.; Kübler, A.; Leeb, R.; et al. Combining brain-computer interfaces and assistive technologies: State-of-the-art and challenges. Front. Neurosci. 2010, 4, 1–15. [Google Scholar] [CrossRef]
- Smith, K.T. Big Data Security: The Evolution of Hadoop’s Security Model. Available online: http://www.infoq.com/articles/HadoopSecurityModel/ (accessed on 14 August 2013).
- Rodriguez, M. Big Graph Data on Hortonworks Data Platform. Available online: http://hortonworks.com/blog/big-graph-data-on-hortonworks-data-platform/ (accessed on 13 December 2012).
- Miner, D.; Shook, A. MapReduce Design Patterns; O’Reilly Media, Inc.: Sebastopol, CA, USA, 2012. [Google Scholar]
- Yu, H.; Wang, D. Research and implementation of massive health care data management and analysis based on hadoop. In Proceedings of the Fourth International Conference on Computational and Information Science, Chongqing, China, 17–19 August 2012.
- The Apache HBase Reference Guide, 2014 Apache Software Foundation. Available online: http://hbase.apache.org/book/client.filter.html (accessed on 31 August 2015).
- Poli, R.; Cinel, C.; Matran-Fernandez, A.; Sepulveda, F.; Stoica, A. Some Steps towards Realtime Control of a Space-craft Simulator via a Brain-computer Interface; Technical Report CES-525; University of Essex: Colchester, UK, 2012; pp. 1–23. [Google Scholar]
© 2015 by the authors; licensee MDPI, Basel, Switzerland. This article is an open access article distributed under the terms and conditions of the Creative Commons Attribution license (http://creativecommons.org/licenses/by/4.0/).
Share and Cite
McClay, W.A.; Yadav, N.; Ozbek, Y.; Haas, A.; Attias, H.T.; Nagarajan, S.S. A Real-Time Magnetoencephalography Brain-Computer Interface Using Interactive 3D Visualization and the Hadoop Ecosystem. Brain Sci. 2015, 5, 419-440. https://doi.org/10.3390/brainsci5040419
McClay WA, Yadav N, Ozbek Y, Haas A, Attias HT, Nagarajan SS. A Real-Time Magnetoencephalography Brain-Computer Interface Using Interactive 3D Visualization and the Hadoop Ecosystem. Brain Sciences. 2015; 5(4):419-440. https://doi.org/10.3390/brainsci5040419
Chicago/Turabian StyleMcClay, Wilbert A., Nancy Yadav, Yusuf Ozbek, Andy Haas, Hagaii T. Attias, and Srikantan S. Nagarajan. 2015. "A Real-Time Magnetoencephalography Brain-Computer Interface Using Interactive 3D Visualization and the Hadoop Ecosystem" Brain Sciences 5, no. 4: 419-440. https://doi.org/10.3390/brainsci5040419