Article

Cryoprotective Effects of Protein Hydrolysates Prepared from By-Products of Silver Carp (Hypophthalmichthys Molitrix) on Freeze-Thawed Surimi

1
Department of Food and Biological Engineering, School of Chemistry and Food Engineering, Changsha University of Science & Technology, Changsha 410114, China
2
Hunan Provincial Engineering Technology Research Center of Aquatic Food Resources Processing, Changsha 410114, China
*
Authors to whom correspondence should be addressed.
Appl. Sci. 2019, 9(3), 563; https://doi.org/10.3390/app9030563
Submission received: 13 December 2018 / Revised: 1 February 2019 / Accepted: 4 February 2019 / Published: 8 February 2019
(This article belongs to the Section Chemical and Molecular Sciences)

Abstract

:
The cryoprotective effects of different amounts of protein hydrolysates prepared from by-products of silver carp using Protamex and Alcalase on surimi that were subjected to six freeze-thaw cycles were investigated. Commercial cryoprotectant (8% w/w 1:1 sucrose-sorbitol blend, SuSo) and control (without cryoprotectant) groups were used for comparison. After six freeze-thaw cycles, the lowest actomyosin extractability, Ca2+-ATPase activity and total sulfhydryl content, along with the highest surface hydrophobicity of actomyosin, were observed in the control group (P < 0.05). On the contrary, the group with addition of 2 g of hydrolysate prepared by Protamex hydrolysis (PH-2) displayed the highest actomyosin extractability, Ca2+-ATPase activity and correspondingly, lowest surface hydrophobicity of actomyosin (P < 0.05). Total sulfhydryl content of actomyosin and textural properties of heat-set surimi gels were similar between samples with PH-2 and those with SuSo (P > 0.05). Differences in molecular weight distribution, total and free amino acid compositions between the hydrolysates prepared by Protamex and Alcalase hydrolysis were possible reasons attributing to their variable cryoprotective effects on freeze-thawed surimi. Results from this study clearly support that hydrolysate prepared by Protamex hydrolysis at an appropriate amount could serve as an effective cryoprotectant without increasing the sweetness of surimi products. Furthermore, our findings suggest that the hydrolysates follow a different cryoprotection mechanism compared to SuSo (sucrose-sorbitol blend).

1. Introduction

Annual global production of silver carp (Hypophthalmichthys molitrix) reaches about 4.9 million metric tons [1]. In China, silver carp is the most common carp species used in surimi processing, supporting an annual consumption of about 3.5 million metric tons. Due to the bony nature of silver carp [2], about 2.1 to 2.5 million metric tons of by-products, containing about 20–30% of protein, are produced during processing [3]. To maximize the potential values of the by-products and reduce environmental impact caused by wastes, various methods have been explored to efficiently recover valuable components from the by-products. For example, our previous studies have reported that protein hydrolysates of different structures and functional properties can be prepared by enzymatic hydrolysis of the by-products [4]. The resulting hydrolysates can be used to develop nutritional supplements, food additives, and oral liquids, etc.
Recently, other studies have demonstrated that protein hydrolysates could reduce deterioration in quality of fish surimi or mince during frozen storage or repeated freeze-thaw treatments [5,6,7,8,9,10,11,12,13]. Although frozen storage is often used to preserve fish product, protein aggregation and denaturation could still occur and lead to potential decrease in product quality. Peptides in protein hydrolysate could slow the formation of ice crystals, thereby contributing to structural stabilization of proteins during frozen storage [6]. Carbohydrate-based cryoprotectants such as sucrose-sorbitol blend (SuSo) though are commonly used to maintain the quality of commercial fish product during frozen storage, impart a sensorially unfavorable sweetness to the product, along with the added caloric and glycemic values. These limitations of using carbohydrate-based cryoprotectants could render the end products unsuitable for many consumers and people with dietary restrictions (such as diabetics) [5,14]. Therefore, protein hydrolysate is a preferred alternative cryoprotectant to SuSo, especially with its additional nutritional value (short peptides and free amino acids) in the absence of unwanted product sweetness and added caloric and glycemic value.
Our previous studies have indicated that the enzyme type employed, and the degree of hydrolysis are factors that determine the structures and functionalities of protein hydrolysates prepared from by-products of silver carp. It is possible to alter the specific process of enzymatic hydrolysis of by-products to meet different application needs [4]. To this date, there is limited information about the effectiveness of protein hydrolysates, prepared from by-products of silver carp, as potential cryoprotectant used in surimi products. In the present study, protein hydrolysates were prepared using commercial proteinase (Protamex, an enzyme mixture containing exo- and endopeptidases; Alcalase, endoprotease) based on our previous studies [4]. Degree of hydrolysis (DH), zeta potential value, molecular weight distribution, total and free amino acid compositions of the hydrolysates were examined; and then the potential cryoprotective effects of the hydrolysates on actomyosin samples extracted from freeze-thawed surimi and textural properties of the freeze-thawed surimi gels were evaluated.

2. Materials and Methods

2.1. Materials

By-products (fish meat leftovers on bones and heads) of silver carp were provided by Hunan Yiyang Yihua Aquatic Products Co., Ltd (Yiyang, Hunan, China, 2018). The by-products were ground into uniform substances with addition of ice cubes to keep the temperature at <10 °C. Then, the by-products were sealed in polyethylene bags and stored at −40 °C until use. Usually, the processed by-products were used within 24 h.
The enzymes, Protamex (enzyme activity of 120,000 U/g, from Bacillus sp) and Alcalase (enzyme activity of 200,000 U/g, from Bacillus licheniformis), were obtained from Novozymes China Inc. (Suzhou, Jiangsu, China, 2017). All other chemicals were of analytical grade.

2.2. Protein Hydrolysates Preparation

The ground by-products were defatted with isopropanol at 25 °C for 1 h at a ratio of 1:5 of raw material to solvent. The slurry was vacuum filtered, and the filter cake was air-dried at room temperature. The dried material was ground to pass 80 meshes and then hydrolyzed using the modified method described in our previous studies [4]. The defatted materials were suspended in distilled water at a 3% concentration (w/v). Protamex and Alcalase were added to the suspensions at 0.020 g of Protamex/g of substrate (enzyme/substrate was 2400 U/g) and 0.015 g of Alcalase/g of substrate (enzyme/substrate was 3000 U/g), respectively. The mixtures were incubated for 30 min (pH 7.0 and 50 °C for Protamex; pH 8.5 and 60 °C for Alcalase), and 1 mol/L NaOH was used to maintain a constant pH value during hydrolysis. After incubating at 90 °C for 10 min, the slurry was centrifuged at 10,000 g (10 min, 4 °C). The supernatants were dialyzed and freeze dried to give protein hydrolysates (the hydrolysates prepared by Protamex hydrolysis, PH; the hydrolysates prepared by Alcalase hydrolysis, AH).

2.3. Characterization of the Hydrolysates

2.3.1. DH

DH was confirmed using pH-stat method. The amount of 1 mol/L NaOH added to keep pH value constant during hydrolysis was recorded and DH was calculated as depicted in Equation (1) [15]. Three independent tests were performed to verify the DH value.
D H ( % ) = B × N b α × M p × h t o t × 100 %
where B is NaOH consumption in mL; Nb is NaOH concentration (1 mol/L); α is average degree of dissociation of α-NH3+; Mp is mass of protein (g, determined by Kjeldahl method, N × 6.25, AOAC 2000) [16] and htot is total number of peptide bonds in protein substrate, 7.2 mmol/gprotein for silver carp protein.

2.3.2. Zeta Potential

Zeta potential value of the hydrolysate (0.005%, w/v) was observed by a zeta potential instrument (Zetasizer 2000, Malvern, UK, 2013). The hydrolysates were dispersed in distilled water and filtered through cellulose acetate membranes of 0.45 μm (MilliporeSigma, Darmstadt, Germany, 2017) to remove insoluble particles before measurement. Each measurement was carried out for five times and average was recorded as the zeta potential value.

2.3.3. Molecular Weight Distribution

Molecular weight distribution of the hydrolysate (0.5%, w/v) was estimated with size exclusion chromatography. The hydrolysates were dispersed in 0.1 mol/L Na2SO4 in 0.1 mol/L phosphate buffer (pH 6.7) and filtered through cellulose acetate membranes of 0.45 μm (MilliporeSigma, Darmstadt, Germany, 2017) to remove insoluble particles before analysis. A Shimadzu HPLC (high performance liquid chromatography) system (Shimadzu China, Suzhou, Jiangsu, China, 2011) equipped with a TSK-gel G3000 PWXL column (Tosoh Corporation, Yamaguchi, Japan, 2017) and a Shimadzu ultraviolet detector (Shimadzu China, Suzhou, Jiangsu, China, 2011) were used. The hydrolysates were eluted by 0.1 mol/L Na2SO4 in 0.1 mol/L phosphate buffer (pH 6.7) at a flow rate of 1 mL/min and monitored at 220 nm at 25 °C. Average retention time of five standards (bovine serum albumin, peroxidase, ribonuclease A, glycine tetramer and p-Aminobenzoic acid) (Merck KGaA, Darmstadt, Germany, 2017) was used to obtain the molecular weight calibration curve of the column.

2.3.4. Amino Acid Composition

Total amino acid (TAA) and free amino acid (FAA) compositions were tested using an automatic amino acid analyzer (Hitachi L-8900, Tokyo, Japan, 2015). The hydrolysates were hydrolyzed in 6 mol/L HCl at 110 °C for 24 h for the measurement of TAAs. Tryptophan (Trp) was destroyed during HCl hydrolysis, therefore, the Trp content was not detected. FAA composition was determined by analysis of the hydrolysates without prior HCl hydrolysis.

2.4. Preparation of Freeze-Thawed Surimi for Cryoprotection Study

Fresh silver carps were scaled, beheaded, gutted, and then washed thoroughly. Fish meats were picked carefully and washed with two volumes of chilled water for two times. After centrifuging at 3000 g (5 min, 4 °C) to remove surface water, the meats were cut and minced at 4 °C for 1 min using a food processor (Kenwood FP580, Havant, UK, 2014). The resulting pastes were mixed with the hydrolysates to obtain the following samples: PH-2, PH-4 and PH-6 (100 g paste with addition of 2, 4, and 6 g PH, respectively); and AH-2, AH-4 and AH-6 (100 g paste with addition of 2, 4, and 6 g AH, respectively). SuSo (100 g paste added with 8 g commercial 1:1 sucrose-sorbitol blend) and control (100 g paste without cryoprotectant) samples were also prepared for comparison. All samples were prepared in triplicates and referred to as “surimi”. The samples were separated into two portions for unfrozen (analyzed immediately) and freeze-thaw treatments. The freeze-thaw treatments were carried out for six cycles (−25 ± 1 °C for 12 h and 4 ± 1 °C for 12 h per cycle).

2.5. Extraction of Actomyosin from Unfrozen and Freeze-Thawed Surimi

Actomyosin was extracted from unfrozen and freeze-thawed surimi using modified method described by Kittiphattanabawon et al. [9]. The hydrolysates or SuSo in each sample was removed before actomyosin extraction to avoid any interfering effects on our investigation. About 30 g of surimi was fully dispersed into ten volumes of chilled distilled water (4 °C) using a homogenizer (IKA T10, Königswinter, Germany, 2013) at a speed of 10,000 rpm/min (1 min, 4 °C). After centrifuging at 10,000 g (10 min, 4 °C), the obtained precipitate was homogenized with ten volumes of KCl (1.2 mol/L, pH 7.0) at a speed of 10,000 r/min (1 min, 4 °C). The extract was centrifuged at 10,000 g (10 min, 4 °C), and actomyosin in the supernatant was precipitated with three volumes of chilled distilled water. After centrifuging at 10,000 g (10 min, 4 °C), the precipitated actomyosin was collected and then thoroughly dispersed in chilled KCl (1.2 mol/L, pH 7.0) to give an actomyosin solution. The protein concentration of the solution was measured by Folin-phenol method [17] and the percentage of actomyosin concentration in sample after each freeze-thaw cycle to that in the initial unfrozen surimi was considered as actomyosin extractability.

2.6. Investigation of the Actomyosin Samples

2.6.1. Ca2+-ATPase Activity

The Ca2+-ATPase activity of actomyosin was tested with minor modifications based on method described by Wang et al. [18]. Each sample was diluted with ten volumes of 20 mmol/L phosphate buffer (pH 7.0, with KCl 0.6 mol/L), and Ca2+-ATPase measurement kits (Nanjing Jiancheng Bioengineering Institute, China) were used with a detection wavelength fixed at 636 nm.

2.6.2. Total Sulfhydryl Content

The total sulfhydryl content of actomyosin was determined using total sulfhydryl measurement kits (Nanjing Jiancheng Bioengineering Institute, Nanjing, Jiangsu, China, 2017). The detection wavelength was fixed at 412 nm.

2.6.3. Surface Hydrophobicity

The actomyosin surface hydrophobicity was observed using the method of Kato and Nakai [19]. The actomyosin was labeled with 1-anilino-8-naphthalene-sulfonate (ANS) before measurement. The detection excitation and emission wavelengths were fixed at 365 and 484 nm, respectively, to observe the relative fluorescence intensity (RFI) of the actomyosin using a fluorescence spectrophotometer (Hitachi F-7000, Tokyo, Japan, 2016). Surface hydrophobicity was obtained from the initial slope of the RFI versus actomyosin protein concentration (mg/mL) by linear regression analysis.

2.7. Texture Analysis of Heat-Set Unfrozen and Freeze-Thawed Surimi Gels

Each surimi sample was homogenized with 3% w/w of NaCl at 4°C and heated at 90 °C for 20 min in a water bath. Then the surimi gel was cooled to 20 °C using chilled water. The gel was placed overnight at 4 °C and then equilibrated for 1 h at 20 °C. A stainless steel mold (4 cm height × 3 cm diameter) was applied to cut the gel. Texture profile analysis (TPA) of the gel was performed on a texture analyzer (Stable Micro Systems TA.XTPlus, Surrey, UK, 2011) using a P/36R probe with a test speed of 1 mm/s. The gel was subjected to two-cycle compression at strain of 50%. A total of 10 replicates were tested for each sample. From the resulting curves, hardness, springiness, cohesiveness, and chewiness of the gel were determined.

2.8. Statistical Analysis

All experiments were conducted independently at least three times. Standard deviations of the data were obtained. One-way analysis of variance (ANOVA) using Duncan’s multiple-range test were carried out by SPSS 13.0 software (Statistical Program for Social Sciences Inc., Chicago, IL, USA, 2012) with significant differences at P < 0.05.

3. Results and Discussion

3.1. The Hydrolysates (PH and AH) Characterization

In this study, we used by-products of silver carp to produce hydrolysates. The yield of the hydrolysates prepared by PH was about 42.1% and the yield of the hydrolysates prepared by Alcalase hydrolysis was about 43.6%. Proximate composition of the defatted by-products and the hydrolysates are shown in Table 1.
DH values and zeta potential values of PH and AH are shown in Table 2. Zeta potential value is an indicator of the surface charge of the hydrolysate in solution, which can reflect the stability and possible binding ability of the hydrolysate to ice crystal and/or protein via hydrogen bond and electrostatic interaction [20]. Our previous studies have revealed that both Protamex and Alcalase are efficient enzyme choices for preparing hydrolysates from silver carp processing by-products. Although enzyme type employed could determine the hydrolysate structural properties [4], the differences in DH values and zeta potential values of the hydrolysates prepared by hydrolyzation of silver carp by-products for 30 min by both enzymes were not significant in the present study (P > 0.05).
Calibration curve of five standard substances on the TSK-gel G3000 PWXL column (Tosoh Corporation, Yamaguchi, Japan, 2017) is shown in Figure 1a. Molecular weight distribution results (shown in Figure 1b) indicated that PH and AH demonstrated a wide variation in molecular weight (Mw) of ≥7500, 2027, about 1420, 286–780 and ≤138 Da, respectively. Relative proportions (%) of each molecular weight are presented in Table 1. There were a small number of larger molecules (Mw ≥ 7500 Da) in PH and AH, about 7.7 ± 1.6 and 5.1 ± 0.9%, respectively. Larger molecules and their proportion in the hydrolysates are crucial factors that affect gelling properties [4]. PH contained peptides at Mw of 2027 Da, which was absent in AH, at a relative proportion that reached 32.6 ± 2.8%. Compared to PH, AH exhibited higher proportions of peptides at Mw of about 1420 and 286–780 Da (P < 0.05), which comprised of 50.6 ± 5.2% and 39.1 ± 2.6% of the hydrolysates, respectively. The difference in molecular weight distribution of PH and AH could be attribute to the varied specificities of Protamex and Alcalase for peptide bonds adjacent to certain amino acid residues. The results also indicated that short peptides constituted a dominant proportion in both PH and AH. The molecular weight of the hydrolysates or peptides, after being added to fish mince, showed significant impacts on the formation and growth of ice crystals in frozen mince, and on their interactions with fish myofibrillar proteins [5,6,21]. For example, short peptides can easily attach to the surface of ice and inhibit ice crystallization, therefore, acting as effective cryoprotective agents [22].

3.2. Amino Acid Analysis of PH and AH

Results from amino acid analysis of PH and AH are shown in Table 3. Both hydrolysates contained similar amounts of TAA. The total contents of charged and hydrophilic amino acid residues (including Glu, Asp, Lys, Pro, Gly, Ser, Thr, Arg, and His) in both hydrolysates were up to about 68% of the TAA contents, which were relative to ice affinity and cryoprotective activity of antifreeze proteins [23]. About 27% of acidic amino acid residues (Glu and Asp) were found in both hydrolysates. The relative content of Glu, which contains strongly polar hydroxyl groups that are favorable for cryoprotective properties, in both hydrolysates reached about 15% [21]. PH and AH were also rich in Pro residues (about 13%) which also contributed to ice affinity [23]. Sericin hydrolysates (molecular weight of less than 3 kD) with cryoprotective activity were also rich in the amino acids Ser, Asp, Gly, Thr and Glu [24]. In ice-binding proteins from arctic yeast, aligned Thr/Ser/Ala residues were found to be critical for binding of ice [25]. The content of basic amino acid (Lys) in both hydrolysates were about 9%, which enhanced the stability if hydrogen bonds between the hydrolysate and the ice crystal. The total content of hydrophobic amino acid residues (including Phe, Met, Leu, Ile and Val) in PH was a little higher than that in AH. Previous researchers have verified that hydrophobic amino acid residues in fish protein hydrolysate helped to retain textures, water-binding properties and proportion of unfrozen water of frozen fish mince [5]. FAA composition results of PH and AH indicated that PH had higher FAA content than AH due to the exo- and endo-protease property of Protamex. PH also contained significantly higher content of free Lys (P < 0.05), which has been reported to be cryoprotective [26]. Free Lys, combined with Arg, Asp and Glu, preferentially hydrated vulnerable proteins and bound free water, thereby enhancing cryoprotective abilities [26].

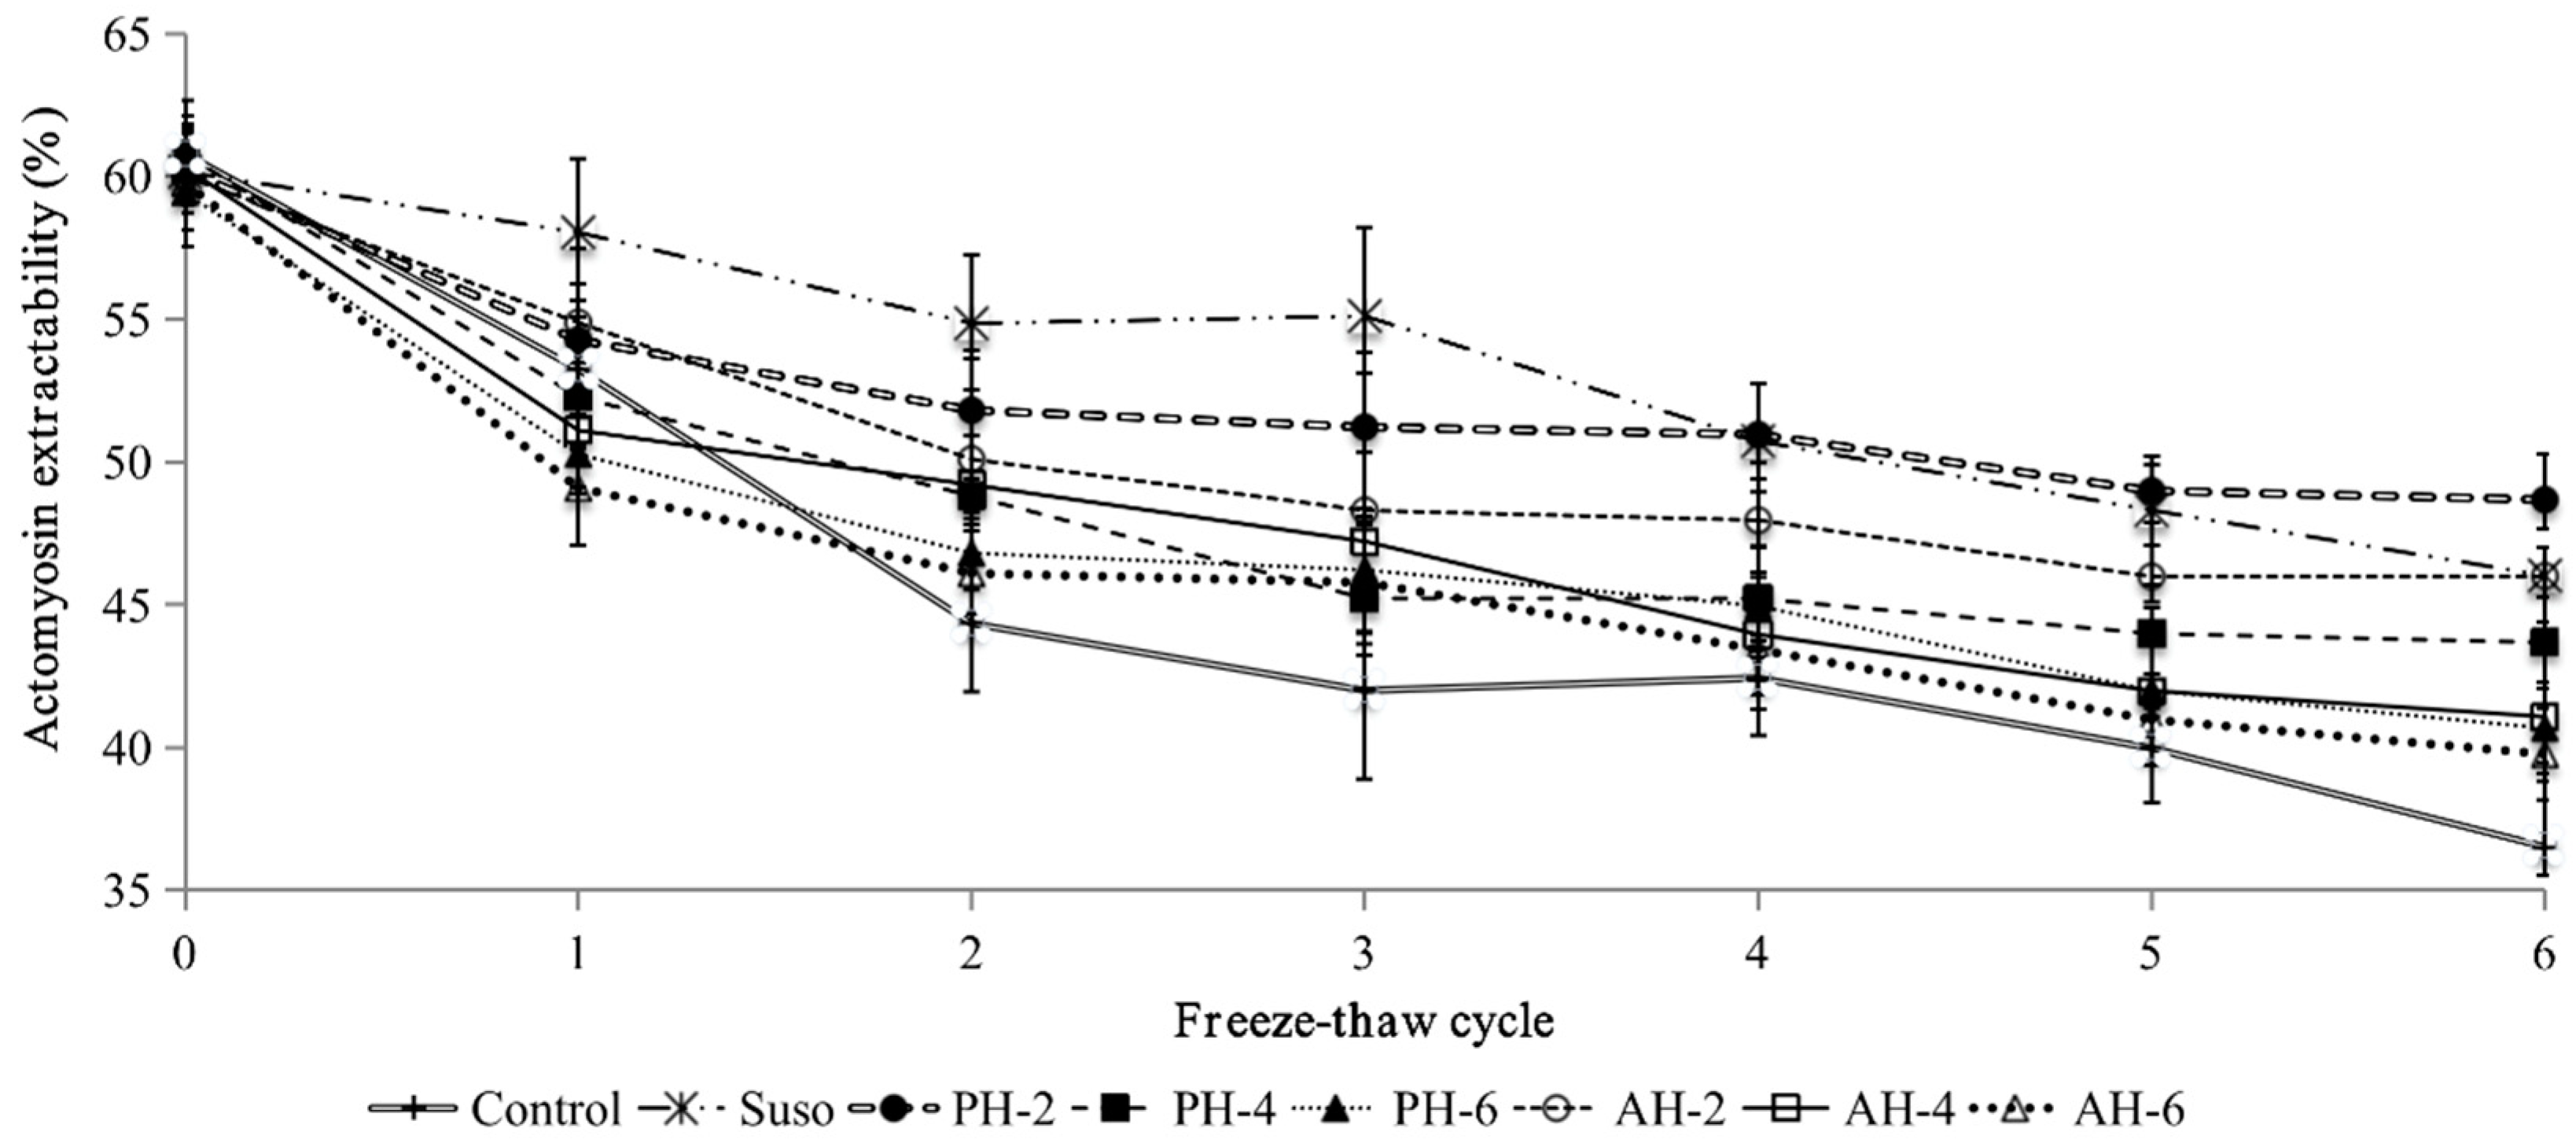
3.3. Actomyosin Extractability of Unfrozen and Freeze-Thawed Surimi

Actomyosin is the main constituent of fish muscle proteins. Frozen storage or freeze–thawing treatments could lead to the denaturation and aggregation of actomyosin. The resulting insoluble aggregates cannot be recovered in solutions [5]. The change in actomyosin extractability is shown in Figure 2. Actomyosin extractability of all tested samples decreased after freeze-thaw treatments. However, the actomyosin extractability of the control group decreased significantly faster than those of samples with hydrolysates and SuSo (P < 0.05), showing a 39.9% loss after six freeze-thaw cycles, while the actomyosin extractabilities of SuSo, PH-2, PH-4, PH-6, AH-2, AH-4, and AH-6 groups only decreased by 23.5, 19.2, 28.1, 31.6, 23.3, 31.9 and 33.5%, respectively. Among the treated groups, PH-2 displayed the best performance in preventing loss of actomyosin extractability (P < 0.05), which indicated that addition of hydrolysates, especially PH-2, as with commonly used commercial SuSo, can slow muscle protein denaturation and aggregation caused by temperature abuse during freeze-thaw treatments. The results are consistent with other studies on different cryoprotectants in surimi or fish-derived products, where the cryoprotectants that demonstrated greatest stabilizing effect could also improve myofibrillar protein recoveries [27,28].

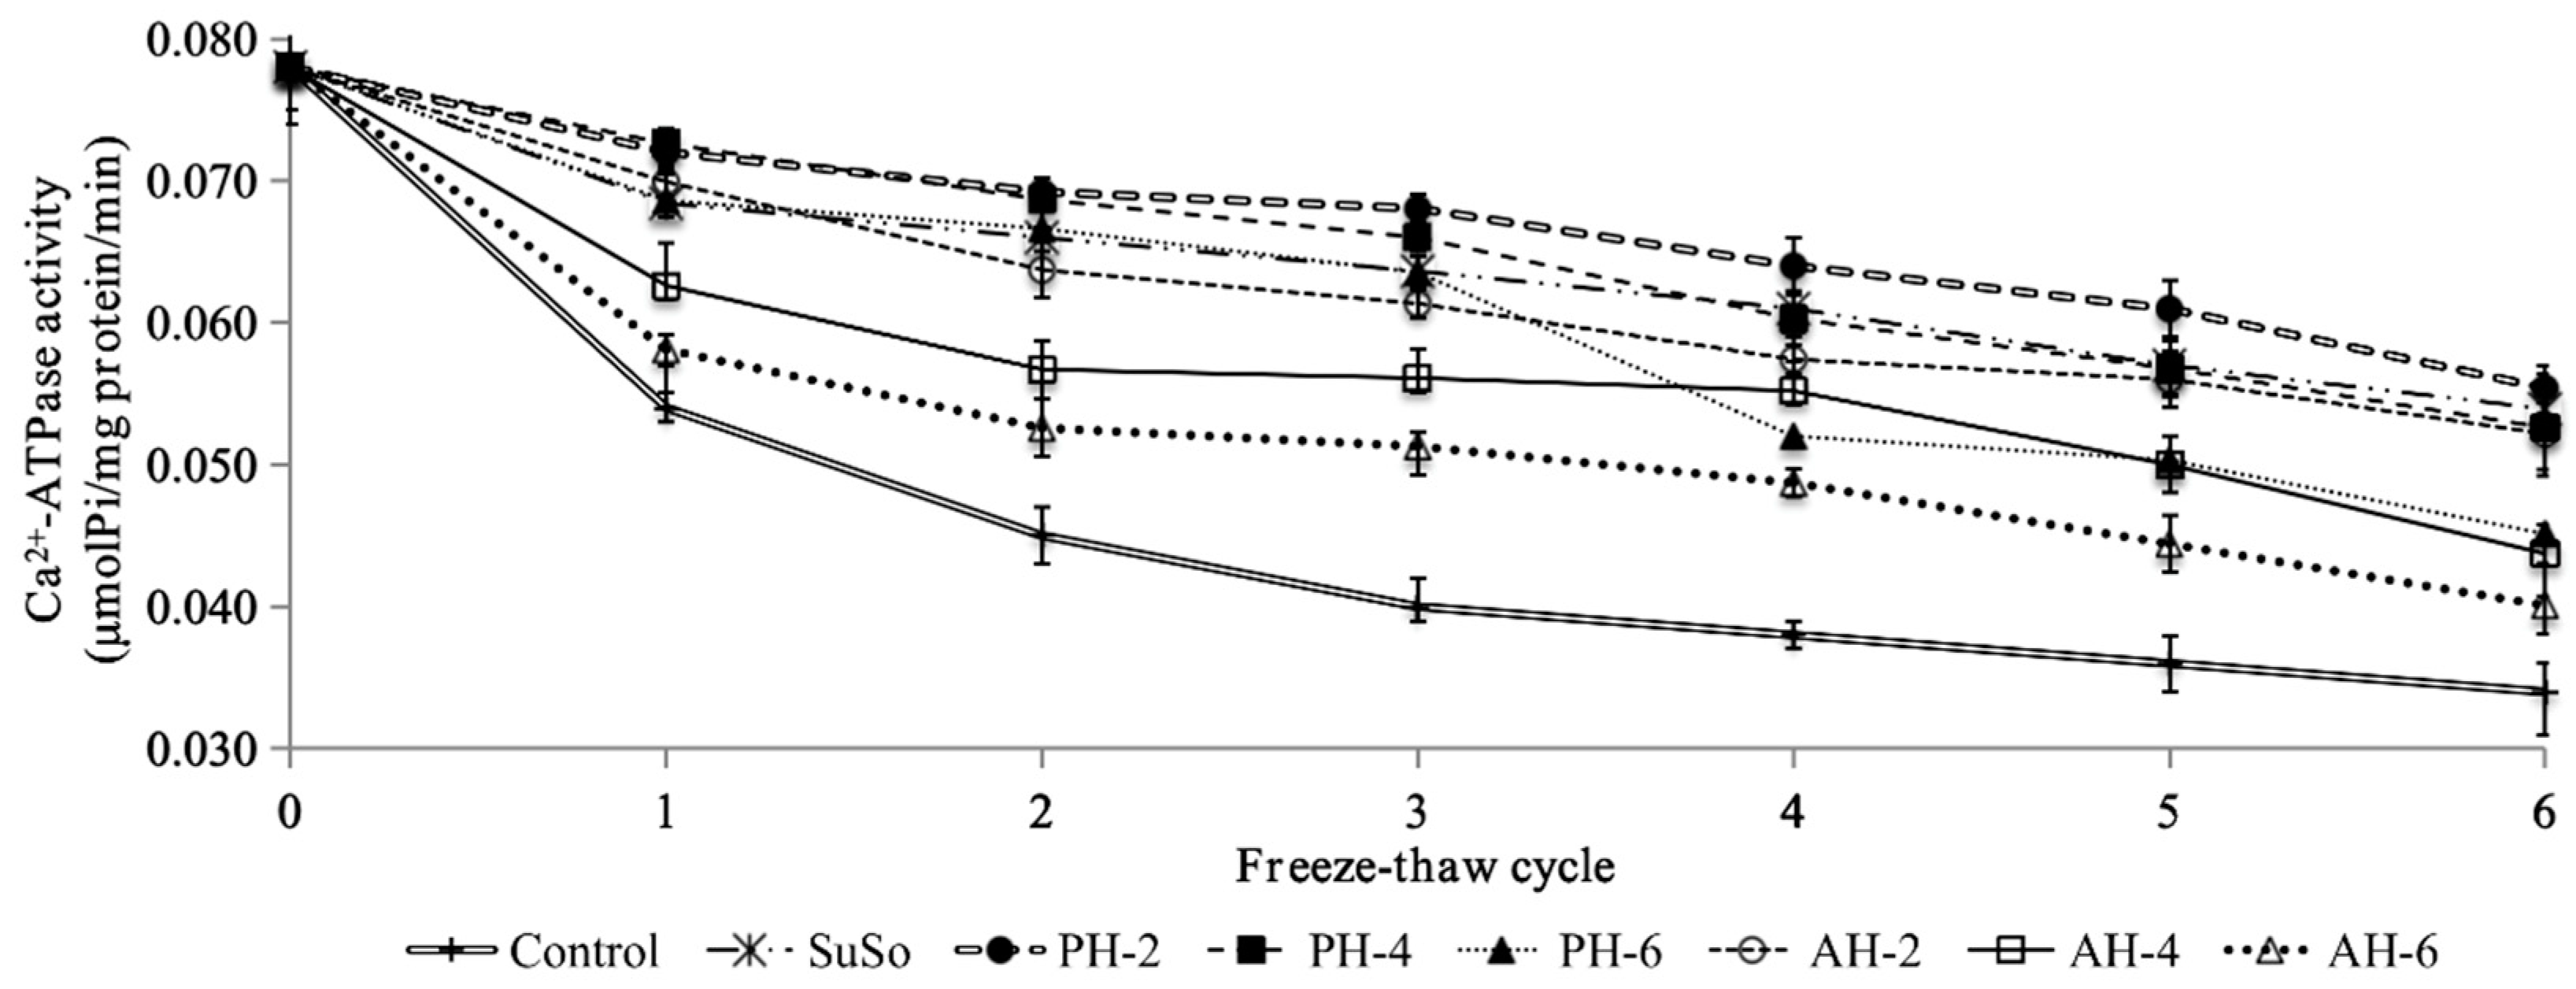
3.4. Actomyosin Ca2+-ATPase Activity

Myosin (combines with actin to form actomyosin) accounts for 50% of fish myofibrillar protein. The active site of Ca2+-ATPase is in the globular head of myosin [29]. Thus, the Ca2+- ATPase activity is a good indicator of the integrity of actomyosin molecule and protein freeze denaturation. As shown in Figure 3, decreases in actomyosin Ca2+-ATPase activity were observed in all samples, though the rates of reduction varied. In the control group, activity decreased rapidly at the initial stage and at a total reduction of 56.4% over six freeze-thaw cycles. The activities of the hydrolysate and SuSo groups were higher than that of the control group (P < 0.05), indicating that PH and AH could preserve Ca2+-ATPase activity, similar to SuSo. For the SuSo, PH-2, PH-4, PH-6, AH-2, AH-4, and AH-6 groups, the Ca2+-ATPase activity decreased by 30.6, 29.5, 31.9, 42.3, 32.3, 43.4 and 48.7%, respectively, after six freeze-thaw cycles. PH-2 group showed the slowest decreases in the Ca2+-ATPase activity (P < 0.05), which further indicated that PH-2 was possibly most effective in stabilizing protein structures during freeze-thaw treatments. The decrease in Ca2+-ATPase activity coincided with actomyosin extractability results. Additionally, the number of hydrolysates added to surimi was also important to prevent the reduction in Ca2+-ATPase activity. Interestingly, Korzeniowska et al. [14] found that addition of 8% w/w of Pacific hake protein hydrolysate was sufficient to prevent the structural changes of natural actomyosin during freeze-thaw treatments, while 2% w/w of hydrolysate did not reach the minimum level required for optimal cryoprotection, an observation that could potentially be attributed to differences in the nature of the hydrolysates. In the present study, higher amounts of hydrolysates could possibly influence the formation of stable structures of surimi, leading to increase in protein-protein interaction, ultimately inducing loss of Ca2+-ATPase activity. The results also suggested that the hydrolysates may interact with surimi proteins through a mechanism different from that of SuSo.

3.5. Total Sulfhydryl Content of Actomyosin

The change in total sulfhydryl content of actomyosin is shown in Figure 4. The control group showed 42.4% decrease in total sulfhydryl content of actomyosin by the second freeze-thaw cycle, and 52.7% decrease after six freeze-thaw cycles. While the total sulfhydryl contents of SuSo, PH-2, PH-4, PH-6, AH-2, AH-4, and AH-6 groups decreased rapidly over the first two freeze-thaw cycles, and then decreased slowly, by 38.4, 37.2, 44.6, 47.2, 42.9, 48.5 and 50.9%, respectively, after six freeze-thaw cycles. PH, SuSo, AH-2 and AH-4 groups exhibited noticeably slower decreases in the total sulfhydryl contents than that of the control group over six freeze-thaw cycles (P < 0.05), with PH-2 and SuSo groups showing the slowest reduction (P < 0.05). In unwashed fish mince, Amur sturgeon skin gelatin hydrolysate demonstrated protective effect toward the oxidation of the sulfhydryl groups induced by freeze–thawing [30]. Kittiphattanabawon et al. also found that gelatin hydrolysate could prevent sulfhydryl groups in surimi from oxidation after repeated freeze-thaw treatments [9]. Similarly, PH-2 can prevent myosin sulfhydryl groups (especially sulfhydryl groups in protein head region) from being oxidized by temperature abuse during freeze-thaw treatments and retard the decreases in Ca2+-ATPase activity (Figure 3).

3.6. Surface Hydrophobicity of Actomyosin

Surface hydrophobicity can also be an indicator of fish protein denaturation and aggregation in extracted actomyosin samples during freeze-thaw treatment. As shown in Figure 5, increased surface hydrophobicity of actomyosin was observed in all samples. However, in the PH, AH and SuSo groups, increase in surface hydrophobicity was retarded after six freeze-thaw cycles in comparison with a sharp increase in the control group (P < 0.05). Overall, the control group showed 245.7% increase in surface hydrophobicity of actomyosin by the second freeze-thaw cycle, and 320.2% increase after six freeze-thaw cycles. While the total increases in surface hydrophobicity of SuSo, PH-2, PH-4, PH-6, AH-2, AH-4, and AH-6 groups were 124.8, 110.4, 120.8, 284.5, 191.0, 274.8 and 323.5%, respectively. Low surface hydrophobicity referred to less hydrophobic binding of protein to fluorescent probes and possibly less protein denaturation [18]. Surface hydrophobicity changes in samples with hydrolysates were generally in agreement with the decreases in Ca2+-ATPase activity (Figure 3), with the PH-2 group displayed the lowest surface hydrophobicity (P < 0.05). In addition, the number of hydrolysates added to surimi also influenced the increases in surface hydrophobicity.
SuSo group exhibited continual increase in surface hydrophobicity throughout six freeze-thaw treatments. In the hydrolysate groups, after the initial increase, surface hydrophobicity sharply decreased after four freeze-thaw cycles and then increased further. Benjakul and Sutthipan had revealed that exposure of aliphatic and aromatic amino acid residues to protein molecular surface could lead to increases in surface hydrophobicity [31]. It is possible that during the freeze-thaw treatments, peptides and/or FAAs in the hydrolysates interact with actomyosin via hydrophobic interactions, inducing a decrease in surface hydrophobicity. Our findings also supported that the hydrolysates and SuSo might adopt different mechanisms of cryoprotection.

3.7. Textural Properties of Heat-Set Unfrozen and Freeze-Thawed Surimi Gels

In the present study, textural properties of the heat-set unfrozen and freeze-thawed surimi gels were characterized (results shown in Table 4). Addition of the hydrolysates and SuSo to the surimi led to an initial increase in hardness and chewiness of the resulting unfrozen gels, while springiness and cohesiveness of the samples were not affected before freeze-thaw treatment. After six freeze-thaw cycles, the textural properties of control sample exhibited a marked increase in hardness, springiness, cohesiveness, and chewiness. However, similar to addition of SuSo, incorporation of the hydrolysates (PH-2 and PH-4) to the surimi demonstrated protective effects on the textures of the heat-set gels against freeze-thaw abuse. The gels of freeze-thawed surimi containing SuSo, PH-2 and PH-4 did not show significant differences in textural properties compared to the gels prepared from unfrozen control, which suggested preservation of initial qualities of surimi gel. The AH-2 group showed similar hardness, chewiness, and cohesiveness, but not springiness, to the unfrozen control gel after freeze-thaw treatments. PH-6, AH-4, and AH-6 groups showed relatively significant changes in textural properties after freeze-thaw treatments. Therefore, addition of certain amount of the hydrolysates could slow surimi protein denaturation and decrease the degree of protein aggregation, leaving these proteins available for subsequent gel network formation during heat processing, and thus, improving the gel-forming capacity and textural structure of freeze-thawed surimi gels. Similar observations were also reported upon the addition of fish protein hydrolysate prepared from Pacific hake on natural actomyosin gel [14]. These results indicated that the hydrolysates could potentially be used to maintain product quality in terms of textural properties during temperature fluctuation abuse or frozen storage.
Our results demonstrated that PH are more effective in cryoprotection of the actomyosin samples than AH. Possible reasons were as follows: firstly, PH is comprised of more peptides with relatively higher molecular weight (2027 Da), which is not available in AH. Small molecular peptides in AH are preferentially concentrated in aqueous phases and therefore, may not be available to impede protein aggregations in the process of freeze-thaw treatments [9]; secondly, the contents of free Lys plus Arg, Glu and Asp in PH are much higher than those in AH (P < 0.05), resulting in PH being better at hydrating actomyosin and binding free water [26]; and, thirdly, PH contains relatively more hydrophobic amino acid residues than AH, which can provide remarkable cryoprotective abilities by maintaining textures of fish mince [5]; finally, the intrinsic structural properties of the hydrolysates, such as net terminal charge and terminal composition, are different between PH and AH due to differences in the enzyme type employed, which can possibly affect the cryoprotective effects of the hydrolysates [10]. Future research should aim to elucidate the influence of various peptide properties and amino acid compositions of the hydrolysates on the cryoprotective effects and mechanism.

4. Conclusions

Our study revealed that addition of PH-2 could effectively protect actomyosin samples extracted from freeze-thawed surimi, and heat-set surimi gels containing PH-2 presented comparable textures with gels using commercial cryoprotectant SuSo. The results clearly support that PH, at an appropriate amount, could be used as an effective cryoprotectant without increasing the sweetness of surimi products.
Furthermore, this study indicates that the hydrolysates may adopt a mechanism of cryoprotection different from that of SuSo. Our future research will focus on identifying the cryoprotective mechanism adopted by the hydrolysates.

Author Contributions

X.-H.L. and Y.-L.L. conceived and designed the studies; W.-J.Z. and F.-X.W. performed the experiments, analyzed the data and wrote the paper; J.Y. performed the size exclusion chromatograph and amino acid analyze testing.

Funding

The study obtained financial supports from National Natural Science Foundation of China (31571867 and 31101214) and Science Foundation of Hunan Province, China (2017JJ2269).

Conflicts of Interest

The authors declare no conflict of interest.

References

  1. FAO. FAO-Yearbook of Fishery Statistics: Aquaculture Production; Food and Agriculture Organization of the United Nations: Rome, Italy, 2016; p. 30. [Google Scholar]
  2. Paker, I.; Beamer, S.; Jaczynski, J.; Matak, K.E. Compositional characteristics of materials recovered from headed gutted silver carp (Hypophthalmichthys molitrix) by isoelectric solubilization and precipitation using organic acids. J. Food Sci. 2013, 78, E445–E451. [Google Scholar] [CrossRef]
  3. Torres, J.A.; Chen, Y.C.; Rodrigo-Garcia, J.; Jaczynski, J. Recovery of by-products from sea food processing streams. In Maximising the Value of Marine By-Products; Shahidi, F., Ed.; CRC Press: Boca Raton, FL, USA, 2007; pp. 65–90. [Google Scholar]
  4. Liu, Y.L.; Li, X.H.; Chen, Z.J.; Yu, J.; Wang, F.X.; Wang, J.H. Characterization of structural and functional properties of fish protein hydrolysates from surimi processing by-products. Food Chem. 2014, 151, 459–465. [Google Scholar] [CrossRef] [PubMed]
  5. Cheung, I.W.Y.; Liceaga, A.M.; Li-Chan, E.C.Y. Pacific Hake (Merluccius Productus) hydrolysates as cryoprotective agents in frozen Pacific Cod fillet mince. J. Food Sci. 2009, 74, C588–C594. [Google Scholar] [CrossRef] [PubMed]
  6. Damodaran, S. Inhibition of ice crystal growth in ice cream mix by gelatin hydrolysate. J. Agr. Food Chem. 2007, 55, 10918–10923. [Google Scholar] [CrossRef] [PubMed]
  7. Harnedy, P.A.; FitzGerald, R.J. Bioactive peptides from marine processing waste and shellfish: A review. J. Funct. Foods 2012, 4, 6–24. [Google Scholar] [CrossRef]
  8. Karnjanapratum, S.; Benjakul, S. Cryoprotective and antioxidative effects of gelatin hydrolysate from unicorn leatherjacket skin. Int. J. Refrig. 2015, 49, 69–78. [Google Scholar] [CrossRef]
  9. Kittiphattanabawon, P.; Benjakul, S.; Visessanguan, W.; Shahidi, F. Cryoprotective effect of gelatin hydrolysate from blacktip shark skin on surimi subjected to different freeze-thaw cycles. LWT Food Sci. Technol. 2012, 47, 437–442. [Google Scholar] [CrossRef]
  10. Mueller, J.P.; Liceaga, A.M. Characterization and cryoprotection of invasive silver carp (Hypophthalmicthys molitrix) protein hydrolysates. J. Aquat. Food Prod. T. 2014. [Google Scholar] [CrossRef]
  11. Nikoo, M.; Benjakul, S.; Ehsani, A.; Li, J.; Wu, F.F.; Yang, N.; Xu, B.C.; Jin, Z.Y.; Xu, X.M. Antioxidant and cryoprotective effects of a tetrapeptide isolated from Amur sturgeon skin gelatin. J. Funct. Foods 2014, 7, 609–620. [Google Scholar] [CrossRef]
  12. Wang, S.Y.; Zhao, J.; Chen, L.; Zhou, Y.F.; Wu, J.H. Preparation, isolation and hypothermia protection activity of antifreeze peptides from shark skin collagen. LWT Food Sci. Technol. 2014, 55, 210–217. [Google Scholar] [CrossRef]
  13. Wu, J.H.; Rong, Y.Z.; Wang, Z.W.; Zhou, Y.F.; Wang, S.Y.; Zhao, B. Isolation and characterisation of sericin antifreeze peptides and molecular dynamics modelling of their ice-binding interaction. Food Chem. 2015, 174, 621–629. [Google Scholar] [CrossRef]
  14. Korzeniowska, M.; Cheung, I.W.Y.; Li-Chan, E.C.Y. Effects of fish protein hydrolysate and freeze–thaw treatment on physicochemical and gel properties of natural actomyosin from Pacific cod. Food Chem. 2013, 138, 1967–1975. [Google Scholar] [CrossRef] [PubMed]
  15. Adler-Nissen, J. Enzymic Hydrolysis of Food Proteins, 1st ed.; Elsevier Applied Science Publishers: New York, NY, USA, 1986. [Google Scholar]
  16. AOAC. Official Methods of Analysis, 17th ed.; Association of Official Analytical Chemists: Gaithersburg, MD, USA, 2000.
  17. Lowry, O.H.; Rosebrough, N.J.; Farr, A.L.; Randall, R.J. Protein measurement with the folin phenol reagent. J. Biol. Chem. 1951, 193, 265–275. [Google Scholar] [PubMed]
  18. Wang, L.; Xiong, G.Q.; Peng, Y.B.; Wu, W.J.; Li, X.; Wang, J.; Qiao, Y.; Liao, L.; Ding, A.Z. The cryoprotective effect of different Konjac Glucomannan (KGM) hydrolysates on the glass carp (Ctenopharyngodon idella) myofibrillar during frozen storage. Food Bioprocess Tech. 2014, 7, 3398–3406. [Google Scholar] [CrossRef]
  19. Kato, A.; Nakai, S. Hydrophobicity determined by a fluorescence probe method and its correlation with surface properties of proteins. Biochim. Biophys. Acta 1980, 624, 13–20. [Google Scholar] [CrossRef]
  20. Gusev, A.; Zakharova, O.; Vasyukova, I.; Muratov, D.; Rybkin, I.; Bratashov, D.; Lapanje, A.; Il’inikh, I.; Kolesnikov, E.; Kuznetsov, D. Effect of GO on bacterial cells: Role of the medium type and electrostatic interactions. Mater. Sci. Eng. C. 2019. [Google Scholar] [CrossRef]
  21. Wang, W.L.; Chen, M.S.; Wu, J.H.; Wang, S.Y. Hypothermia protection effect of antifreeze peptides from pigskin collagen on freeze-dried Streptococcus thermophiles and its possible action mechanism. LWT Food Sci. Technol. 2015, 63, 878–885. [Google Scholar] [CrossRef]
  22. Kim, J.S.; Damodaran, S.; Yethiraj, A. Retardation of ice crystallization by short peptides. J. Phys. Chem. A. 2009, 113, 4403–4407. [Google Scholar] [CrossRef] [PubMed]
  23. Wu, J.H.; Zhou, Y.F.; Wang, S.Y.; Wang, Z.W.; Wu, Y.; Guo, X.Q. Laboratory-scale extraction and characterization of ice-binding sericin peptides. Eur. Food Res. Technol. 2013, 236, 637–646. [Google Scholar] [CrossRef]
  24. Li, L.; Wu, J.H.; Zhang, L.; Chen, X.; Wu, Y.; Liu, J.H.; Geng, X.Q.; Wang, Z.W.; Wang, S.Y. Investigation of the physiochemical properties, cryoprotective activity and possible action mechanisms of sericin peptides derived from membrane separation. LWT Food Sci. Technol. 2017, 77, 532–541. [Google Scholar] [CrossRef]
  25. Lee, J.H.; Park, A.K.; Do, H.; Park, K.S.; Moh, S.H.; Chi, Y.M.; Kim, H.J. Structural Basis for antifreeze activity of ice-binding protein from arctic yeast. J. Biol. Chem. 2012, 287, 11460–11468. [Google Scholar] [CrossRef] [PubMed]
  26. Chen, N.J.; Morikawa, J.; Hashimoto, T. Effect of amino acids on the eutectic behavior of NaCl solutions studied by DSC. Cryobiology 2005, 50, 264–272. [Google Scholar] [CrossRef] [PubMed]
  27. Badii, F.; Howell, N.K. Effect of antioxidants, citrate, and cryoprotectants on protein denaturation and texture of frozen cod (Gadus morhua). J. Agric. Food Chem. 2002, 50, 2053–2061. [Google Scholar] [CrossRef] [PubMed]
  28. Benjakul, S.; Visessanguan, W.; Thongkaew, C.; Tanaka, M. Comparative study on physicochemical changes of muscle proteins from some tropical fish during frozen storage. Food Res. Int. 2003, 36, 787–795. [Google Scholar] [CrossRef]
  29. Godiksen, H.; Hyldig, G.; Jessen, F. Sarcoplasmic reticulum Ca2+-ATPase and cytochrome oxidase as indicators of frozen storage in cod (Gadus morhua). J. Food Sci. 2003, 68, 2579–2585. [Google Scholar] [CrossRef]
  30. Nikoo, M.; Benjakul, S.; Xu, X.M. Antioxidant and cryoprotective effects of Amur sturgeon skin gelatin hydrolysate in unwashed fish mince. Food Chem. 2015, 181, 295–303. [Google Scholar] [CrossRef]
  31. Benjakul, S.; Sutthipan, N. Muscle changes in hard and soft shell crabs during frozen storage. LWT Food Sci. Technol. 2009, 42, 723–729. [Google Scholar] [CrossRef]
Figure 1. (a) Calibration curve of standard substances on TSK-gel G3000 PWXL column at 220 nm. The five standard substances were bovine serum albumin (67,000 Da), peroxidase (40,200 Da), ribonuclease A (13,700 Da), glycine tetramer (246 Da) and p-Aminobenzoic acid (137.14 Da), respectively; (b) Molecular weight distributions of PH (the hydrolysate prepared by Protamex hydrolysis) and AH (the hydrolysate prepared by Alcalase hydrolysis). PH and AH were eluted by 0.1 mol/L Na2SO4 in 0.1 mol/L phosphate buffer (pH 6.7) at a flow rate of 1 ml/min and monitored at 220 nm at 25 °C.
Applsci 09 00563 g001aApplsci 09 00563 g001b
Figure 2. The actomyosin extractability of surimi added with the hydrolysates during freeze-thaw cycles. SuSo (surimi added with sucrose-sorbitol blend); PH-2, PH-4 and PH-6 (surimi with addition of 2, 4, and 6 g of the hydrolysate prepared by Protamex hydrolysis, respectively); AH-2, AH-4 and AH-6 (surimi with addition of 2, 4, and 6 g of the hydrolysate prepared by Alcalase hydrolysis, respectively); and control (surimi without cryoprotectant). The reported data represent mean values from three replications. Bars represent standard deviations.
Applsci 09 00563 g002
Figure 3. Ca2+-ATPase activity of actomyosin from different surimi samples during freeze-thaw cycles. SuSo (surimi added with sucrose-sorbitol blend); PH-2, PH-4 and PH-6 (surimi with addition of 2, 4, and 6 g of the hydrolysate prepared by Protamex hydrolysis, respectively); AH-2, AH-4 and AH-6 (surimi with addition of 2, 4, and 6 g of the hydrolysate prepared by Alcalase hydrolysis, respectively); and control (surimi without cryoprotectant). The reported data represent mean values from three replications. Bars represent standard deviations.
Applsci 09 00563 g003
Figure 4. Total sulfhydryl content of actomyosin from different surimi samples during freeze-thaw cycles. SuSo (surimi added with sucrose-sorbitol blend); PH-2, PH-4 and PH-6 (surimi with addition of 2, 4, and 6 g of the hydrolysate prepared by Protamex hydrolysis, respectively); AH-2, AH-4 and AH-6 (surimi with addition of 2, 4, and 6 g of the hydrolysate prepared by Alcalase hydrolysis, respectively); and control (surimi without cryoprotectant). The reported data represent mean values from three replications. Bars represent standard deviations.
Applsci 09 00563 g004
Figure 5. Surface hydrophobicity of actomyosin from different surimi samples during freeze-thaw cycles. SuSo (surimi added with sucrose-sorbitol blend); PH-2, PH-4 and PH-6 (surimi with addition of 2, 4, and 6 g of the hydrolysate prepared by Protamex hydrolysis, respectively); AH-2, AH-4 and AH-6 (surimi with addition of 2, 4, and 6 g of the hydrolysate prepared by Alcalase hydrolysis, respectively); and control (surimi without cryoprotectant). The reported data represent mean values from three replications. Bars represent standard deviations.
Applsci 09 00563 g005
Table 1. Proximate composition of the defatted by-products and hydrolysates.
SampleCrude Protein
(g/100 g)
Ash
(g/100 g)
Moisture
(g/100 g)
Defatted by-products89.7 ± 2.529.75 ± 0.883.72 ± 0.61
PH85.2 ± 3.119.74 ± 0.123.52 ± 0.14
AH84.3 ± 3.259.79 ± 0.453.66 ± 0.10
PH represents the hydrolysate prepared by Protamex hydrolysis; AH represents the hydrolysate prepared by Alcalase hydrolysis; Mean values (±SD) of at least three measurements are shown.
Table 2. Characterization of PH and AH.
SampleDH (%)ζ Potential (mV)Relative Proportion (%) of Each Molecular Weight
≥7500 Da2027 Da~1420 Da286–780 Da≤138 Da
PH13.2 (±1.5) a−23.8 (±2.4) a7.7 (±1.6) a32.6 (±2.8) a37.4 (±3.1) b16.8 (±2.4) b4.7 (±1.2) a
AH12.9 (±1.1) a−23.1 (±2.8) a5.1 (±0.9) a-50.6 (±5.2) a39.1 (±2.6) a3.5 (±0.9) a
a TAA compositions were analyzed after acid hydrolysis; b FAA compositions were analyzed without hydrolysis. PH represents the hydrolysate prepared by Protamex hydrolysis; AH represents the hydrolysate prepared by Alcalase hydrolysis. - Not detected; Mean values (±SD) of at least three determinations are shown; Different letters in the same column indicate significant differences at P < 0.05.
Table 3. TAA (total amino acid) and FAA (free amino acid) compositions and contents of PH and AH.
AA (mg/g)PHAH
TAAContent
(%)
FAAContent
(%)
TAAContent
(%)
FAAContent
(%)
Asp99.8
(±3.2)
12.33
(±0.40)
0.8
(±0.4)
2.75
(±1.37)
96.7
(±2.8)
11.85
(±0.34)
1.2
(±0.5)
5.91
(±2.46)
Glu120.9
(±4.5)
14.93
(±0.56)
1.5
(±0.2)
5.15
(±0.69)
123.4
(±3.3)
15.13
(±0.40)
0.7
(±0.2)
3.45
(±0.98)
Asn0.4
(±0.3)
0.05
(±0.03)
0.4
(±0.3)
1.37
(±1.03)
0.5
(±0.2)
0.06
(±0.02)
0.5
(±0.2)
2.46
(±0.98)
Gln1.8
(±0.4)
0.22
(±0.05)
1.8
(±0.4)
6.18
(±1.37)
1.0 (±0.2)0.12
(±0.02)
1.0
(±0.2)
4.93
(±0.98)
Thr33.1
(±1.8)
4.09
(±0.22)
0.8
(±0.3)
2.75
(±1.03)
38.4
(±2.9)
4.71
(±0.36)
0.2
(±0.1)
0.98
(±0.49)
Ser35.4
(±4.1)
4.37
(±0.51)
1.0
(±0.1)
3.44
(±0.34)
38.6
(±4.4)
4.73
(±0.54)
0.3
(±0.1)
1.48
(±0.49)
Gly30.0
(±2.2)
3.71
(±0.27)
0.5
(±0.2)
1.72
(±0.69)
32.3
(±1.5)
3.96
(±0.18)
0.5
(±0.4)
2.46
(±1.96)
Ala48.4
(±3.6)
5.98
(±0.44)
0.7
(±0.2)
2.41
(±0.69)
51.3
(±3.5)
6.29
(±0.43)
0.4
(±0.3)
1.97
(±1.48)
Val39.2
(±5.1)
4.84
(±0.63)
1.9
(±0.7)
6.53
(±2.40)
36.6
(±2.8)
4.49
(±0.34)
2.3
(±0.2)
11.33
(±0.98)
Cys2.9
(±1.4)
0.36
(±0.17)
--3.5
(±0.9)
0.43
(±0.11)
--
Met22.7
(±4.3)
2.80
(±0.53)
1.3
(±0.4)
4.47
(±1.37)
17.6
(±4.7)
2.16
(±0.58)
2.2
(±0.2)
10.84
(±0.98)
Ile29.8
(±3.0)
3.68
(±0.37)
1.4
(±0.6)
4.81
(±2.06)
31.5
(±4.7)
3.86
(±0.58)
0.5
(±0.1)
2.46
(±0.49)
Leu61.4
(±5.5)
7.58
(±0.68)
1.8
(±0.5)
6.18
(±1.72)
63.7
(±2.1)
7.81
(±0.26)
0.9
(±0.3)
4.43
(±1.48)
Tyr24.7
(±3.6)
3.05
(±0.44)
2.1
(±0.8)
7.22
(±2.75)
20.6
(±1.5)
2.53
(±0.18)
1.3
(±0.3)
6.40
(±1.48)
Phe30.0
(±2.7)
3.71
(±0.33)
1.9
(±0.3)
6.53
(±1.03)
27.9
(±2.4)
3.42
(±0.29)
1.3
(±0.1)
6.40
(±0.49)
Lys73.2
(±4.0)
9.04
(±0.49)
6.1
(±0.5)
20.96
(±1.72)
75.6
(±5.5)
9.27
(±0.67)
0.9
(±0.2)
4.43
(±0.98)
Trp--------
His16.5 (±3.9)2.04
(±0.48)
1.0
(±0.2)
3.44
(±0.69)
17.2
(±2.0)
2.11
(±0.24)
1.5
(±0.4)
7.39
(±1.96)
Arg39.6
(±1.1)
4.89
(±0.14)
2.7
(±0.3)
9.28
(±1.03)
33.8
(±1.4)
4.15
(±0.17)
3.1
(±0.5)
15.27
(±2.46)
Pro102.0 (±6.2)12.60
(±0.76)
1.4
(±0.4)
4.81
(±1.37)
106.7
(±3.6)
13.09
(±0.44)
1.5
(±0.2)
7.39
(±0.98)
Total809.610029.1100815.410020.3100
PH represents the hydrolysate prepared by Protamex hydrolysis; AH represents the hydrolysate prepared by Alcalase hydrolysis. - Not detected; Mean values (±SD) of at least three determinations are shown.
Table 4. Texture profile analysis of different heat-set surimi gels before (unfrozen, UF) and after six freeze-thaw cycles (FT).
SampleHardness (g)SpringinessCohesivenessChewiness (g)
UFFTUFFTUFFTUFFT
Control1328
(±38.00) cB
1889
(±67.00) aA*
0.9220
(±0.02) aB
1.4380
(±0.05) aA*
0.6340
(±0.03) aB
0.9590
(±0.03) aA*
702
(±47.00) cB
1117
(±85.00) aA*
SuSo1565
(±52.00) aA
1422
(±70.00) bB
0.9300
(±0.03) aA
0.9280
(±0.06) bA
0.6760
(±0.02) aA
0.6690
(±0.04) bA
943
(±36.00) aA
818
(±72.00) bA
PH-21417
(±27.00) bcA
1389
(±36.00) bA
0.9210
(±0.06) aA
0.9180
(±0.06) bA
0.6780
(±0.03) aA
0.6600
(±0.07) bA
815
(±42.00) bcA
781
(±68.00) bA
PH-41506
(±44.00) abA
1426
(±51.00) bA
0.9250
(±0.02) aA
0.9210
(±0.07) bA
0.6800
(±0.06) aA
0.6650
(±0.05) bA
877
(±27.00) abA
802
(±48.00) bA
PH-61555
(±29.00) aA
1485
(±39.00) bA*
0.9280
(±0.03) aA
0.8325
(±0.06) bA
0.6910
(±0.02) aA
0.6760
(±0.06) bA
916
(±31.00) abA
845
(±52.00) bA*
AH-21438
(±32.00) bcA
1387
(±76.00) bA
0.9230
(±0.05) aA
0.7915
(±0.07) bA*
0.6780
(±0.05) aA
0.6650
(±0.06) bA
835
(±52.00) abA
789
(±39.00) bA
AH-41522
(±61.00) abA
1415
(±72.00) bA
0.9270
(±0.02) aA
0.8325
(±0.05) bB
0.6880
(±0.01) aA
0.6720
(±0.09) bA
882
(±74.00) abA
820
(±45.00) bA*
AH-61598
(±27.00) aA
1473
(±55.00) bB*
0.9370
(±0.06) aA
0.7995
(±0.07) bB*
0.6990
(±0.06) aA
0.6830
(±0.08) bA
951
(±26.00) aA
836
(±56.00) bB*
SuSo (surimi added with sucrose-sorbitol blend); PH-2, PH-4 and PH-6 (surimi with addition of 2, 4, and 6 g of the hydrolysate prepared by Protamex hydrolysis, respectively); AH-2, AH-4 and AH-6 (surimi with addition of 2, 4, and 6 g of the hydrolysate prepared by Alcalase hydrolysis, respectively); and control (surimi without cryoprotectant). Mean values (±SD) of at least three determinations are shown; a, b, c represent significant differences of samples in the same column (P < 0.05); A, B represent significant difference of the same sample before and after freeze-thaw treatment (UF and FT) (P < 0.05)); * indicates significant differences between freeze-thaw treated samples and unfrozen control sample (P < 0.05).

