Article

An Agent-Based Model Driven Decision Support System for Reactive Aggregate Production Scheduling in the Green Coffee Supply Chain

by
María del Rosario Pérez-Salazar
1,
Alberto Alfonso Aguilar-Lasserre
1,*,
Miguel Gastón Cedillo-Campos
2,
Rubén Posada-Gómez
1,
Marco Julio del Moral-Argumedo
1 and
José Carlos Hernández-González
1
1
Division of Research and Postgraduate Studies, Tecnologico Nacional de Mexico, Instituto Tecnologico de Orizaba, Orizaba 94320, Veracruz, Mexico
2
Transportation Systems and Logistics National Laboratory, Mexican Institute of Transportation, San Fandila 76703, Querétaro, Mexico
*
Author to whom correspondence should be addressed.
Appl. Sci. 2019, 9(22), 4903; https://doi.org/10.3390/app9224903
Submission received: 14 October 2019 / Revised: 4 November 2019 / Accepted: 6 November 2019 / Published: 15 November 2019
(This article belongs to the Special Issue Multi-Agent Systems 2019)

Abstract

:

Featured Application

The agent-based model driven decision support system can handle the delay in the arrival of raw materials while considering planning scenarios reflecting the context of the green coffee production, scenarios where the demand is skewed towards the end of the planning horizon, where the demand is skewed towards the beginning of the planning, and where demand peaks in the middle of the planning horizon and falls under the available capacity on the first and last days of the horizon. The exhibition of the management process within the green coffee supply chain context may help practitioners and managers interested in implementing the agent-based modeling and simulation approach to increase the possibilities of successful adopting of the reactive aggregate production scheduling.

Abstract

The aim of this paper is to contribute to the thread of research regarding the need for logistic systems for planning and scheduling/rescheduling within the agro-industry. To this end, an agent-based model driven decision support system for the agri-food supply chain is presented. Inputs in this research are taken from a case example of a Mexican green coffee supply chain. In this context, the decision support agent serves the purposes of deriving useful knowledge to accomplish (i) the decision regarding the estimation of Cherry coffee yield obtained at the coffee plantation, and the Parchment coffee sample verification decision, using fuzzy logic involving an inference engine with IF-THEN type rules; (ii) the production plan establishment decision, using a decision-making rule approach based upon the coupling of IF-THEN fuzzy inference rules and equation-based representation by means of mixed integer programming with the aim to maximize customer service level; and (iii) the production plan update decision using mathematical equations once the customer service level falls below the expected level. Three scenarios of demand patterns were considered to conduct the experiments: increasing, unimodal and decreasing. We found that the input inventory and output inventory vary similar over time for the unimodal demand pattern, not the case for both the increasing and decreasing demand patterns. For the decreasing demand pattern, ten tardy orders for the initial production schedule, an 88% service level, and nineteen tardy orders from the estimated production results, a 77% service level. This value falls below the expected level. Consequently, the updated aggregate production schedule resulted in ten tardy orders and an 88% service level.

1. Introduction

A main challenge for the agri-food supply chain (ASC) relates to the need for logistic systems for planning and scheduling/rescheduling due to unpredictable variations in quality, moment and quantity in primary production; the need for high efficiency of technical equipment despite long food industry production times; and an intricate network structure where many farms and food processors trade with multinationals in the wholesaler/retail sector. This challenge is derived from the following ASC characteristics [1]: (i) for the primary producer echelon, the seasonal growth is often limited to a specific period in a geographic region, dependent on weather and agricultural practices management, (ii) for the food processor echelon, high volume and low variety production systems combined with high volume frequent deliveries, and (iii) for the wholesaler/retailer echelon, the variability of quality and quantity of supply of farm-based inputs coupled with high demands from consumers, including food safety legislation and quality standards. This challenge calls for joint decision making in order to leverage the knowledge resources in the ASC.
From an agent-based modeling and simulation approach, a system is modeled as a set of autonomous agents that interact with each other and the environment; the agents have behaviors that are influenced by agent’s interactions [2]. According to an agent’s behavior [3] (i) agents can respond in an event-action-mode (reactive agent), (ii) agents can have domain knowledge to undertake a sequence of actions in order to achieve a goal (deliberative agent), and (iii) agents can encompass both of this features. These behaviors have important implications in the use of the agent-based modeling approach as a valid methodology to model the supply chain (SC). Moreover, for SC researches and practitioners, Hilletofth and Lättilä [4] stressed the benefits of agent-based decision support systems including the ability to convert manager experience into agents, the ability to conduct experiments and what-if analysis through simulation-based decision support systems and the increased predictability of operations in the real system. The core functionality component of a simulation model-driven decision support system is a quantitative model and is used by decision-makers to help in analyzing a real system by means of modeling and data collection, model validation, system parameter setting, and system evaluation [5].
Agent-based modeling use and simulation for decision-making within the agri-food industry has been applied considering the integration of logistics, quality decay and sustainability modeling [6,7]. According to findings from the review conducted by Utomo et al. [8], most agent-based modeling and simulation applications in agri-food supply chains focus on the simulation of production planning and investment decisions. However, although there is a volume of literature about applications of agent-based modeling and simulation in the agri-food supply chains, there is a lack of studies that consider important actors, such as food processors and retailers in the scope of the model, since most agent-based modeling and simulation applications focus on one echelon [8].
A make-to-order ASC is considered for this study. For these types of chains, Chatfield et al. [9] classified the improvement opportunities for the SC modeling approaches into three categories: model building, model quality, and model execution. Regarding the agent-based modeling approach, the authors highlighted the issue with model quality as a measure of how well a model represents the aspects of interest in a real system and how a completely agent-based approach is not the best way to represent the entire supply chain. Consequently, as the agent-based approach focus on the behavior and decision processes of individual participants, often at the expense of event-oriented aspects of the supply chain, hybrid configurations are often necessary.
The aim of this paper is to contribute to these strands of research. To this end, an agent-based model driven decision support system for the agri-food supply chain is presented. The agent-based modeling and simulation and discrete-event simulation (DES) combination is the agent-related hybrid configuration used for the development decision support system. The agent-based modeling and simulation and DES combination are one of the agent-related hybrid configurations that have received the most attention. According to Macal [10], a hybrid modeling challenge exists and refers to the understanding of how agent-based modeling can be effectively used with other simulation and modeling techniques operating together in the same hybrid model in such a way that each technique addresses the part of the problem that it does best.
Inputs in this research are taken from a case example of a Mexican green coffee SC. The green coffee SC comprises four stakeholders from Cherry coffee cultivation to processed green coffee: (i) Cherry coffee growers; (ii) Parchment coffee producers; (iii) green coffee producers; and (iv) green coffee toasters. In this context, the decision support agent serves the purposes of deriving useful knowledge to accomplish (i) the decision regarding the estimation of Cherry coffee yield obtained at the coffee plantation, and the Parchment coffee sample verification decision, using fuzzy logic involving an inference engine with IF-THEN type rules; (ii) the plan production establishment decision, using a decision-making rule approach based upon the coupling of IF-THEN fuzzy inference rules and equation-based representation by means of mixed integer programming with the aim to maximize customer service level; and (iii) the production plan update decision using mathematical equations once the customer service level falls below the expected level.
This paper is structured as follows: Section 2 presents an overview of the strands of theory used to underpin the proposed system. Section 3 describes the methodology, while Section 4 presents the results of the system assessment in the case study. Finally, Section 5 summarizes our conclusions.

2. Literature Overview and Work Position

The present work will try to integrate the following strands of theory to underpin the decision support system for the ASC. The first strand related to the use of agents in SC modeling and simulation. Based on the concept of SC uncertainty revised by van der Vorst and Beulens [11] as a decision-making situation in which the decision-maker lacks understanding; information processing capacities and effective control actions; the authors assert that SC uncertainty could be reduced through the implementation of specific-scenario redesign strategies regarding configuration, control structure, information systems, and governance structures. Supply chain value stream mapping is a technique to leverage the knowledge of a company’s supply actors [12].
van der Zee and van der Vorst [13] proposed a modeling framework for decision-making improvement based on agents modeling the SC actors as autonomous objects assigned with decision making intelligence, jobs representing the SC activities, and types of flows (goods, information, resources, and job definitions). Broadly, an agent possesses skills and knowledge to interact with the environment including applications for cooperation, communication, command and control [14]. A multi-agent system is defined by Turban et al. [15] as: “a computer-based environment that contains multiple software agents to perform certain tasks”; therefore, its scope refers to the breakdown of a complex solution into sub-problems then assigned to agents supported by a knowledge base. Furthermore, decision support systems agents could be classified into five types [15]: data monitoring, data gathering, modeling, domain managing, and preference learning. Indeed, agent-based decision support systems enable decision-making activities such as knowledge representation, knowledge reuse, reasoning, and inference techniques [16]. These properties have implications on industrial environment agent-based solution adoption, feasibility, breakdown robustness, ready reorganizability, effective response to external disruptions, and reconfigurability. Nevertheless, the adoption barriers comprise cost, guarantees for operational performance, scalability and standards definition [17]. Other issues related to barriers of agent-based decision support systems comprise [4] the difficulty to access data from partners in the SC, long development and validation time, long learning time, and the difficulty to develop agent rules that generates the wanted behavior. Consequently, the next generation of decision agents in SC management must consider these barriers in order to develop agents embedded in systems that will be distributed, dynamic, intelligent, integrated, responsive, reactive, cooperative, interactive, reconfigurable, and adaptable [18].
In the review conducted by Méndez et al. [19] regarding optimization methods for short-term scheduling, the authors stated that within the artificial intelligence field, scheduling problems have been solved by a set of individual agents which can work parallel and their coordination may bring a more effective way to find an optimal solution; the agents are expected to interact together to achieve the goals of the overall system. The second strand of theory comprises to agent-based decision making for scheduling in supply chains. According to Phanden et al. [20], the agent-based modeling technique is the most promising distributed approach to tackle the integration of process planning and scheduling adaptiveness. For their part, Barbati et al. [21] asserted that a relevant number of applications of agent-based models are devoted to SC planning problems. In that sense, industrial agent-based solution adoption has focused in following areas [17]: (i) distributed solutions for real-time manufacturing control problems; (ii) distributed solutions for complex operations management problems such as planning, scheduling, initiating execution, and monitoring; and (iii) distributed solutions for coordinating supply chains that will integrate manufacturing, sales networks, suppliers, customers, and third-party coordinators. The application areas of multi-agent systems designs have recently evolved from intra-business processes such as job scheduling and production planning and coordination to complicated decision procedures involving the management of independent companies but interacting supply chain management partners [22]. Within the manufacturing context, an agent is an intelligent entity is capable of acting and decision making to accomplish tasks, such as distributed production planning, scheduling, and execution control [3]. In multi-agent scheduling, agents manipulate both resource and order variables under their own authority [23].
The third strand of theory encompasses the issues regarding production planning and quality sorting in the ASC with focus on the coffee SC. An ASC is defined by van der Vorst et al. [24] as chains where: “agricultural products are used as raw materials for producing consumer products with higher added value.” For the primary producer echelon of the ASC, the decision-making processes can broadly be divided into three stages [25]: production planning, cultivation practices, and post-harvest management and marketing; production planning relates to crop production planning based on market forces, soil testing and crop rotation practices, whilst cultivation practices encompasses decisions regarding crop nutrition and irrigation management for maximization of the total production of each crop. Indeed, a challenge for the agricultural sector relates to the need for a reactive and flexible crop production supply chains with high yield at low cost [26]. From an agricultural value chain point of view, Higgins et al. [27] argue: “multi-agent models provide a capacity to accommodate the complexity of relationships between and within value chain segments by representing these segments (or their activities) as agents.” For their part, Tsolakis et al. [28] enlisted the decisions for tactically and operational planning in an ASC, including the planning of harvesting operations and logistics operations and the adoption of quality management policies. With regards to quality sorting and grading, van der Vorst et al. [29] stated that quality controlled logistics in the ASC entails an adaptive control based upon customer requirements and current agri-product quality.
From an agent-based simulation perspective, Handayati et al. [30] identified the value co-creation in a sustainable ASC, understanding sustainability as a the integration of the moral, ecological, technical, economic, and social dimensions of human activity [31]: (1) Planning: agro-input selection, cultivating and harvesting scheduling, more certain demand and price, more certain supply; (2) Cultivating and Harvesting: exporters requirement fulfillment, and good agricultural practice; (3) Post-harvest and Distribution: good post-harvest handling, cold storage system for maintaining the freshness of agri-product; and (4) Consumption: customer’s requirement fulfillment.
From a sustainability perspective and with regard to the Central American coffee supply, Killian et al. [32] found that organic and fair trade certification production schemes seem to be a viable strategy for Central American farmers to receive better pricing and to improve productivity to maintain or increase farm income. Moreover, Killian et al. [33] determined the carbon footprint of the SC of Costa Rican coffee, sources of the most intense emission and mitigation possibilities.
Regarding coffee yield analysis, Espinosa-Solares et al. [34] found that Cherry coffee yield is affected more by cultivar characteristics than by harvest date in a two year study in Mexico. For their part, the study of Bosselmann et al. [35] demonstrated that shade trees not be planted with the purpose of improving beverage quality in small holder coffee agroforestry systems in Southern Colombia.
For quality sorting in the Green coffee SC, Green coffee assessment focus on Acidity, Body, and absence of Defects [36]. Livio and Hodhod [37,38] developed a fuzzy expert system for sensorial evaluation of coffee bean attributes to derive quality scoring comprising 11 attributes: fragrance, flavor, aftertaste, acidity, body, uniformity, balance, clean cup, sweetness, overall and defects. Testing results of the system shown 95% of matching results compared to the experts’ evaluations. Flores and Pineda [39] also presented a fuzzy logic expert system with the aim to train Honduran coffee cuppers; testing results of the system shown 97% of matching results evaluating the attributes brew, aroma, taste, aftertaste, and body.

3. Methodology

3.1. Case Study

Green coffee production is generally characterized by both the necessity of management agricultural practices improvement and production technology implementation, which is related to production yield and quality in coffee in coffee plantations with an average yield of 2408 hectograms per hectare (hg/ha), against 5333 to 25,487 hg/ha reported by the eight countries with highest productivity [40]. The case study is an order-driven Mexican green coffee SC.
The green coffee SC actors are described below and depicted in Figure 1. The second tier suppliers are the Cherry coffee growers. In this echelon, the cultivation and harvest of the Cherry coffee take place in the coffee plantations. In the region where the case study chain is located, there is an altitudinal gradient from sea level to above 3000 m above sea level. The average annual temperature ranges from 12 °C to 24 °C, the coffee soils of the region can be classified as suitable, medium and unfit and the annual precipitation oscillates between 1000 and 3000 mm [41]. These geo-agro climatic characteristics provide a very varied mosaic wherein each of the regions you can find sites of high, medium, and low potential both production and quality of coffee.
The harvest refers to the cut of ripe Cherry coffee, with the cut of the fruits in a mature state, weight is gained in the scale in the sale process, the benefit process is facilitated, the production loss is reduced when the green coffee is prepared, and organoleptic quality is gained. Cherry coffee is the most frequent form of sale with a local or industrial intermediary-collector, where the process of wet profit is carried out. Cherry coffee is transported in plastic sacks or tarpaulins usually used in livestock feed or various grains.
The first tier supplier is the Parchment coffee producer, local and industrial intermediary that carry out the wet benefit process. The wet benefit process consists of mechanically removing the pulp (exocarp) of the coffee Cherry in the presence of water or without it, and followed either by (i) the removal of the mucilage (mesocarp) by fermentation or mechanical method, followed by the washing to obtain Parchment coffee, or (ii) direct drying of the pulpless grains inside the mucilaginous [42]. Parchment followed by threshing to produce semi-washed green coffee. Next, drying of the coffee beans either through the combined effect of sunlight and aeration or drying machines, to obtain coffee in the shell. The drying time is variable in each of the methods, the goal being in any case that the humidity in the coffee bean reaches within the parameter of 11.5–12.5%. The final product of the wet processing process is called Parchment coffee; the name comes from the fibrous parchment-like husk which covers the grain at the end of the process. The storage is carried out in warehouses using mainly jute bags. The process of commercialization of Parchment coffee is carried out mainly between individual producers, or through their organizations, towards industrial exporters, who will sell it in the national and international markets.
The focal company of this study is an industrial green coffee producer that stores and distributes both regional and nationally. In this echelon, the Parchment coffee refinement takes place, the dry benefit process. In the dry benefit process, the Parchment coffee received and graded is threshed to release the green coffee bean, to later be classified by its size, density, and color, as well as being cleaned of foreign objects. In the threshing process, the dry endocarp is removed from the Parchment coffee to produce green coffee. The dry benefit process starts with the Parchment coffee reception where the coffee is sampled to perform an organoleptic evaluation and physical revision. The organoleptic evaluation of coffee sample is the process of sensorial evaluation of coffee beans. In this process, the toasting and grinding of a sample of Parchment coffee are carried out, an infusion of the roasted and ground coffee sample is prepared in freshly boiled water, from which the gustatory and olfactory characteristics of the grain are evaluated, such as flavor, body, aroma, and acidity. In the physical analysis, defects are visually identified; the defects refer to irregularly shaped coffee beans and coffee beans of irregular appearance [43].
The purchase decision depends on the results of these evaluations. If the coffee is purchased, the coffee entry quality grading takes place, namely, the defective beans percentage in the coffee lot is determined, and then, the lot is stacked on pallets in the warehouse area designated for each coffee type. Next, in the pre-cleaning process, the coffee enters the pre-cleaning machine, where foreign materials of a different origin than coffee are eliminated. After the pre-cleaning process, the threshing process takes place. The pre-cleaning is the technological operation used to reduce the percentage of humidity of the Parchment coffee to a level of 10 to 12.5%, which allows threshing under satisfactory technical conditions. In the threshing process, the dried endocarp is removed from the Parchment coffee of natural coffee to produce green coffee. At the entrance to the thresher, a quality control point is present in which the metals that Parchment coffee could carry are eliminated. Finally, the sorting process is the technological operation used to eliminate foreign matter, fragments of coffee and defective grains of green coffee, and to separate healthy coffee beans according to their shape, size, and weight. The machinery, the manual labor or the combination of both, can be variable but in general the methods of this process are classified into sorting by sieve, sorting by vibration-gravity, pneumatic sorting, and optical sorting. The result of the process is the production of green coffee, with a defective beans percentage in a coffee lot called percentage of stain, and composition of defined grain size. In the sorters by sieve, the husk and the stain are separated through a fan, where the coffee that does not have the appropriate weight is discriminated. In the sorters by vibration-gravity, the coffee is classified by size and shape, separating it into first, second, third, shell, pellet (amount of broken coffee beans) and dry Cherry. In pneumatic sorters, coffee is classified by weight in first, second and third, and stones and sticks of smaller size are also eliminated. In electronic sorters, coffee is classified by color, eliminating mainly the black and yellow grain, by a computerized optical system that eliminates undesirable color grains, according to the required preparation and quality standards.
The typical demand for green coffee declines in autumn (September–December) and peaks in spring (March–June) as depicted in Figure 2. Green coffee orders from wholesale customers (industrial coffee toasters) require processing only in some sorting processes or in a certain sequence of these (pneumatic sorting, optical sorting, and sift sorting). Sorting process scheduling decision is based on (i) the size of the green coffee order and its requirement of stain percentage, and (ii) the percentage of defective beans resulted from the physical analysis of the Parchment coffee entries necessary to complete the wholesale customer’s order. If the requirements of the client’s order are not met, two consequences arise. The first consists of the re-entry of the coffee lot to another sequence of sorting processes, which generates reprocessing. The second consequence refers to an over-processing of the coffee bean when the quality that the customer is willing to pay is exceeded, which results in the storage of the coffee lot or its sale at a lower price.

3.2. General Methodology

The proposed methodology encompasses data collection and model definition, model validation, system configurations definition, and output data analysis. The relationships between them are shown in Figure 3.
The data collections refer to collect and analyze information on case study operating procedures and control logic which is used to formulate the decision-making rules in the simulation. Once the model is built and verified, the validation process compares simulation output with the real data. The agent-based simulation model is used to support the decision-making of the case study through repeated simulations. The decision support system allows the decision-maker to iteratively set parameters and define system configurations, run simulations, and analyze the output data in order to generate strategies to implement the decisions.

3.3. Modeling the Green Coffee Supply Chain

From a process-oriented supply chain management approach, cross-functional business processes are used to structure the activities between members of a SC [44]. The SC can be represented, analyzed and configured through the application of the reference model Supply Chain Operations Reference (SCOR) developed by the Supply Chain Council [45]. The description of supply chains is made using these building blocks of processes, from simple to complex networks using a common set of definitions of performance metrics, processes, best practices, and the necessary skills to carry out the processes of the SC. The SCOR model has a sweeping overview of the SC, viewing it as something ranging from suppliers’ suppliers to customers’ customers and incorporating the financial, organizational and societal aspects of performance [46]. Through an exploratory study, Lockamy III and McCormack [47] investigated the relationship between supply chain management planning practices and SC performance based on four decision areas provided in SCOR: plan, source, make and deliver. The authors stated that planning processes are important in all SCOR SC planning decision areas.
The SCOR comprises three levels of process detail. Level one defines both the scope and the content for the supply network. Additionally, the competition performance targets are set. At the second level, companies implement their specific SC operations strategy through three core business models, namely, process categories (i) make-to-stock, (ii) make-to-order, and (iii) engineer-to-order. At level three, companies “fine tune” their operations strategy through (i) process element definitions, (ii) process element information inputs, and outputs, (iii) process performance metrics and iv) best practices and system capabilities required to support best practices. For the decision support system, the SCOR-process oriented approach is used to represent the ASC activities from an “as-is” state to a “to-be” state [48]. To this end, a diagram of level three SCOR process is constructed.
In this section, we attempt to fit the green coffee SC activities in the frame of the SCOR model in order to construct a diagram of level three process elements of the desired “to-be” future state, from the analysis of the “as-is” state of the chain processes. For the green coffee SC actors, the “to-be” future state of the current study scope covers the following processes.
For Cherry coffee producers, M1.3 Produce and test includes the activities of adding value for the products by having the raw material pass through several activities, in this case meaning the Cherry coffee growth yield in a coffee plantation; M1.6 Release Finished Product to Deliver relates to the harvest process and D1 Deliver Stocked Product relates to the market demand satisfaction. For the Parchment coffee producer, S1.2 Receive Product refers to the process and associated activities of receiving Cherry coffee lots from the producers; in this case, M1.3 Produce and test represents the wet benefit process in an industrial intermediary and evaluates Cherry coffee volume to determine Parchment coffee lots according to type and percentage of defective coffee beans. The different stages of the wet benefit process involve Cherry coffee receiving and feeding, mechanical removal of the pulp, mechanical removal of the mucilage, coffee bean washing, coffee bean drying, and Parchment coffee grading; and M1.6 Release Finished Product to Deliver refers to the Parchment coffee lot quality and D1 Deliver Stocked Product relates to the market demand satisfaction.
For the green coffee producer, S1.2 Receive Product refers to the process and associated activities of receiving Parchment coffee from the producer; the amount of received coffee is defined by S1.1 Schedule Product Deliveries. S1.3 Verify Product relates to the process and actions required determining product conformance to requirements and criteria, in this case, both an organoleptic evaluation and physical revision of a coffee sample. After the coffee entry quality grading, in S1.4 Transfer Product, the accepted coffee lot is stacked on pallets in the warehouse area designated for each coffee type.
P3 Plan Make comprises the establishment of courses of action over specified time periods that represent a projected appropriation of production resources to meet production requirements, while M2.1 Schedule Production Activities has the purpose of scheduling the activities, in this case, the processes of M2.3 Produce and Test: coffee bean pre-cleaning, coffee bean threshing, coffee bean sorting, and green coffee customer order quality control. M2.2 Issue Material relates to the selection of Parchment coffee entries from the warehouse. The inventory availability record will determine the coffee lots to be issued to support the production operations. Finally, and M1.6 Release Finished Product to Deliver refers to the gGreen coffee lot quality and D2 Deliver Make-to-order Product relates to the market demand satisfaction.
For the industrial coffee roasters, S2.1 Schedule Product Deliveries places the green coffee order. Figure 4 depicts the level three process elements comprising the make-to-order process at the green coffee producer. The organizational units involved in the Parchment coffee refinement are the Parchment coffee supplier, the internal departments of the green coffee producer and green coffee toaster. The Parchment coffee Delivery and Parchment Procurement level one processes are related by means of a customer-supplier connection that reflects the temporal relation between them and that the former process has a container-element link with one instance of the D1 level process. Furthermore, the instance of the M2 level two process, which is planned by an instance of the P3 level two process, is comprised of four instances of level three process elements. Regarding process elements, Figure 3 shows some of the resources created and used by them; for instance, Production Plan and Customer Reception Schedule, which are instances of the Production Schedule class. The former is created by the instance of Establish Production Plan process element, an element of a P3 level two process, and used by the instance of Schedule Production Activities. Each of these two processes perceives the Production Plan resource from a different perspective; two instances of the Resource Perspective class, named Production Orders and Production Plan. In the same way, the Delivery Orders resource perspective is presented for the Customer Reception Schedule resource, which is created by the instance of Schedule Production Activities, and it is used by the instance of Reserve Inventory Capacity and Determine Delivery Date, a level three process element corresponding to the D2 level two process.

3.4. Agent Description

Derived from this mapping in the framework of the SCOR model, the identified agents and activities for the green coffee SC are listed in Table 1. The simulation model implements the Parchment coffee refinement process at the focal company that interprets historical data from 2016 to 2018 fed by the green coffee SC actors under investigation.
The decision support agents serve the purposes of deriving useful knowledge to accomplish the decisions: (i) for the Cherry-coffee producer Production Agent (CP Agent), the decision regarding the estimation of Cherry coffee yield obtained at the coffee plantation; (ii) for the Green-coffee producer Source Agent (GS Agent), the Parchment coffee sample verification decision; (iii) for the Green-coffee producer Production Agent (GP Agent), the production plan establishment decision, and (iv) for the Green-coffee producer Reschedule Agent (GR Agent), the plan production update decision. The decision-making rule approach for the CP Agent and the GS Agent is rule-based representation using Fuzzy Logic involving an inference engine with IF-THEN type rules. For the GP Agent, a decision-making rule approach based upon the coupling of IF-THEN fuzzy inference rules and equation-based representation using mixed integer programming with the aim to maximize customer service level is used. Finally, the decision-making rule perspective used for the GR Agent is equation-based representations using mathematical equations once the customer service level falls below the expected level.
In this study, the decision-making rule approach using fuzzy logic is used to generate a knowledge base for the CP Agent, the GS Agent, and the GP Agent. The diverging opinions of the experts are represented as blurred triangular and trapezoidal numbers, which describe the coded knowledge of the expertise of the green coffee SC actors. Accordingly, a Mamdani model codifies the decision criteria related to (i) agricultural practices for growing Cherry coffee in coffee plantations (CP Agent); (ii) the process of sensorial evaluation of coffee beans from which gustatory and olfactory characteristics of the grain are evaluated for quality scoring of a Parchment coffee sample (GS Agent); and (iii) the sorting process scheduling of Parchment coffee entries based on coffee entry quality grading, the percentage of defective coffee beans percentage in the coffee lot (GP Agent). In the Mamdani type model, multiple inputs and outputs represent information using Fuzzy Logic; each input and output variable is represented through a Linguistic variable. The rule base representation is developed according to the IF-THEN type, which constitutes the inference method based on the knowledge base and consequent inference engine. The defuzzification process uses the centroid calculation method.
Fuzzy lLogic is used to mimic the knowledge and expertise of the agricultural field dynamics for coffee growth. We consider variables related to five agricultural practices that are common in any plantation, soil nutrition, control of pests, control of diseases, planting density, and pruning, and two uncertain events that are ever-present in agricultural setting i.e., rainfall and temperature. The consideration of agricultural practices as decision variables by considering two uncertain events for Cherry coffee production makes scenario agricultural field modeling closer to reality, with the simultaneous objectives of maximizing the yield of Cherry coffee obtained at the coffee plantation. Table 2 describes the variables related to agricultural practices, and uncertain events defined in the knowledge database for the CP Agent as Input elements (I), and the operations variables defined as Output elements (O). The knowledge base for coffee growing yield is composed of 1620 inference rules.
Fuzzy Logic is also used to mimic the organoleptic evaluation of the Parchment coffee sample. This process comprises the sensorial evaluation of coffee beans, from which the gustatory and olfactory characteristics of the grain are evaluated in order to determine a quality score for two coffee types, Robusta and Parchment. Negative or poor flavors detract from the quality of the coffee. For quality scoring of the Robusta coffee sample, we consider the variables ferment, sour, malodorous, earthy, mold and old.
For quality scoring of the Parchment coffee sample, the following variables are taking into account: aroma; flavor; acidity; body; vinous, fruity, sweetness; green, immatureness; cereal, wood, paper; dry, old; chemical, medicinal; ferment, sour, malodorous; and earthy, mold.
Table 3 describes the variables related to the gustatory and olfactory characteristics defined in the knowledge database for the GS Agent as Input elements (I), and the operations variables defined as Output elements (O). The knowledge base for quality scoring of a Robusta coffee sample and Parchment coffee sample is composed of 4096 inference rules and 96000 inference rules, respectively.
For the GP Agent, fuzzy logic is used to mimic the sorting process scheduling of coffee entries based on coffee entry quality grading in the dry benefit process. Sorting process scheduling decision is based on the percentage of defective beans resulted from the physical analysis of the Parchment coffee entries necessary to complete the wholesale customer’s order. For sorting process scheduling of not-washed Robusta coffee inputs, we consider the variables serious defects, minor defects, pellet, green aspect, and weight. For sorting process scheduling of Robusta coffee inputs, we contemplate the variables humidity, serious defects, minor defects, pellet, green aspect, and weight. Finally, for sorting process scheduling of Parchment coffee inputs, humidity, serious defects, minor defects, pellet, green aspect were taking into consideration. With regards to Output, sift sorting refers to the process by which the coffee is classified by size and shape, pneumatic sorting comprises coffee classification by size and weight, and optical sorting the coffee is classified by a computerized optical system that eliminates undesirable color grains. Table 4 describes the variables related to the wet benefit process defined in the knowledge database for the GP Agent as Input elements (I), and the operations variables defined as Output elements (O). The knowledge base for sorting process scheduling of not-Robusta coffee, Robusta coffee, and the Parchment coffee, is composed of 216 inference rules, 864 inference rules, and 128 inference rules, respectively.
In order to determine the reliability of the aforementioned fuzzy models, a paired t-test was applied, which is used to compare the estimated values from each model to real recorded case data. Each record has specific values for each input variable and the output result by the decision-maker. This test produced a confidence interval that includes zero, which shows there is no significant difference between the estimated results and real data, so it can be concluded that the Fuzzy models are valid.
For the GP Agent, the production plan establishment decision is supported by a decision-making rule constructed by equation-based representation using mixed integer programming. Broadly, production planning comprises the determination of the type and quantity of commodities to be produced and resource allocation. The mathematical programming relies in the endeavor made by Sawik [49]. The author proposes a mixed integer programming formulation for customer order assignment over a planning horizon, to maximize service level. The index, parameters, and variables of this model are shown in Table 5, Table 6 and Table 7, and the description of the problem is explained below.
The green coffee producer can be identified as a flexible flow production system made up of six processing stages in series, and each stage i ∈ I = (1, …, m) is made up of m1 ≥ 1 parallel identical machines (Figure 5). In the system, three types of coffee are produced in a make to- order environment responding directly to wholesale customer-requested orders. Let J be the set of customer orders that are known ahead of a planning horizon. Each order j ∈ J is described by a triple (aj, dj, sj), where aj is the order arrival date, dj is the customer-requested due date, and sj is the size of order (the number of ordered products of specified type). Each order requires processing in various processing stages; however, some orders may bypass some stages.
The processing stages are the following: pre-cleaning, threshing, sorting by sieve1, sorting by vibration-gravity, pneumatic sorting, and optical sorting. Let pij ≥ 0 be the processing time in stage i of each product in order j ∈ J. The orders are processed and transferred among the stages in lots of various sizes that depend on the ordered product type and let bj be the size of production lot for order j. The coffee beans are feed into the pre-cleaning machine, m1, and then, it goes to the threshing machine, m2; this machine has 2 outputs, good coffee beans, and straw, the straw leaves the system and the coffee continues its way to the next processing stage. The sorting by sieve machines in stage 3, m3 y m4, have three outputs, (1) good coffee beans, (2) pellet and (3) straw; the good coffee beans continues its way to enter the next machine, while the broken coffee beans and straw leave the system, separately. The sorting by vibration-gravity machine, m5, has four outputs, (1) good coffee beans, which passes to the next machine, or failing that, leaves the system as the final product; (2) pellet, (3) dust and (4) dried cherries that leave the system definitively as waste. The pneumatic sorting machines, m6, m7 y m8, have three outputs (1) good coffee beans that leave the system as final product; (2) stain coffee beans that leave the system as waste, and (3) coffee beans that re-enter the machine to be reprocessed. The optical sorting machines, m9, m10 y m11, have two outputs (1) good coffee beans that leave the system as final product; (2) stain coffee beans that leave the system as waste.
The planning horizon consists of h planning periods, and L is the length of each planning period, in this case, working hours per week. Let T = {1, …, h} be the set of planning periods and cit the processing time available in period t on each machine in stage i. Customer orders are split into production lots of fixed sizes, each to be processed as a separate job. The following two types of customer orders are considered: (1) small customer order, where each order must be completed in two consecutive time periods, and (2) large customer order, where each order must be completed in four consecutive time periods. In practice, the two types of customer orders are scheduled simultaneously. Denote by J1 ⊆ J, and J2 ⊆ J, respectively, the subset of small customer orders, and large customer orders.
The mathematical formulation for the initial production schedule for the original customer orders known ahead of the planning horizon is as follows, where all materials are assumed to be available at the beginning, i.e., aj = 1 for each order j ∈ J.
Maximize:
1 − ∑(j∈J) uj/n
Subject to:
xjt + x(jt + 1) + x(jt + 2) + x(jt + 3) ≤ 4, j ∈ J2, t ∈ T: aj ≤ t ≤ h−3
xjt + x(jt + 1) + x(jt + 2) ≤ 3, j ∈ J2, t ∈ T: aj ≤ t ≤ h−2
xjt + x(jt + 1) ≤ 2, j ∈ J2, t ∈ T: aj ≤ t ≤ h−1
xjt + xjt’ ≤ 1, j ∈ J, t ∈ T, t’ ∈ T: aj ≤ t ≤ h−2, t’ ≥ t + 2
(t∈T:t ≥ aj) yjt = 1, j ∈ J
xjt ≥ yjt, j ∈ J, t ∈ T: t ≥ aj
yjt ≥ bj xjt/sj, j ∈ J, t ∈ T: t ≥ aj
uj ≥ ∑(t∈T:t > dj) yjt, j ∈ J
uj ≤ ∑(t∈T:t > dj) xjt, j ∈ J
(j∈J) pij sj yjt ≤ cit mi, I ∈ I, t ∈ T
(j∈J:τ∈T:aj ≤ τ ≤ t) sj y ≥ ∑(j∈J:dj≤t) sj (1 − uj), t ∈ T
uj ∈ {0, 1}, j ∈ J
xjt ∈ {0, 1}, j ∈ J, t ∈ T: t ≥ aj
0 ≤ yjt ≤ 1, j ∈ J, t ∈ T: t ≥ aj
The objective function (1) aims to maximize service level. Each large customer order must be completed in four consecutive time periods and each small customer order must be completed in two consecutive time periods (2)–(5). Each order must be completed (6), each order is allocated among all the periods that are selected for its assignment (7), and the minimum portion of a divisible order allotted to one period is not less than the batch size (8). Regarding tardy order constraints, a tardy order is partly assigned after its due date (9)–(10). The demand for capacity at each processing stage cannot be greater than the maximum available capacity in every period (11). The cumulative production is not less than the cumulative demand minus the tardy demand (12).
In industrial environment agent-based solution adoption, real-time scheduling and rescheduling are becoming increasingly important [17]. The master production schedule has to deal with seasonal fluctuations of demand and to calculate a frame for necessary amounts of overtime, whilst short-term production planning comprises the determination of lot-sizes according to their due dates and the available capacity with minute accuracy [50]. There are two basic elements in this approach [51]: (i) scheduling algorithms are used to generate initial schedules and repair obsolete schedules and (ii) control policies are used to adjust the frequency of repairing a schedule. Considering these control policies from the agent-based modeling and simulation approach, an adaptive agent is capable of modifying them during a simulation based on evolving circumstances [52]. Consequently, the adaptive control approach is based on the control of a set of performance indicators of a system by means of a decision model that analyzes them and selects an appropriate control policy. For SC planning, this approach relates to a partial or even the full change of a previously accepted plan triggered by a new event such as new order arrival, a cancellation of already allocated orders, the availability of a new resource, a failure of existing resources, or changes of the chain objectives [53]. The GR Agent monitors the customer service level and once the indicator falls below the expected level, the Agent updated the production plan. Rescheduling is the process of updating an existing production schedule in response to disruptions or other changes; This includes the machine failures, processing time delays, rush orders, quality problems, and unavailable material [51], in this case, the disturbance relates to delay in the arrival or shortage of materials. The mathematical formulation for the rescheduling algorithm is as follows considering the rescheduling parameters in Table 8. Let tmod be the first planning period immediately after the order modification.
Prime (‘) denotes updated parameters after modification of orders.
Step 0. Split the set Jold of orders remaining for completion into two disjoint subsets: JSold of reschedulable orders and JNold of fixed, non-reschedulable orders:
JNold = {j∈Jold: ∑(tmod ≤ t ≤ tmod + E*max) xjt = 1}
JSold = Jold/JNold
Step 1. Set TNold = {tmod, …, tmod + E ̅ }
Step 2. Do not change the assignment of non-reschedulable orders j∈JNold, i.e.,:
y’(j,tmod + E ̅+1) = y(j, tmod + E*max + 1), j ∈ JNold ∩ J: x(j,tmod+E ̅ ) = 1
The algorithm is for rescheduling of the remaining customer orders awaiting material supplies [49]. For each order j, product-specific materials are assumed to be unavailable earlier than E ̅ periods ahead of the order due date dj. Therefore, each order j cannot be assigned to periods earlier than dj − E ̅. In particular, in period tmod product-specific materials are not available for orders due in periods greater than tmod + E ̅, and hence all such orders can be rescheduled. On the other hand, the unmodified orders with product-specific materials supplied by period tmod are considered non-reschedulable in the algorithm. In the algorithm, the planning horizon is progressively shifted to take into account modifications of the customer orders (changes of order size and/or due date) occurring during the horizon.

3.5. Model Validation

The AnyLogic® Personal Learning Edition multi-method simulation platform that supports not only agent-based general-purpose simulations but also it supports DES modeling was used to build the agent-based simulation model that underpins the decision support system in a HP Workstation with an Intel Zeon CPU operating at 3.40 GHz and equipped with 8 GB RAM. The decision-making rules for the decision support agents, IF-THEN fuzzy inference rules and mixed integer programming, were implemented in Python through the integration AnyLogic®–Python.
To validate the simulation model and to check if it is an adequate representation of the real system, a paired t-test was applied, which is used to compare the results from the simulation model to the historical data of the real system. The indicator refers to the amount of good green coffee beans resulting from the sequence of processes, sift sorting, pneumatic sorting, and optical sorting, with an intake of 37,740 kg of Parchment coffee. The results of 10 replicas are shown in Table 9, where Xj is the number of kilograms of good green coffee beans resulting from the sequence of processes (1) sift sorting, (2) pneumatic sorting, and (3) optical sorting, with an intake of 37,740 kg of Parchment coffee, in the real system. In the same way, Yj is the number of kilograms of good green coffee beans result from the simulation model.
A 95% confidence interval is constructed using Equations (19)–(21):
Z ̅(n) = ∑n(i = 1) Zi)/n
Z ̅(10) = −1584.36/10
Z ̅(10) = −158.43
Var ̂ [Z ̅10 ] = ∑10(i = 1) [(Zj − Z ̅10)2]/n (n − −1)
Var ̂ [Z ̅10 ] = 1,962,287.05/10 (10 − −1)
Var ̂ [Z ̅10 ] = 21,803.18
Z ̅(n) ± t(n−1,1-(1−∝)⁄2) √Var ̂ [Z ̅n]
−158.43 ± t9,0.975 √21,803.18
−158.43 ± 2.26(147.65)
(−492.46,175.59)
It is observed that the confidence interval includes zero, so it is concluded, with a confidence index of 95% that the difference between the means of the real data and the simulation results is not statistically significant.
The optimal number of replicas of the simulation model was determined using the procedure of estimating the mean μ = E (x) with a specific error. Table 10 shows the results of 10 independent pilot replicas, where each replica represents the number of kilograms of good green coffee beans resulting from the sequence of processes (1) sift sorting, (2) pneumatic sorting, and (3) optical sorting, with an intake of 37,740 kg of Parchment coffee.
The average amount of coffee beans leaving the process, in kilograms, was estimated with an absolute error of β = 15 kg and a 95% confidence level. The calculations for the number of replications are shown below, where i is the number of replicas, and where the calculation performed must be less than or equal to the absolute error (β = 15 kg), where x ̅n = 27,894.73, S2n = 624.38, β = 15 and α = 0.05.
min Applsci 09 04903 i001{i ≥ 10: t(i−1,0.975) √(624.38/i) ≤ 15}
i = 10:2.26 √(624.38/10) = 17.87 ≥ 15
i = 11:2.22 √(624.38/11) = 16.78 ≥ 15
i = 12:2.20 √(624.38/12) = 15.87 ≥ 15
i = 13:2.17 √(624.38/13) = 15.09 ≥ 15
i = 14:2.16 √(624.38/14) = 14.42 ≤ 15
Therefore, the optimal number of replicas is 14.

4. Results and Discussion

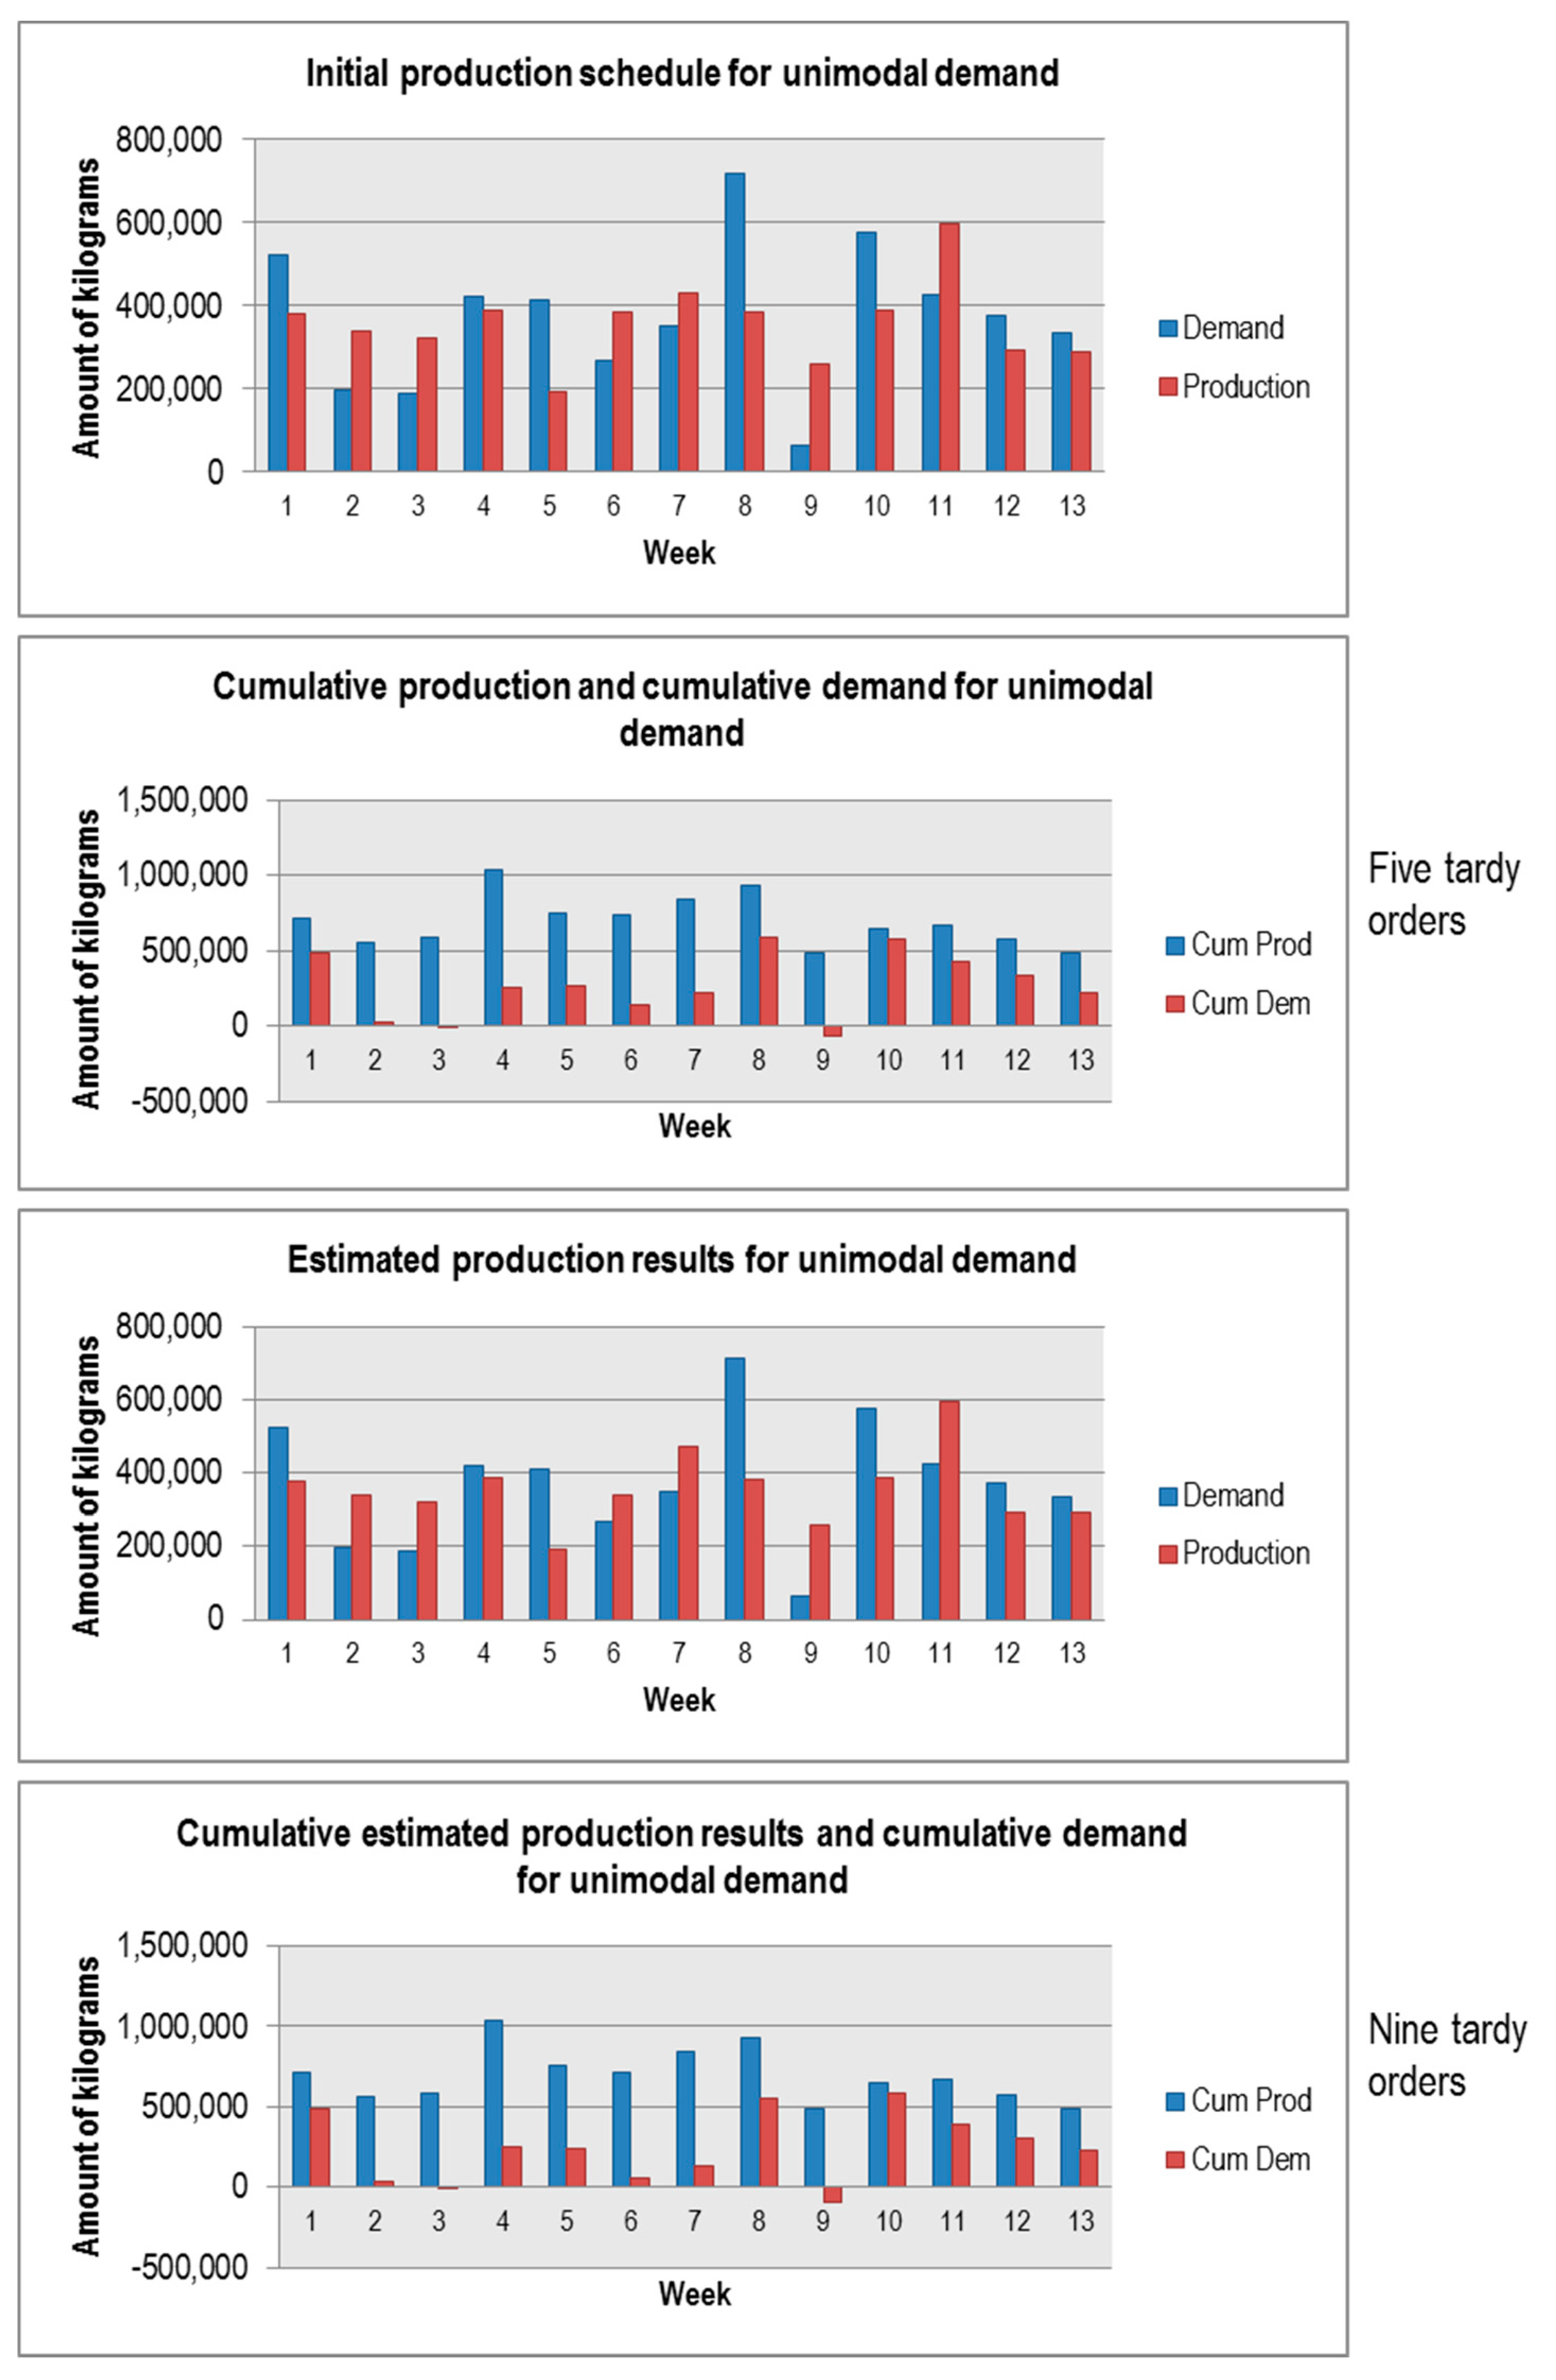
4.1. Simulation Results of the Demand Scenarios

The selection of the demand pattern scenarios responds to the need of the decision-maker for production scheduling during the typical demand for green coffee that declines in the September-December period and peaks in the March-June period. The planning horizon considered was h = 13 weeks, with a length of each planning period of working hours per week. The following three demand patterns were considered.
Increasing, with demand skewed towards the end of the planning horizon, 60 customer orders.
Decreasing, with demand skewed towards the beginning of the planning horizon, 84 customer orders.
Unimodal, where demand peaks in the middle of the planning horizon and falls under the available capacity on the first and last days of the horizon, 63 customer orders.
Figure 6, Figure 7 and Figure 8 show the initial aggregate production schedule and the estimated production results along with the cumulative aggregate production and cumulative aggregate demand for each case for the increasing demand pattern, the unimodal demand pattern, and the decreasing demand pattern, respectively. The negative values in these figures indicate the tardy demand.
For the initial aggregate production schedule, all materials are assumed to be available at the beginning of the planning horizon, while for the estimated production results, delay in the arrival of raw materials occurred.
The customer service level results for the increasing demand pattern are as follows (Figure 6): no tardy orders for the initial production schedule, i.e., 100% service level, and two tardy orders for the estimated production results, a 96% service level.
Regarding the unimodal demand pattern, the results are five tardy orders for the initial production schedule, a 92% service level, and nine tardy orders from the estimated production results, an 85% service level. Figure 7 shows that the aggregate production is best leveled over time for the unimodal demand pattern. The study of Sawik [54] for production scheduling in make-to-order manufacturing systems found the aggregate production is best leveled over time for the increasing demand pattern.

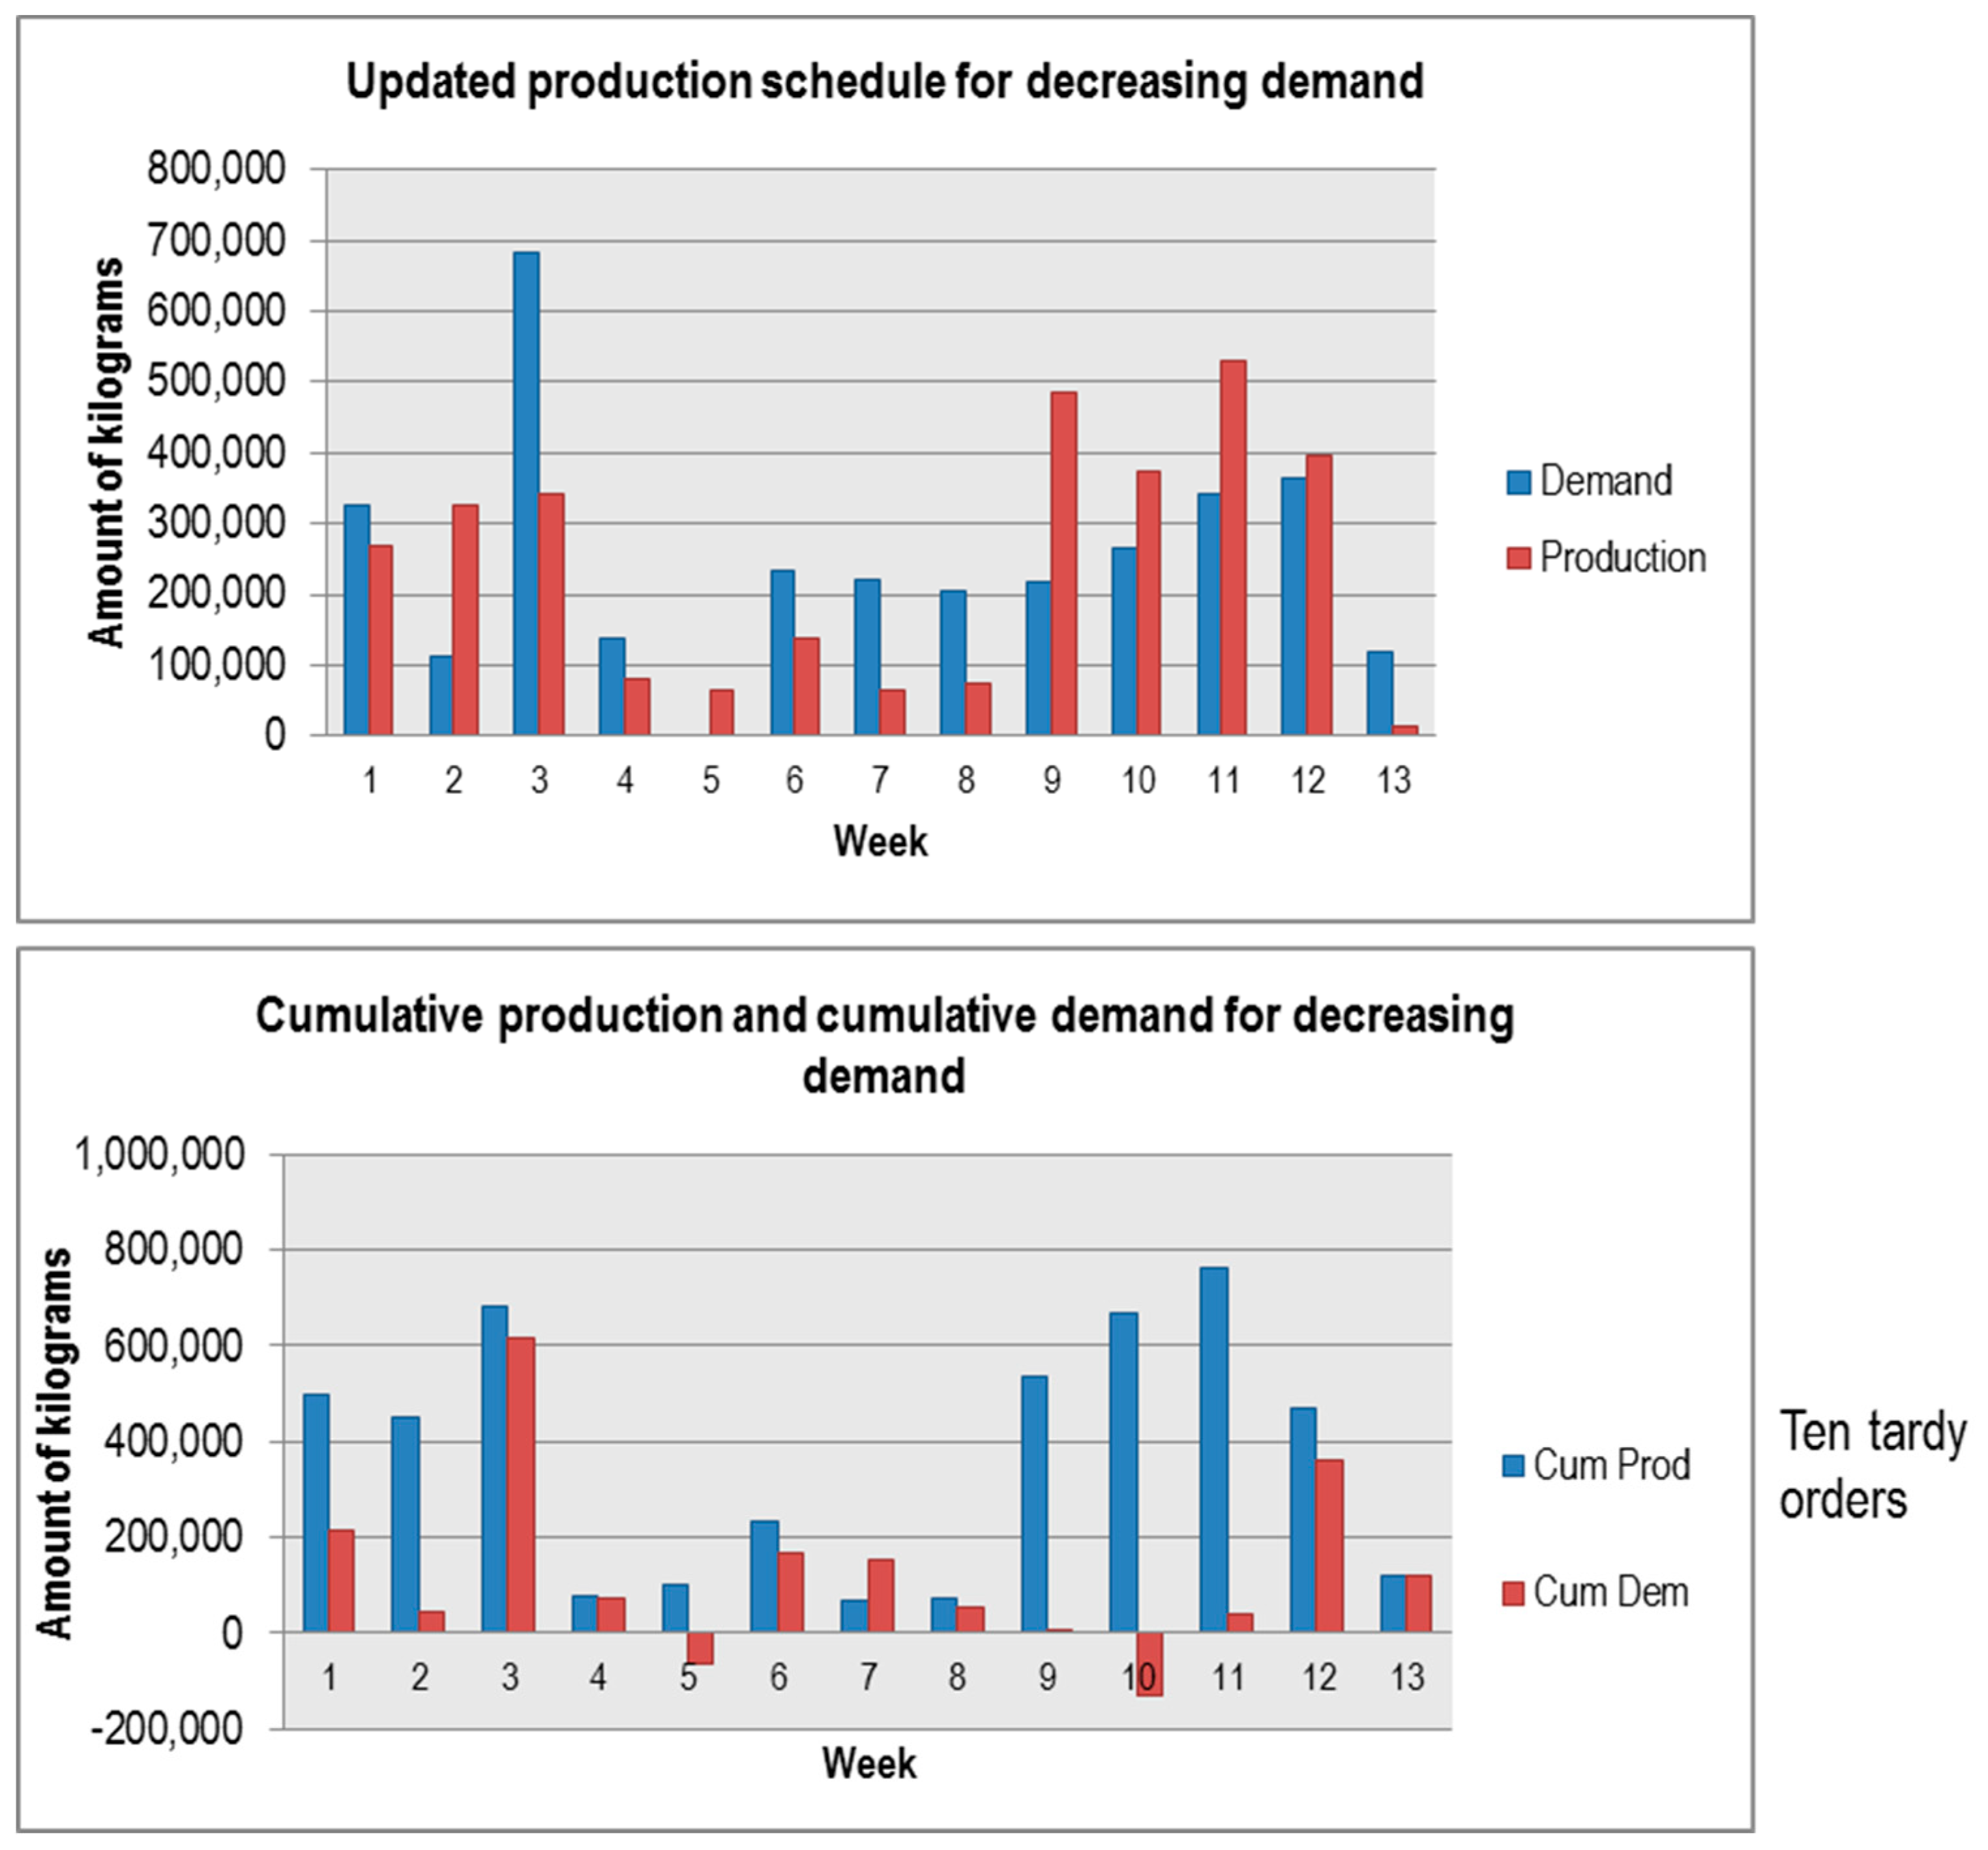
4.2. Reactive Scheduling for the Decreasing Demand Scenario

For the decreasing demand pattern, the results indicated the application of the reactive aggregate production scheduling approach in the green coffee SC. For this demand pattern: ten tardy orders for the initial production schedule, an 88% service level, and nineteen tardy orders from the estimated production results, a 77% service level (Figure 8). This value falls below the expected level. Consequently, Figure 9 shows the updated aggregate production schedule with tmod = 7 and E ̅= 2, resulting in ten tardy orders and an 88% service level.

4.3. Discussion

We undertake the analysis of the response surfaces of these fuzzy logic-based decision-making rules. Fuzzy logic is the decision-making rule approach used to generate a knowledge base for the CP Agent, the GS Agent, and the GP Agent as described in Section 3.3. The CP Agent comprises the Cherry coffee-growing yield estimation model, the hectares available for planting and the precipitation and agricultural practices data are used as input. The GS Agent uses the Parchment coffee sample’ quality scoring model with the gustatory and olfactory attributes of the sample as input data. The GP Agent comprises the Parchment coffee entries sorting process scheduling model, the percentage of defective coffee beans and the percentage of humidity of the coffee entry are used as input data. Appendix A describes the operating values for the fuzzy sets of the Fuzzy models of Cherry coffee-growing yield; quality scoring of the Robusta coffee sample; quality scoring of the Parchment coffee sample; sorting process scheduling of not-washed Robusta coffee entries; sorting process scheduling of Robusta coffee entries; and sorting process scheduling of Parchment coffee entries.
Regarding the Cherry coffee-growing yield model, the factors that have a significant effect on coffee yield are nutrition, pruning, and control of pests. The factors that have a significant effect from high values are nutrition and pruning. The factor that has a significant effect from low values is control of pests. The factors that do not have a negative effect on coffee yield are rainfall and temperature. The study of Paulo and Furlani Jr. [55] also found that adequate nutrition along with optimal planting density is expected to show high yield responses in coffee plantations.
For the Parchment coffee samples’ quality scoring model, ferment, sour, malodorous (FSM) is the factor that has a significant effect on coffee samples’ quality score. For the Altura coffee, acidity, chemical taste, flavor, aroma, and body must have high values. For the Extra prima coffee, aroma, acidity, and body must be contained in the medium values. For the Robusta coffee samples’ quality scoring model, the malodorous factor has a significant effect on the quality score, from medium values the coffee can be rejected, likewise, when sour is in the high values and ferment in the medium values. The factors that do not have a significant effect on the quality score are old and earthy. The factor that has a significant effect from high values is mold and sour. The presence of both factors, mold and old, has a significant effect on the quality score when they occur at high values. Through the development of a fuzzy expert system for sensorial evaluation of coffee bean attributes to derive quality scoring, Livio and Hodhod [38] found the ranges of the values of the attributes for the lowest and highest quality scores considering Fragrance, flavor, aftertaste, acidity, body, uniformity, balance, clean cup, sweetness, overall, and defects. Also from a fuzzy logic approach, the study of Flores and Pineda [39] conducted a similar analysis with the attributes brew, aroma, taste, aftertaste, and body.
Regarding the Parchment coffee entry sorting process scheduling model, both, Serious defects and minor defects, have a significant effect on sorting process scheduling. The green aspect factor does not have an effect on sorting process scheduling. The pellet factor has a significant effect from low values on sorting process scheduling. The humidity factor has a significant effect from medium to high values and results in complex sorting sequences. For the Robusta coffee entry sorting process scheduling model, both, serious defects and minor defects, have a significant effect from medium to high values on sorting process scheduling. The pellet factor has a significant effect from low to medium values on sorting process scheduling. The humidity factor has a significant effect from high values on sorting process scheduling. According to the a review study of the green coffee processing, Ghosh and Venkatachalapathy [42] asserted that achieving a 12% of humidity of coffee contributes to obtaining acceptable color, size along with the removal of pests for longer safe storage.. The weight factor does not have an effect on sorting process scheduling. Finally, for the not-washed Robusta coffee entry sorting process scheduling model, factors, serious defects, and minor defects have a significant effect from medium to high values on sorting process scheduling and result in complex sorting sequences. Factors, the green aspect, and humidity do not have an effect on sorting process scheduling.
Regarding the demand pattern scenarios analyzed, Figure 10 shows the input inventory of Parchment coffee and the output of green coffee. We noted that the input inventory and output inventory vary similar over time for the unimodal demand pattern, not the case for both the increasing and decreasing demand pattern. The ending input inventory level is at its highest for the increasing demand pattern and its zero for the decreasing demand pattern.
Computational experiments aim to explore use cases for the decision support system to investigate different demand patterns. For the decreasing demand pattern, the results indicated the application of the reactive aggregate production scheduling approach in the green coffee SC due to service level value below the expected level. However, it is important to keep in mind that these results are subject to the assumptions of the model, as well as to the selected parameters and the defined system configurations. Decisions are based on case information, consequently, the limitations relate to this aspect of a case-study- based research. This can lead to situations in which the selection of the decision-making rule approach used for the decision support agents presented in this study results in decisions that could impair the performance of the system.

5. Conclusions and Future Work

In this study, we attempt to tackle the challenge for the ASC regarding the need for logistic systems for planning and scheduling/rescheduling within the agro-industry. To this end, an agent-based model driven decision support system for a Mexican green coffee SC was depicted. Three scenarios of demand patterns were considered to conduct the experiments: increasing demand, unimodal demand, and decreasing demand. A simulation model underpins the decision support system taking into account the use of the SCOR-process oriented approach, a hybrid modeling perspective, agent-based modeling and DES, and an adaptive control approach. A theoretical implication of the use of the hybrid modeling perspective refers to its contribution to achieving model quality as a measure of how the agent-based simulation model appropriately represents the aspects of interest in the green coffee SC, as well as simultaneous execution of events and performance improvement through agent coordination, both benefits of agent-based modeling and simulation with DES combination reported by Zhou et al. [56].
A general perception of the decision-makers within the focal company regarding the functionality of the decision support system the effective response of the system to the disturbance caused by the delay in the arrival or shortage of raw materials, which requires a change in the production schedule. The decision support system can handle these changes while considering scenarios reflecting the context of green coffee production, scenarios where the demand skewed towards the end of the planning horizon, where the demand skewed towards the beginning of the planning, and where demand peaks in the middle of the planning horizon and falls under the available capacity on the first and last days of the horizon. The exhibition of the management process within the green coffee SC context may help practitioners and managers interested in implementing the agent-based modeling and simulation approach in order to increase the possibilities of successful adopting of the reactive aggregate production scheduling.
A social implication for the Cherry coffee producers relates to the determination of the agricultural practices that have a significant effect on coffee yield: nutrition, pruning, and control of pests. Regarding agricultural practices in the study region, Hernández et al. [41] assert that producers generally do not have regulations or recommendations on the use of different varieties of coffee available to them, the culture of soil analysis is practically non-existent, and chemical fertilization is carried out through recommendations from fellow producers, for economic convenience and in some cases, on the recommendation of a commercial agrochemical company. Also, the authors state that there is a culture of control of plantation density with machete, leaving vegetal cover to avoid erosion. However, negative experiences are registered with the use of herbicides both for poisoning in the personnel who apply the product and for the degradation of the soils with frequent use, which has generated a posture of reserved use of the pesticide. Therefore, there are no experiences of pesticide use to control pests or coffee diseases. In regard to the pruning of coffee trees, the practices include sanitary pruning. Finally, the authors report that the producers do not have a multi-year management plan for plant tissue, including renewal.
Future work may consist of including decision support regarding coffee harvesting scheduling and coffee commercialization. The first refers to the decision to harvest ripe Cherry coffee. The cutting of Cherry fruits in mature state results in weight gained in the scale, plus facilitates the wet benefit process, decreases waste when Parchment coffee is processed and the coffee beans gain organoleptic quality.
The second is related to the negotiation in the coffee commercialization among the actors in the chain. The Cherry coffee purchasing parameters include the region of the crop, height and average annual temperature of the coffee plantation, the variety of coffee, the percentage of mature grains, the Parchment coffee yield and the time elapsed since the cut. Parameters for trade-in Parchment coffee include dry Cherry percentage; humidity percentage; yield to green coffee; uniformity of color; the number of defective coffee beans with respect to the weight of the sample analyzed; coffee beans significantly free of improper aromas; and defective beans percentage in the coffee lot.

Author Contributions

A.A.A.-L. was in charge of project administration and the research related to the application of artificial intelligence techniques in the supply chain. M.d.R.P.-S. was in charge of the research project related to the application of the agent modeling approach in the supply chain. M.G.C.-C. was an advisor for the supply chain management of the case study. R.P.-G. proof-read the paper. M.J.d.M.-A. was a collaborator in the use of the simulation platform. J.C.H.-G. was a collaborator in the fieldwork and analysis of the collected data.

Funding

This research received no external funding.

Conflicts of Interest

The authors declare no conflict of interest.

Appendix A

Table A1, Table A2, Table A3, Table A4, Table A5 and Table A6 describes the operating values for the fuzzy sets of the Fuzzy models of coffee growing yield; quality scoring of the Robusta coffee sample; quality scoring of the Parchment coffee sample; sorting process scheduling of not-washed Robusta coffee inputs; sorting process scheduling of Robusta coffee inputs; and sorting process scheduling of Parchment coffee inputs.
Table A1. Fuzzy model for coffee growing yield: fuzzy sets and operating intervals.
Coffee Growing
InputKnowledge BaseOutput
VariableFuzzy SetVariableFuzzy Set
DefinitionIntervalDefinitionInterval
Nutrition (N)Very low[1, 1, 1]1620 inference rulesYield (Y)Very low[0, 3, 6, 10]
Low[1, 2, 2]
Appropriate[2, 3, 3]
High[3, 4, 4]
Very high[4, 5, 5]
Rainfall (R)Low [600, 600, 820, 1450]Low[7.5, 11, 13, 16]
Appropriate[1400, 1500, 1600, 1850]
High[1800, 1941, 2500, 2500]
Control of pests (CP)Null-minimum[0, 1, 1]
Protection[1, 2, 2]
Control of diseases (CD)Null-minimum[0, 1, 1]Medium[15, 20, 25, 32]
Protection[1, 2, 2]
Planting density (PD)Low[0, 1, 1]
Appropriate[1, 2, 2]
High[2, 3, 3]
Pruning (P)Not performed[0, 0, 0.27]High[30, 32, 40, 40]
Moderate[0.2, 0.5, 0.89]
Intense[0.75, 1, 1]
Temperature (T)Low[10, 10, 14, 22]
Appropriate[21, 23, 24, 26]
High[26, 28, 50, 50]
Table A2. Fuzzy model for quality scoring of the Robusta coffee sample: fuzzy sets and operating intervals.
Robusta Coffee Organoleptic Evaluation
InputKnowledge BaseOutput
VariableFuzzy SetVariableFuzzy Set
DefinitionIntervalDefinitionInterval
Ferment (F)Not present[0, 0, 1]4096 inference rulesRobusta class (RC)7.2[7.2, 7.2, 7.31]
Low[0.8, 1, 2]
Medium [1.8, 2, 3]
High[2.8, 3, 4]
Sour (S)Not present[0, 0, 1]
Low[0.8, 1, 2]
Medium [1.8, 2, 3]
High[2.8, 3, 4]
Malodorous (M)No[0, 0, 1]7.3[7.3, 7.3, 7.41]
Low [0.8, 1, 2]
Medium [1.8, 2, 3]
High[2.8, 3, 4]
Earthy (E)Not present[0, 0, 1]
Low [0.8, 1, 2]
Medium [1.8, 2, 3]
High[2.8, 3, 4]
Mold (M)Not present[0, 0, 1]Rejected[7.41, 7.41, 7.5]
Low[0.8, 1, 2]
Medium[1.8, 2, 3]
High[2.8, 3, 4]
Old (O)Not present[0, 0, 1]
Low [0.8, 1, 2]
Medium [1.8, 2, 3]
High[2.8, 3, 4]
Table A3. Fuzzy model for quality scoring of the Parchment coffee sample: fuzzy sets and operating intervals.
Parchment Coffee Organoleptic Evaluation
InputKnowledge BaseOutput
VariableFuzzy SetVariableFuzzy Set
DefinitionIntervalDefinitionInterval
Aroma (A)Null-little[0, 2, 2]96,000 inference rulesParchment class (PC)Altura[2, 2.8, 3,3]
Very low[2, 3, 3]
Low[3, 4, 4]
Medium[4, 5, 5]
High[5, 6, 6]
Flavor (F)Null-little[0, 2, 2]
Very low[2, 3, 3]
Low[3, 4, 4]
Medium[4, 5, 5]
High[5, 6, 6]Extra prima[2.8, 3, 3.8, 4]
Acidity (A)Null-little[0, 2, 2]
Very low[2, 3, 3]
Low[3, 4, 4]
Medium[4, 5, 5]
High[5, 6, 6]
Body (B)Low[1, 2, 2]
Medium[2, 3, 3]
High[3, 4, 4]
Vinous, Fruity, Sweetness (VFS)Not present[0, 1, 1]Oro [3.8, 4, 4.8, 5]
Low[1, 1, 2]
Medium [2, 2, 3]
High[3, 3, 4]
Green Immatureness (GI)Not present[0, 1, 1]
Present[1, 2, 2]
Cereal, Wood, Paper (CWP)Not present[0, 1, 1]
Present [1, 2, 2]
Dry, Old (DO)Not present[0, 1, 1]Rejected[4.8, 5, 5.8, 6]
Present [1, 2, 2]
Chemical, Medicinal (CM)Not present[0, 1, 1]
Present [1, 2, 2]
Ferment, Sour, Malodorous (FSM)Not present[0, 1, 1]
Present [1, 2, 2]
Earthy, Mold (EM)Not present[0, 1, 1]
Present [1, 2, 2]
Table A4. Fuzzy model for process scheduling of not-washed Robusta coffee entries: fuzzy sets and operating intervals.
Sorting Process Scheduling for Not-washed Robusta Coffee Entries
InputKnowledge BaseOutput
VariableFuzzy SetVariableFuzzy Set
DefinitionIntervalDefinitionInterval
Serious defects (SD)Normal[−13.5, −5.58, 9.17, 10.53]216 inference rulesNot-washed robusta Schedule 1 (nwrS1)Mix[0, 0.16, 0.33]
Regular[10.3, 10.5, 13, 13.5]Pneumatic[0.16, 0.33, 0.5]
Many[13, 13.5, 22, 22]Optical[0.33, 0.5, 0.66]
Minor defects (MD)Normal[−7.2, −0.8, 9, 9.2]Sift[0.5, 0.66, 0.83]
Many[9, 9.2, 20.23, 20.23]
Pellet (P)Normal[−1.79, 0.106, 3.32, 3.5]Not-washed robusta Schedule 2 (nwrS2)Pneumatic[0, 0.2, 0.4]
Regular[3.29, 3.68, 4.5]Optical[0.2, 0.4, 0.6]
Many[4.3, 4.64, 11.9, 11.9]Sift[0.4, 0.6, 0.8]
Green aspect (GA)Appropriate[−7.2, −0.8, 13.8, 14.9]
Low[14.7, 15.27, 15.8]
Very low[15.5, 16.4, 16.86]
Null-minimum[16.2, 17.01, 20, 20]Not-washed robusta Schedule 3 (nwrS3)Pneumatic[0, 0.2, 0.4]
Weight (W)Little [−1.7 × 10⁴, −7400, 9080, 9180]Optical[0.2, 0.4, 0.6]
Normal[7250, 8250, 1.44 × 10⁴, 1.45 × 10⁴]Sift[0.4, 0.6, 0.8]
Much[1.38 × 10⁴, 1.48 × 10⁴, 2.33 × 10⁵, 2.35 × 10⁵]
Table A5. Fuzzy model for process scheduling of Robusta coffee entries: fuzzy sets and operating intervals.
Sorting Process Scheduling for Robusta Coffee Entries
InputKnowledge BaseOutput
VariableFuzzy SetVariableFuzzy Set
DefinitionIntervalDefinitionInterval
Humidity (H)Exceeded[7.87, 9.47, 10.48, 11.4]864 inference rulesRobusta Schedule 1 (rS1)Mix[0, 0.16, 0.33]
Appropriate[10.8, 11, 12.5, 12.75]Pneumatic[0.16, 0.33, 0.5]
Low[12.5, 12.75, 13]Optical[0.33, 0.5, 0.66]
Null-little[12.75, 13, 15.7, 17.9]Sift[0.5, 0.66, 0.83]
Minor defects (MD)Normal[−9, −1, 9.497, 9.81]Dry[0.6, 0.83, 1]
Regular[9.5, 10, 13, 13]Dry little[0.83, 1, 1.16]
Many[12.83, 13.2, 20.5, 30]Robusta Schedule 2 (rS2)Pneumatic[0, 0.2, 0.4]
Serious defects (SD)Normal[−7.2, −0.8, 10, 10.5]Optical[0.2, 0.4, 0.6]
Many[10, 10.5, 20.23, 20.23]Sift[0.4, 0.6, 0.8]
Pellet (P)Normal[−4.814, −1.614, 2.286, 2.536]Dry[0.6, 0.8, 1]
Regular[2.29, 2.49, 3.49, 3.779]Dry little[0.8, 1, 1.2]
Many[3.5, 3.75, 10, 10]Robusta Schedule 3 (rS3)Pneumatic[0, 0.2, 0.4]
Green aspect (GA)Appropriate[7.32, 8.95, 11, 12.75]Optical[0.2, 0.4, 0.6]
Low[12.5, 12.75, 13]Sift[0.4, 0.6, 0.8]
Very low[12.75, 13, 14]Dry[0.6, 0.8, 1]
Null-minimum[13, 14, 18, 18]Dry little[0.8, 1, 1.2]
Weight (W)Little [−2988, −188, 8958, 9058]Robusta Schedule 4 (rS4)Pneumatic[0, 0.2, 0.4]
Normal[8100, 9100, 8.17 × 10⁴, 8.18 × 10⁴]Optical[0.2, 0.4, 0.6]
Sift[0.4, 0.6, 0.8]
Little [7.98 × 10⁴, 8 × 10⁴, 4.82 × 10⁵, 4.83 × 10⁵]Dry[0.6, 0.8, 1]
Dry little[0.8, 1, 1.2]
Table A6. Fuzzy model for process scheduling of Parchment coffee entries: fuzzy sets and operating intervals.
Sorting Process Scheduling for Parchment Coffee Entries
InputKnowledge BaseOutput
VariableFuzzy SetVariableFuzzy Set
DefinitionIntervalDefinitionInterval
Humidity (H)Exceeded[7.87, 9.47, 10.48, 11.4]128 inference rulesParchment Schedule 1 (pS1)Mix[0, 0.16, 0.33]
Pneumatic[0.16, 0.33, 0.5]
Appropriate[10.8, 11, 12.5, 12.75]Optical[0.33, 0.5, 0.66]
Sift[0.5, 0.66, 0.83]
Low[12.5, 12.75, 13]Dry[0.6, 0.83, 1]
Dry little[0.83, 1, 1.16]
Null-little[12.75, 13, 15.7, 17.9]Parchment Schedule 2 (pS2)Pneumatic[0, 0.2, 0.4]
Serious defects (SD)Normal[−9, −1, 2, 2.5]Optical[0.2, 0.4, 0.6]
Sift[0.4, 0.6, 0.8]
Many[2, 2.5, 20.5, 21.4]Dry[0.6, 0.8, 1]
Minor defects (MD)Normal[−14.4, −8.05, 2, 2.5]Dry little[0.8, 1, 1.2]
Parchment Schedule 3 (pS3)Pneumatic[0, 0.2, 0.4]
Many[2, 2.5, 22, 22.4]Optical[0.2, 0.4, 0.6]
Pellet (P)Normal[−3.6, −0.4, 0.5, 0.75]Sift[0.4, 0.6, 0.8]
Dry[0.6, 0.8, 1]
Many[0.5, 0.75, 11, 11]Dry little[0.8, 1, 1.2]
Green aspect (GA)Appropriate[7.32, 8.95, 11, 12.75]Parchment Schedule 4 (pS4)Pneumatic[0, 0.2, 0.4]
Optical[0.2, 0.4, 0.6]
Low[12.5, 12.75, 13]Sift[0.4, 0.6, 0.8]
Very low[12.75, 13, 14]Dry[0.6, 0.8, 1]
Null-minimum[13, 14, 18, 18]Dry little[0.8, 1, 1.2]

References

  1. Verdouw, C.N.; Robbemond, R.M.; Verwaart, T.; Wolfert, J.; Beulens, A.J.M. A reference architecture for IoT-based logistic information systems in agri-food supply chains. Enterp. Inf. Syst. 2015, 12, 755–779. [Google Scholar] [CrossRef]
  2. Macal, C.M.; North, M.J. Tutorial on agent-based modelling and simulation. J. Simul. 2010, 4, 151–162. [Google Scholar] [CrossRef]
  3. Zhang, W.J.; Xie, S.Q. Agent technology for collaborative process planning: A review. Int. J. Adv. Manuf. Technol. 2007, 32, 315–325. [Google Scholar] [CrossRef]
  4. Hilletofth, P.; Lättilä, L. Agent based decision support in the supply chain context. Ind. Manag. Data Syst. 2012, 112, 1217–1235. [Google Scholar] [CrossRef]
  5. Power, D.J.; Sharda, R. Model-driven decision support systems: Concepts and research directions. Decis. Support Syst. 2007, 43, 1044–1061. [Google Scholar] [CrossRef]
  6. Van der Vorst, J.G.A.J.; Tromp, S.; van der Zee, D.J. Simulation modelling for food supply chain redesign; integrated decision making on product quality, sustainability and logistics. Int. J. Prod. Res. 2009, 47, 6611–6631. [Google Scholar] [CrossRef]
  7. Yasmine, A.S.L.E.; Ghani, B.A.; Trentesaux, D.; Bouziane, B. Supply Chain Management Using Multi-Agent Systems in the Agri-Food Industry. In Service Orientation in Holonic and Multi-Agent Manufacturing and Robotics; Borangiu, T., Trentesaux, D., Thomas, A., Eds.; Springer: Berlin, Germany, 2014; pp. 145–155. [Google Scholar]
  8. Utomo, D.S.; Onggo, B.S.; Eldridge, S. Applications of agent-based modelling and simulation in the agri-food supply chains. Eur. J. Oper. Res. 2017, 269, 794–805. [Google Scholar] [CrossRef]
  9. Chatfield, D.C.; Hayya, J.C.; Harrison, T.P. A multi-formalism architecture for agent-based, order-centric supply chain simulation. Simul. Model. Pract. Theory 2007, 15, 153–174. [Google Scholar] [CrossRef]
  10. Macal, C.M. Everything you need to know about agent-based modelling and simulation. J. Simul. 2016, 10, 144–156. [Google Scholar] [CrossRef]
  11. Van der Vorst, J.G.A.J.; Beulens, A.J.M. Identifying sources of uncertainty to generate supply chain redesign strategies. Int. J. Phys. Distrib. Logist. Manag. 2002, 32, 409–430. [Google Scholar] [CrossRef]
  12. Suarez-Barraza, M.F.; Miguel-Davila, J.; Vasquez-García, C.F. Supply chain value stream mapping: A new tool of operation management. Int. J. Qual. Reliab. Manag. 2016, 33, 518–534. [Google Scholar] [CrossRef]
  13. Van der Zee, D.J.; van der Vorst, J.G.A.J. A modeling framework for supply chain simulation: Opportunities for improved decision making. Decis. Sci. 2005, 36, 65–95. [Google Scholar] [CrossRef]
  14. Bui, T.; Lee, J. An agent-based framework for building decision support systems. Decis. Support Syst. 1999, 25, 225–237. [Google Scholar] [CrossRef]
  15. Turban, E.; Aronson, J.E.; Liang, T.P. Decision Support Systems and Intelligent Systems, 7th ed.; Prentice Hall: Upper Saddle River, NJ, USA, 2005. [Google Scholar]
  16. Jain, L.C.; Lim, C.P.; Nguyen, N.T. Innovations in knowledge processing and decision making in agent-based systems. In Knowledge Processing and Decision Making in Agent-Based Systems; Jain, L.C., Nguyen, N.T., Eds.; Springer: Berlin, Germany, 2009; pp. 1–12. [Google Scholar]
  17. Mařík, V.; McFarlane, D. Industrial adoption of agent-based technologies. IEEE Intell. Syst. 2005, 20, 27–35. [Google Scholar] [CrossRef]
  18. Mattia, A. A multi-dimensional view of agent-based decisions in supply chain management. Commun. IBIMA 2012, 2012. [Google Scholar] [CrossRef]
  19. Méndez, C.A.; Cerdá, J.; Grossmann, I.E.; Harjunkoski, I.; Fahl, M. State-of-the-art review of optimization methods for short-term scheduling of batch processes. Comput. Chem. Eng. 2006, 30, 913–946. [Google Scholar] [CrossRef]
  20. Phanden, R.K.; Jain, A.; Verma, R. Integration of process planning and scheduling: A state-of-the-art review. Int. J. Comput. Integr. Manuf. 2011, 24, 517–534. [Google Scholar] [CrossRef]
  21. Barbati, M.; Bruno, G.; Genovese, A. Applications of agent-based models for optimization problems: A literature review. Expert Syst. Appl. 2012, 39, 6020–6028. [Google Scholar] [CrossRef]
  22. Lee, J.H.; Kim, C.O. Multi-agent systems applications in manufacturing systems and supply chain management: A review paper. Int. J. Prod. Res. 2008, 46, 233–265. [Google Scholar] [CrossRef]
  23. Monostori, L.; Váncza, J.; Kumara, S.R.T. Agent-based systems for manufacturing. CIRP Ann. 2006, 55, 697–720. [Google Scholar] [CrossRef]
  24. Van der Vorst, J.G.A.J.; Beulens, A.J.M.; van Beek, P. Innovations in logistics and ICT in food supply chain networks. In Innovations in Agri-Food Systems. Product Quality and Consumer Acceptance; Jongen, W.M.F., Meulenberg, M.T.G., Eds.; Wageningen Academic Publishers: Wageningen, The Netherlands, 2005; pp. 245–292. [Google Scholar]
  25. Ali, J.; Kumar, S. Information and communication technologies (ICTs) and farmers’ decision-making across the agricultural supply chain. Int. J. Inf. Manag. 2011, 31, 149–159. [Google Scholar] [CrossRef]
  26. Borodin, V.; Bourtembourg, J.; Hnaien, F.; Labadie, N. Handling uncertainty in agricultural supply chain management: A state of the art. Eur. J. Oper. Res. 2016, 254, 348–359. [Google Scholar] [CrossRef]
  27. Higgins, A.J.; Miller, C.J.; Archer, A.A.; Ton, T.; Fletcher, C.S.; McAllister, R.R.J. Challenges of operations research practice in agricultural value chains. J. Oper. Res. Soc. 2010, 61, 964–973. [Google Scholar] [CrossRef]
  28. Tsolakis, N.K.; Keramydas, C.A.; Toka, A.K.; Aidonis, D.A.; Iakovou, E.T. Agrifood supply chain management: A comprehensive hierarchical decision-making framework and a critical taxonomy. Biosyst. Eng. 2014, 120, 47–64. [Google Scholar] [CrossRef]
  29. Van der Vorst, J.G.A.J.; van Kooten, O.; Luning, P.A. Towards a diagnostic instrument to identify improvement opportunities for quality controlled logistics in agrifood supply chain networks. J. Food Syst. Dyn. 2011, 2, 94–105. [Google Scholar]
  30. Handayati, Y.; Simatupang, T.M.; Perdana, T. Value Co-creation in Agri-chains Network: An Agent-Based Simulation. Procedia Manuf. 2015, 4, 419–428. [Google Scholar] [CrossRef]
  31. Zimon, D.; Domingues, P. Proposal of a concept for improving the sustainable management of supply chains in the textile industry. Fibres Text. East. Eur. 2018, 26, 8–12. [Google Scholar] [CrossRef]
  32. Killian, B.; Jones, C.; Pratt, L.; Villalobos, A. Is sustainable agriculture a viable strategy to improve farm income in Central America? A case study on coffee. J. Bus. Res. 2006, 59, 322–330. [Google Scholar] [CrossRef]
  33. Kilian, B.; Rivera, L.; Soto, M.; Navichoc, D. Carbon Footprint across the Coffee Supply Chain: The Case of Costa Rican Coffee Bernard. J. Agric. Sci. Technol. B 2013, 3, 151–170. [Google Scholar]
  34. Espinosa-Solares, T.; Cruz-Castillo, J.G.; Montesinos-López, O.A.; Hernández-Montes, A. Raw coffee processing yield affected more by cultivar than by harvest date. J. Agric. Univ. P. R. 2005, 89, 169–180. [Google Scholar]
  35. Bosselmann, A.S.; Dons, K.; Oberthur, T.; Olsen, C.S.; Ræbild, A.; Usma, H. The influence of shade trees on coffee quality in small holder coffee agroforestry systems in Southern Colombia. Agric. Ecosyst. Environ. 2009, 129, 253–260. [Google Scholar] [CrossRef]
  36. Feria-Morales, A.M. Examining the case of green coffee to illustrate the limitations of grading systems/expert tasters in sensory evaluation for quality control. Food Qual. Prefer. 2002, 13, 355–367. [Google Scholar] [CrossRef]
  37. Livio, J.; Flores, W.C.; Hodhod, R.; Umphress, D. Smart fuzzy cupper: Employing approximate reasoning to derive coffee bean quality scoring from individual attributes. In Proceedings of the IEEE International Conference on Fuzzy Systems, Rio de Janeiro, Brazil, 8–13 July 2018; pp. 1–7. [Google Scholar]
  38. Livio, J.; Hodhod, R. AI Cupper: A Fuzzy Expert System for Sensorial Evaluation of Coffee Bean Attributes to Derive Quality Scoring. IEEE Trans. Fuzzy Syst. 2018, 26, 3418–3427. [Google Scholar] [CrossRef]
  39. Flores, W.C.; Pineda, G.M. A type-2 fuzzy logic system approach to train Honduran coffee cuppers. In Proceedings of the 2016 IEEE Latin American Conference on Computational Intelligence, Cartagena, Colombia, 2–4 November 2016; pp. 1–7. [Google Scholar]
  40. FAO Faostat. Available online: http://www.fao.org/faostat/en/#data/QC (accessed on 27 March 2019).
  41. Hernández, G.; Escamilla, S.; Velázquez, T.; Martínez, J.L. Análisis de la cadena de suministro del café en el Centro de Veracruz: Situación actual, retos y oportunidades. In Cafeticultura en la Zona Centro del Estado de Veracruz. Diagnóstico, Productividad y Servicios Ambientales; López, R., Sosa, V.D.J., Díaz, G., Contreras, H.A., Eds.; Instituto Nacional de Investigaciones Forestales, Agrícolas y Pecuarias: Veracruz, Mexico, 2013; pp. 8–36. [Google Scholar]
  42. Ghosh, P.; Venkatachalapathy, N. Processing and Drying of Coffee—A review. Int. J. Eng. Res. Technol. 2014, 3, 784–794. [Google Scholar]
  43. Ramalakshmi, K.; Kubra, I.R.; Rao, L.J.M. Physicochemical characteristics of green coffee: Comparison of graded and defective beans. J. Food Sci. 2007, 72, 333–337. [Google Scholar] [CrossRef]
  44. Lambert, D.M.; García-Dastugue, S.J. An evaluation of process-oriented supply chain management frameworks. J. Bus. Logist. 2005, 26, 25–51. [Google Scholar] [CrossRef]
  45. Persson, F. SCOR template—A simulation based dynamic supply chain analysis tool. Int. J. Prod. Econ. 2011, 131, 288–294. [Google Scholar] [CrossRef]
  46. Estampe, D.; Lamouri, S.; Paris, J.L.; Brahim-djelloul, S. A framework for analysing supply chain performance evaluation models. Int. J. Prod. Econ. 2013, 142, 247–258. [Google Scholar] [CrossRef]
  47. Lockamy, A., III; Mccormack, K. Linking SCOR planning practices to supply chain performance An exploratory study. Int. J. Oper. Prod. Manag. 2004, 24, 1192–1218. [Google Scholar] [CrossRef] [Green Version]
  48. Bolstorff, P.; Rosenbaum, R. Supply Chain Excellence: A Handbook for Dramatic Improvement Using the SCOR Model, 2nd. ed.; AMACOM: New York, NY, USA, 2007. [Google Scholar]
  49. Sawik, T. Integer programming approach to reactive scheduling in make-to-order manufacturing. Math. Comput. Model. 2007, 46, 1373–1387. [Google Scholar] [CrossRef]
  50. Fleischmann, B.; Meyr, H.; Wagner, M. Advanced Planning. In Supply Chain Management and Advanced Planning: Concepts, Models, Software and Case Studies; Stadtler, H., Kilger, C., Eds.; Springer: Berlin, Germay, 2002; pp. 81–106. [Google Scholar]
  51. Vieira, G.E.; Herrmann, J.W.; Lin, E. Rescheduling manufacturing systems: A framework of strategies, policies, and methods. J. Sched. 2003, 6, 39–62. [Google Scholar] [CrossRef]
  52. Swaminathan, J.M.; Smith, S.F.; Sadeh, N.M. Modeling supply chain dynamics: A multiagent approach. Decis. Sci. 1998, 29, 607–632. [Google Scholar] [CrossRef] [Green Version]
  53. Rzevski, G.; Andreev, M.; Skobelev, P.; Shveykin, P.; Tugashev, A.; Tsarev, A. Adaptive Planning for Supply Chain Networks. In Proceedings of the Holonic and Multi-Agent Systems for Manufacturing; Springer: Berlin, Germany, 2007; pp. 215–224. [Google Scholar]
  54. Sawik, T. Multi-objective master production scheduling in make-to-order manufacturing. Int. J. Prod. Res. 2007, 45, 2629–2653. [Google Scholar] [CrossRef]
  55. Paulo, E.M.; Furlani, E., Jr. Yield performance and leaf nutrient levels of coffee cultivars under different plant densities. Sci. Agric. 2010, 67, 720–726. [Google Scholar] [CrossRef] [Green Version]
  56. Zhou, R.; Lee, H.P.; Nee, A.Y.C. Simulating the generic job shop as a multi-agent system. Int. J. Intell. Syst. Technol. Appl. 2008, 4, 5–33. [Google Scholar] [CrossRef] [Green Version]
Figure 1. The green coffee SC under investigation.
Applsci 09 04903 g001
Figure 2. The typical demand for green coffee declines in autumn (September–December) and peaks in spring (March–June).
Applsci 09 04903 g002
Figure 3. General methodology.
Applsci 09 04903 g003
Figure 4. Level three process elements comprising the make-to-order process at the focal company.
Applsci 09 04903 g004
Figure 5. Flexible flow production system of the green coffee producer.
Applsci 09 04903 g005
Figure 6. Initial production schedule and estimated production results for increasing demand.
Applsci 09 04903 g006
Figure 7. Initial production schedule and estimated production results for unimodal demand.
Applsci 09 04903 g007
Figure 8. Initial production schedule and estimated production results for decreasing demand.
Applsci 09 04903 g008
Figure 9. Updated production schedule for decreasing demand and tmod = 7 and E ̅= 2
Applsci 09 04903 g009
Figure 10. Production/Input inventory/Output inventory results for increasing, unimodal and decreasing demand.
Applsci 09 04903 g010
Table 1. Agents and activities for the green coffee SC.
AgentActivities
Cherry-coffee producer Production Agent (CP Agent)Production
Cherry-coffee producer Delivery Agent (CD Agent)Satisfy market demand
Parchment-coffee producer Source Agent (PS Agent)Source Products
Parchment-coffee producer Delivery Agent (PD Agent)Satisfy market demand
Green-coffee producer Source Agent (GS Agent)Source Products
Verify Products
Green-coffee producer Production Agent (GP Agent)Plan Production
Production
Green -coffee producer Inventory Agent (GI Agent)Update inventory
Green-coffee producer Reschedule Agent (GR Agent)Update Plan Production
Green-coffee producer Delivery Agent (GD Agent)Satisfy market demand
Wholesale Market Agent (WM Agent)Place order
Table 2. Variable codification in the knowledge base of the Mamdani type model for coffee growing yield.
VariablesDefinitionMeasurement Units
Nutrition (N)Agricultural practice related to the transfer of nutrients to the coffee plantationNumber of applications
Rainfall (R)Uncertain event that supplies water to the coffee plantationmm/month
Control of pests (CP)Agricultural practice that controls pests that affect yield Number of applications
Control of diseases (CD)Agricultural practice that controls the disease that affects yield Number of applications
Planting density (PD)Operational variable related to the amount of planted bushes in the coffee plantationm2/ha
Pruning (P)Agricultural practice related to the cutting of undergrowth to leave a vegetative cover and prevent erosionq/ha
Temperature (T)Uncertain event that supplies heat to the coffee plantation°C
Yield (Y)Linguistic expression that represents the Cherry coffee growth yield obtained at the coffee plantationq/ha
Table 3. Variable codification in the knowledge base of the Mamdani type models for quality scoring of a coffee sample.
VariablesDefinitionMeasurement UnitsStatus
Robusta coffee sample
Ferment (F)Operational variable related to the fermented taste that detracts from the quality of the coffeeNumerical scoreInput
Sour (S)Operational variable related to the sour taste that detracts from the quality of the coffeeNumerical scoreInput
Malodorous (M)Operational variable related to the acetic acid smell related to the fermented tasteNumerical scoreInput
Earthy (E)Operational variable related to the earthy taste and smell that detract from the quality of the coffeeNumerical scoreInput
Mold (M)Operational variable related to the mold taste that detracts from the quality of the coffeeNumerical scoreInput
Old (O)Operational variable related to the aged taste that detracts from the quality of the coffeeNumerical scoreInput
Robusta Class (RC)Linguistic expression that represents the robusta coffee class obtained from the organoleptic evaluationQuality scoreOutput
Parchment coffee sample
Aroma (A)Operational variable related to the aromatic impression due to the volatile substances of coffee Numerical scoreInput
Flavor (F)Operational variable related to the balanced impression due to the combination of gustatory and olfactory attributes perceived in coffeeNumerical scoreInput
Acidity (A)Operational variable related to the gustatory impression due to organic acids contributing to liveliness, sweetness and fresh-fruit coffee’s characterNumerical scoreInput
Body (B)Operational variable related to the feeling of fullness and consistency in the mouth, particularly when it is perceived between the tongue and the palateNumerical scoreInput
Vinous, Fruity, Sweetness (VFS)Operational variable related to a pleasing fullness of flavor due to the presence of certain carbohydrates Numerical scoreInput
Green, Immatureness (GI)Operational variable related to the astringent taste that detract from the quality of the coffeeNumerical scoreInput
Cereal, Wood, Paper (CWP)Operational variable related to the cereal taste that detract from the quality of the coffeeNumerical scoreInput
Dry, Old (DO)Operational variable related to the aged taste that detract from the quality of the coffeeNumerical scoreInput
Chemical, Medicinal (CM)Operational variable related to the chemical taste that detract from the quality of the coffeeNumerical scoreInput
Ferment, Sour, Malodorous (FSM)Operational variable related to the ferment taste and smell that detract from the quality of the coffeeNumerical scoreInput
Earthy, Mold (EM)Operational variable related to the earthy taste and smell that detract from the quality of the coffeeNumerical scoreInput
Parchment Class (PC)Linguistic expression that represents the Parchment coffee class obtained from the organoleptic evaluationQuality scoreOutput
Table 4. Variable codification in the knowledge base of the Mamdani type models for sorting process scheduling of coffee entries.
Variables.DefinitionMeasurement UnitsStatus
Serious defects (SD)Operational variable related to the number of defective coffee beans associated with appearance (black, white, amber, and with irregular spots)% of defective beansInput
Minor defects (MD)Operational variable related to the amount of malformed (shell and ear) coffee beans% of defective beansInput
Pellet (P)Operational variable related to the number of broken coffee beans% of defective beansInput
Green aspect (GA)Operational variable related to the number of immature coffee beans of black-Green color% of defective beansInput
Weight (W)Operational variable related to the number of kilograms entering the process schedulekilogramsInput
Humidity (H)Operational variable related to the water content of the coffee beans% of humidityInput
Not-washed Robusta coffee entry
Not-washed robusta Schedule 1 (nrS1)Linguistic expression that represents the process schedule: mix, pneumatic sorting, optical sorting, and sift sortingNumber of processesOutput
Not-washed robusta Schedule 2 (nrS2); Not-washed robusta Schedule 3 (nrS3)Linguistic expression that represents the process schedule: pneumatic sorting, optical sorting, and sift sortingNumber of processesOutput
Robusta coffee entry
Robusta Schedule 1 (rS1)Linguistic expression that represents the process schedule: mix, pneumatic sorting, optical sorting, sift sorting, dry, and dry littleNumber of processesOutput
Robusta Schedule 2 (rS2); Robusta Schedule 3 (rS3); Robusta Schedule 4 (rS4)Linguistic expression that represents the process schedule: pneumatic sorting, optical sorting, sift sorting, dry, and dry littleNumber of processesOutput
Parchment coffee entry
Parchment Schedule 1 (pS1)Linguistic expression that represents the process schedule: mix, pneumatic sorting, optical sorting, sift sorting, dry, and dry littleNumber of processesOutput
Parchment Schedule 2 (pS2); Parchment Schedule 3 (pS3); Parchment Schedule 4 (pS4)Linguistic expression that represents the process schedule: pneumatic sorting, optical sorting, sift sorting, dry, and dry littleNumber of processesOutput
Table 5. Indices.
Table 5. Indices.
IndexDefinition
iProcessing stage, I ∈ I = (1, …, m)
jWholesaler order, j ∈ J = (1, …, n)
kCoffee type, k ∈ K = (1, …, r)
tPlanning period, t ∈ T = (1, …, h)
Table 6. Model parameters.
ParameterDefinition
aj, dj, sjArrival date, due date, size of order j
bjProduction lot for order j
citProcessing time available in period t on each machine in stage i
miNumber of identical, parallel machines in stage i
nNumber of customer orders to be scheduled
pijProcessing time in stage i of each product in order j
Ji ⊆ J{j ∈ J: pij > 0} subset of wholesaler orders to be processed in stage i
J1 ⊆ JSubset of small wholesaler orders
J2 ⊆ JSubset of large wholesaler orders
JkSubset of wholesaler orders for coffee type k
Table 7. Variables.
Table 7. Variables.
VariableDefinition
uj1, if order j is completed after due date; otherwise uj = 0
xjt1, if order j is performed in period t; otherwise xjt = 0
yjtFraction of customer order j to be processed in period t
Table 8. Rescheduling parameters.
ParameterDefinition
h’new planning horizon
E ̅upper limit on maximum earliness
tmodthe planning period immediately following modification of orders
Jmodset of modified orders
Joldsubset of orders in J remaining for completion without modification
JNold, JSoldsubset of orders in Jold, respectively non-reschedulable, reschedulable
Tnew{h + 1, …, h’} set of new planning periods
Told{tmod, …, h} subset of remaining planning periods in T
TNoldsubset of periods in Told with fixed assignment of orders in Jold
Table 9. Model validation data.
ReplicateXjYjZj = Xj − Yj(Zj − Z ̅10)2
127,176.0027,935.05−759.05360,735.09
227,901.0027,811.7089.3061,373.56
327,348.0027,734.25−386.2551,899.30
428,004.0028,754.03−750.03349,980.98
527,733.0027,417.09315.91225,007.48
627,914.0028,561.69−647.69239,364.85
727,682.0027,270.03411.97325,361.82
828,412.0028,461.21−49.2111,929.89
927,197.0026,779.30417.70331,930.58
1027,996.0028,223.02−227.024,703.48
Sum −1,584.361,962,287.05
Average27,736.3027,894.74−158.44
Table 10. Simulation results of the pilot replicas.
ReplicateGood Green Coffee Beans (Kilograms)
127,900.2004
227,907.4386
327,905.3017
427,889.3183
527,895.6686
627,853.6233
727,934.5803
827,896.9872
927,863.0423
1027,889.3104
Average27,894.7358
Standard deviation24.9877

