Article

Broadband Photo-Excited Coherent Acoustic Frequency Combs and Mini-Brillouin-Zone Modes in a MQW-SESAM Structure

1
Department of Physics and Center of Applied Photonics, University of Konstanz, D-78457 Konstanz, Germany
2
LAUM, UMR-CNRS 6613, Le Mans Université, Avenue O. Messiaen, 72085 Le Mans, France
3
Institute of Ion Beam Physics and Materials Research, Helmholtz-Zentrum Dresden-Rossendorf, D-01328 Dresden, Germany
4
Institute for Technical Physics, German Aerospace Center (DLR), D-70569 Stuttgart, Germany
5
Research Center for Non-Destructive Testing GmbH, 4040 Linz, Austria
*
Author to whom correspondence should be addressed.
Appl. Sci. 2019, 9(2), 289; https://doi.org/10.3390/app9020289
Submission received: 4 December 2018 / Revised: 6 January 2019 / Accepted: 8 January 2019 / Published: 15 January 2019
(This article belongs to the Special Issue Laser Ultrasonics)

Abstract

:

Featured Application

Semiconductor saturable absorber mirrors can be characterized non-destructively by their coherent acoustic response in the sub-THz range. Optical below-bandgap generation of coherent acoustic phonons opens a new way to investigate light-matter interaction dynamics in a long-period semiconductor superlattice on picosecond time scales.

Abstract

A multiple quantum-well semiconductor saturable absorber mirror (MQW-SESAM) structure has been investigated by femtosecond pump-probe laser spectroscopy at a central wavelength of around 1050 nm. Coherent acoustic phonons are generated and detected over a wide frequency range from ~15 GHz to ~800 GHz. In the optical absorption region, i.e., in the multiple quantum wells (In0.27Ga0.73As), acoustic frequency combs centered at ~365 GHz, with a comb spacing of ~33 GHz, are generated. Most importantly, in the transparent region, i.e., in the distributed Bragg reflector, which is formed by a non-doped long-period semiconductor GaAs/Al0.95Ga0.05As superlattice, the mini-Brillouin-zone center, as well as zone-edge acoustic modes, are observed. The mini-zone-center modes with a fundamental frequency of 32 GHz can be attributed to the spatial modulation of the pump optical interference field with a period very close to that of the distributed Bragg reflector, in combination with the periodic spatial modulation of the electrostriction coefficient in the distributed Bragg reflector. The excitation of mini-zone-edge modes is attributed to the stimulated subharmonic decay of the fundamental center modes. Their subsequent back-folding to the mini-Brillouin-zone center makes them Raman active for the probe light.

1. Introduction

Periodic structures such as multiple quantum wells (MQWs) and superlattices (SLs) have been used as attractive tools for the observation of folded longitudinal coherent acoustic phonons (LCAPs) [1,2]. A broad range of possible applications based on periodic structures have been proposed and investigated ranging from tailored heat transport for thermoelectric applications to new optomechanical systems and the development of acoustic phonon amplification, i.e., sasers [3,4,5]. Despite the intense research in this field, even periodic planar film systems still exhibit new and surprising features regarding their acoustic behavior, in particular in pump-probe experiments. All-optical femtosecond pump-probe spectroscopy allows us to gain insightful knowledge of the acoustic phonon behavior in both the light absorbing and transparent regions of a semiconductor SL structure by the selection of optimal pump and probe wavelengths [6]. If light absorption is involved in semiconductors, then coherent acoustic phonons are excited mainly due to the deformation potential interaction or the inverse piezoelectric effect related to electron-hole excitation via inter-band light absorption [7,8]. If the deformation potential mechanism is suppressed by the process of ultrafast electron-hole recombination as in amorphous semiconductors, the thermo-elastic effect can also play a role in coherent acoustic phonon generation through energy transfer from excited hot electrons to phonons in semiconductors [7]. Although direct semiconductors do not exhibit photoexcitation of carriers for optical pump below-bandgap excitation, the electric field of the incident light itself can induce stress via electrostriction [7]. So far, a great number of observations have been obtained regarding folded LCAPs in light absorbing periodic materials [9,10], and coherent acoustic phonons have also been studied near the absorption region of spacer materials sandwiched by two distributed Bragg reflectors (DBRs) in cavity optomechanical semiconductor devices [11,12]. When the laser energy was around 10 meV below the bandgap of the spacer material, electrostriction was ruled out as the driving mechanism for mechanical cavity modes, while optoelectronic deformation potential interactions turned out to play an important role in the near-bandgap acoustic phonon excitation. There are also some observations of acoustic phonon excitation through electrostriction in ferroelectric materials and liquids [13,14]. However, it is not common to find experimental demonstrations of the electrostriction excitation mechanism in transparent semiconductor heterostructures and SLs where the LCAPs spectrum exhibits mini-Brillouin-zone (MBZ) center and edge modes. Because the artificial periodic structure introduces a much larger period than the lattice constant of bulk materials (e.g., GaAs, AlAs), the original Brillouin zone is required to be folded into a MBZ with a new boundary of k = π/dSL, where k denotes the wavevector and dSL denotes the SL period. Therefore, multiple high frequency modes can appear at and near the MBZ-zone center k = 0. The folded modes with wavevectors 0 ≤ k ≤ 2qprobe, where qprobe denotes the wavevector of the probe light in the SL, can fulfill the wavevector conservation selection rule, and thus become Raman active in optical spectroscopy [15]. Once the wavevector 2qprobe exceeds the boundary of the MBZ, Umklapp processes have to be taken into account, making it possible to detect LCAP modes with k = |2qprobe − 2mπ/dSL|, where m is an integer [16]. Nonetheless, mini-zone-edge modes are usually not observable in optical spectroscopy because the wavevector conservation rule cannot be satisfied at k = kmax = π/dSL.
However, there are indeed a few experiments showing that MBZ-edge modes can be observed in some structures [17,18,19,20]. In quantum cascade laser structures consisting of SL formed by a doped and non-doped GaAs and AlGaAs layers with a thickness range from several nm to around 35 nm, edge modes were observed above a temperature of 150 K and at room temperature, which is attributed to a symmetry breakdown and the effects of the doping of some of the constituting layers [17]. Beardsley et al. [18] observed edge modes in a n+-GaAs/AlAs SL at low temperature and proposed that the free-carriers in the SL enable momentum conservation through photon-phonon scattering. The electrons confined in quantum wells (QWs) can absorb a momentum that is less than kmax ≈ π/LQW, where LQW means the thickness of the QW. Thus, the excess momentum k − 2qprobe in the backward scattering of probe light can be absorbed if |π/dSL − 2qprobe| ≤ π/LQW. In stationary or frequency-domain Raman experiments on thermal phonons, the observations of mini-zone-edge phonons are attributed to disorder-induced qz-non-conserving scattering, which can be caused, for example, by interface roughness [19] and interface defects [20] in GaAs/AlAs superlattices. Finally, Brillouin zone edge phonons in KTaO3 and TiO2 crystals, coherently and resonantly induced by crossed two near-infrared laser beams, are observed in coherent anti-Stokes Raman scattering (CARS) spectroscopy [21,22,23,24]. The observation of the overtones of Brillouin edge modes in those crystals is supported by the folding of X-point phonons onto the Γ-point due to grating formation by coherent phonons.
In this paper, we report on the generation and detection of CLAPs in a MQW- semiconductor saturable absorber mirror (SESAM) structure performed by femtosecond time-domain spectroscopy (high-speed asynchronous optical sampling) in a reflection geometry at a wavelength of around 1050 nm for both pump and probe laser sources. The MQW-SESAM structure exhibits multiple QWs as embedded saturable absorber layers and a distributed Bragg mirror (DBR) which are spatially separated by GaAs and AlGaAs layers. Both of the pump and probe photon energies are above the bandgap of the saturable absorber layers but below that of constituting materials of the DBR, whose reflectance is close to 100% for our laser wavelengths. Due to the high detection sensitivity of our pump-probe system, we are able to observe not only very pronounced LCAPs excited in the MQW region, but also much weaker acoustic phonon contributions which can be attributed to folded LCAPs excited in the transparent DBR region.
Our findings demonstrate the first simultaneous observation of MBZ-center and -edge modes in a transparent non-doped long-period semiconductor SL. The detailed discussion of the MBZ mode excitation and detection in our experiment will be given in Section 3.2. In addition, the broadband coherent acoustic frequency combs ranging from ~30 GHz to ~800 GHz monitored in the light absorbing MQW region enables us to non-destructively characterize our SESAM structure (Section 3.1). Finally, the structure-related complexity of our experimental phonon spectrum will be discussed in Appendix A.

2. Experimental Procedure

The MQW-SESAM sample used in our experiment is schematically shown in Figure 1. The structure of the sample from top to bottom (light incident direction) consists of a GaAs cap layer, nine In0.27Ga0.73As QWs separated by GaAs barriers and a DBR composed of 23 GaAs/Al0.95Ga0.05As bilayers, which is grown on a GaAs substrate oriented along the (100) direction. The neighboring triple-QW stacks are separated by 112-nm thick GaAs layers. Each triple-QW stack consists of an In0.27Ga0.73As/GaAs/In0.27Ga0.73As/GaAs/In0.27Ga0.73As structure with 7-nm thickness for each QW and 6-nm thickness for each barrier. The MQW structure is separated from the sample surface by a GaAs cap layer with the thickness equal to approximately half of the separation distance between triple-QW stacks. Each bilayer in the DBR consists of 73.7-nm GaAs and 86.7-nm Al0.95Ga0.05As. The DBR and the last QW are spaced by a 9.6-nm GaAs layer and a 68.7-nm Al0.95Ga0.05As layer. Two GHz-repetition-rate Yb:KYW lasers with 5 kHz repetition rate difference emitting both at a central wavelength of ~1050 nm are employed to conduct femtosecond pump-probe spectroscopy on this sample in a reflection configuration. One Yb:KYW laser is used as pump laser and another is used as probe laser. Both pump and probe beams are incident on the air/cap layer surface. The reflected probe beam is received by a 125-MHz photodetector, which is connected to a 100-MHz A/D converter for data acquisition. Thus, the photo-induced reflectivity change (∆R/R) is monitored as a function of time delay between the pump pulse and probe pulse which is automatically introduced by their repetition rate difference. Unless a specific note is given, the incident pump power and probe power are always set to 100 mW and 4.5 mW, respectively. All experiments are performed at room temperature. A more detailed description of the experimental set-up can be found in Ref. [25]. Table 1 and Table 2 list relevant properties of the lasers and the sample, respectively. From both tables, it is clear that photon energies (1.184 eV, 1.183 eV) of pump and probe lasers are above the bandgap of In0.27Ga0.73As (1.052 eV (bulk), 1.177 eV (confinement effects considered)); meanwhile, the photon energies are significantly below the bandgap of GaAs (1.424 eV (bulk at room temperature)) and the bandgap of Al0.95Ga0.05As (2.148 eV (bulk)). Therefore, the optical absorption region refers only to MQWs (In0.27Ga0.73As) represented by violet areas in Figure 1, while the bottom DBR materials are transparent to both pump and probe light. Both these features will be of relevance for our following discussion regarding CLAPs photo-induced generation and detection.

3. Results and Discussions

The obtained experimental signal is shown in the inset of Figure 2a. After a background subtraction conducted via a smoothing average, rich acoustic features become visible in the main panel of Figure 2a, where several distinct wave-packet-like structures are present in the signal. Regarding the numerical signal processing, we note that the extraction procedure is first optimized for the higher frequency components, and thus, some lower frequency components are suppressed in Figure 2a. In order to address the lower frequency component contributions more quantitatively, the extraction procedure is adjusted in the later investigations in Section 3.2 It is important to mention that the applied extraction procedure is only used to increase the visibility of the small acoustic contributions to the overall signal (detected relative reflectivity change induced by superimposed acoustic signal ∆R/R~10−7 while the reflectivity change from the electronic background ∆R/R~10−4, i.e., 3 orders of magnitude larger), without introducing artifacts in the acoustic spectrum. The two different frequency domains will be discussed in the following paragraphs, starting with the high frequency contributions.

3.1. High Frequency Coherent Acoustic Phonon Combs

3.1.1. Generation and Detection Mechanisms

Since the pump light energy is absorbed in the QWs in our sample, stresses could potentially be photo-excited by three mechanisms including the inverse piezoelectric effect, the thermo-elastic effect and the deformation potential,
σ ( z , t ) = σ PE ( z , t ) + σ T E ( z , t ) + σ D P ( z , t ) .
However, the inverse piezoelectric effect only dominates when the semiconductor heterostructure is grown along a high index piezo-electrically-active direction where large built-in electric fields can be formed, especially in the [111] direction. The [100] direction is non-piezo-electric (our sample) [38]. Additionally, although the laser light can heat up the sample and induce a thermal expansion, unlike in metals, in semiconductors such a thermo-elastic effect is usually considerably weaker than the deformation potential effect, especially when the energy of the pump optical quantum is close to the semiconductor band gap [39]. Therefore, it makes sense to ignore the contributions from σPE and σTE. In other words, stresses related to light absorption are considered to take place in the nine QW layers in our sample mainly through deformation potential interaction,
σ D P ( z , t ) = d e h N ( z , t ) ,
where deh denotes the electron-hole phonon deformation potential parameter and N(z,t) denotes the photo-excited carrier concentration [4]. Equation (2) indicates that the generation of coherent acoustic phonons largely depends on the concentration of photo-excited electrons and holes in the bottom of the conduction band and in the top of the valence band when the photon energy is very close to the material bandgap, which holds true for our QWs with a bandgap only ~7 meV below the pump photon energy (1.184-eV photon energy and 1.177-eV bandgap of QW). In terms of detection, the presence of acoustic phonons is able to induce a displacement of the surface and interfaces of the medium (interferometric effect) and perturb the optical refractive index of the medium (photo-elastic effect), which are monitored by the reflected probe light via the optical reflectivity change. Because the probe light exhibits approximately the same wavelength as the pump light, the generated forward and backward propagating stress waves are also detected in the QWs layers through the photo-elastic effect. The interferometric effect can in principle contribute to the detection of the acoustic waves. The MQW-SESAM structure is designed to maximize the optical electric field at the position of the QWs, and thus, efficient light absorption, generation, and detection of elastic waves can be expected.

3.1.2. Overview of Experimental Results

Due to the periodic structure of the MQWs, a train of acoustic wave-packets over the whole time window is detected, as depicted in Figure 2a. The detected acoustic signal is proportional to the integral of fg(z,t) * fd(z), i.e., the convolution of two functions, along the acoustic propagation axis z, where fg(z,t) represents the generated stress in each triple-QW stack and fd(z) represents the detection sensitivity function in each triple-QW stack. The main feature of the detected acoustic signal can be explained quite well by the analysis conducted in [25], where we used the same sample for an initial test of the pump-probe system performance.
We will quickly reiterate some of the previous findings which are important to establish a deeper and more quantitative understanding of the rich acoustics in the sample. Firstly, as shown in Figure 2b the central frequency of the acoustic spectrum (the peak frequency of the main lobe of the wave-packet FFT depicted by the magenta curve) is 366.5 GHz, which is determined by the travelling time of the stress wave between neighboring QWs. Due to the resemblance of our results with optical frequency combs, we also apply the same terminology here, where the central frequency (or wavelength) refers to the frequency (or wavelength) of the carrier (wave-packet) and spectral lines are equally spaced by the inverse of the pulse repetition rate, i.e., the inverse of time delay between neighboring wave-packets. In theory, the central acoustic frequency induced by the periodic QWs can be calculated as f0 = (dQW/veff)−1 = 353.5 GHz, where veff denotes the effective longitudinal acoustic velocities in GaAs/In0.27Ga0.73As heterostructure which can be taken from Table 2, and dQW denotes the distance of adjacent QWs (13 nm) within the triple-QW stack. Secondly, the acoustic frequency comb shows a spacing of around 33 GHz determined by the travelling time of the stress wave between neighboring triple-QW stacks, which is also equal to the round trip time between the first triple-QW stack and the air/GaAs interface. The comb spacing induced by the spatial periodicity of the triple-QW stacks can be approximated by ∆f0 = (dss/vGaAs)−1 ≈ 32.6 GHz, where dss represents the spatial period of the triple-QW stacks (145 nm), and vGaAs represents the longitudinal sound velocity in GaAs, whose contribution to the SESAM structure width largely dominates over that of In0.27Ga0.73As. In a word, the experimental results fit well with the above estimations. In addition, the five peaks in the detected individual wave-packets can be explained by the convolution of the stress bursts, consisting of three pulses incident on the triple-QW structures, and the detection sensitivity function, containing three peaks in each of the triple-QW structures (see Figure 3).

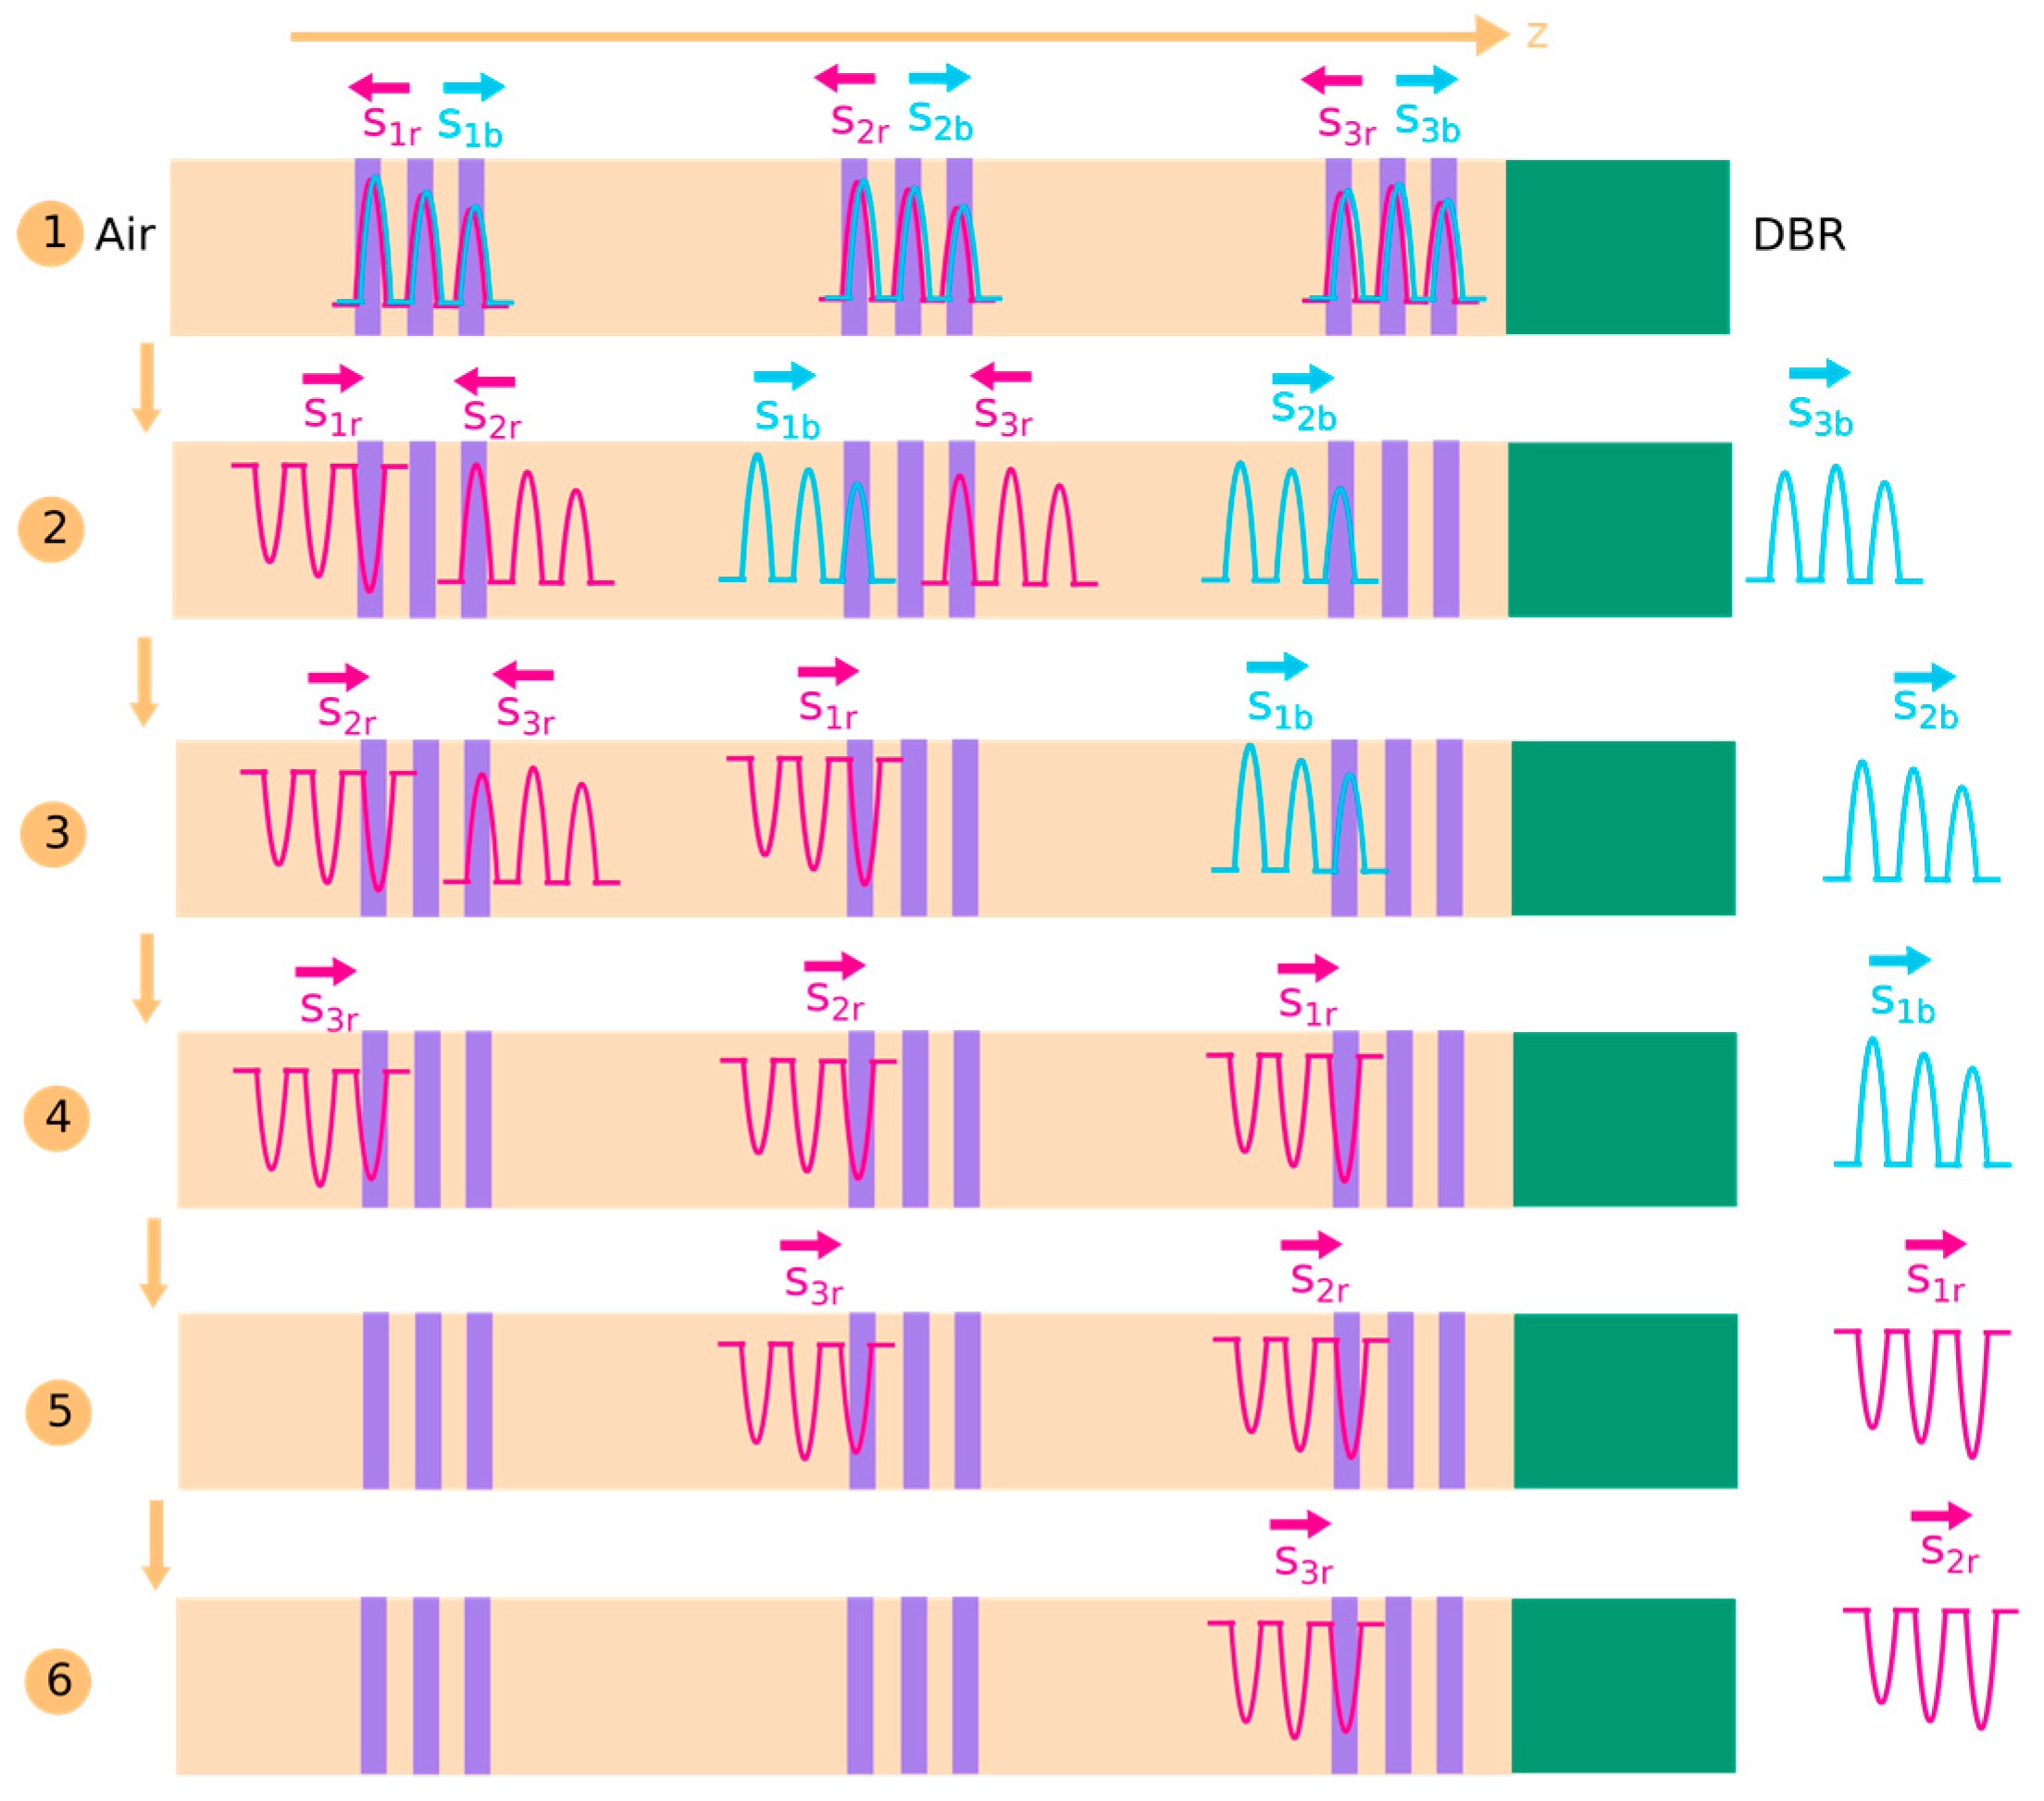
3.1.3. Generation, Propagation and Detection of Acoustic Waves in MQW Region

In III-V semiconductor multilayer structures, the acoustic reflection from the internal interface is usually insignificant, due to the small acoustic impedance mismatch between constituent materials. If the densities ρGaAs and ρInGaAs, as well as longitudinal acoustic velocities vGaAs and vInGaAs, are taken from Table 2, the reflection coefficient of the GaAs/In0.27Ga0.73As interface can be calculated as Γ =|(ρGaAsvGaAsρInGaAsvInGaAs)/(ρGaAsvGaAs + ρInGaAsvInGaAs)| = 1.8 × 10⁻². As illustrated in Figure 3, if the small acoustic impedance mismatch between GaAs and In0.27Ga0.73As is neglected, in total six discrete wave-packets should be detected after the sample is irradiated by the pump light. The first wave-packet, which is not presented in Figure 2a because of the difficulties in removing the background signal at times close to the pump/probe overlap, stems from the detection of the forward and backward propagating stress bursts (Sib and Sir, i = 1, 2, 3) generated in each of the triple-QW stacks when they are escaping from the corresponding local stacks (Figure 3, line 1). The second detected wave-packet stems from the detection of five stress bursts in the neighboring/local triple-QW stacks at the same time when the photo-generated stresses after the propagation between the triple-QW stacks start to move across the stacks. These five stress bursts include two pairs of bursts excited in the first and the second triple-QW stacks (Sib and Sir, i = 1, 2) and the backward propagating burst excited in the third triple-QW stack, i.e., S3r (Figure 3, line 2). The third wave-packet stems from the detection of four stress bursts (Figure 3, line 3), and so on. In consequence, a smaller and smaller number of stress bursts contribute to the detection as stress waves propagate along the z-axis, which can also partly explain the damping of the wave-packet train (see Figure 2a). Thereby, in the end, there is only the detection of S3r in the third triple-QW stack, which corresponds to the sixth wave-packet signal. After S3r leaves the last triple-QW stack, acoustic wave-packets excited in the QWs are not expected to be further detected in the MQW region, under the condition of their negligible reflections in the DBR region. However, our experimental results, presented in Figure 2a, clearly show more than five wave-packets (the 2nd~6th wave-packets) in the time domain (the first wave-packet at 0 ps is not shown there). In order to explain the existence of wave-packets beyond the expected number of occurrences given by the sample geometry, the small acoustic impedance mismatch between GaAs and In0.27Ga0.73As should be taken into account. In this way, the reflection of acoustic phonons from the interfaces between these materials can contribute to wave-packets bouncing between neighboring triple-QW stacks and between the first triple-QW stack and the air/GaAs interface. These multiple reflections produce “ringing” of the triple-QW stacks/air region, which lasts longer than the time necessary for the acoustic wave just to traverse it twice. A detailed theoretical model and comparison with experimental results will be presented in [40].

3.1.4. Broadband Acoustic Spectrum

In addition to the temporal evolution of the acoustic signal, its frequency spectrum is also worthy of scrutiny, given that our previous result [25] revealed only a part of the features visible in the spectrum detected in the current experiments. After 25 times magnification in the frequency range from 0 to 232 GHz and 15 times magnification in the frequency range from 497 GHz to 1000 GHz, the acoustic spectrum revealed a wide sub-THz comb-like structure with a regular comb spacing of around 33 GHz, which covered the range from ~30 GHz to ~800 GHz, as illustrated in Figure 2b. The comb spacing ~33 GHz (marked by gray vertical lines) corresponds to the reciprocal of time delay of neighboring wave-packets (30.25 ps), which agrees very well with the experimental result in the vicinity of 365 GHz, while there are small offsets in other spectral ranges. The visible non-constant comb spacing can be attributed to several factors. Firstly, one has to notice that the spectral amplitudes in the range 0–232 GHz and in the range 497–1000 GHz are at least one order of magnitude smaller than those around 365 GHz, which could possibly introduce a few GHz offset from the marked positions. Secondly, the low frequency modes could be nearly degenerate with the mini-Brillouin-zone modes which will be discussed in Section 3.2. Thirdly, there are uncertainties in the determination of the longitudinal acoustic velocity in the sample and in the quantum well stack-to-stack distance. This will lead to slight deviations from the expected constant comb spacing. The mode amplitudes of the frequency comb are modulated by the envelope derived from the first wave-packet FFT (magenta line in Figure 2b), which produces a main lobe with a bandwidth of ∆B = 109.6 GHz (full width at half maximum) and a few side lobes with at least an order of smaller amplitudes than that of the main lobe. Therefore, the five frequency components in the vicinity of 365 GHz dominate the acoustic temporal features, while the lower frequency components (below 100 GHz) and higher frequency components (around 700 GHz) have a much smaller impact on the overall acoustic oscillations. It is worth noting that some of the predicted comb components are missing, which can be explained by the amplitude modulation of their envelope. Because the observed wave-packet is a result of the convolution between the generated stress burst and the detection sensitivity function of the QW-stack, the FFT envelope of the frequency comb is associated with the generation and detection processes. If the generation and detection functions are assumed to be of the rectangular spatial shape with a 33-nm width equal to the QW-stack thickness, due to the spatial restriction, the corresponding FFT envelope is thus sampling-function-like with a main lobe bandwidth ∆B = 124 GHz, which means the amplitude modulation leads to the suppression of comb components close to the dips of the envelope such as those around 260 GHz and 460 GHz. In total, up to 24 periodic frequency components spaced by 33 GHz are resolved in our experiment. Table 3 lists the main high frequency components from experiment and calculation. In comparison with calculations based on mΔf (m is an integer), the experimental frequency components show a small shift, i.e., of around 6 GHz, for each component in the vicinity of 365 GHz, which can be attributed to the uncertainties of longitudinal sound velocities in the sample and stack-to-stack distances. In order to understand the generated coherent acoustic phonons from the perspective of a SL rather than individual QWs, a folded CLAP dispersion relation calculated by the Rytov model in the SL formed by the GaAs (6 nm)/In0.27Ga0.73As (7 nm) units is plotted in Figure 2b. The dispersion relation of folded acoustic modes in a SL consisting of alternative layer A and layer B takes the following form in the slightly modified Rytov model [37]
cos ( k d ) = cos [ ω ( d A v A + d B v B ) ] ε 2 2 sin ( ω d A v A ) sin ( ω d B v B ) ,
where ε is expressed as
ε = ρ B v B ρ A v A ( ρ B v B ρ A v A ) 1 / 2 .
In Equations (3) and (4), k, d, ω, dA, vA, dB, vB, ρA and ρB denote the wavevector, the SL period, the angular frequency, the thickness of layer A, the longitudinal sound velocity in layer A, thickness of layer B, longitudinal sound velocity in layer B, density of layer A and density of layer B, respectively. In pump-probe experiments in reflection geometry, typical triplet-like mode structures usually arise due to the k = 0 modes at the Brillouin zone center and the detection of two additional modes of the nearby dispersion branches [37], as marked by solid dots in Figure 2b. The calculation yields the expected triplet mode frequencies at 323.7, 354.7, and 386.2 GHz. The 354.7 GHz mode belongs to Raman active MBZ-center mode. 323.7 GHz and 386.2 GHz modes belong to lower branch p = −1 and upper branch p = +1 at k = 2 q probe GaAs / InGaAs = 0.176π/dQW, respectively, where p represents the acoustic phonon order, and k represents the wavevector. The calculated triplet (323.7, 354.7, 386.2) is nearly coincident with three frequency comb center components (332.1, 364.6, 397.1) if the deviation between experimental and calculated comb spacings is considered. In addition, the unfolded mode of 31.2 GHz at k = 0.176π/dQW is nearly coincident with the first comb component at around 33 GHz. However, due to the overlapping frequency region with the acoustic frequency comb generated in the QWs, it is difficult to say how much those folded/unfolded CLAP modes contribute to the detected frequency components. In addition, the frequency amplitudes also exhibit uncertainty arising from difficulties of acquiring the exact profile of the detection spectral sensitivity function. Further investigations are required in order to distinguish coherent acoustic phonons generated in the GaAs/In0.27Ga0.73As SL from those generated in the QWs. For example, the same pump-probe experiment can be applied to a new sample where the triple-QW stacks distance dss is carefully adjusted to result in an acoustic frequency comb with a spacing distinctly differing from 33 GHz, while the rest of the structure remains equal.
In summary, a comb-like acoustic spectrum is generated and detected in the QWs in the MQW-SESAM sample where optical absorption takes place. Consisting of up to 24 detectable frequency components spaced by ~33 GHz, it covers the frequency domain from ~30 GHz to ~800 GHz, but is most pronounced in the vicinity of 365 GHz. The detectability of a large number of frequency components can be attributed to the fact that the spectral sensitivity functions are nearly identical to the spectral generation functions in our structure by applying the two almost degenerate ~1050-nm lasers for pump and probe. The observed spectral features can be readily understood in terms of single QWs or a SL description. In this case, we prefer the former, because the spatial excitation and detection functions are directly available and immediately result in the observed comb spectra. Still, we think the discussion of the latter is instructive in this scenario.

3.2. Low Frequency Mini-Brillouin-Zone Mode

3.2.1. Overview of Experimental Results

If the extraction of the acoustic phonon contributions from the original signal trace is numerically optimized for the lower frequencies in the signal via a larger smoothing scale for electronic and thermal background subtraction, a damped long-period oscillation (around 15 ps) over a long time delay is revealed, as shown in Figure 4a. The corresponding acoustic spectrum in Figure 4b exhibits multiple low frequency modes, which are the origin of the weak beatings in the time domain signal. Since the DBR in the sample has a long period dDBR = 160.4 nm which could, in theory, pave the way for the generation of the folded CLAP starting from 32 GHz, we propose that those low frequency modes referring to harmonics and subharmonics of 32 GHz are photo-excited in the DBR for some reason. Thus, the acoustic dispersion relation in the DBR is plotted in Figure 4b, represented by the blue line, and the calculated potential modes are listed in Table 4. As a result, the experimental modes at 32.0 GHz, 63.1 GHz, and 95.1 GHz (marked by blue dots) agree well with the MBZ-center modes 32.17/32.18 GHz, 64.33/64.35 GHz and 96.50/96.53 GHz at k = 0. Due to the small forbidden gap (0.01 GHz, 0.02 GHz and 0.03 GHz for the 1st, 2nd and 3rd dispersion branches, respectively) at k = 0, it is hard to resolve if the center modes belong to lower or upper branches. In addition, the long period of the DBR requires Umklapp processes for the wavevector k = 2 q probe DBR , and thus, after the Umklapp processes the wavevector k = |2 q probe DBR − 2π/dDBR| = 0.028π/dDBR is very close to k = 0 as the blue horizontal line indicates. Thus, this is a possible explanation why seemingly only the center modes are present in the spectrum in the reflection geometry. Meanwhile, the experimental modes 15.1 GHz, 78.3 GHz, and 110.1 GHz (marked by green dots) show a remarkable agreement with the MBZ-edge modes 15.28 GHz, 79.62 GHz and 110.8 GHz at k = π/dDBR. Normally, the generation of folded CLAPs is not expected in a DBR undergoing a below bandgap light irradiation due to the absence of light absorption. MBZ-edge modes are not detectable due to non-fulfillment of the wavevector conservation rule. Hence, in the following section, we will elaborate on the interpretation of our experimental findings and propose potential mechanisms that facilitate MBZ-center and -edge mode excitation and detection in the DBR of the MQW-SESAM structure.

3.2.2. MBZ-Center Mode Excitation

One potential mechanism for the photo-excitation of MBZ-center modes is electrostriction. This mechanism can manifest itself in transparent media when, for example, two oblique pump laser beams are incident on the transparent medium to create an optical interference pattern inside the medium for excitation of counter-propagating acoustic waves [13]. When the acoustic phonons are excited through electrostriction, the energy is directly coupled from electro-magnetic fields of the laser to the acoustic field. The excited phonon momentum then matches the interference electric field via the momentum conservation law k g = ± ( k 1 k 2 ) , where the subscript g denotes generated acoustic phonon and subscripts 1 and 2 denote the two incident photons. In the case of two laser beams with the same frequency, the generated phonon wavelength Λ is matched to the light field wavenumber by k g = 2 q pump sin ( θ / 2 ) , where k g denotes the excitation (pump) light wavenumber in the medium and θ denotes the angle between the two pump beams. Therefore, the generated phonon wavevector is tunable by adjusting θ in such a configuration. When two incident pump beams propagate in opposite directions, the acoustic phonon exhibits a wavelength of λ pump / 2 , corresponding to kg = 2qpump.
In our experiment, the incident pump beam is reflected by the DBR, whose reflectance is up to 99.7% for the pump wavelength of ~1050 nm. Multiple scattering of the incident light in the DBR creates two evanescent counter-propagating light fields with comparable amplitudes, opening the way for the generation of high frequency CLAPs in the DBR via the electrostriction mechanism. As shown in Figure 4c, the pump light field intensity distribution in the DBR contains oscillating and evanescent average components covering nearly the whole DBR thickness. The sinusoidal component of the light field generates the phonons with k = k g = 2 q pump DBR , where q pump DBR denotes the wavevector of the pump light in the DBR, which is modelled as an infinite SL. However, the magnitude of the evaluated kg appears to be outside the first Brillouin zone of the DBR, which can also be treated as a phononic crystal. This means that the generation of the phononic crystal eigenmode by the sinusoidally modulated part of the interference pattern created by our pump light should include Umklapp processes and the wavenumber of the generated phonon is k = k g = | 2 q pump DBR     2 π / d DBR | = 0.026 π d DBR < < π d DBR , where dDBR denotes the DBR period. As a result, because in our DBR the wavenumber of the pump light is very close to the MBZ boundary, in other words, half of the pump light wavelength is close to the DBR period, the photo-generated phonon is very close to MBZ center. However, this is not the only channel for the generation of the GHz CLAPs in the DBR. In the DBR, not only the periodically oscillating part, but also the averaged part of the intensity distribution of the pump light interference pattern can generate high frequency CLAPs due to the spatial periodic modulation of the electrostriction parameter in the DBR. This mechanism is absent in spatially-homogeneous, non-structured media. In principle, in this second channel, all k = 0 modes of the phononic DBR are photo-generated. From the above analysis, it follows that, because in our DBR λ pump DBR / 2   and dDBR are very close, the constructive generation of the lowest energy   k 0 mode in the MBZ of the DBR via two described channels could be possible, in spite of transparency of the DBR for the pump light. The local electrostriction force f can be presented as [43]
f es = 1 2 ( ρ d ϵ d ρ E 2 ) ,
where ρ denotes the total mass per unit volume, ϵ denotes the permittivity and E denotes the electric field. The right side of Equation (5) can be expanded into two terms:
f es = 1 2 ρ d ϵ d ρ E 2 + 1 2 E 2 ( ρ d ϵ d ρ ) .
The first term describes the force f es 1 stemming from the spatial modulation of the electric intensity   E 2 ; the second term describes the force f es 2 caused by the spatial modulation of the electrostriction coefficient   ρ d ϵ d ρ . The combined effects described by Equation (6) cause the resonant excitation of MBZ mode at k 0 (fundamental ~32 GHz mode and its higher-order harmonics) in the DBR, given the condition λ pump DBR / 2 dDBR in our sample. Thus, the peaks at 32.0 GHz, 63.1 GHz and 95.1 GHz in Figure 4b can be attributed to MBZ-zone center modes, which are resonantly coherently excited by the light field in the DBR via simultaneous spatial modulation of the electric field intensity and of the electrostriction coefficient.
One may notice that amplitudes of the MBZ center modes do not show a monotonic decrease with increasing order. On the contrary, the second order mode 63.1 GHz significantly dominates in the spectrum. The amplitude ratios among the three modes are approximately 0.2:1:0.05. In order to explain this unusual behavior, we need to take two factors into account.
Firstly, as demonstrated in Section 3.1, the acoustic frequency comb excited in the In0.27Ga0.73As QWs has multiple components equidistantly spaced by ∆f ≈ 33 GHz over a wide frequency range, which means the first three components are at the locations ∆f, 2∆f and 3∆f, respectively. Therefore, the first three comb components are approximately coincident with the MBZ center modes of the first three orders in the DBR. In consequence, the experimental frequency at around 63.1 GHz could acquire more contribution from the photo-excited acoustic frequency comb in the QWs than the experimental frequencies at around 32.0 GHz and 95.1 GHz do. This is due to the fact that in the lowest frequency region, the side lobe of the envelope determined by the individual wave-packet FFT shows a peak close to the comb component 2∆f, while it exhibits dips close to the comb components ∆f and 3∆f (see Figure 2b). The combined frequency at around 63.1 GHz is thus enhanced greatly compared to the pure second order MBZ-center mode in the DBR, which could partwise explain why the second order MBZ-center mode dominates rather than the first order MBZ-center mode (we cannot filter out the pure contribution of MBZ center modes from the spectrum).
Secondly, the amplitudes of the spectral components of the signal depend not only on the generation but also on the detection processes. While all the above considered three frequencies could potentially be detected both in the MQWs spatial region and in the DBR spatial region, the lowest of these frequencies could be additionally efficiently generated and detected in the parts of the samples which are not spatially structured. In other words, the generation and detection of the phonons around 32–33 GHz frequency could take place in spatially-homogeneous materials constituting our samples, for example in spacers between the MQWs. The counter-propagating light fields of pump laser in the MQW-SESAM structure could efficiently excite phonons at these frequencies by stimulated Brillouin scattering (via the electrostriction mechanism due to intensity modulation in their interference pattern, Figure 4c). Probe light could be efficiently scattered by the propagating acoustic waves at these frequencies in our sample via the acousto-optic effect because the probe light and acoustic wave vectors are matched via momentum conservation law in the backward Brillouin scattering process. We found that in all materials of our sample, the so-called Brillouin frequencies of phonons, satisfying the momentum conservation law which is essentially the same for the efficient generation and the efficient detection, are very close to the MBZ center mode 32 GHz at k 0 (31.4 GHz in GaAs, 30.8 GHz in In0.27Ga0.73As and 31.8 GHz in Al0.95Ga0.05As). The listed Brillouin frequencies here and in Table 4 have been calculated using f i = 2 n i v i / λ probe [44], where n i denotes the refractive index, v i denotes the longitudinal sound velocity in sample constituent materials and λ probe denotes the probe light wavelength in vacuum. Thus, the Brillouin frequencies could probably suppress the MBZ center mode at 32 GHz due to destructive interference between them when the phase difference is close to π, which could potentially explain why the first-order mode has a weaker amplitude than the second order one.

3.2.3. MBZ-Edge Mode Excitation and Detection

We will now move on to the discussion of the unexpected occurrence of MBZ-edge modes at 15.1 GHz, 78.3 GHz and 110.1 GHz (see Figure 4b marked by green solid dots). Concerning our experimental observation of MBZ-edge modes, firstly, we discuss a scenario that momentum conservation for edge mode could be fulfilled due to the absorption of the excess momentum by free carriers in the doped SL sample, when |π/dDBR − 2qprobe|     π/LQW (LQW denotes the thickness of QW layer in SL) [18]. In our structure, the DBR period dDBR = 160.4 nm is more than one order of magnitude larger than the GaAs/AlAs SL period in Ref. [18], which causes the wavenumbers of the probe photon and edge phonon being nearly equal qprobe   π/dDBR. If the refractive index of the DBR nDBR ≈ 3.22 (from Table 2) is used for qprobe, then it appears that qprobe < π/dDBR and |π/dDBR − 2qprobe| π/dDBR. Even if the refractive index of GaAs nGaAs ≈ 3.48 (from Table 2) is used for estimating qprobe, then it appears that qprobe > π/dDBR, requiring Umklapp processes in light scattering. So, the photons with wavenumber q’probe = qprobe − 2π/dDBR could be scattered by the MBZ-edge phonons with wavenumber k’ = −π/dDBR, leading to the same momentum excess |k’ − 2q’probe| π/dDBR. Therefore, the momentum conservation law in our experiments could be potentially restituted. However, our DBR is non-doped, and already possesses considerable thicknesses for the constituent layers, which makes it unlikely to induce electron confinement effects and significant interactions between the electrons in the neighboring GaAs layers required for absorbing excess momentum. Consequently, the zone-edge phonons in our experiments should not be detected in the frame of the hypothesis proposed in [18]. Secondly, we discuss the scenario that the observation of the zone-edge modes could be attributed to disorder-induced partial breakdown of momentum conservation in the semiconductor SL [19]. The roughness-induced layer thickness fluctuations cause a distribution of electronic confinement energies; thus, Raman scattering could be enabled in individual wells by confined electrons. In this situation, the wavevector conservation along the growth direction is no longer required. However, the precision in the fabrication of SLs has been considerably improved during the last 25 years and our DBR constituent layers (73.7 nm and 86.7 nm) are too thick to consider the influence of the atomic-scale thickness fluctuations. Lastly, the detectability of zone-edge mode could be possible in the case of Brillouin zone (BZ) folding of the BZ edge to the Γ-point in crystals according to Refs. [21,22,23,24]. For example, in Ref. [24] multi-order phase-matching-free signals due to BZ edge phonons with comparable intensities are observed in a TiO2 crystal by CARS spectroscopy. By the introduction of the dynamic BZ folding, originally Raman-inactive phonons at the opposing X-points become observable, and can be well understood. We consider this scenario to be the most plausible explanation for MBZ-edge modes observation in our experiments.
In the framework of the hypothesis proposed by Hanamura et al. [24], firstly, the lowest energy k   0 Raman active modes are resonantly and coherently excited by two pump laser fields at different frequencies, when the frequency difference ω1ω2 is tuned to the phonon mode frequency at ω(0). Compared to the above proposed hypothesis, the fundamental difference in our system lies in that the resonant Raman active scattering takes place in k -space rather than ω-space. In our pump-probe spectroscopy set-up, differing from two crossed incident pump light pulses with different frequencies ω1 and ω2 applied in CARS approaches, our incident pump light is perpendicular to the sample surface, and it is nearly 100% reflected back by the DBR. Thus, these are counter-propagating light fields that can excite zone-center phonon modes ω(0). In other words, the Raman-active ω(0) phonon excitation is realized not by tuning pump pulses frequency difference to ω = ω1ω2 = ω(0), but by spatial modulation of the light field intensity and electrostriction coefficient in the DBR with approximately equal periods of the SL and the light field intensity distribution, dDBR λ pump DBR / 2 , as previously demonstrated. In our experiments, the folded zone-center mode ω(0) ≈ 32 GHz and two higher-order zone-center modes, 63.1 GHz and 95.1 GHz, are excited and observed due to the finite spectral width of the ultrafast lasers pulse providing the required frequencies from the processes of difference frequency generation within the spectral width of our pump light (see Figure 4b), which paves the way for further MBZ-edge phonons excitation. Secondly, a pair of phonons with frequencies ω(0)/2   ±   ω (∆ω   ω ( 0 ) / 2 ) are excited due to subharmonics decay of ω(0) (ω(0)   (ω(0)/2 + ∆ω) + (ω(0)/2 − ∆ω), k = 0 ( + k max) + (−   k max). In the DBR, the wavevector at MBZ edge is given by k = kmax = π/dDBR. Furthermore, owing to the high amplitude of the resonantly excited coherent k = 0 mode, the process of decay can become stimulated, leading to the excitation of coherent zone-edge modes with k   ± k max , ω   ω ( 0 ) / 2 ω ( k max ) . We illustrate this process in Figure 5. As can be seen, a pair of phonons (ω(0)/2, +kmax) and (ω(0)/2, −kmax) at the opposite MBZ edges are coherently excited by the MBZ-center mode ω(0) via decay processes. The analysis of the temporal dynamics of spectral modes will later confirm the plausibility of the subharmonic decay process ω(0) ω ( 0 ) / 2 + ω ( 0 ) / 2 . Thirdly, because the edge mode excited via stimulated subharmonic decay process is coherent, it introduces a new periodic phonon grating whose period is twice as large as the lattice period. The doubling of the phonon grating period is attributed to the above described excitation of phonon pairs at opposite MBZ edges, which causes lattice vibrations with π phase shift for the adjacent GaAs/Al0.95Ga0.05 units along z-axis. As a consequence, a new zone folding is required by the dynamically doubled grating. Thus, with respect to the middle of the mini Brillouin zone, ± kmax/2, the original zone-edge phonons are folded to near-center at k 0 , ω ω ( 0 ) / 2 where, being Raman-active, they are observable by the probe light. Fourthly, the probe light scattering by dynamic folded phonons with k 0 , ω ω ( 0 ) / 2 is a Raman-Nath-like process which enables the detection of multiple higher-order harmonics of zone-edge modes with comparable amplitudes [23,24].
As a result of the above hypothesis, the MBZ-edge mode around 15 GHz at k = π/dDBR, and its higher-order replicas in the signal up to those at 78.3 GHz and 110.1 GHz with the same-order amplitudes could be possibly detectable due to the subharmonic decay of the ω(0) ≈ 32 GHz mode, subsequent dynamic zone folding, and a Raman-Nath-like probe light scattering process in our experiments (see Figure 4b). So far, we have only discussed the core principle of detectability of MBZ-edge modes; however, the actual processes are much more complicated.
As illustrated in Figure 6, basically, three steps are involved to create a quite complex MBZ acoustic spectrum in the DBR. At first, a series of MBZ-center modes ωi(0) (i = 1, 2, 3, …, approximately at 32, 64, 96 GHz, …) are excited due to the electrostriction mechanism, and those modes can become detectable by stimulated Brillouin scattering or Raman scattering (see line 1 in Figure 6). Subsequently, the stimulated subharmonic decay of MBZ-center modes ωi(0) (i = 1, 2, 3, …) excites the edge modes ωi(0)/2 (i = 1, 2, 3, …, approximately at 16, 32, 48, 64, 80, 96, 112 GHz, …), and then the edge modes become detectable at the zone center due to dynamical zone folding (see lines 2 and 3 in Figure 6). At last, the detection of dynamically-folded ωi(0)/2 (i = 1, 2, 3, …) mode at the zone center is a Raman-Nath-like probe light scattering process, which means several series of Raman-Nath-like phonon signals mωi(0)/2 (m and i = 1, 2, 3, …) can be present at the same time, for example, mω1(0)/2 = 16m (16, 32, 48, 64, 80, 96, 112 GHz, …, see line 4 in Figure 6), mω2(0)/2 = 32m (32, 64, 96, …, see line 5 in Figure 5), mω2(0)/2 = 48m (48, 96, 144 GHz, … see line 6 in Figure 6), and so on. As can be seen, in particular, the subharmonic decay of the first-order MBZ center mode ω1(0) = 32 GHz provides an explanation to the otherwise unexplainable ~15 GHz frequency. In terms of other frequency components at ωi(0) (i = 1, 2, 3, …) and ωi(0)/2 (i = 2, 3, 4, …) detected in our experiment, several sources can contribute compared to that of ~15 GHz mode. Based on the demonstration in Figure 6, the frequency components at 32, 64 and 96 GHz consist of the MBZ-center modes ωi(0) (i = 1 for 32 GHz, i = 2 for 64 GHz, i = 3 for 96 GHz) generated by electrostriction and the modes generated via the subharmonic decay process at ωi(0)/2 (i = 2 for 32 GHz, i = 4 for 64 GHz, and i = 6 for 96 GHz), Subsequently, those modes become detectable through dynamic zone folding and Raman-Nath processes. Those frequencies at 32, 64 and 96 GHz can also be high-order replicas at mωi(0)/2 provided by probe light Raman-Nath-like scattering process ((m,i) = (2,1) for 32 GHz, (m,i) = (4,1), (2,2) for 64 GHz, and (m,i) = (6,1), (3,2), (2,3) for 96 GHz). Due to the involvement of MBZ-center modes ωi(0), the frequencies at approximately 32, 64 and 96 GHz can be observed without the hypothesis of a subharmonic decay, dynamic zone folding and Raman-Nath-like detection. In contrast, the frequencies at approximately 80, 112 GHz can only be observable by assumption of the above-discussed hypothesis. As can be seen from Figure 6, the frequency components 80 GHz and 160 GHz consist of the modes generated via the subharmonic decay process at ωi(0)/2 (i = 5 for 80 GHz and i = 7 for 160 GHz), and detected via dynamic zone folding and Raman-Nath processes. Those frequencies at 32, 64 and 96 GHz can be present as high-order replicas at mωi(0)/2 ((m,i) = (5,1) for 80 GHz and (m,i) = (7,1) for 160 GHz) in the Raman-Nath-like probe light scattering process. The previous discussion shows that the observed frequency spectrum is most probably formed by a non-trivial interplay between different excitation and detection mechanisms in the DBR.
In order to strengthen our main assumptions, starting from the next paragraph, some arguments will be presented to provide strong indications that the 15 GHz mode is excited via a stimulated subharmonic decay. Additionally, although we only discussed MBZ-center and -edge modes in the DBR, the process could also potentially take place beyond the DBR in our sample due to structure-related feature. In order to obtain a full view of the low frequency MBZ modes, Table 4 lists all the low frequencies that could be potentially detected in this sample including MBZ modes in the DBR and MBZ modes in the SL formed by triple-QW stacks and the 112-nm spacers, and Brillouin frequencies in all materials. The presence of a significant number of loosely-separated frequencies enhances the complexity of our interpretation, and will be discussed in Appendix A.

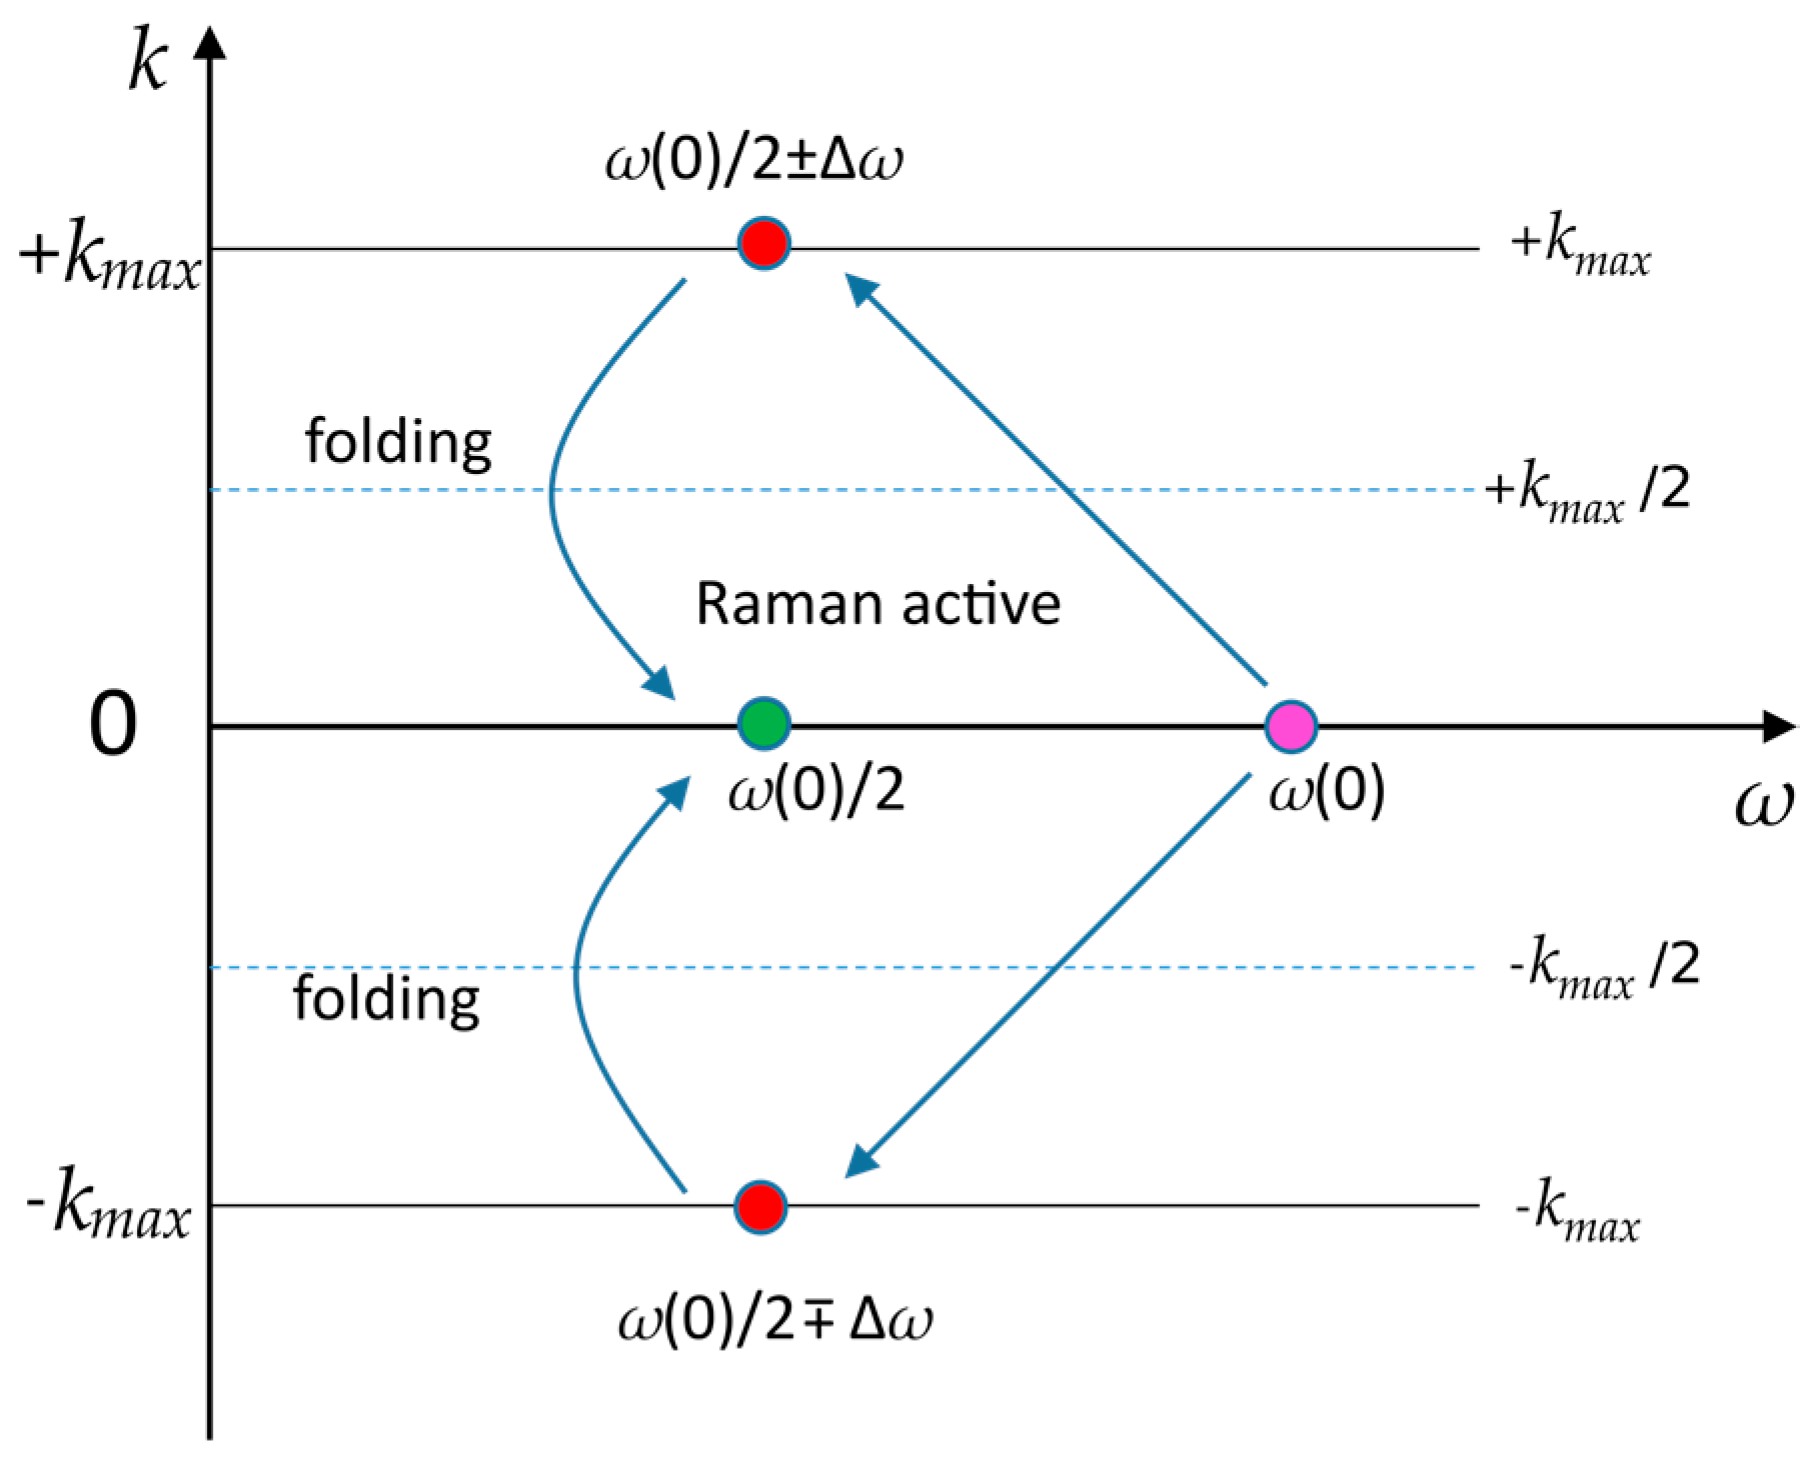
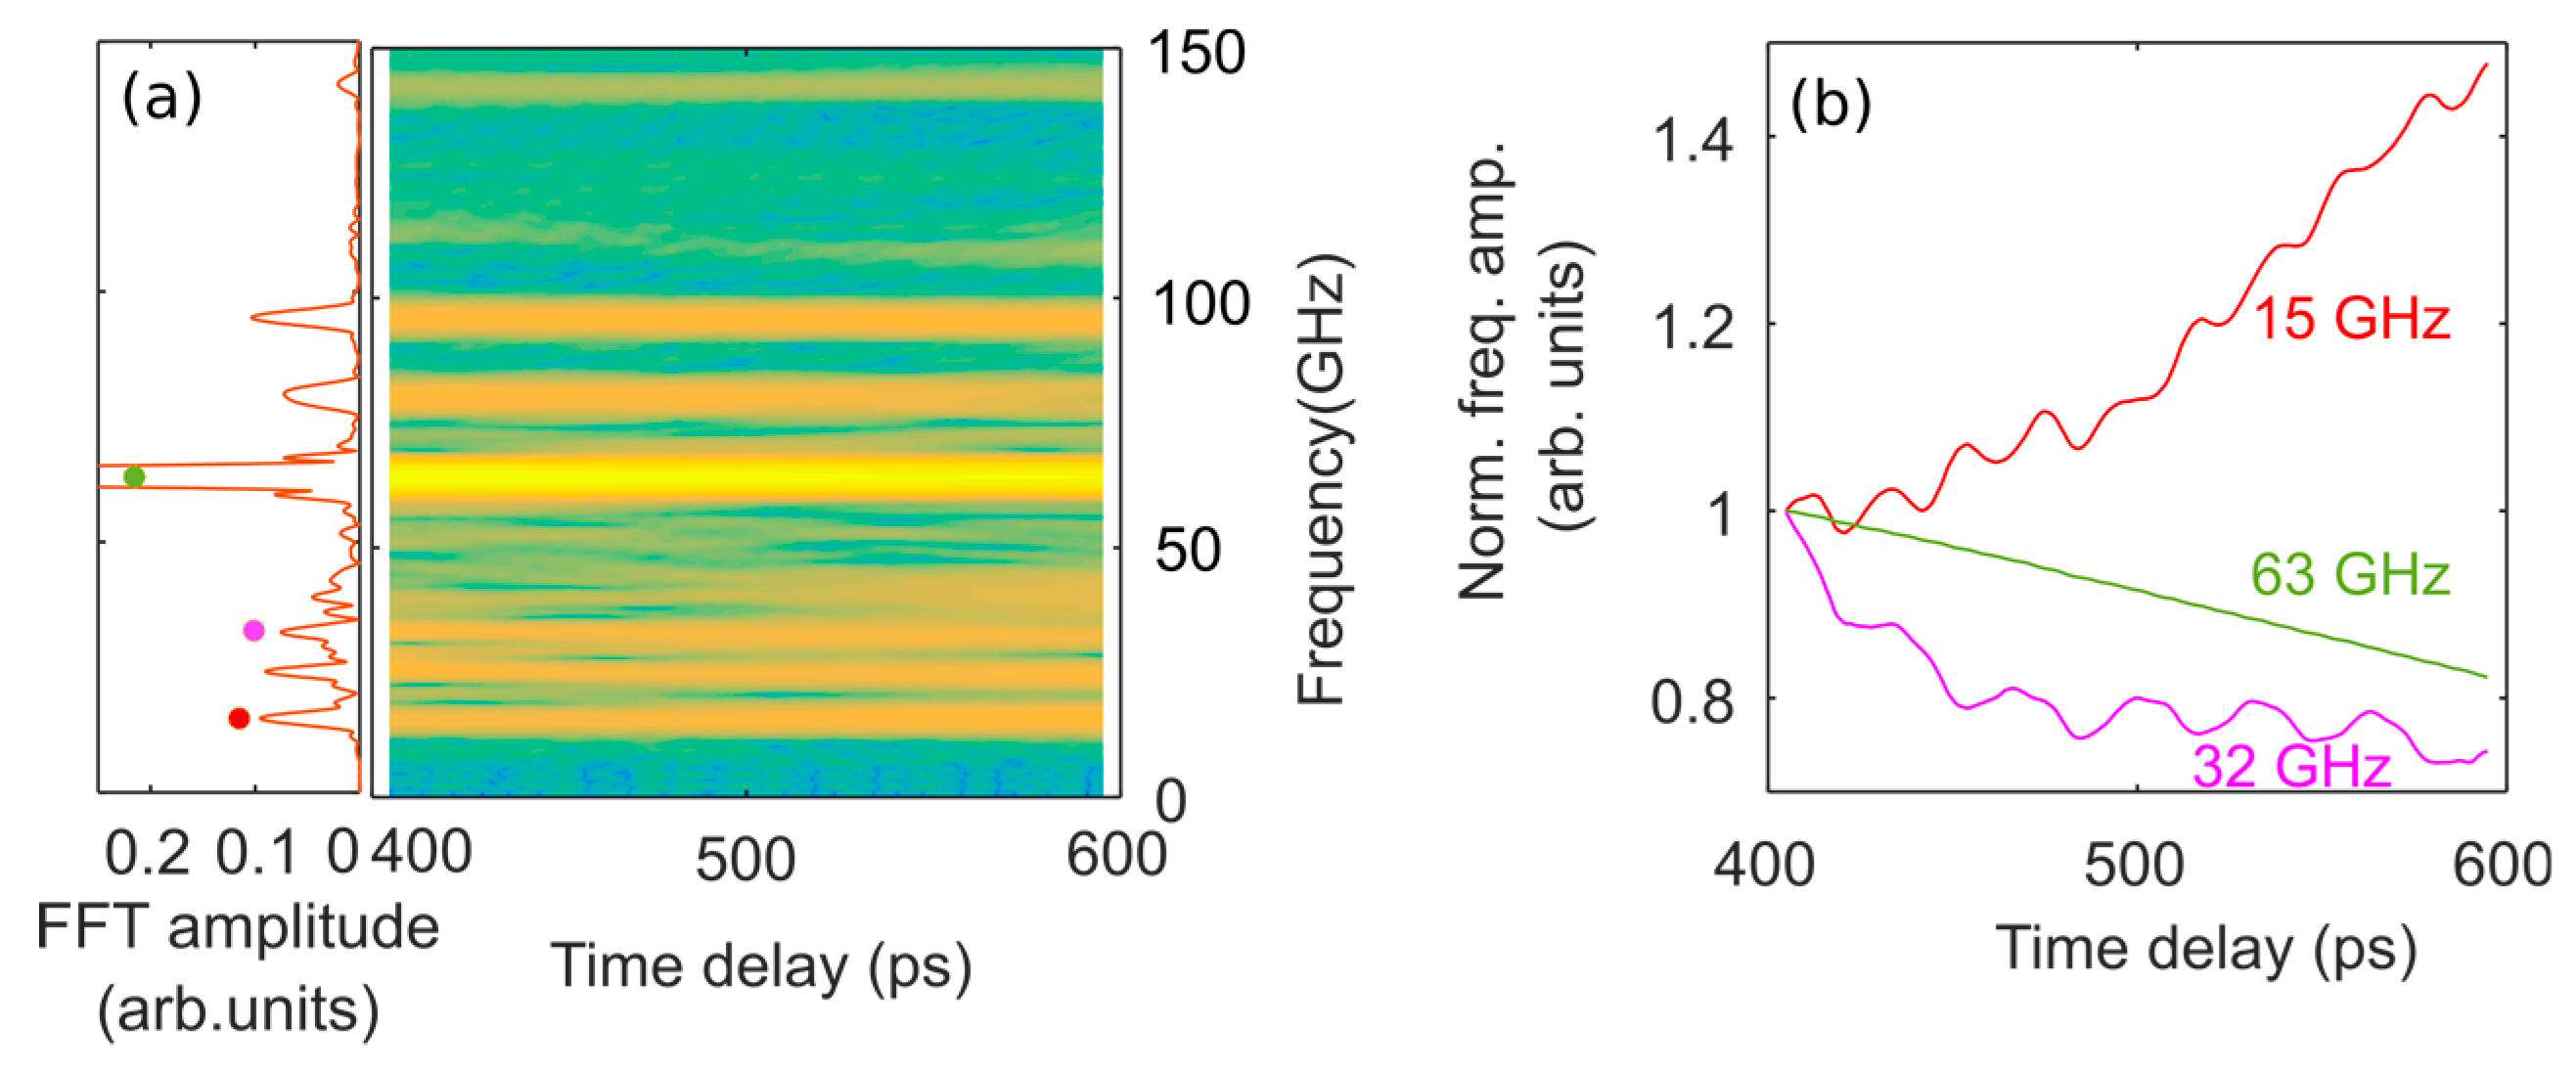
3.2.4. Indications of Stimulated Subharmonic Decay of MBZ-Center Mode

Our first approach of providing an indication of the stimulated subharmonic decay of the mode ω(0) ≈ 32 GHz into the mode ω(0)/2 ≈ 15 GHz consists in the evaluation of the dependencies of the observed mode amplitudes on pump laser power. The pump power is varied from 43 mW to 67 mW in steps of 4 mW. In the considered interval of pump powers, the amplitudes of the evaluated individual spectral lines are well above the noise level. A small time interval ranging from 500 ps to 800 ps is chosen to capture the decaying center mode at 32 GHz. The acoustic signals and their spectra are presented in Figure 7a,b. The dependencies of the 15 GHz, 32 GHz, 63 GHz, 80 GHz and 95 GHz modes amplitudes on the pump power are presented in Figure 7c. Those modes are normalized by their amplitudes at 43 mW power. This plot demonstrates the following tendency: the decrease of the 32-GHz mode amplitude is accompanied by an increase of the amplitudes of several other frequency components, which could be related to the detection of the zone-edge mode around 15 GHz frequency through a Raman-Nath-like probe light scattering process which accounts for the presence of frequencies at mω(0)/2 (m = 1, 2, 3, …). The experimental dependences in Figure 7c are importantly nonlinear and multiple nonlinear processes could contribute to the details of these dependencies, including the pump absorption saturation in the QWs. However, it is clear that the decay in the amplitude of the 32 GHz mode is overall consistent with the hypothesis that its energy loss via a nonlinear process of the stimulated subharmonic decay could provide a contribution to the total dynamics of the ~15 GHz mode. In Figure 7d, the amplitude ratio between the 32 GHz and 15 GHz modes decreases from 1.5 to 0.5, which is clearly a sign that the mode ~32 GHz could play a role in the excitation of the otherwise unexplainable mode at ~15 GHz.
Our second approach to find additional support for the hypothesis of the stimulated subharmonic decay process is to monitor the time dependence of the ~15 GHz mode and compare it to the other modes of interest, in particular, the mode at ~32 GHz. We analyze the low-frequency part of the oscillations starting from the delay time of 400 ps, where the signal coming from the detection of high-amplitude high-frequency combs in MQWs stops dominating (see Figure 2a). The idea is to extract amplitudes of the individual spectral lines as a function of the time delay from a short-time FFT result, shown in the right-hand-side of Figure 8a. The outcome, i.e., a rising amplitude of the 15 GHz oscillation and simultaneously decaying amplitude of 32 GHz oscillation over time delay, as plotted in Figure 8b, supports the argument that the excitation of the 15 GHz edge mode could stem from the stimulated decay of the ~32 GHz center mode. The analysis of the decay of the ~32 GHz mode amplitude presented in Figure 8b demonstrates that the attenuation of the mode in the interval from 400 ps to about 450 ps is amplitude-dependent and diminishing with time. Only in the time-delay interval after around 450 ps can the curve be fitted by an exponent with a constant decay time. This is an additional indication of the nonlinearity of the processes leading to the decay of ~32 GHz mode and the plausibility of the stimulated subharmonic emission of the ~15 GHz edge mode.
All the above-presented demonstrations (Figure 7 and Figure 8) and arguments indicate that the source of the MBZ-edge mode excitation is a near k = 0 eigenmode of the DBR, which, in turn, provides evidence for monitoring folded CLAPs and edge modes in a long-period non-doped transparent semiconductor SL.
In summary, up to three of the MBZ-center at k 0 and -edge modes at k = π/dDBR starting from 15 GHz to 110.1 GHz are excited and observed in the optically transparent DBR region of the MQW-SESAM sample. A possible explanation for this unusual behavior is presented which assumes the generation mechanism of the zone-center modes is electrostriction in the DBR. Stimulated subharmonic decay of these zone-center modes then leads to the excitation of the zone edge modes in the DBR, which can be detected because of dynamic zone folding and Raman-Nath-type light scattering following the hypothesis. The nonlinearities revealed in the experimentally-observed acoustic dynamics of the MQW-SESAM structure provide strong a indication of the dominant role of the stimulated subharmonic decay processes in the detection of the zone-edge mode frequencies.
We have to bear in mind that the structure we investigated is complex, which potentially leads to the overlap of multiple coherent acoustic phonon sources in the frequency domain and a possible subsequent interplay between them such as enhancement or cancellation. For the time being, it is hard to identify the contributions from different mechanisms of the CLAPs excitation and detection in the individual spectral components of the signal. We discuss some of these peculiarities in Appendix A, where one can not only gain a deeper understanding of potential acoustic mechanisms, but can also find an explanation for important missing modes and additional modes in Figure 4b, as well as the reason why only the edge mode of ~15 GHz excited via stimulated harmonic decay is revealed through the nonlinearities in the experiment.

4. Conclusions

In summary, we have investigated a MQW-SESAM structure by femtosecond time-resolved spectroscopy at a wavelength of ~1050 nm, and found a wide variety of coherent acoustic features. In particular, we observed two distinct frequency regimes: one with its main frequency components appearing around 365 GHz, and the other with frequencies ranging from ~15 GHz to ~100 GHz.
The high frequency components can be attributed to the coherent acoustic phonons generated and detected in the In0.27Ga0.73As QWs of the sample, which also give rise to an acoustic frequency comb with a spacing of ~33 GHz. The lower frequency components show the signature of SL eigenmodes and a comparison with the calculated acoustic dispersion of the DBR superlattice yields good agreement. This is surprising, because the DBR materials are transparent at the used pump wavelength, and thus, no acoustic response is expected. In addition, several unexpected modes are present in the acoustic spectrum, in particular, MBZ edge-modes which are usually not observable due to optical detection selection rules.
We propose an explanation based on the excitation of CLAPs in the DBR by spatial electrostriction coefficient modulation and the spatially modulated pump electric field. A subsequent stimulated subharmonic decay of the MBZ-center modes is then able to excite the MBZ-edge modes including the 15 GHz mode. The dynamical folding of the zone-edge mode onto the zone center, together with Raman-Nath-type probe light scattering, can account for the appearance of the MBZ-edge modes in the measured acoustic spectra. The observation of simultaneous CLAPs in MQW region and the weak MBZ modes in the DBR is enabled by the high-detection-sensitivity in our system (∆R/R~10−7).
Our results not only provide a way to non-destructively characterize SESAM structures which are extensively employed in the realization of mode-locked lasers, but also provide new insights into the light-matter interaction in non-doped long-period superlattices formed by optically non-absorbing materials.

Author Contributions

Investigation, C.L.; Methodology, V.G.; Resources, E.D.; Software, C.L. and M.H.; Supervision, T.D.; Visualization, C.L.; Writing original draft, C.L. and V.G.; Writing review & editing, V.G., T.D. and M.H.

Funding

This research is financially supported by the Center for Applied Photonics at the University of Konstanz (CAP-02). It is partially supported by the Deutsche Forschungsgemeinschaft (DFG) through SFB 767. It is also supported by Chinese Scholarship Council (CSC).

Acknowledgments

Changxiu Li is grateful to versatile experimental supports from Nico Krauß and Gerhard Schäfer, and helpful discussions with Lukas Ebner and Oliver Kliebisch.

Conflicts of Interest

The authors declare no conflict of interest.

Appendix A. Complexity of Acoustic Spectrum

(1) The triple-QW stacks and the GaAs spacers between triple-QW stacks together are forming a periodic structure with a period of dMQW-SL = 145 nm, which is rather close to the DBR period dDBR = 160.4 nm. Therefore, resembling the MBZ-center modes excitation in the DBR, in principle the observable acoustic frequencies MBZ-center mode ω(0) (32, 63, 95 GHz, …) could also be excited in this long-period SL due to the electrostriction mechanism induced by the counter-propagating light field, where the triple-QW stacks and their spacers form a SL whose period also satisfies the relation dMQW-SL λ pump MQW - SL / 2 . However, due to the light absorption in QWs (In0.27Ga0.73As) of this SL with a period of 145 nm, the zone center modes could also be potentially excited through deformation potential. Meanwhile, resembling MBZ-edge modes excitation and detectability in the DBR, the observable MBZ-edge modes (15, 78, 110 GHz, …) could also be excited through the stimulated subharmonic decay of zone center mode generated in this 145-nm SL and be detectable through dynamic zone folding (the presence of modes higher than 15 GHz could also be due to higher-order replicas via Raman-Nath probe light scattering process). Interestingly, as illustrated by the acoustic dispersion relation depicted by the magenta line for the 145-nm SL and the blue line for the DBR in Figure 4b, if we take a close look at the MBZ-edge modes, the experimental peaks marked by green solid dots are always closer to the lower frequencies at the forbidden gap edge in the DBR than to the edge frequencies in the 145-nm SL (here forbidden gaps are very small), so the MBZ edge modes (15, 78, 110 GHz, …) are more likely excited in the DBR than in the 145-nm SL. Furthermore, there are two pronounced closely adjacent peaks with comparable amplitudes spaced by approximately 2 GHz at ~78 GHz and also at ~110 GHz, which are consistent to the frequency difference between the lower frequency at the forbidden gap edge in the DBR and the edge mode of 145-nm SL at the corresponding order (as calculated in Table 4 and illustrated in Figure 4b), which means the upper peaks ~80 GHz and ~112 GHz could be possibly assigned to edge modes excited in the 145-nm SL. However, MBZ-zone center modes excited in DBR and those modes excited in 145-nm SL at the corresponding order are too close to be distinguished in the experiment.
(2) Multiple contributions to each MBZ-center and edge frequency component in the DBR or in the 145-nm SL are involved by means of the subharmonic decay of center modes, dynamic zone folding and Raman-Nath type detection processes. In terms of zone center frequency, there are potential three kinds of contributions to the detected signals including zone center modes generated via electrostriction, the subharmonic decay of zone center mode, and the higher replicas of the dynamically folded lower frequencies through the Raman-Nath-like probe light scattering process. In terms of zone edge frequency, their occurrences in the acoustic spectra requires the hypothesis of a subharmonic decay of the zone center mode, dynamic zone folding and Raman-Nath-like probe light scattering process. Except the case of the 15 GHz mode, all other frequencies equal to edge mode frequencies contain simultaneous contributions from the subharmonic decay of the zone center mode and contributions from higher-order replicas of dynamically folded lower frequencies through the Raman-Nath-like probe light scattering process, which is why only the 15 GHz mode rather than the 80 GHz and the 110 GHz modes excitation via stimulated subharmonic decay is demonstrated through a few approaches in Section 3.2. Despite the theoretically predicted occurrence of a mode with a frequency of ~48 GHz as demonstrated in Figure 6, this phonon mode is absent in our experiment. The absence of ~48 GHz mode can be potentially attributed to the cancellation of contributions in the detection of the modes ω3(0)/2 via stimulated subharmonic decay and the presence of the third-order replicas 3ω1(0)/2 of 15 GHz mode in the probe.
(3) The resonances of individual layers in our structure can also be potentially observed through the nonstationary process detection in time-domain spectroscopy, which are induced by the propagating phonons generated in QWs (In0.27Ga0.73As) or in the DBR. In the experiment, the detected ~24 GHz (see Figure 4b) between MBZ-edge mode 15 GHz and -center mode 32 GHz can be attributed to the half-wavelength resonant oscillations in 112-nm GaAs layers confined between two QWs, which are estimated to take place at ~ 21 GHz. Besides, the ~38 GHz mode (the closest peak on the right side of 32 GHz in Figure 4b) could be a result of the resonance in Al0.95Ga0.05As layer with a thickness of 68.7 nm (in front of the DBR) where the oscillation at ~40 GHz can take place. Additionally, the resonances that could potentially exist in the individual layer of GaAs (73.7 nm) and Al0.95Ga0.05As (86.7 nm) in the DBR are both close to 32 GHz, which are coincident with the first-order MBZ-center mode in the DBR. The above mentioned modes can be excited from time to time when the propagating phonons are incident on the corresponding layers.
(4) Considering the frequencies of phonons that could be excited via stimulated Brillouin backscattering processes in all constituent materials of the structure are close to 32 GHz mode in our experiment. As a result, the lowest in energy of k ≅ 0 Raman-active modes in the stationary folded MBZ could be additionally resonantly pumped both in the DBR and the 145-nm SL by the coherent acoustic waves at the Brillouin frequency ω = ωB incident on them.
(5) The frequency comb spacing of the coherent acoustic phonons from the MQWs are very close to the lowest MBZ-center mode, i.e., ∆fω(0) ≈ 32 GHz, which hampers the determination of the decay time and amplitude for the phonon contribution from the DBR.
(6) All DBR eigenmodes could in theory be excited also by the CLAPs generated in QWs through light absorption when those CLAPs are incident on the DBR.
Despite the above discussed multitude of possible processes for excitation and detection of CLAPs in our sample, the occurrence of MBZ-edge mode in our experiments can be well explained by the hypothesis proposed in [21,22,23,24] and is corroborated by the nonlinearities in the process of stimulated subharmonic decay of the MBZ-center mode in our experiments.

References

  1. Klein, M.V. Phonons in semiconductor superlattice. IEEE J. Quantum Electron. 1986, 22, 1760–1770. [Google Scholar] [CrossRef]
  2. Mante, P.-A.; Huang, Y.-R.; Yang, S.-C.; Liu, T.-M.; Maznev, A.A.; Sheu, J.-K.; Sun, C.-K. THz acoustic phonon spectroscopy and nanoscopy by using piezoelectric semiconductor heterostructures. Ultrasonics 2015, 56, 52–65. [Google Scholar] [CrossRef] [PubMed]
  3. Cahill, D.G.; Ford, W.K.; Goodson, K.E.; Mahan, G.D.; Majumdar, A.; Maris, H.J.; Merlin, R.; Phillpot, S.R. Nanoscale Thermal Transport. J. Appl. Phys. 2003, 93, 793–818. [Google Scholar] [CrossRef]
  4. Lanzillotti-Kimura, N.D.; Fainstein, A.; Huynh, A.; Perrin, B.; Jusserand, B.; Miard, A.; Lemaitre, A. Coherent generation of acoustic phonons in an optical microcavity. Phys. Rev. Lett. 2007, 99, 217405:1–217405:4. [Google Scholar] [CrossRef]
  5. Maryam, W.; Akimov, A.V.; Campion, R.P.; Kent, A.J. Dynamics of a vertical cavity quantum cascade phonon laser structure. Nat. Commun. 2013, 4, 3184:1–3184:6. [Google Scholar] [CrossRef]
  6. Mizoguchi, K.; Hase, M.; Nakashima, S. Observation of coherent folded acoustic phonons propagating in a GaAs/AlAs superlattice by two-color pump-probe spectroscopy. Phys. Rev. B 1999, 60, 8262–8266. [Google Scholar] [CrossRef]
  7. Ruello, P.; Gusev, V.E. Physical mechanisms of coherent acoustic phonons generation by ultrafast laser action. Ultrasonics 2015, 56, 21–35. [Google Scholar] [CrossRef] [PubMed]
  8. Gusev, V.E.; Karabutov, A.A. Laser Optoacoustics; AIP Press: New York, NY, USA, 1993; ISBN 1-56396-036-2. [Google Scholar]
  9. Bartels, A.; Dekorsy, T.; Kurz, H. Coherent zone-folded longitudinal acoustic phonons in semiconductor superlattices: Excitation and detection. Phys. Rev. Lett. 1999, 82, 1044–1047. [Google Scholar] [CrossRef]
  10. Shinokita, K.; Reimann, K.; Woerner, M.; Elsaesser, T.; Hey, R.; Flytzanis, C. Strong amplification of coherent acoustic phonons by intraminiband currents in a semiconductor superlattice. Phys. Rev. Lett. 2016, 116, 075504:1–075504:5. [Google Scholar] [CrossRef]
  11. Villafañe, V.; Sesin, P.; Soubelet, P.; Anguiano, S.; Bruchhausen, A.E.; Rozas, G.; Gomez Carbonell, C.; Lemaître, A.; Fainstein, A. Optoelectronic forces with quantum wells for cavity optomechanics in GaAs/AlAs semiconductor microcavities. Phys. Rev. B 2018, 97, 195306:1–195306:8. [Google Scholar] [CrossRef]
  12. Jusserand, B.; Poddubny, A.N.; Poshakinskiy, A.V.; Fainstein, A.; Lemaitre, A. Polariton Resonances for ultrastrong coupling cavity optomechanics in GaAs/AlAs multiple quantum wells. Phys. Rev. Lett. 2015, 115, 267402:1–267402:5. [Google Scholar] [CrossRef]
  13. Tanaka, H.; Sonehara, T.; Takagi, S. A new phase-coherent light scattering method: First observation of complex Brillouin spectra. Phys. Rev. Lett. 1997, 79, 881–884. [Google Scholar] [CrossRef]
  14. Chen, L.Y.; Yang, J.C.; Luo, C.W.; Laing, C.W.; Wu, K.H.; Lin, J.-Y.; Uen, T.M.; Juang, J.Y.; Chu, Y.H.; Kobayashi, T. Ultrafast photoinduced mechanical strain in epitaxial BiFeO3 thin films. Appl. Phys. Lett. 2012, 101, 041902:1–041902:4. [Google Scholar] [CrossRef]
  15. Jusserand, B.; Cardona, M. Raman spectroscopy of vibrations in superlattice. In Light Scattering in Solids V, 1st ed.; Cardona, M., Güntherodt, G., Eds.; Springer: Berlin, Germany, 1989; Volume 66, pp. 86–90. ISBN 3-540-50400-1. [Google Scholar]
  16. Mizoguchi, K.; Hino, T.; Nakayama, M.; Dekorsy, T.; Bartels, A.; Kurz, H.; Nakashima, S. Umklapp process in observation of coherent folded longitudinal acoustic phonons in a GaAs/AlAs long-period superlattice. Phys. E Low Dimens. Syst. Nanostruct. 2004, 21, 646–650. [Google Scholar] [CrossRef] [Green Version]
  17. Bruchhausen, A.; LIoyd-Hughes, J.; Hettich, M.; Gebs, R.; Grossmann, M.; Ristow, O.; Bartels, A.; Fischer, M.; Beck, M.; Scalari, G.; et al. Investigation of coherent acoustic phonons in terahertz quantum cascade laser structures using femtosecond pump-probe spectroscopy. J. Appl. Phys. 2012, 112, 033517:1–033517:8. [Google Scholar] [CrossRef]
  18. Beardsley, R.; Akimov, A.V.; Glavin, B.A.; Maryam, W.; Henini, M.; Kent, A.J. Optical detection of folded mini-zone-edge coherent acoustic modes in a doped GaAs/AlAs superlattice. Phys. Rev. B 2010, 82, 041302:1–041302:4. [Google Scholar] [CrossRef]
  19. Ruf, T.; Belitsky, V.I.; Spitzer, J.; Sapega, V.F.; Cardona, M.; Ploog, K. Raman scattering from folded phonon dispersion gaps. Phys. Rev. Lett. 1993, 71, 3035–3038. [Google Scholar] [CrossRef] [PubMed]
  20. Sapriel, J.; Chavignon, J.; Alexandre, F.; Azoulay, R. Leakage-induced and disorder-activated modes from the folded acoustic branches in GaAs-AlAs superlattice. Phys. Rev. B 1986, 34, 7118–7122. [Google Scholar] [CrossRef]
  21. Matsubara, E.; Inoue, K.; Hanamura, E. Violation of Raman selection rules induced by two femtosecond laser pulses in KTaO3. Phys. Rev. B 2005, 72, 134101:1–134101:5. [Google Scholar] [CrossRef]
  22. Matsubara, E.; Inoue, K.; Hanamura, E. Dynamical symmetry breaking induced by ultrashort laser pulses in KTaO3. J. Phys. Soc. Jpn. 2006, 75, 024712:1–024712:7. [Google Scholar] [CrossRef]
  23. Inoue, K.; Kato, J.; Hanamura, E.; Matsuki, H.; Matsubara, E. Broadband coherent radiation based on peculiar multiple Raman scattering by laser-induced phonon gratings in TiO2. Phys. Rev. B 2007, 76, 041101:1–041101:4. [Google Scholar] [CrossRef]
  24. Hanamura, E.; Kato, J.; Inoue, K.; Tanabe, Y. Multistep anti-stokes Raman scattering by coherent gratings of Brillouin zone edge phonons. J. Phys. Soc. Jpn. 2008, 77, 034401:1–034401:7. [Google Scholar] [CrossRef]
  25. Li, C.; Krauß, N.; Schäfer, G.; Ebner, L.; Kliebisch, O.; Schmidt, J.; Winnerl, S.; Hettich, M.; Dekorsy, T. High-speed asynchronous optical sampling based on GHz Yb:KYW oscillators. Opt. Express 2017, 25, 9204–9212. [Google Scholar] [CrossRef] [PubMed]
  26. Adachi, S. GaAs and Related Materials: Bulk Semiconductiong and Superlattice Properties; World Scientific: Singaore, 1994; ISBN 981-02-1925-3. [Google Scholar]
  27. Levinshtein, M.E.; Rumyantsev, S.L. Gallium arsenide. In Handbook Series on Semiconductor Parameters; Levinshtein, M.E., Rumyantsev, S.L., Shur, M., Eds.; World Scientific: Singapore, 1996; Volume 1, pp. 77–103. ISBN 981-02-1420-0. [Google Scholar]
  28. Adachi, S. Physical Properties of III-V Semiconductor Compounds; WILEY-VCH GmbH & Co. KGaA: Weinheim, Germany, 2004; Chapter 2; pp. 4–16. ISBN 978-0-471-57329-6. [Google Scholar]
  29. Wemple, S.H.; DiDomenico, M., Jr. Behaviour of the electronic dielectric constant in covalent and ionic materials. Phys. Rev. B 1971, 3, 1338–1351. [Google Scholar] [CrossRef]
  30. Engelbrecht, J.A.A. An assessment of some theoretical models used for the calculation of the refractive index of InXGa1−xAs. Phys. B 2018, 535, 8–12. [Google Scholar] [CrossRef]
  31. Optical and Electrical Investigations on GaAs-Based Phototransistors. Available online: https://www.uni-ulm.de/fileadmin/website_uni_ulm/iui.inst.140/Jahresbericht/2014/UUlm-Opto-AR2014_SV.pdf (accessed on 16 November 2018).
  32. Nahory, R.E.; Pollack, M.A.; Johnston, W.D., Jr.; Barns, R.L. Band gap versus composition and demonstration of Vegard’s law for In1−xGaxAsyP1−y lattice matched to InP. Appl. Phys. Lett. 1978, 33, 659–661. [Google Scholar] [CrossRef]
  33. Golderg, Y.A.; Shmidt, N.M. Gallium indium arsenide. In Handbook Series on Semiconductor Parameters; Levinshtein, M.E., Rumyantsev, S.L., Shur, M., Eds.; World Scientific: Singapore, 1996; Volume 2, pp. 62–88. ISBN 981-02-2935-6. [Google Scholar]
  34. Adachi, S. GaAs, AlAs, and AlxGa1−xAs: Material parameters for use in research and device applications. J. Appl. Phys. 1985, 58, R1–R29. [Google Scholar] [CrossRef]
  35. Aspnes, D.E.; Kelso, S.M.; Logan, R.A.; Bhat, R. Optical properties of AlxGa1-xAs. J. Appl. Phys. 1986, 60, 754–767. [Google Scholar] [CrossRef]
  36. Golderg, Y.A. Aluminium gallium arsenide. In Handbook Series on Semiconductor Parameters; Levinshtein, M.E., Rumyantsev, S.L., Shur, M., Eds.; World Scientific: Singapore, 1996; Volume 2, pp. 1–36. ISBN 981-02-2935-6. [Google Scholar]
  37. Yu, P.Y.; Cardona, M. Effect of quantum confinement on electrons and phonons in semiconductors. In Fundamentals of Semiconductors, 4th ed.; Stanley, H.E., Rhodes, W.T., Eds.; Springer: Berlin, Germany, 2010; pp. 469–551. ISBN 978-3-642-00709-5. [Google Scholar]
  38. Smith, D.L. Strain-generated electric fields in [111] growth axis strained-layer superlattices. Solid State Commun. 1986, 57, 919–921. [Google Scholar] [CrossRef]
  39. Ishioka, K.; Rustagi, A.; Höfer, U.; Petek, H.; Stanton, C.J. Intrinsic coherent acoustic phonons in the indirect band gap semiconductors Si and GaP. Phys. Rev. B 2017, 95, 035205:1–035205:9. [Google Scholar] [CrossRef]
  40. Li, C.; Gusev, V.; Hettich, M.; Dekorsy, T. Optically manipulated coherent acoustic phonons by tunable time delay and pump power in a two-pulse-pump ASOPS system. Manuscript in preparation.
  41. Rytov, S. Acoustical properties of a thinly laminated medium. Sov. Phys. Acoust. 1956, 2, 68–80. [Google Scholar]
  42. Pinczuk, A.; Abstreiter, G. Spectroscopy of free carriers excitations in semiconductor quantum wells. In Light Scattering in Solids V; Cardona, M., Güntherodt, G., Eds.; Springer: Berlin, Germany, 1989; Volume 66, pp. 153–207. ISBN 3-540-50400-1. [Google Scholar]
  43. Milonni, P.W.; Eberly, J.H. Lasers; John Wiley & Sons: New York, NY, USA, 1988; ISBN 978-0-471-62731-9. [Google Scholar]
  44. Thomsen, C.; Grahn, H.T.; Maris, H.J.; Tauc, J. Surface generation and detection of phonons by picosecond light pulses. Phys. Rev. B 1986, 34, 4129–4137. [Google Scholar] [CrossRef]
Figure 1. Schematic diagram of the sample structure. The beige-colored areas denote GaAs layers. The violet areas denote In0.27Ga0.73As layers while the green areas denote Al0.95Ga0.05As layers. Optical pulses are incident from the left.
Applsci 09 00289 g001
Figure 2. (a) Coherent acoustic phonon wave-packets after background removal. Top inset: the original time trace. Bottom inset: zoom in of the wave-packet at around 30 ps. (b) Acoustic spectrum and dispersion relation in GaAs/In0.27Ga0.73As SL. The brown line represents the acoustic spectrum. The magenta curve depicts the FFT of the wave-packet at 30 ps. The z-like blue line represents the dispersion relation and the horizontal blue line indicates the wavevector position k = 2 q probe GaAs / InGaAs . The vertical gray lines are spaced by the comb spacing of 33.15 GHz.
Applsci 09 00289 g002
Figure 3. The illustration of the generation, propagation, and detection of acoustic stress bursts in the sample. Beige areas represent GaAs, violet areas represent QWs. Green area represents Al0.95Ga0.05As. Sir and Sib (i = 1, 2, 3) denote the backward and forward emitted from the i-th triple-QW stack stress bursts presented in red and blue colors, respectively.
Applsci 09 00289 g003
Figure 4. (a) Coherent acoustic phonon oscillation from 70 ps to 800 ps when background subtraction is optimized for low frequencies extraction. (b) FFT of (a) and dispersion relations in SL formed by DBR with period dDBR = 160.4 nm as well as SL formed by MQWs and GaAs spacers with period dMQW-SL = 145 nm. Brown line represents FFT, where MBZ-center modes at 32.0 GHz, 63.1 GHz and 95.1 GHz and MBZ-edge modes at 15.1 GHz, 78.3 GHz and 110.1 GHz are marked. Blue line represents dispersion relation in the DBR (horizontal blue line represents k = |2 q probe DBR − 2π/dDBR| = 0.028π/dDBR in the DBR). Magenta line represents dispersion relation in MQWs and GaAs spacers formed SL (horizontal magenta line represents k = |2 q probe MQW SL − 2π/dMQW-SL| = 0.066π/dMQW-SL in the SL formed by MQWs and GaAs spacers). (c) Calculated electric intensity field (red line) in the MQW-SESAM structure given the incident pump wavelength of 1047.5 nm. The interface of air/cap layer is at position 0. Beige areas denote GaAs. Violet areas denote In0.27Ga0.73As. Green areas denote Al0.95Ga0.05As.
Applsci 09 00289 g004
Figure 5. Illustration of zone folding induced by a pair of phonons on the opposite MBZ edges forming phonon grating. A pair of phonons is excited by the subharmonic decay of mode ω(0). In the DBR, at the MBZ edge wavevector is expressed as k = kmax = π/dDBR. The mirror symmetry operation with respect to ± kmax/2 boundaries enables the MBZ-edge modes (ω(0)/2 + ∆ω, +kmax) and (ω(0)/2 − ∆ω, −kmax) to be folded into the MBZ-center k ≅ 0. In our situation, due to ∆ω   ω ( 0 ) / 2 , the difference between ω(0)/2 + ∆ω, ω(0)/2 and ω(0)/2 + ∆ω are not given in the plot. We assume that all those modes are ω ( 0 ) / 2 .
Applsci 09 00289 g005
Figure 6. Illustration of MBZ coherent acoustic phonon distribution in the DBR. The plot demonstrates MBZ-center modes ωi(0) distribution, the subharmonic decay of ωi(0)/2 and subsequent new zone folding (MBZ edge is folded onto MBZ center), and the detectable Raman-Nath-like (RN-like) phonon sequences i(0)/2, where m (m = 1, 2, 3, …) denotes the replicas order of each RN-like sequence and i (i = 1, 2, 3, …) denotes the order of MBZ center mode. (Here, the phonon bandgaps on MBZ center and edge are ignored for simplicity and values of frequency are approximately regarded as n-times 16 GHz based on calculation, where n = 1, 2, 3, …).
Applsci 09 00289 g006
Figure 7. (a) Coherent acoustic phonon and (b) spectrum in the time interval from 500 ps to 800 ps at the pump power from 43 mW (bottom) to 67 mW (top) in steps of 4 mW. (c) Normalized frequency amplitude to the amplitude at lowest pump power for each frequency. (d) Frequency amplitude ratio between 32 GHz center mode and 15 GHz edge mode.
Applsci 09 00289 g007
Figure 8. (a) Left: FFT amplitude of the acoustic signal in the time interval from 400 ps to 800 ps for the pump power of 67 mW. Right: short time FFT analysis by using a long moving window length. (b) Dependences on time of 15 GHz, 32 GHz and 63 GHz mode amplitudes, which are obtained from short time FFT image (see right-hand figure of (a)).
Applsci 09 00289 g008
Table 1. Parameters of lasers.
LaserCentral Wavelength λ0 (nm)Bandwidth Δλ (nm)/ΔE (meV)Pulse Width Δτ (fs)Output Power P (mW)Repetition Rate frepPhoton Energy Ep (eV)
Pump laser1047.55.1/62102601 GHz + 5 kHz1.184
Probe laser1048.35.9/72803101 GHz1.183
Table 2. Properties of MQW-SESAM sample at a wavelength of λ = 1048.3 nm.
MaterialRefractive Index nExtinction Coefficient KEnergy Gap Eg (eV)Acoustic Velocity v (m/s)Density ρ (g/cm3)
GaAs3.48 [26]0 (α = 7.4 × 10⁻³ cm−1) [26]1.424 [27]4730 [27]5.317 [28]
In0.27Ga0.73As3.60 [29,30]0.028 (α = 3.4 × 103 cm−1) [31]1.052 [32] (1.177 quantization)4487 [33]5.410 [33]
Al0.95Ga0.05As2.98 [34]0 [35]2.148 [26]5592 [36]3.838 [36]
DBR (GaAs/Al0.95Ga0.05As)3.22 [37] 5160 [37]
QW-heterostructures (GaAs/In0.27Ga0.73As)3.54 [37] 4596 [37]
Table 3. Acoustic phonon spectrum in the high frequency region
Experiment Calculation MQWsCalculation InGaAs/GaAs SL [37,41,42]
f0 (GHz)Comb (GHz)f0 (GHz)Comb (GHz)fc, fe (GHz)f2q (k = 2qprobe) (0.176π/dQW)
366.5299.9633.0353.5293.4619.4k = π/dQW
L 1 175.5
U 1 179.4
Lowest
31.2
B (GHz)332.1666.1B (GHz)326.0652.0k = 0
L 354.7
U 355.3
p = −1 323.7
p = +1 386.2
109.6364.6700.186.9 (G 2)
124 (R 2)
358.6684.6k = π/dQW
L 530.5
U 534.3
f (GHz)397.1732.0f (GHz)391.2717.2k = 0
L 709.3
U 710.6
p = −2 678.7
p = +2 741.2
32.6, 33.3430.3766.032.6423.8749.8k = π/dQW
L 885.7
U 889.3
1 L denotes the lower frequency of phonon bandgap, while U denotes the upper frequency of phonon bandgap. 2 G stands for Gaussian profile and R stands for rectangular profile of triple-QW in the calculation.
Table 4. Acoustic phonon spectrum in the low frequency region.
ExperimentCalculation DBR [41,42] (dDBR = 160.4 nm)Calculation SL Formed by QW Stacks and Spacers (dMQW-SL = 145 nm)Calculation Brillouin Frequency [44]
fc, fe (GHz)B (GHz)fc, fe (GHz)f2k (GHz) (k = 2qprobe) (0.028π/dDBR)fc, fe (GHz)f2k (GHz) k = 2qprobe (0.06π/dMQW_SL)fB in GaAs (GHz)
15.12.1k = π/dDBR
L 15.28
U 16.90
Lowest
0.65
k = π/dDBR
16.20
Lowest
1.02
31.4
32.02.2k = 0
L 32.17
U 32.18
p = −1 31.56
p = +1 32.53
q = 0
L 32.40
U 32.41
p = −1 31.20
p = +1 33.54
fB in In0.27Ga0.73As (GHz)
--k = π/dDBR
L 47.45
U 49.07
k = π/dDBR
48.61
30.8
63.12.2k = 0
L 64.33
U 64.35
p = −2 63.82
p = +2 64.68
k = 0
L 64.808
U 64.814
p = −2 63.67
p = +2 65.86
fB inAl0.95Ga0.05As (GHz)
78.33.4k = π/dDBR
L 79.62
U 81.24
k = π/dDBR
L 81.01
U 81.02
31.8
95.12.2k = 0
L 96.50
U 96.53
p = −3 95.97
p = +3 96.94
k = 097.22p = −3 96.18
p = +3 98.23
110.11.8k = π/dSL
L 111.80
U 113.40
k = π/dSL
L 113.41
U 113.43

