Article

Treatment of Wastewater Solutions from Anodizing Industry by Membrane Distillation and Membrane Crystallization

by
Aamer Ali
,
Josephine Hvid Jacobsen
,
Henriette Casper Jensen
,
Morten Lykkegaard Christensen
and
Cejna Anna Quist-Jensen
*
Center for Membrane Technology, Department of Chemistry and Bioscience, Aalborg University, Fredrik Bajers Vej 7H, 9220 Aalborg East, Denmark
*
Author to whom correspondence should be addressed.
Appl. Sci. 2019, 9(2), 287; https://doi.org/10.3390/app9020287
Submission received: 18 December 2018 / Revised: 8 January 2019 / Accepted: 10 January 2019 / Published: 15 January 2019
(This article belongs to the Special Issue Membrane Separation Techniques – Optimization and Application)

Abstract

:
The treatment of wastewater containing various metal ions is a challenging issue in the anodizing industry. The current study investigates the application of membrane distillation/crystallization (MD/MCr) for the simultaneous recovery of freshwater and sodium sulfate from wastewater originating from a Danish anodizing industry. MD/MCr experiments were performed on supernatant from wastewater obtained after centrifugation. The effect of various feed temperatures and cross-flow velocities on flux and crystal characteristics was investigated. The crystal growth in the feed tank was monitored through the use of an online PaticleView microscope. The crystals’ morphology and form were determined by using scanning electron microscope (SEM) and X-ray powder diffraction (XRD), respectively, while inductively coupled plasma (ICP) was applied to determine the purity of the obtained crystals. The weight and dimensions of the MD/MCr unit that were required to treat the specific amount of wastewater were evaluated as a function of the feed inlet temperature. It was demonstrated that the application of MCr allows extracting high-purity sodium sulfate crystals and more than 80% freshwater from the wastewater.

1. Introduction

Anodizing is an electrochemical process applied at the metallic surfaces to enhance their decorative, durable, appearance enhancement, and corrosion resistance properties. Anodizing treatment can be broadly divided into two main steps: (i) surface cleaning and preparation (degreasing, pickling etc.) and (ii) metallic coating and surface finishing (electroplating, anodizing, and immersion). The process generates various wastewater streams, which are generally mixed into a single stream before disposal [1]. Due to the presence of several metals into the final stream, the anodizing industry is moving toward zero liquid discharge to meet stringent environmental regulations [2].
Depending upon the composition of effluent and final requirements, various technologies are applied in practice for the treatment of wastewater from the anodizing industry. However, each of the applied technologies addresses a very specific problem within the overall wastewater treatment line. For instance, combined chemical precipitation, coagulation, and flocculation followed by filtration is used to partly remove the dissolved metals from wastewater. However, this approach is time consuming, uses excessive toxic chemicals, generally requires a polishing step to meet the discharge requirements [3], and has large footprints due to the involvement of multiple unit operation. Reverse osmosis (RO) or ion exchange are applied to remove dissolved salts and thus to produce water with low conductivity. However, RO requires extensive pretreatment, and generates a concentrated stream that needs proper disposal, while ion exchange technology requires the regeneration of the resins. Zero liquid discharge units, being applied in the anodizing industry today, are a complex combination of several unit operations such as chemical–physical purification, mechanical separation, membrane bases purification, and evaporation [4]. Various chemicals are used to adjust pH levels at different stages during these processes. The energy consumption of such methods is high, and footprints are large. Furthermore, this approach does not consider the recovery of valuable components from the wastewater streams.
Membrane distillation/crystallization (MD/MCr) has emerged as an attractive process to concentrate the solutions to their saturation level [5]. MD is a temperature-driven process in which the vapors of volatile components pass through a hydrophobic membrane, due to a vapor pressure difference across the membrane. Due to the hydrophobic nature of the membrane, it has theoretically a 100% rejection of non-volatile substances present in wastewater streams. The process is operated at lower temperatures (~40–60 °C [6]) compared to the conventional distillation process; accordingly, cheap low-grade heat can be used to heat the feed solution [7]. Compared to conventional thermal desalination processes, the process has smaller footprints, and is lightweight [8,9]. The process can simultaneously produce freshwater and crystals of the dissolved salts, thus approaching zero liquid discharge without any additional post-treatment [10]. The technical potential of MD for various applications, such as desalination, environmental/waste clean-up, water reuse, and in the food and medical industry has been well-demonstrated in the literature [11,12,13].
MCr has been particularly investigated for the simultaneous recovery of salts and freshwater from various types of brine solution [14,15,16]. Ji et al. [17] applied MCr to recover high-purity NaCl from the reverse osmosis concentrate of real seawater. In another study [10], MCr was applied to recover NaCl crystals from microfiltered produced water. Li et al. [18] integrated a reverse osmosis unit with MCr to recover Na2SO4 from a single salt solution. Curcio et al. [19] coupled MCr with nanofiltration to recover Na2SO4 from its single salt aqueous solution. In another study, sodium sulfate was precipitated from an industrial solution by applying MCr standalone, as well as in integration with nanofiltration [20].
In this study, MD/MCr has been investigated for the treatment of real wastewater originating from the anodizing industry. The particular novel aspect of the study is the application of MCr for the simultaneous recovery of dissolved salts and freshwater from wastewater from the anodizing industry. The study investigates the effect of operating temperature and hydrodynamics upon the freshwater production and quality of the recovered crystals. The ultimate objective is to produce clean water, minimize the waste stream, and recover the minerals contained in the waste streams.

2. Materials and Methods

2.1. Wastewater Properties

The feed solution used in the experiments was real wastewater from an anodizing industry where aluminum parts are anodized. The company neutralizes their wastewater stream to pH 7 before disposal. Since the wastewater was highly concentrated and neutralization was performed, a large fraction of suspended solids was present in the solution. Therefore, centrifugation was carried out before MD/MCr treatment. The dry matter content of the wastewater was estimated by drying 20 mL of the wastewater in an oven at 105 °C for 24 hours. Afterwards, the dry matter was incinerated at 550 °C for two hours to determine the organic/inorganic fraction. The weight loss was declared as the organic matter. The characteristics of the wastewater before centrifugation have been provided in Table 1.
The composition of the supernatant from the centrifugation was analyzed by using inductively coupled plasma optical emission spectrometry (ICP-OES) (Thermo Scientific iCap 6300) and ion chromatography (IC). Cations were measured by ICP-OES operated in an axial view mode. The spectrometer was calibrated against matrix matched multi element standards. IC (Metrohm IC system) analyzed the anions with components 820, 819, 818, 771, and 833. The composition of the supernatant has been given in Table 2, which shows that the dry matter content in supernatant is 48% less than that in wastewater.

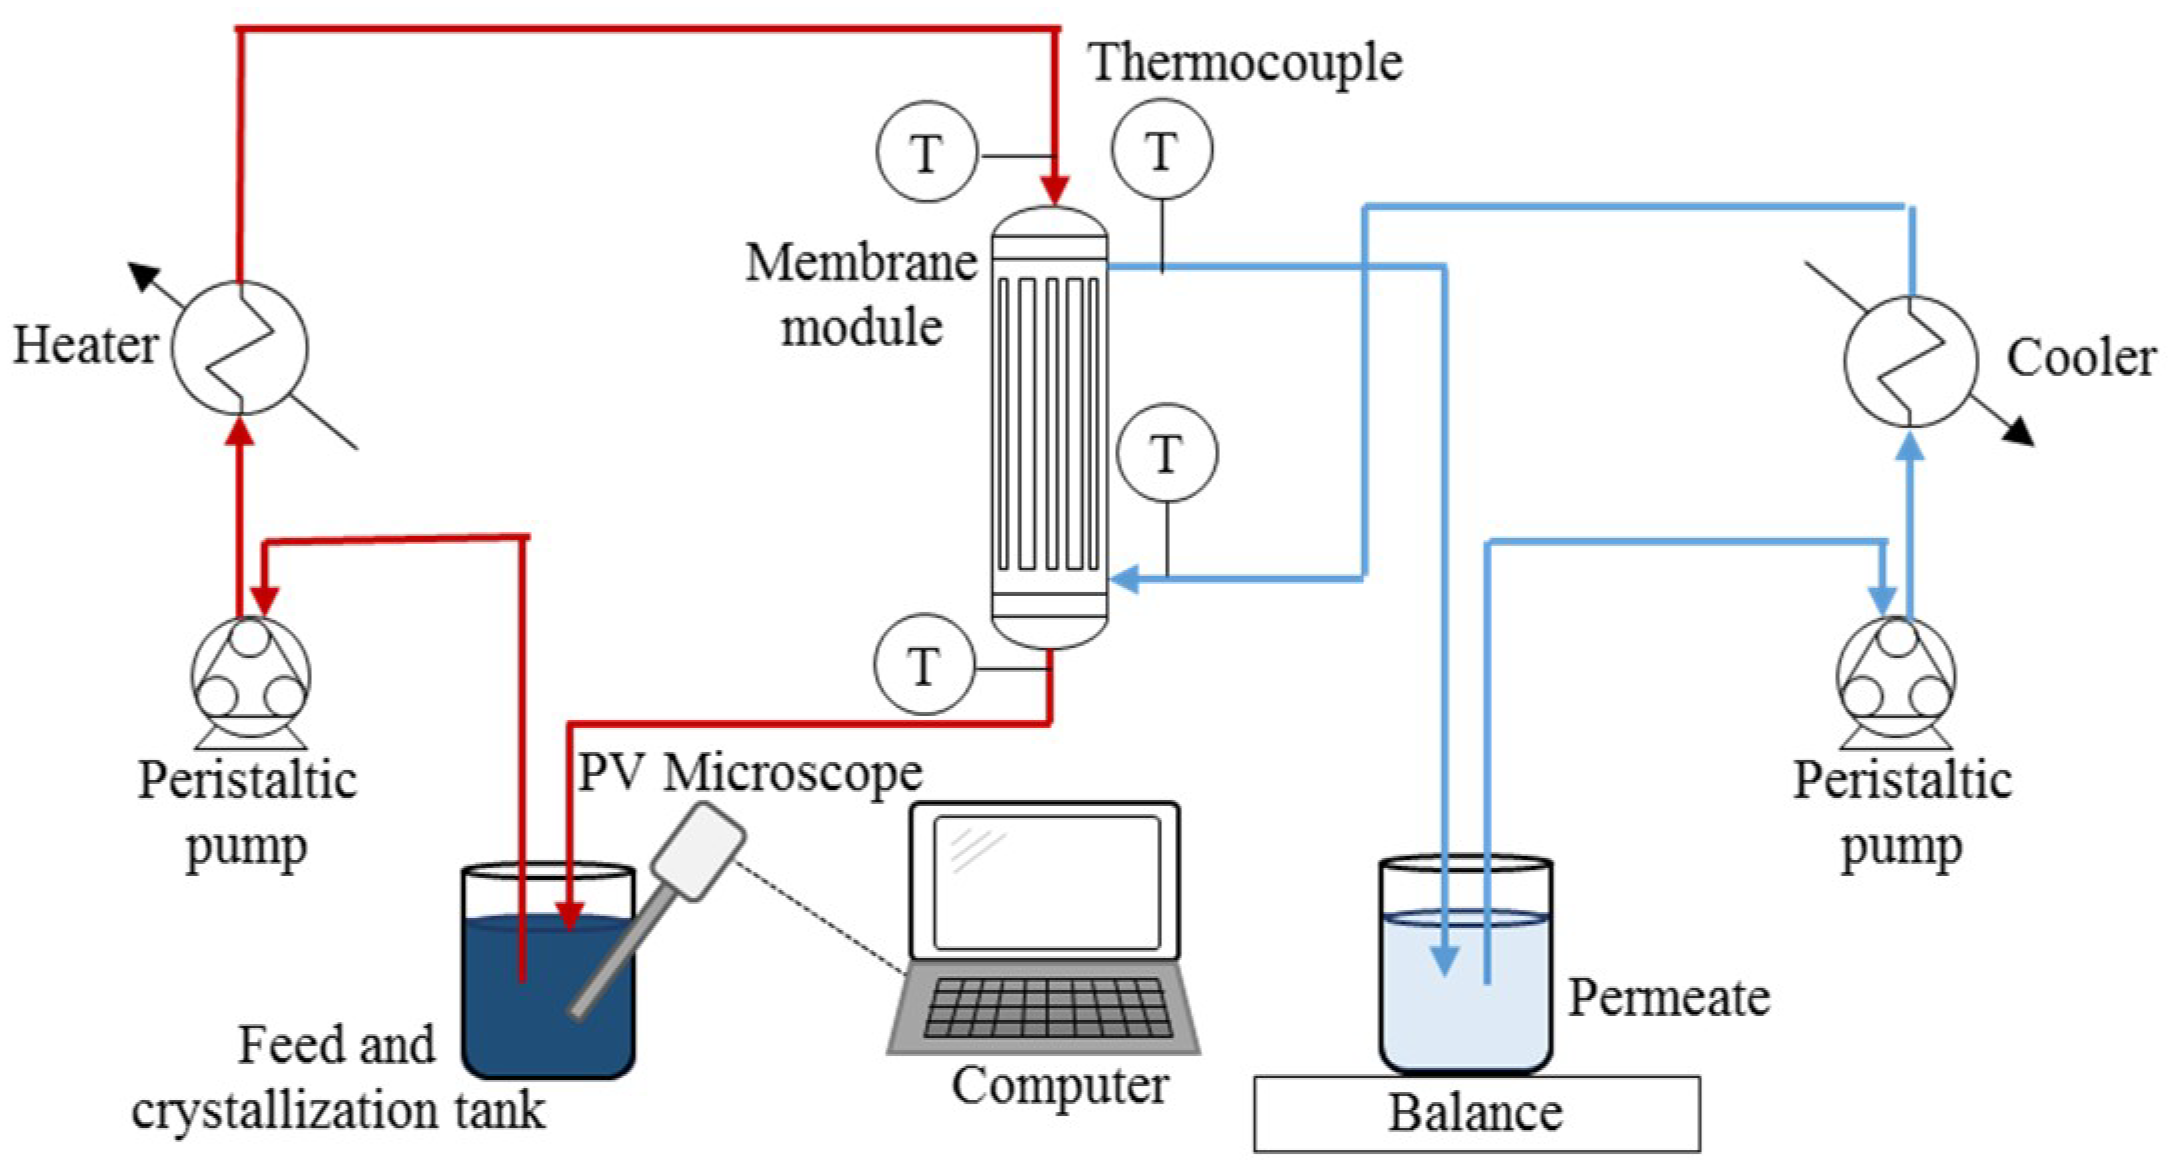
2.2. Membrane Distillation and Crystallization Setup

MD/MCr experiments were carried out by using polypropylene (PP) hollow fiber membranes (Membrana Accurel®® PP S6/2) assembled into a transparent plastic module. A detailed description of the membrane fibers and modules can be found in Table 3. MD and MCr setup was operated in direct contact configuration mode with feed in the lumen side of fibers (in counter current with permeate on the shell side). The feed side consisted of a feed tank with a stirrer. The feed solution was pumped with a peristaltic pump (Masterflex L/S) from the feed tank through a heater followed by the membrane module and back into the feed tank. Permeate side pumps distillate water from the permeate tank through a cooler and into the membrane module and back into the permeate tank. The temperature is measured at the membrane inlet and outlet at the feed and permeate sides. A schematic diagram of the MD/MCr setup has been presented in Figure 1.
The experiments were conducted both using distillate water and the supernatant from the centrifuged wastewater described in Table 2 as the feed solutions. Feed temperatures at ~38 °C, ~47 °C, and ~56 °C with a flow rate of 21.6 L/h (corresponding to feed and permeate velocities of 1.2 m/s and 0.8 m/s, respectively) and permeate temperature of ~15 °C were used in the experiments. Feed and permeate flow rates of 14.8 L/h, 21.6 L/h, and 30.7 L/h (corresponding to feed velocities of 0.8 m/s, 1.2 m/s, and 1.7 m/s, respectively) were tested while fixing the feed and permeate temperature at ~47 °C and ~15 °C, respectively. The experimental time varied from 40 to 100 hours for each test, depending upon the operating conditions applied; therefore, all of the experiments have been conducted only once. The feed solution was concentrated until precipitation, where the crystallization occurred in the feed tank. The crystallization process was continuously monitored by using a ParticleView V19 microscope (PVM) inserted into the feed tank. When crystals start appearing in the feed tank, a sample was taken from the feed tank to analyze the crystals through an optical microscope. The crystals were recovered by filtering off the solution after the completion of the experiments for X-ray diffraction (XRD), ICP-OES, and scanning electron microscopy (SEM) analysis. Further details about these procedures have been provided in Section 2.5.

2.3. Fouling/Scaling Analysis

In order to assess the presence of fouling/scaling at the membrane surface, pure water flux through the membrane before and after MCr test was measured. Subsequently, the used membrane was cleaned with citric acid solution of pH 4 for 30 minutes. Flux measurements were performed before and after cleaning, and were compared with the flux obtained with the virgin membrane.

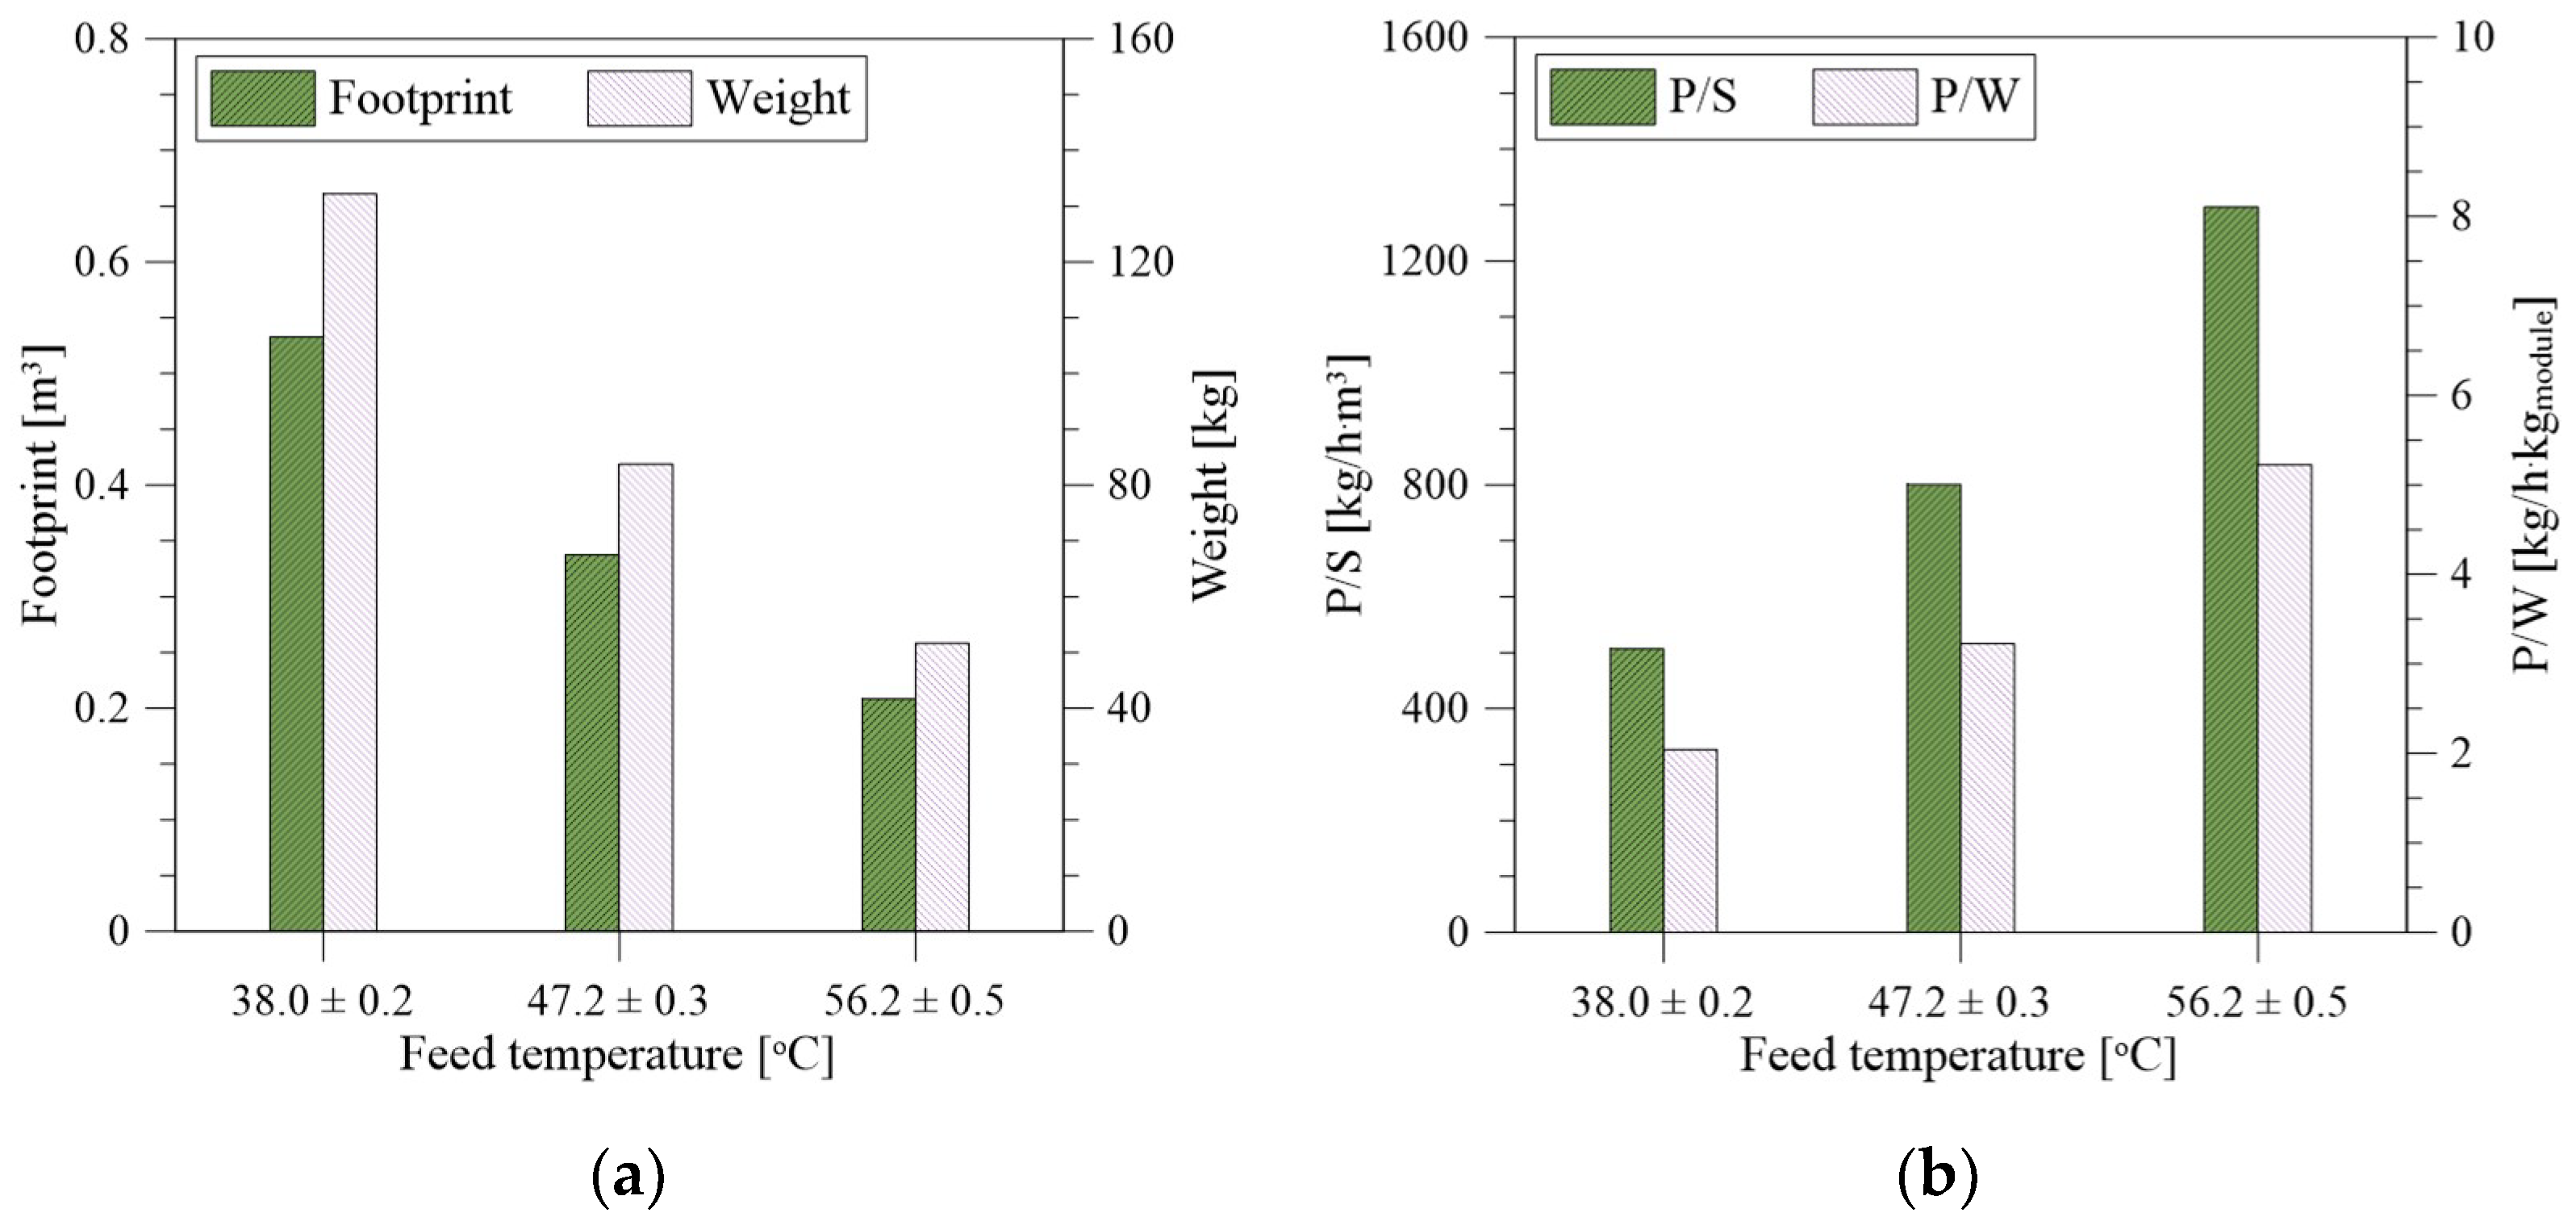
2.4. Footprint, Weight, and Waste Reduction Analysis

In order to evaluate the specific dimensions and weight of the MD/MCr unit, footprint and weight analysis was performed. These parameters were also evaluated in terms of the corresponding process intensity metrics, including productivity to size (P/S) and productivity to weight (P/W) ratios provided in the literature [9], which are defined mathematically as following:
P / S = Productivity ( k g h ) Size ( m 3 )
P / W = Productivity ( k g h ) Weight ( k g )
The conversion of wastewater into valuable products (freshwater and salt crystals) was monitored according to the following correlation:
W a s t e   I n t e n s i t y = Total   waste ( k g ) Mass   of   product ( k g )
For the calculation of P/S and P/W metrics, each hollow fiber membrane module was assumed to have a 0.201 m diameter, one-meters length, 34 m2 of area, and 16 kg of weight according to the information provided in the literature [8]. For the calculation of the size of the MD/MCr unit, 50% space density between the modules was assumed. The calculations were based upon a wastewater volume of 10 m3 per week.

2.5. Crystal Characterization

The formed crystals were analyzed by an in-line microscope (Mettler Toledo, ParticleView V19) to follow the crystallization process during the experiments. Moreover, a one-mL solution containing crystals were withdrawn from the feed tank and characterized by optical microscope (SWEISS, Axioskop, West Germany) with a camera (Infinity X) at a magnification of 10×. At the end of the experiments, the solution containing crystals was filtered through a filter paper with a pore size of 20–25 μm, and dried at 45 °C in an oven overnight. Analysis of the dried crystals was carried out by XRD, ICP-OES, and SEM.
XRD (Empyrean, PANalytical) analysis was performed to identify the phase of the crystal that was precipitated. The crystalline samples were finely ground before measuring. The program measured at 2θ from 10–110° degrees with a beam source of Cu Kα 1.54 Å, and the step size was 0.013° degrees. ICP-OES was carried out to determine the composition of the precipitated salts including impurities, and furthermore, SEM (EVO60, Zeiss) was used to identify the crystal morphology. SEM was operated at 10 kV with magnifications of 215, 401, 961, and 2030.

3. Results and Discussion

3.1. Membrane Characterization with Pure Water

The flux for clean water as a function of time was determined under different thermal and hydrodynamic conditions. The experiments with different feed temperatures showed clear difference in the flux (Figure 2a). The flux increased with temperature due to increases in the corresponding driving force i.e., the vapor pressure difference between the feed and permeate sides. The average fluxes for 38 °C, 47 °C, and 56 °C at a flow rate of 21.6 L/h were measured to be 1.29 L/m2·h, 2.36 L/m2·h, and 3.86 L/m2·h, respectively. The flux was also measured at a feed temperature of 56 °C, and flow rates of 14.8 L/h and 21.6 L/h were used to compare the effect of flow rates on water flux (Figure 2b). The average flux at 14.8 L/h was measured to be 3 L/m2·h, which is significantly lower than for the flux at 21.6 L/h. A high flow rate decreases the temperature polarization and temperature drop along the membrane module, which contributes to the observed corresponding high flux, as explained in the literature [21].

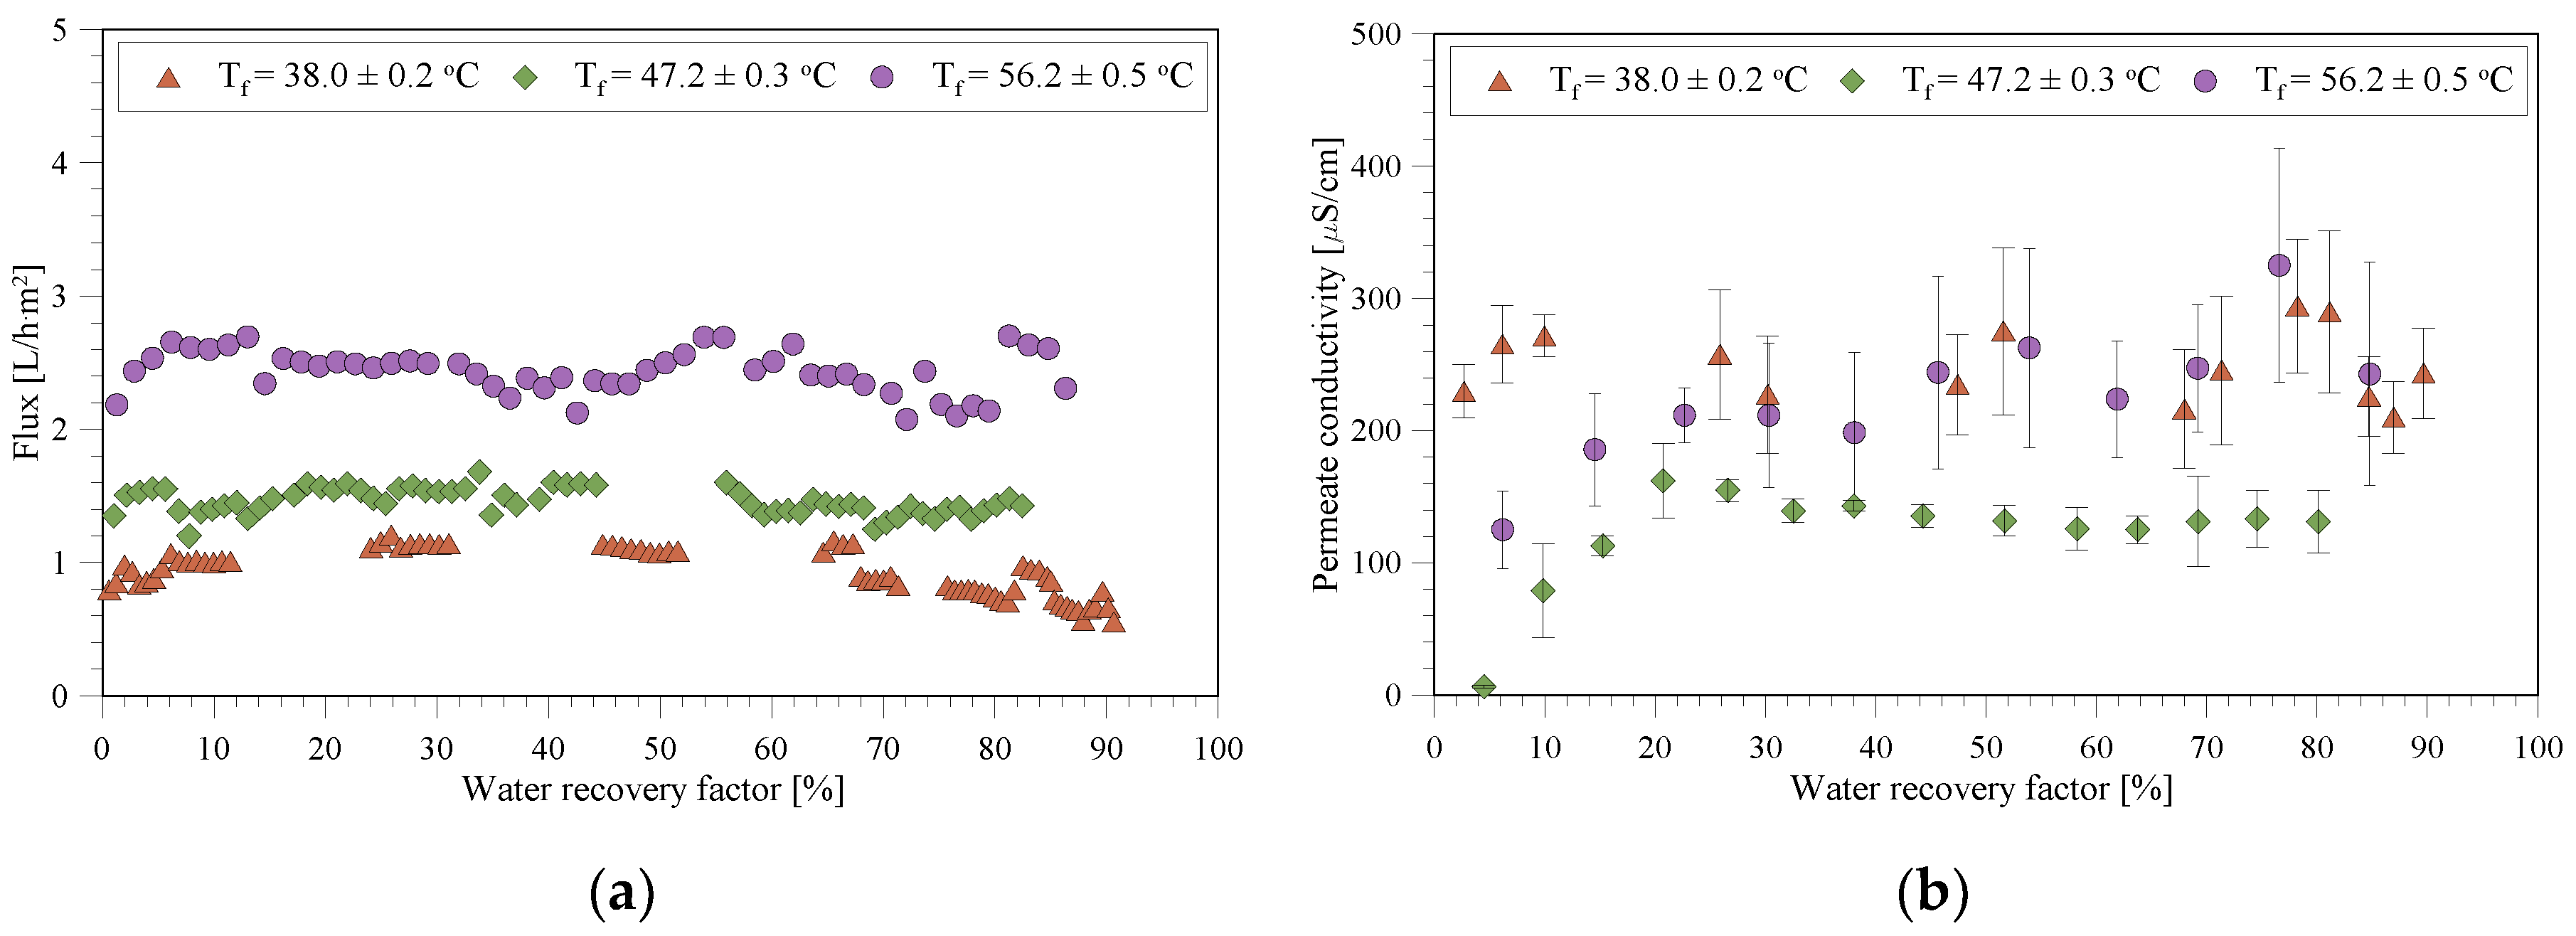
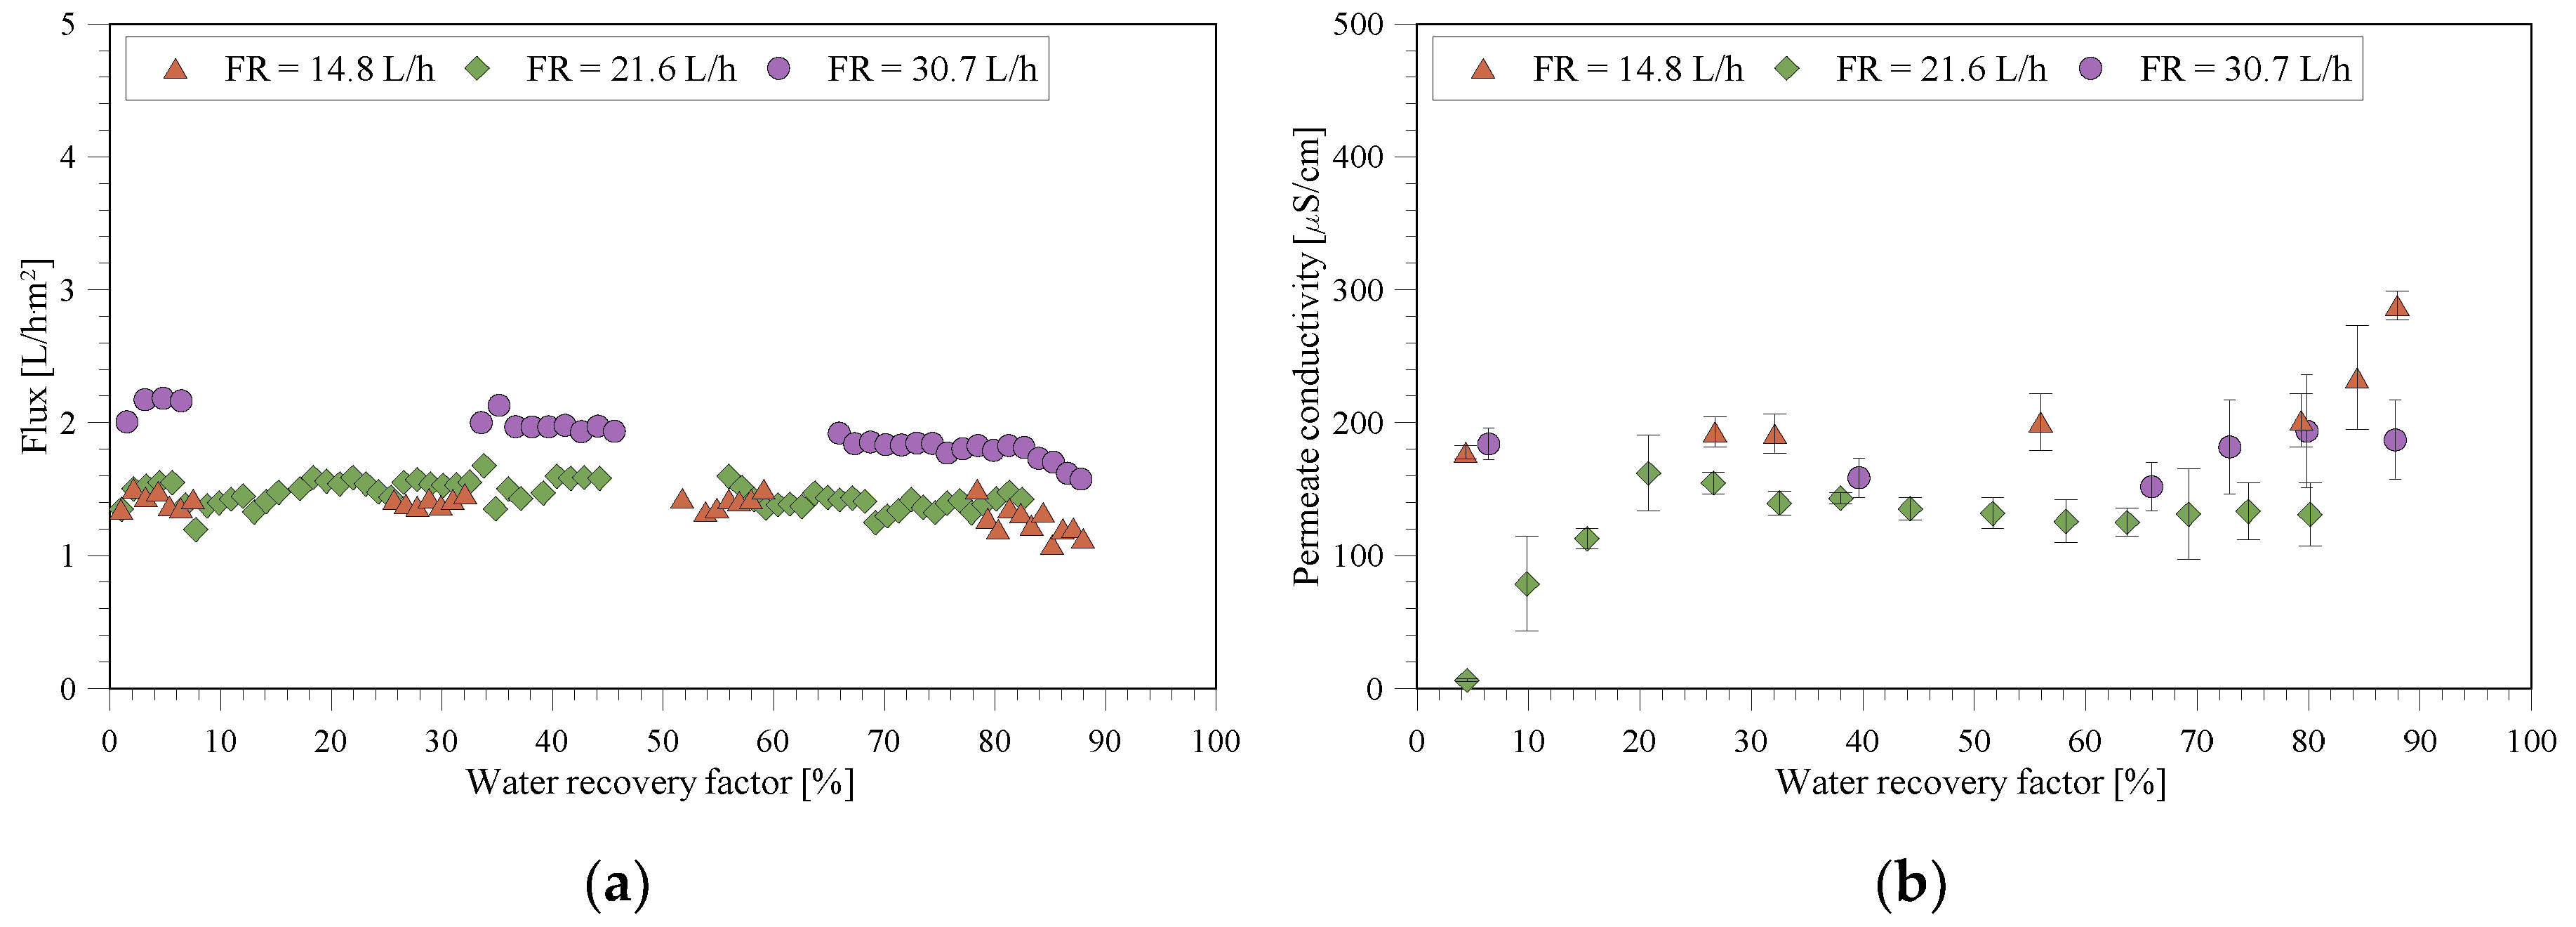
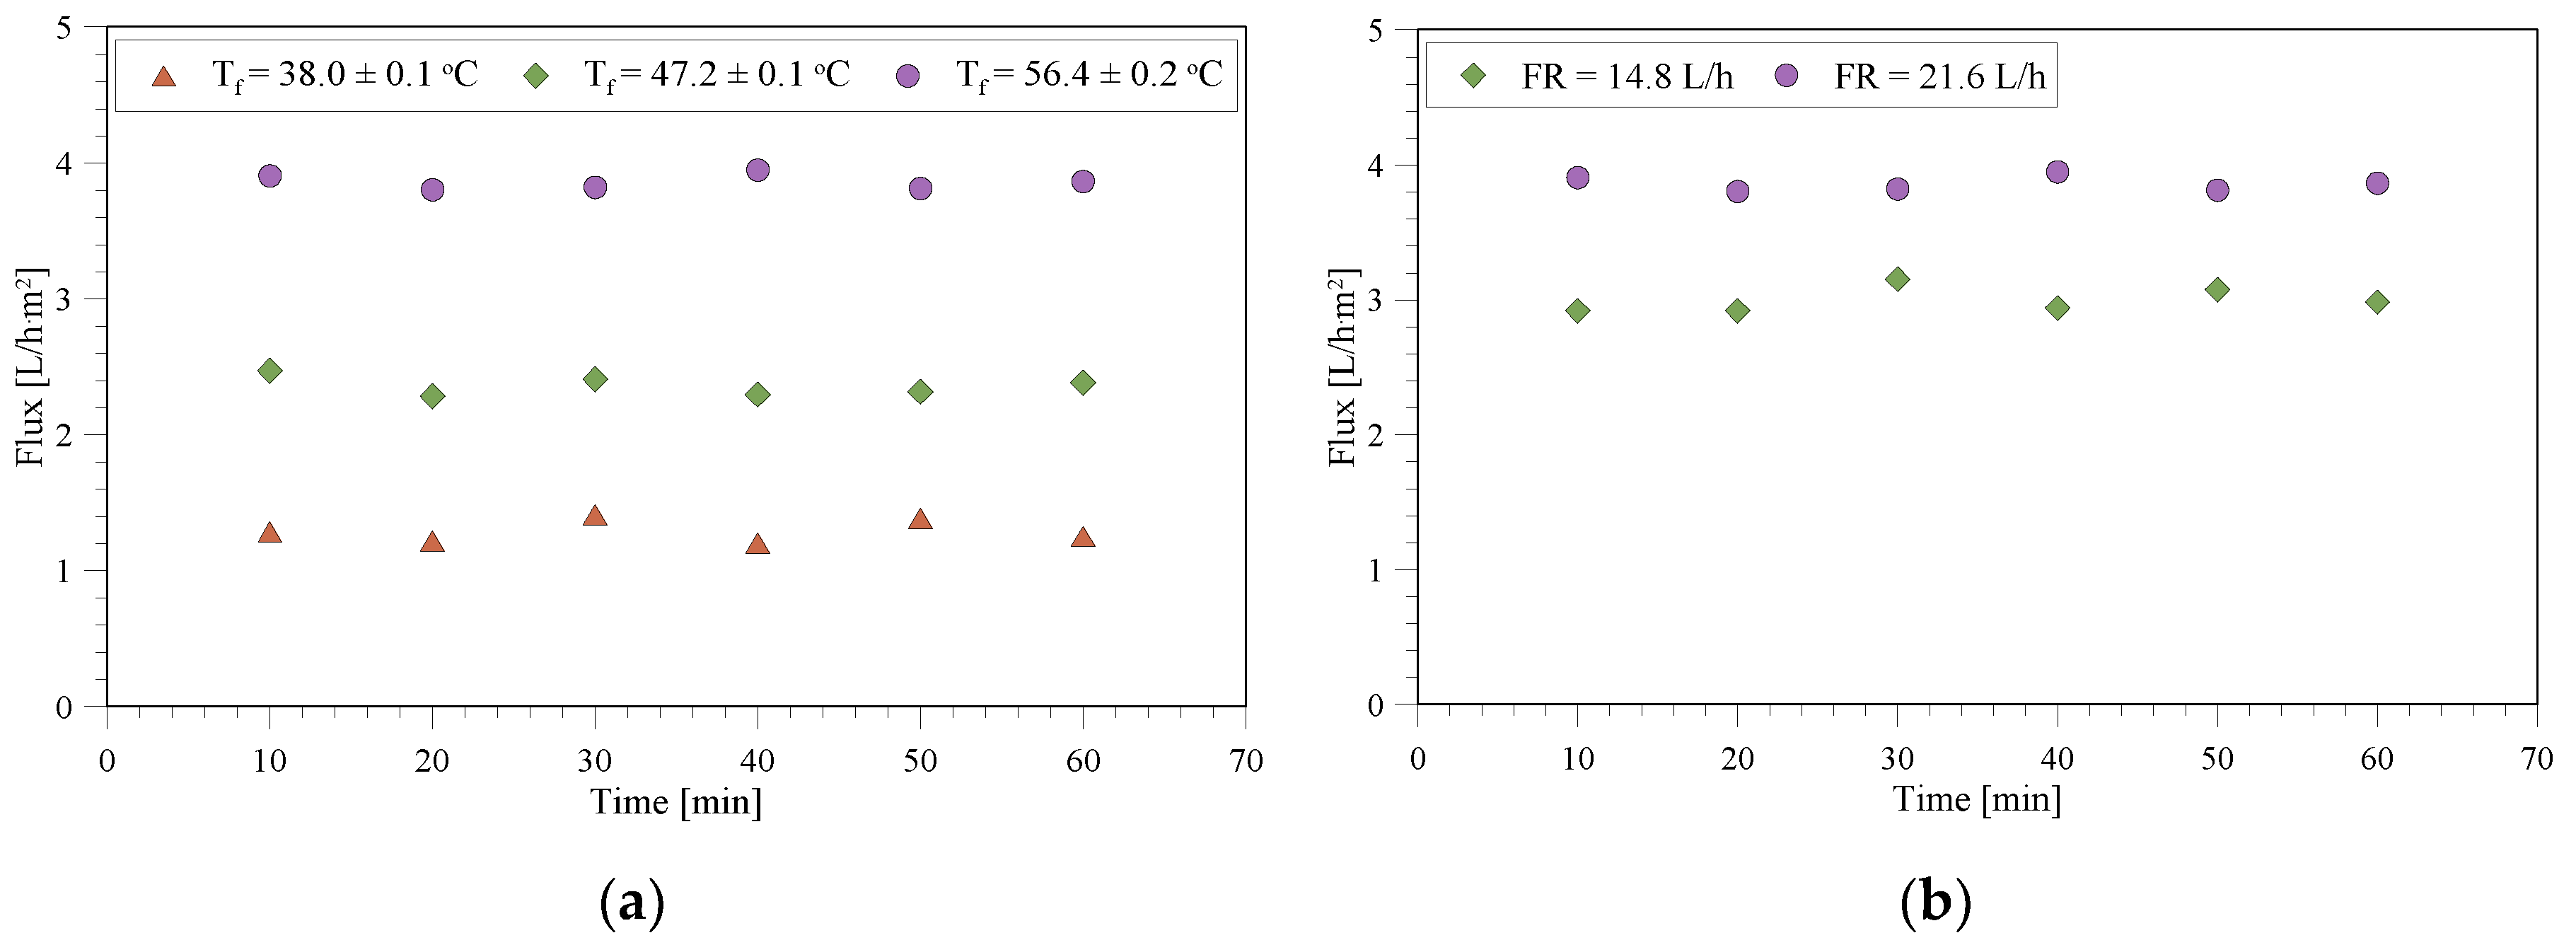
3.2. MD/MCr Tests with the Wastewater

The flux for the MCr tests, which were performed for the centrifuged wastewater at different feed temperatures, is shown in Figure 3. Similar to the pure water flux, the flux increased with temperature. The mean flux was measured to be 0.95 ± 0.2 L/m2·h, 1.50 ± 0.2 L/m2·h, and 2.43 ± 0.2 L/m2·h at feed inlet temperatures of 38 °C, 47 °C, and 56 °C, respectively. Even at high recovery factors (>60%), the flux decline was more evident only at a low feed inlet temperature (37 °C). This observation is consistent with the literature [10], and can be associated with the relatively high viscosity of the used solution at low temperature, which increases the concentration polarization [22], and consequently, possible salt accumulation at the membrane surface. The conductivity of the permeate (Figure 3b) increased slightly at the beginning of the experiments, but remained constant during the rest of the time. For all of the conducted experiments, the final permeate conductivity remained below 250 µS/cm (corresponding to a minimum rejection toward conductivity of 99.4%), which indicates no or only a partly wetting of the membrane. No clear tendency of permeate conductivity with respect to the driving force (i.e., temperature) was observed during the experiments. In general, the permeate quality is of good standard. Furthermore, this is confirmed by analyzing the composition of the permeate stream (Table 4), which indicates that for all of the conducted experiments, only small amounts of impurities passed through the membrane, which was possibly due to the wetting of some of the membrane pores.
MD and MCr tests have also been carried out on the wastewater under various hydrodynamic conditions (Figure 4a). The maximum flux was observed at the highest flow rate. It is well acknowledged that a high feed velocity decreases the temperature polarization and temperature drop along the module in MD [23,24], which results in a higher flux, as is also observed for the studies on pure water flux. However, there was no significant difference in the flux measured at feed flow rates of 14.8 L/h and 21.6 L/h. The feed inlet temperature for the experiment performed at 14.7 L/h (47.7 ± 0.3 °C) was slightly higher than for that at 21.6 L/h (47.2 ± 0.3 °C). This slight difference in both the temperatures has possibly narrowed down the difference between the observed flux at these two flow rates. As expected, the flux decreases slightly with the recovery factor, due to decrease in the water activity and potential scaling. The reason for the disruption in the flux for the higher flow rate is that this experiment was conducted overnight without automatic recording of the mass changes of the permeate. The dependence of conductivity of the permeate does not show any clear trend with respect to the flow rate, and remains below 240 µS/cm (corresponding to a minimum rejection toward conductivity of 99.4%) in all of the cases.
For all of the conducted experiments, a water recovery factor between 84–92% was achieved. This highlights the possibility of minimizing the waste stream with at least a factor of six; simultaneously, this has been converted into a pure water stream. Moreover, precipitation occurred in all of the conducted experiments, potentially producing another valuable resource from the wastewater. The nature and characteristics of the crystals are evaluated in the sections below.

3.3. Crystallization Study

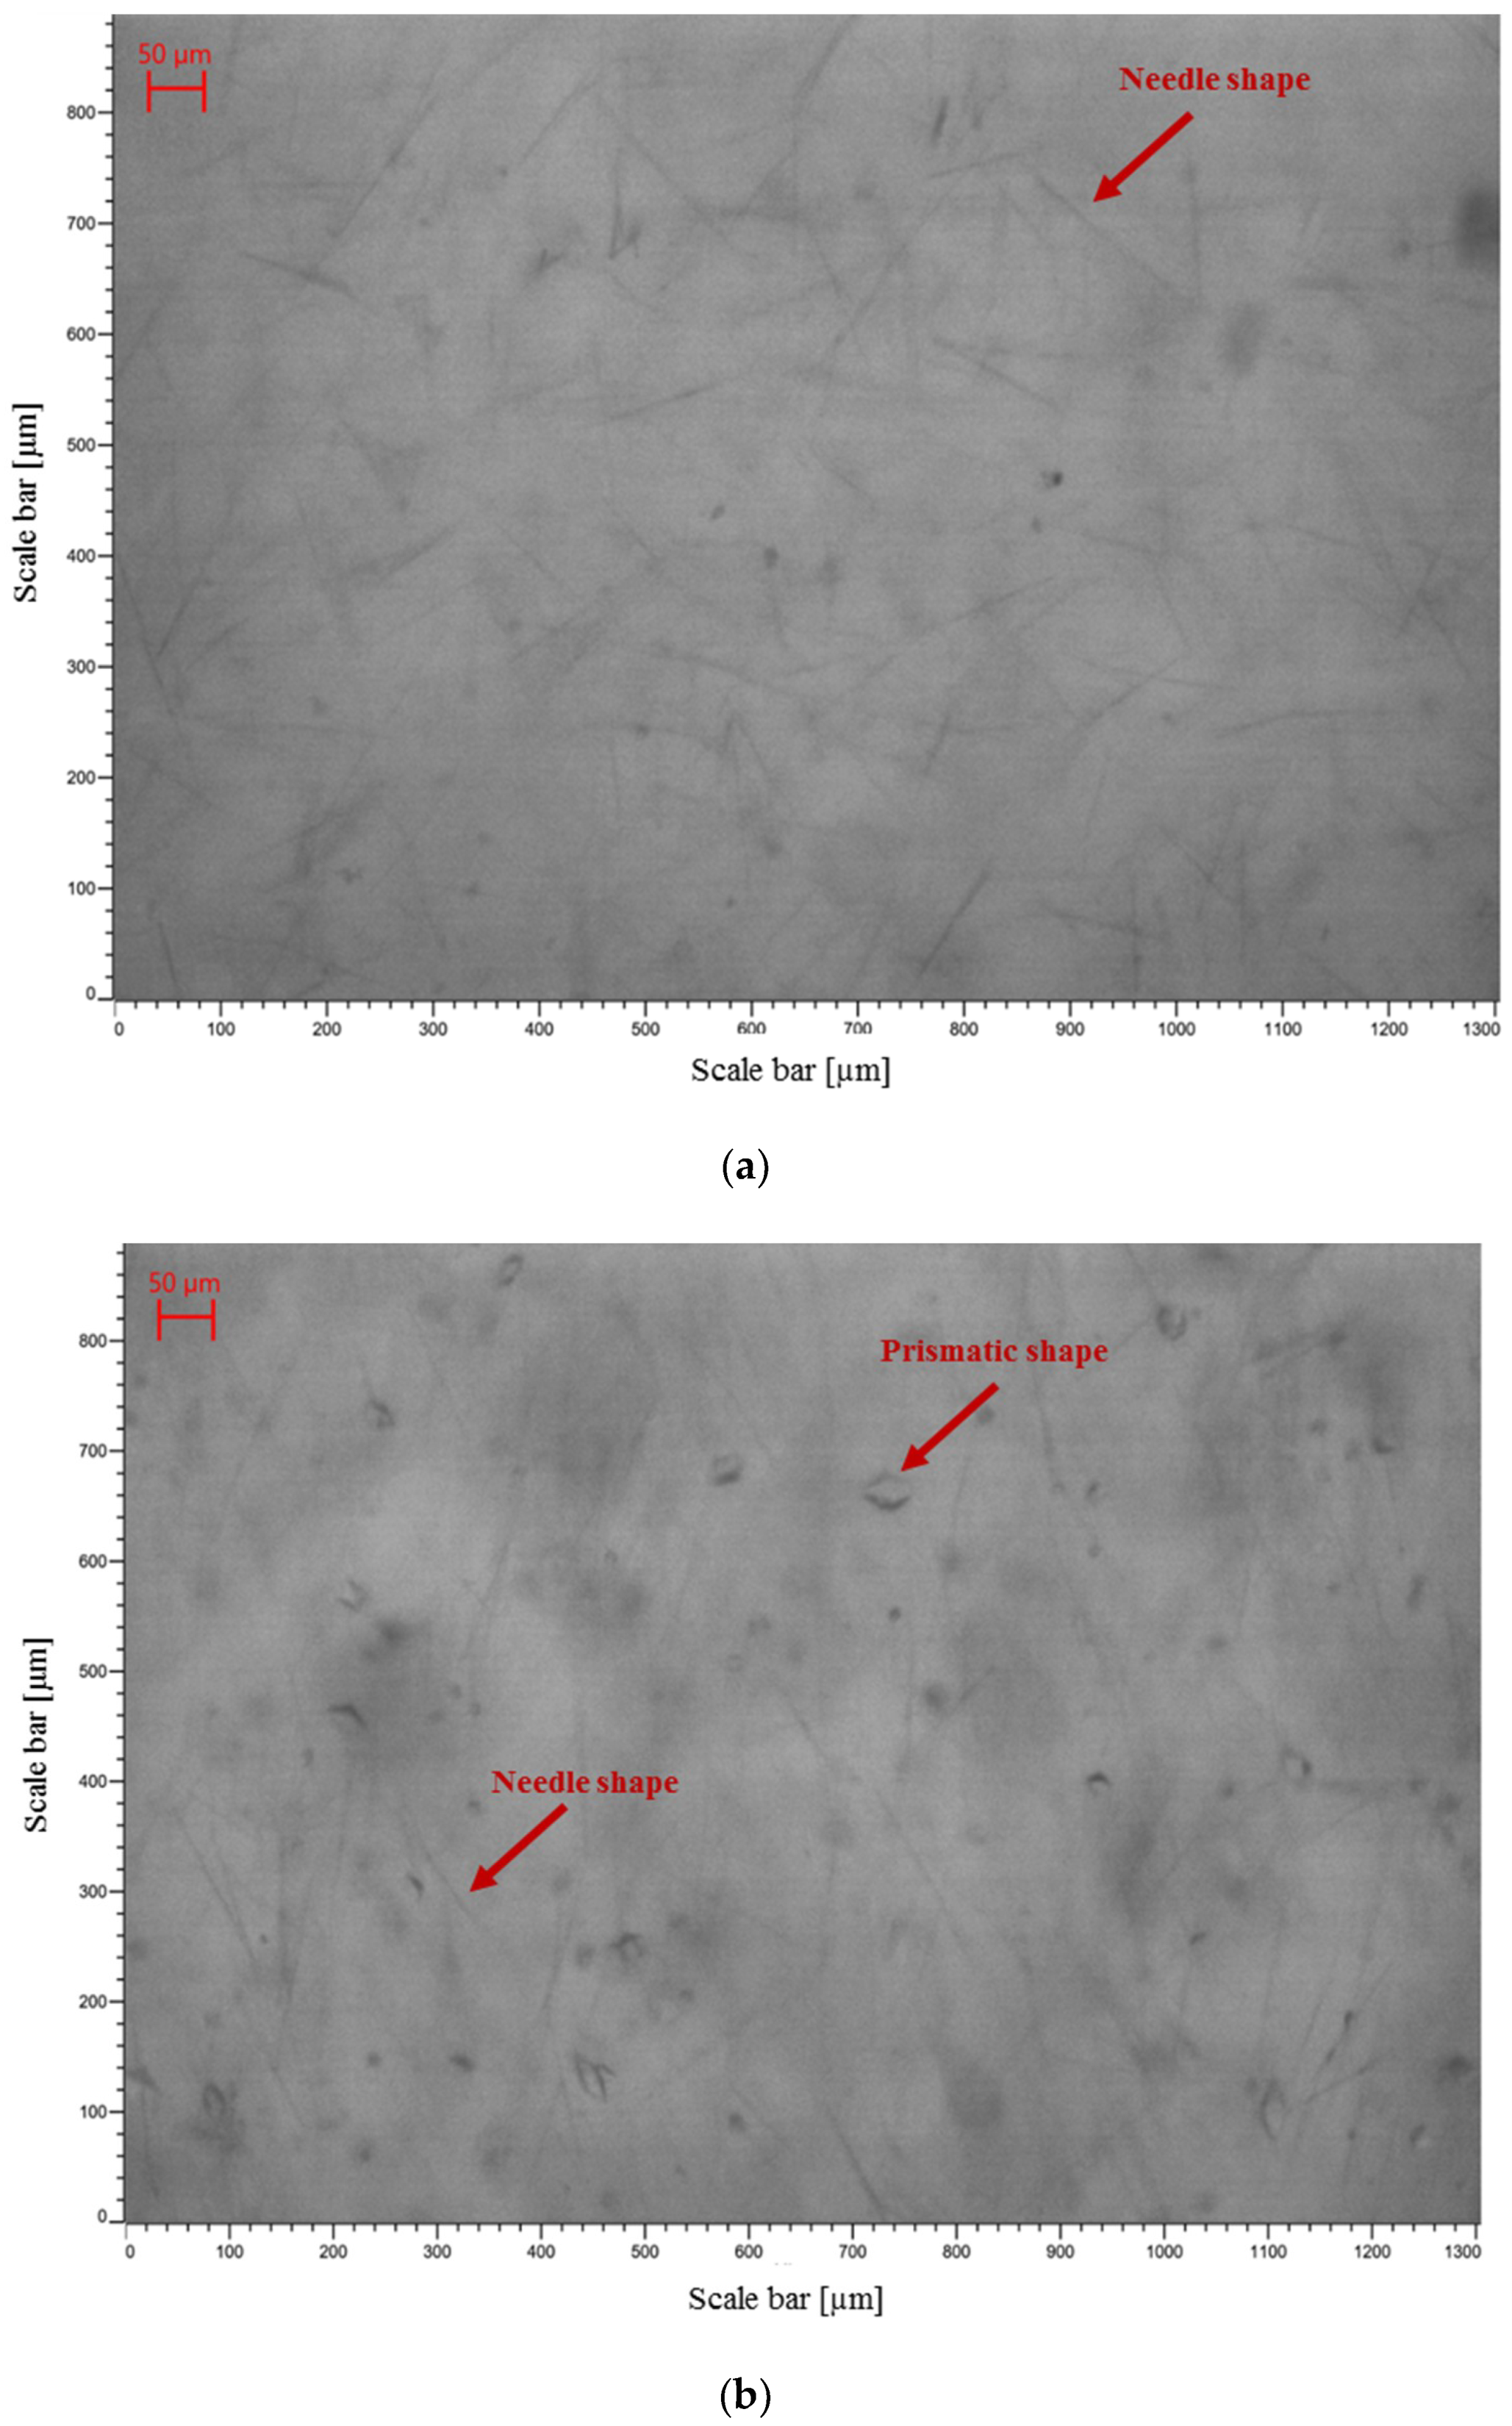
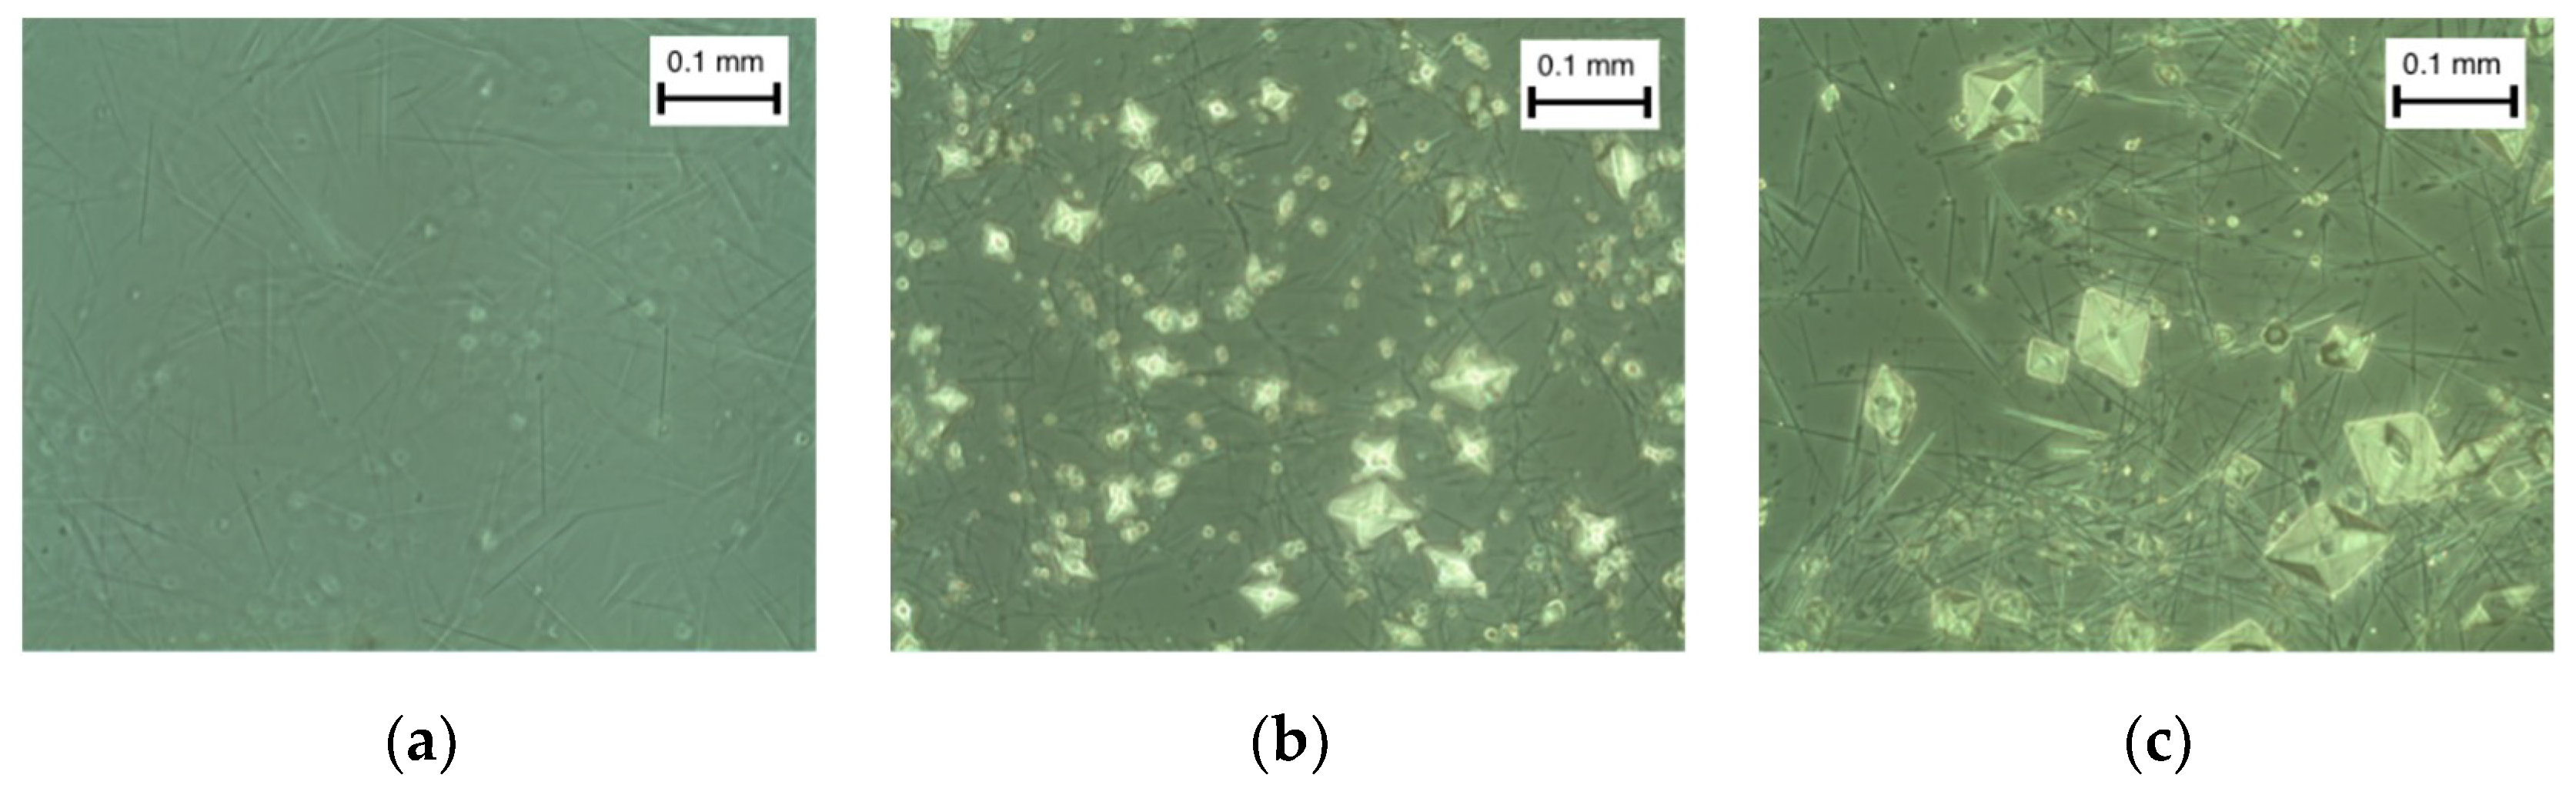
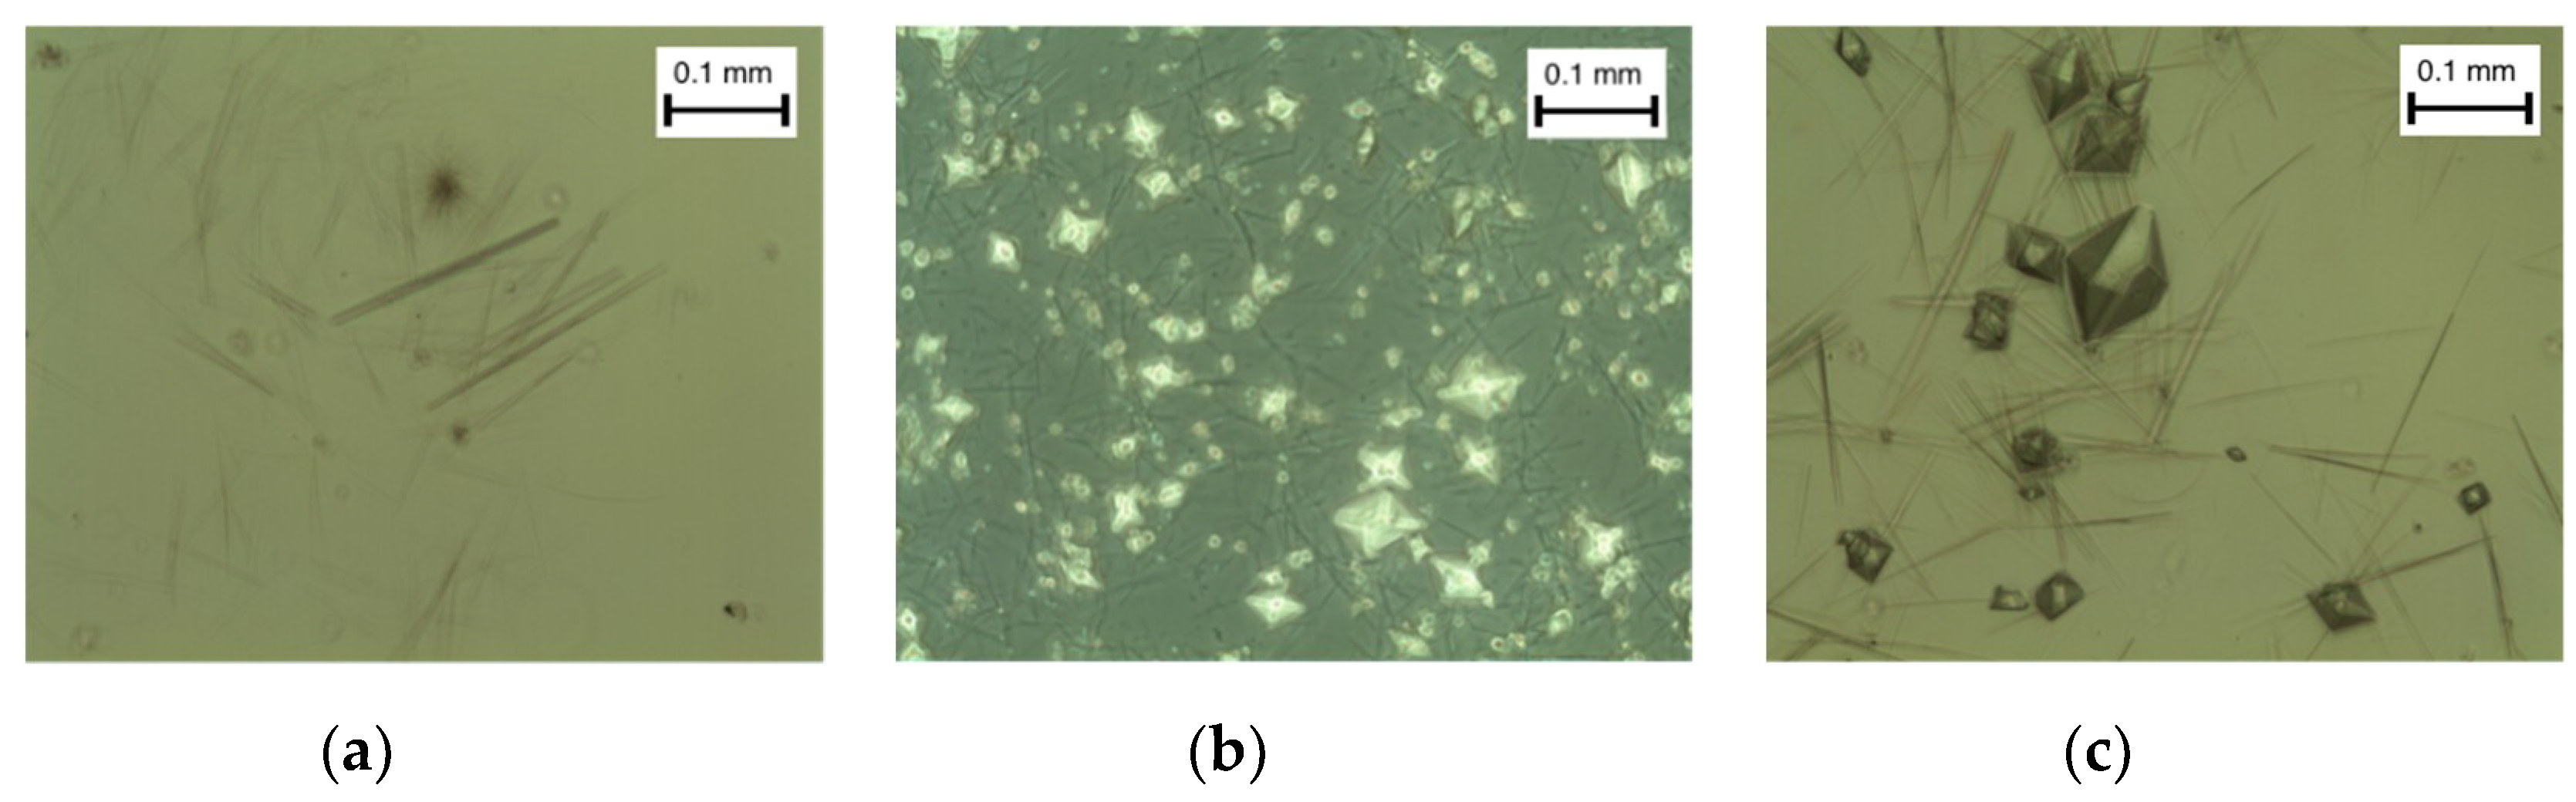
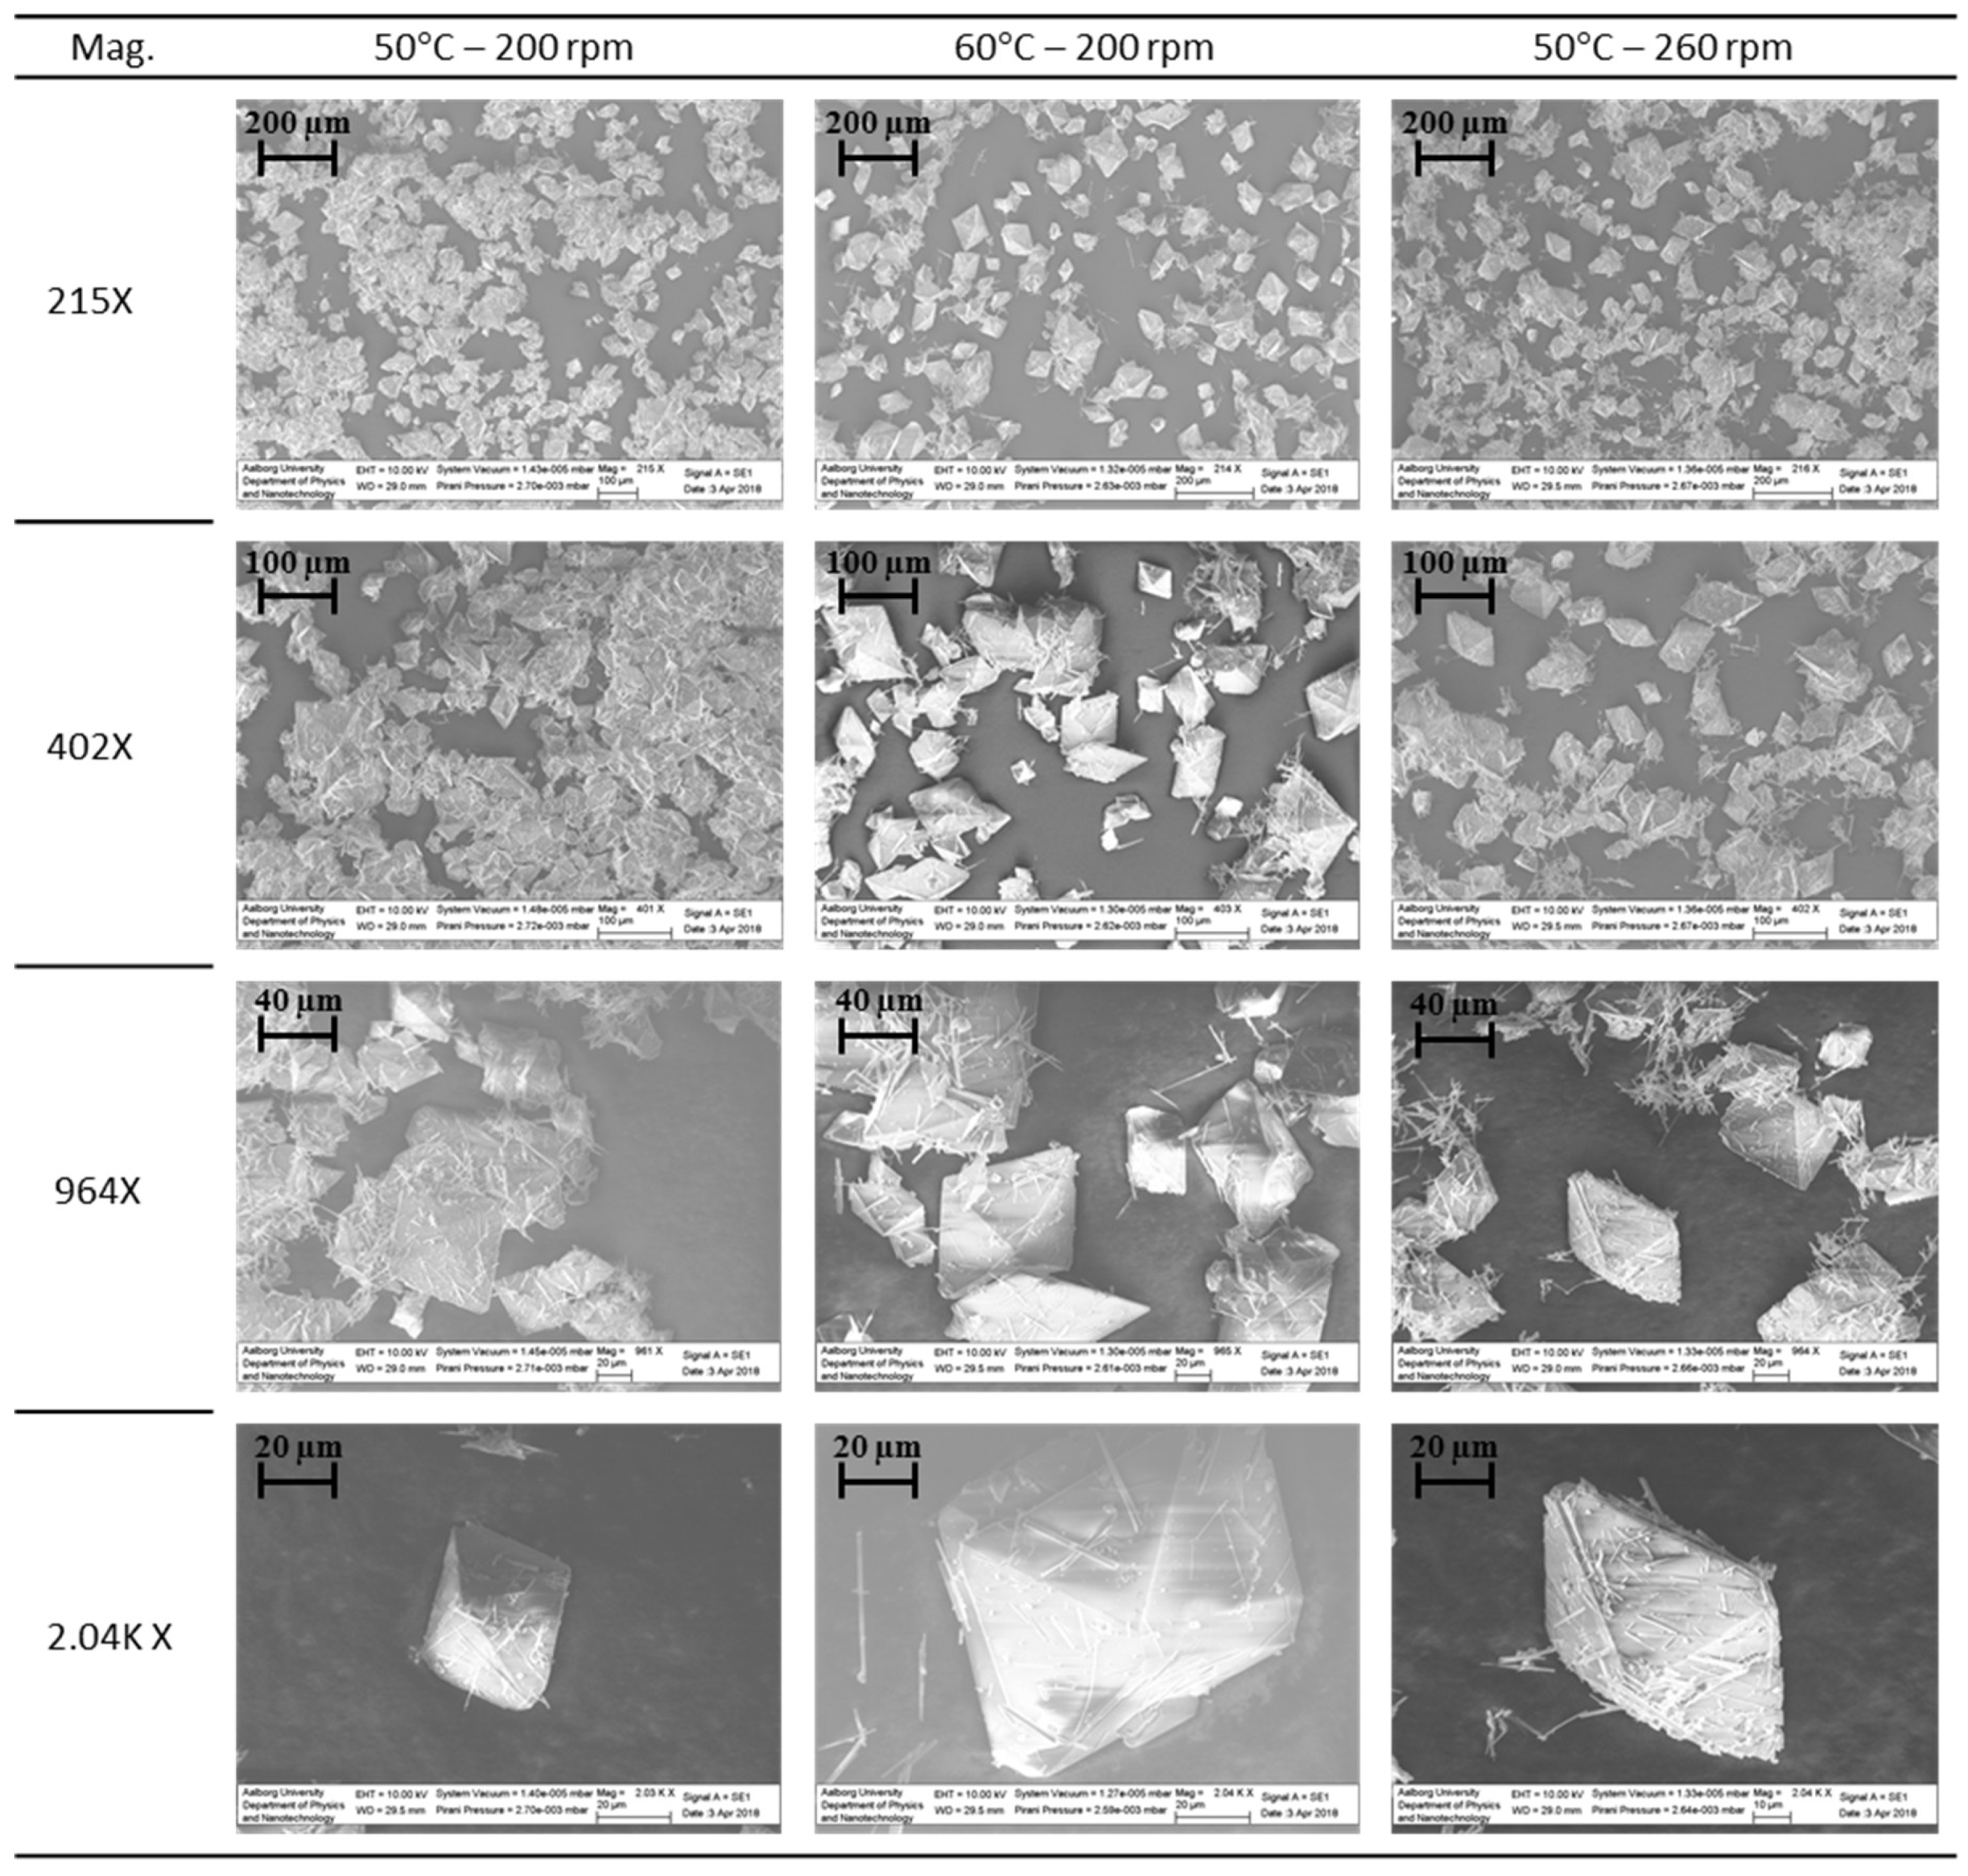
3.3.1. Crystal Morphology

The in-line PVM microscope showed two different structures precipitated in the feed tank. When 80–90% of the feed water was removed, needle-shaped crystals started to precipitate, followed by a precipitation of prismatic shaped crystals (Figure 5a,b, respectively). Both types of crystals were observed under all of the thermal and hydrodynamic conditions that were investigated, negating any correlation between the operating conditions and the type of crystals obtained. However, in all of the cases, needle-shaped crystals appeared before the prismatic crystals, perhaps due to the greater induction time of the latter compared to the former. The crystallization occurred fast when the precipitation point was reached; the needle-shaped structures grew especially faster. This could indicate that two different polymorph structures were precipitated. The same precipitation trend was observed in all of the experiments.
The obtained crystals were also analyzed by using an optical microscope. Images from the optical microscope showed that the size of the prismatic crystalline structures increased with the temperature (Figure 6). The experiment at the lowest feed temperature precipitated the smallest prismatic crystals (~0.01 mm), while 56 °C precipitated the largest prismatic crystals (~0.08 mm). The size of the needle-shaped crystals did not change significantly with temperature (length of ~0.1 mm). Moreover, the prismatic crystals increased in size with a decrease in the flow rate (Figure 7), but there was no clear tendency for the needle-shaped crystals. The experiments carried out at 47°C and 14.8 L/h produced larger prismatic crystals and needle-shaped crystals than the other experiments. The needle-shaped crystals in the experiment at 47 °C and 30.7 L/h were also larger than those in the other experiments, and only a few small prismatic crystals were formed. The experiment at 47 °C and 21.6 L/h showed both prismatic and needle-structured crystals, but the needle-shaped crystals were smaller compared to the other experiments when the flow rate was changed.
The images from SEM showed a sharp prismatic structure of the crystalline phases. Compared to the pictures from the optical microscope taken under wet conditions, the needle-shaped crystals decreased in amount. The SEM pictures at different magnifications can be seen in Figure 8. The same tendency of the crystal size was observed from the SEM images, i.e, an increasing size of the prismatic crystals with temperature, whereas no clear tendency was observed for the change in flow rate.
The crystalline phases from the previous described MD/MCr experiments were analyzed with XRD and ICP to determine the purity and composition of the crystals.

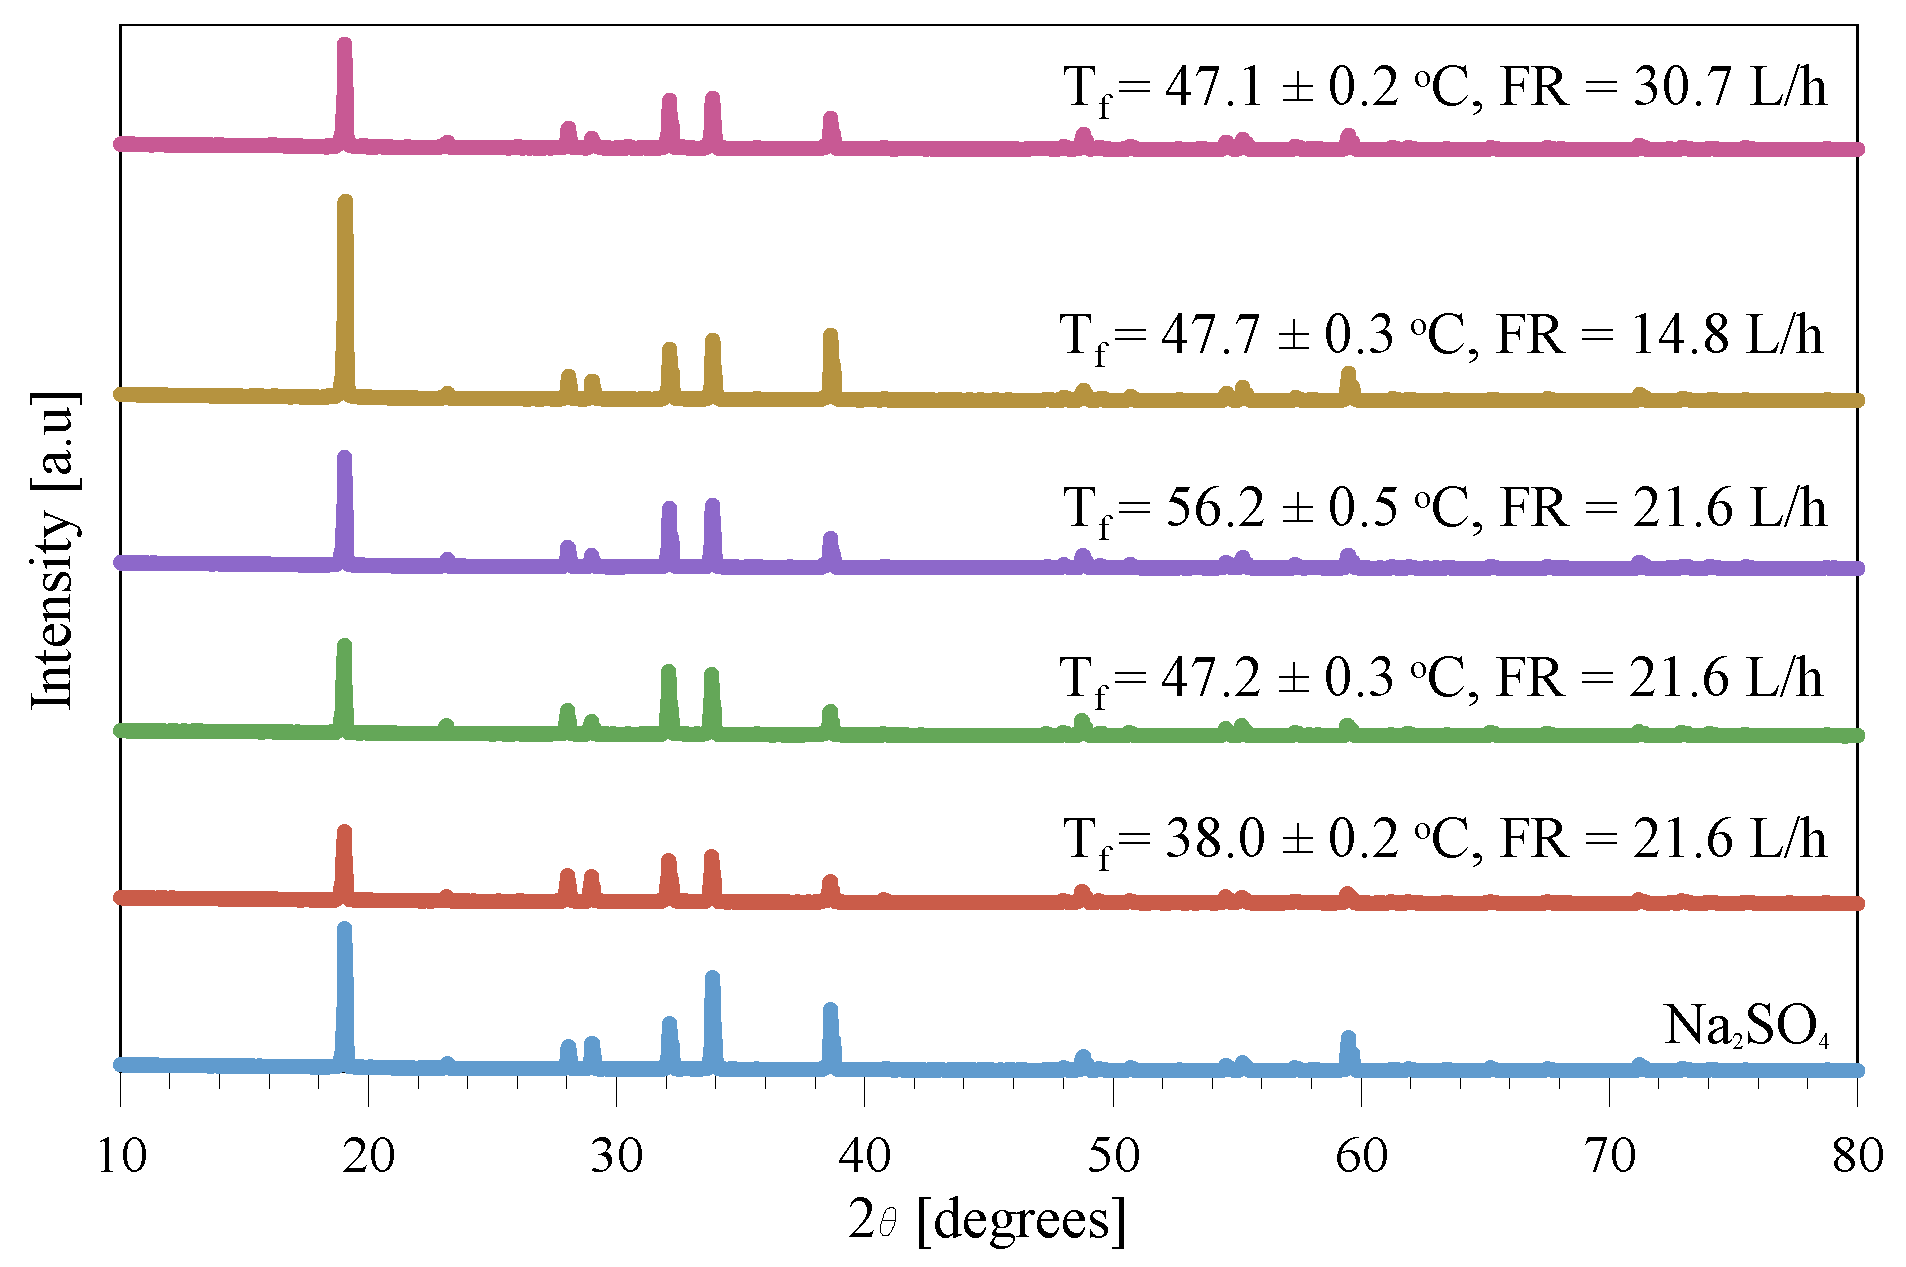
3.3.2. Identification and Purity of the Crystals

The XRD spectra showed that the crystalline phase that precipitated was Na2SO4. Equal crystalline peaks were also found in the literature [19,25] and in the XRD database by analyzing powdered pure Na2SO4 (Figure 9).
The crystalline phases that precipitated in the experiments were found to be Na2SO4, which can precipitate in the anhydrous form and as the hydrated forms, Na2SO4·10H2O (mirabilite) and Na2SO4·7H2O (heptahydrate) [25]. Na2SO4 anhydrous can precipitate in different polymorphs where five different phases have been identified (phase I, II, III, IV, and V) [26]. At room temperature, phase V is stable, while phase III is metastable. Phase I and II are high-temperature polymorphs (>270 °C and >225 °C) [27]. Phase IV is considered to be metastable, and the phase transition has not yet been well established [26]. The structure of Na2SO4 (III) and Na2SO4 (V) were found to be needle-shaped and prismatic/bipyramidal crystals by the evaporation of solution at 60°C [26], which corresponds to the structures found in this study. The needle-shaped and prismatic crystals obtained in the MD and MCr experiments were consistent with the Na2SO4 structures found in the literature [25], where the needles were said to be phase III, and the prisms were said to be phase V. The prismatic structure of Na2SO4 that was obtained in these experiments was described in the literature [28], and is said to be phase V. In previous studies on the membrane crystallization of sodium sulfate crystallization, other structures such as orthorhombic structures [20,29] or rectangular/circular crystals [18] were observed, which is slightly different from this study. This can be attributed to the differences in feed composition or operative conditions, which also highlights the potential of controlling polymorph structures by membrane crystallizers through changing operational parameters.
The purity of the Na2SO4 crystals was analyzed by ICP (Table 5). The largest percentage of cations in the crystalline structures was Na, which was expected due to the XRD results. The data showed that the crystalline structures contained small amounts of Fe, Mg, Mn, and P, which could indicate that residue wastewater remained with crystals after their separation from the mother liquid, or the possible co-crystallization of other minerals. Although Al was not detected in the supernatant; this was perhaps due to its quantity being below the detection limit of the instrument, which was eventually incorporated into crystal lattice.

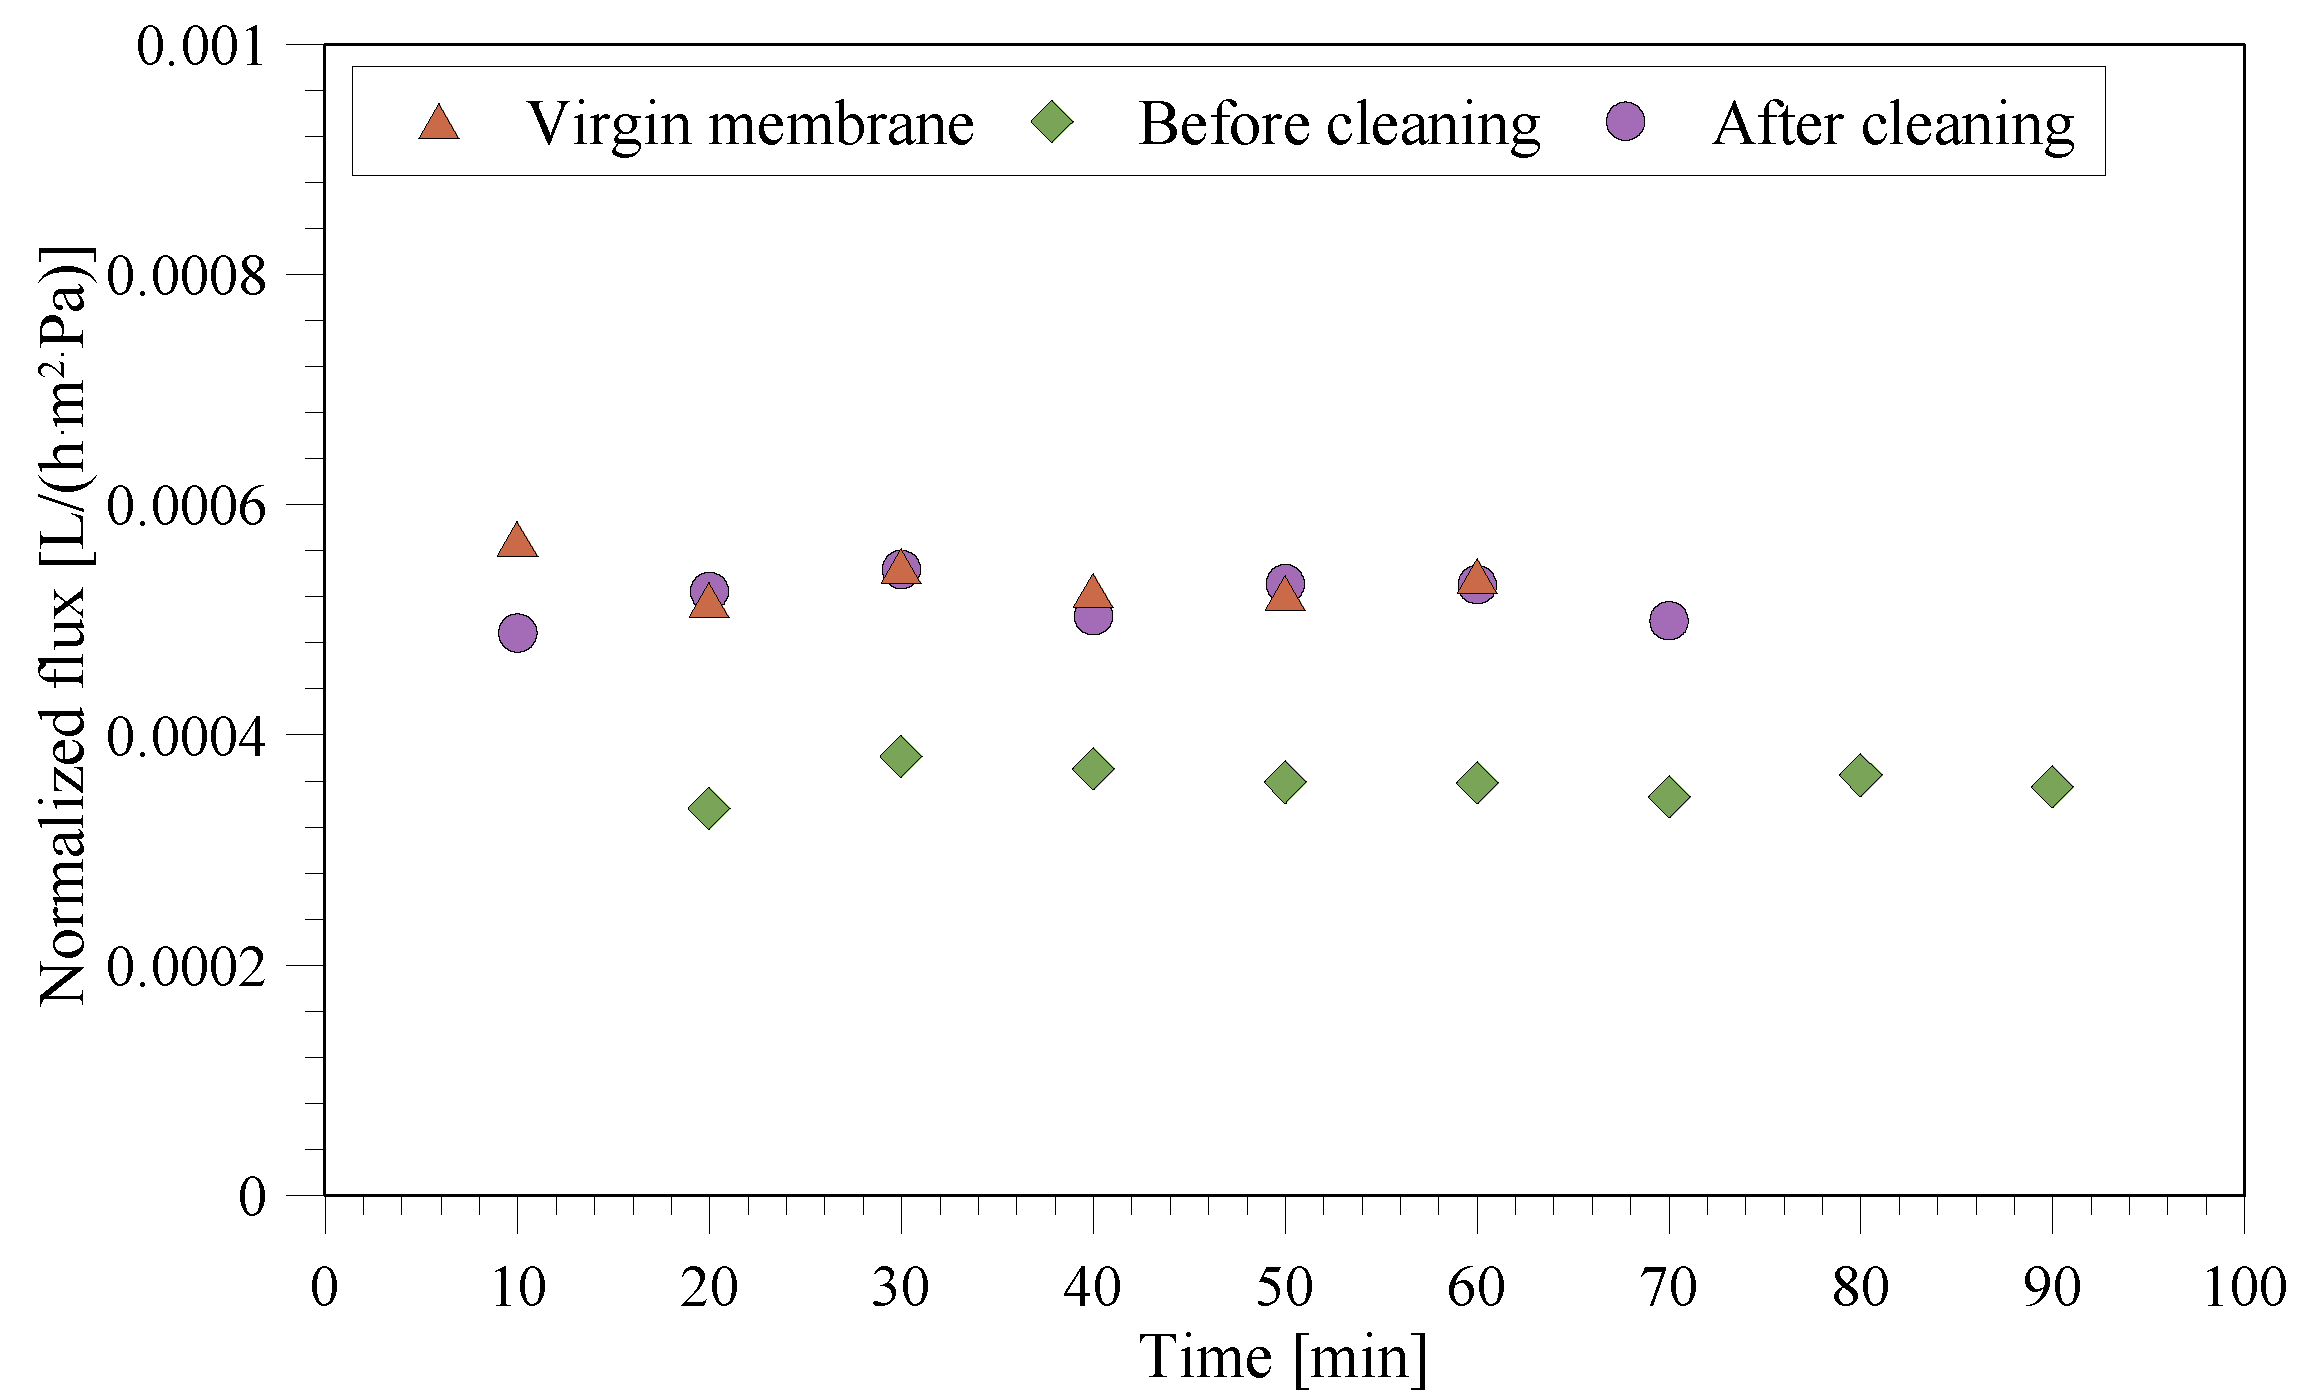
3.4. Fouling/Scaling Analysis

The normalized flux (flux divided with the corresponding driving force to flatten the effect of small temperature variations) obtained by using virgin and used (after and before cleaning) membranes has been shown in Figure 10. The mean values of normalized flux before and after cleaning was calculated to be 0.00036 LMH/Pa and 0.00052 LMH/Pa, where the latter is similar to the flux measured for the virgin membrane. These observations clearly indicate the buildup of scaling at the membrane surface during MCr tests. However, the recovery of flux after cleaning indicates that the scaling built-up during the test was reversible.

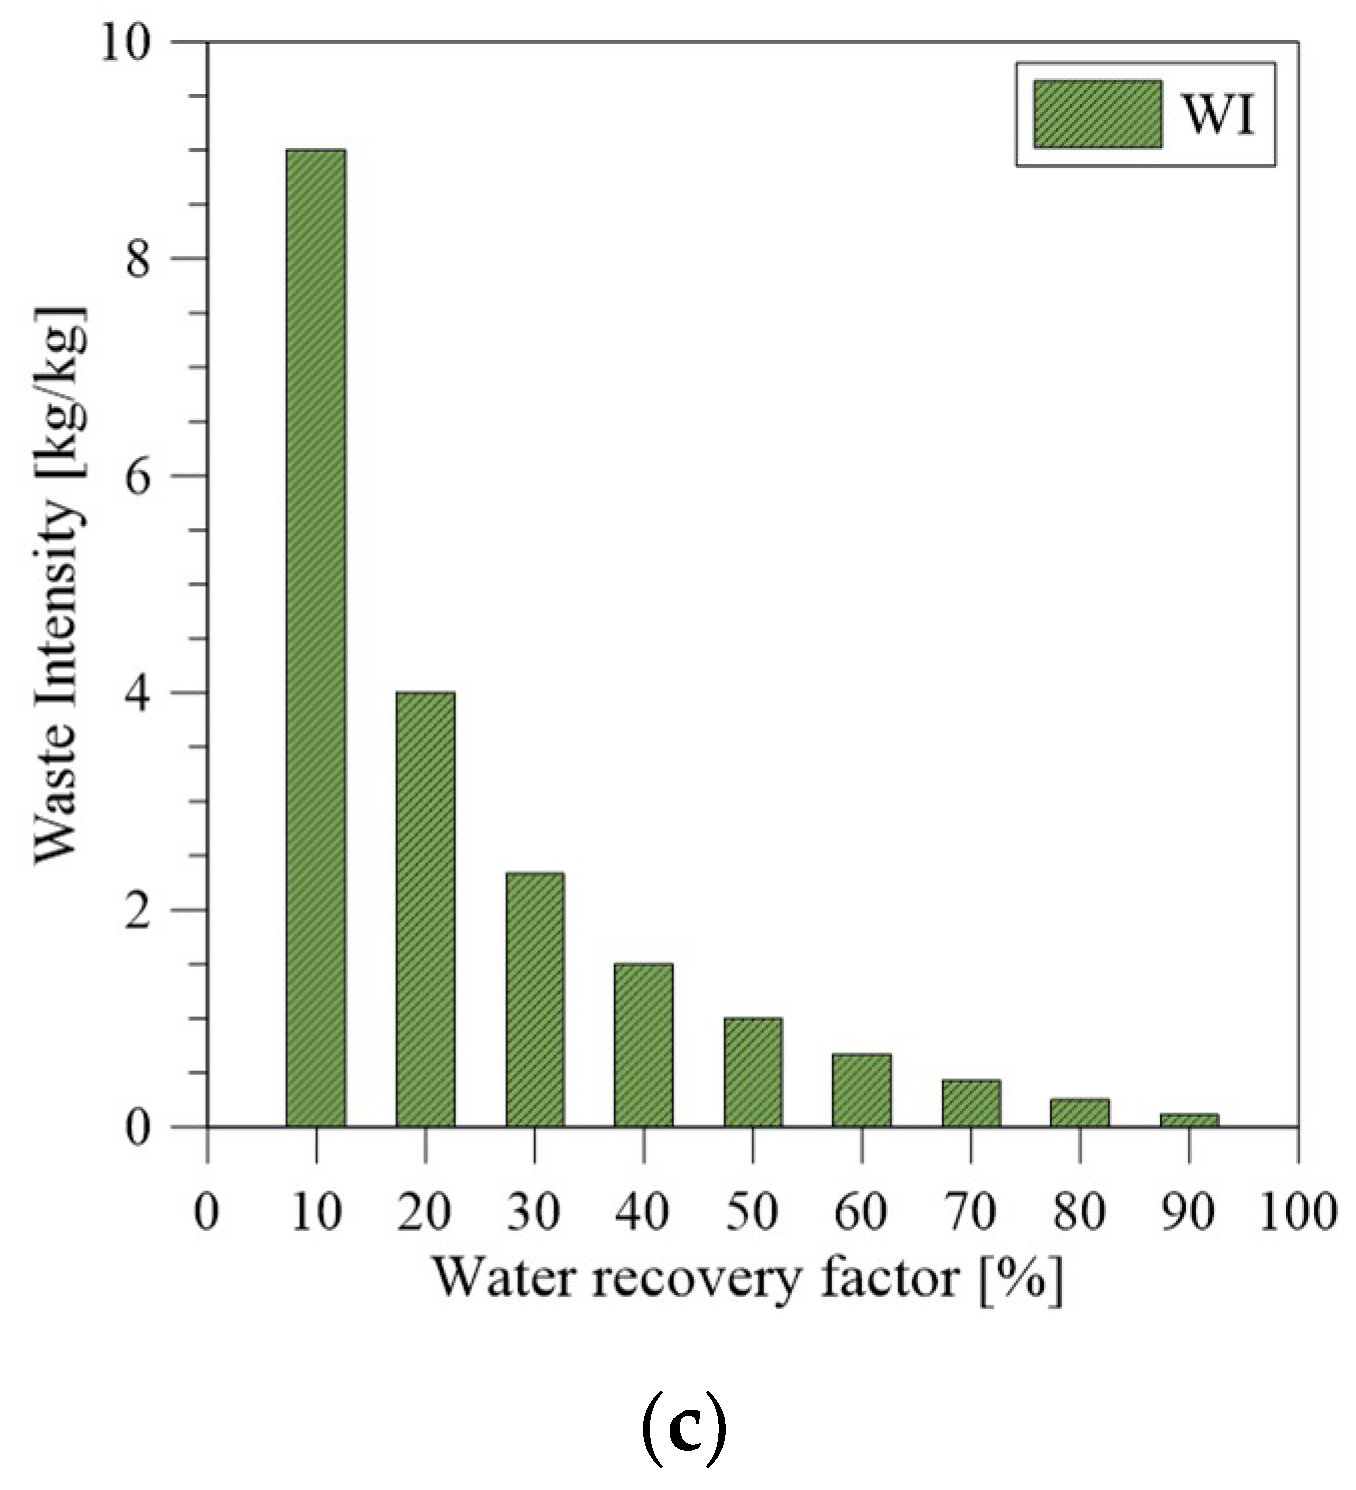
3.5. Weight, Size, and Waste Reduction Analysis

The footprints and weight of the system as a function of the feed inlet temperature have been shown in Figure 11a. The figure shows that the footprints of the MD/MCr unit reduce by almost 2.3 times by increasing the feed inlet temperature from 38 °C to 56 °C. Similarly, the weight of the unit drops down by more than 2.5 times by increasing the feed inlet temperature from 38 °C to 56 °C. These observations are due to increased flux at a high-feed inlet temperature (Figure 3a). High flux decreases the membrane area that is required to treat a particular volume of the wastewater; thus, the associated weight and footprint of the membrane unit reduce. Figure 11b reveals the same trend, where the P/W and P/S ratios increase with the feed inlet temperature due to the corresponding increase of productivity, which is defined as the product of flux and the corresponding membrane area of a given MD/MCr unit with the feed temperature. As shown in Figure 11c, the waste intensity approaches zero at the final freshwater recovery factor obtained in this study (approximately 90%), indicating that almost all of the wastewater has been converted into freshwater and some salt crystals, thus minimizing the wastewater volume to be disposed.

4. Conclusions

High-purity crystals and freshwater were simultaneously recovered from wastewater from the anodizing industry by applying MD/MCr. The applied membrane showed stable flux under all of the thermal and hydrodynamic conditions that were investigated. In all of the cases, more than 80% of the freshwater from the wastewater was recovered, thus significantly reducing the volume of the wastewater to be disposed. The high-quality water that was produced can be used in the anodizing process to avoid the failure of the bath chemistry, which might force the disposal of expensive solution. At the same time, sodium sulfate crystals were recovered, which can find applications within the anodizing process or elsewhere, thus adding value to the process. It was observed that two polymorphs (in needle and prism shapes) of sodium sulfate were precipitated. The relative proportion and size of the recovered crystalline phases depends upon the applied operating conditions. Overall, the MD/MCr unit was able to convert approximately 90% of the wastewater into products (freshwater and salt crystals). The footprints and weight of the MCr unit that were required for the wastewater treatment significantly decrease with the temperature of the feed solution. Thus, MD/MCr is a promising innovative solution to approach zero liquid discharge in the anodizing industry, while at the same time recovering high-quality freshwater and salt crystals.

Author Contributions

Conceptualization, A.A. and C.A.Q.-J.; methodology, A.A. and J.H.J.; validation, J.H.J., H.C.J. and C.A.Q.-J.; Formal analysis, H.C.J. and C.A.Q.-J.; investigation, A.A. and J.H.J.; writing—original draft preparation, A.A. and J.H.J.; writing—review and editing, A.A., M.L.C. and C.A.Q.-J.; visualization, A.A. and C.A.Q.-J.; supervision, M.L.C. and C.A.Q.-J.; project administration, C.A.Q.-J.

Funding

This research received no external funding.

Acknowledgments

The Danish Anodizing Industry (DAI) is greatly acknowledge for providing the wastewater.

Conflicts of Interest

The authors declare no conflict of interest.

References

  1. Stevenson, M.F. Anodizing. In ASM Handbook; ASM Press: Washington, DC, USA, 1994; Volume 5, pp. 482–493. [Google Scholar]
  2. Patrick, G.; McCune, L. Aluminium Anodizer Implements Zero Liquid Discharge. Products Finishing. 2016. Available online: http://www.pfonline.com/articles/aluminum-anodizer-implements-zero-liquid-discharge (accessed on 14 October 2018).
  3. Amer, S. Treating Metal Finishing Wastewater; AQUACHEM INC.: Denver, CO, USA, 1998; pp. 1–7. [Google Scholar]
  4. CIE Waste Water Treatment & Zero Liquid Discharge Plants. Available online: http://www.cieeng.com/site/new/industries/aluminum/extrusion/ (accessed on 14 October 2018).
  5. Pramanik, B.K.; Thangavadivel, K.; Shu, L.; Jegatheesan, V. A critical review of membrane crystallization for the purification of water and recovery of minerals. Rev. Environ. Sci. Biotechnol. 2016, 15, 411–439. [Google Scholar] [CrossRef]
  6. Drioli, E.; Ali, A.; Macedonio, F. Membrane distillation: Recent developments and perspectives. Desalination 2015, 356, 56–84. [Google Scholar] [CrossRef]
  7. Lawson, K.W.; Lloyd, D.R. Membrane distillation. J. Membr. Sci. 1997, 124, 1–25. [Google Scholar] [CrossRef]
  8. Ali, A.; Quist-Jensen, C.A.; Drioli, E.; Macedonio, F. Evaluation of integrated microfiltration and membrane distillation/crystallization processes for produced water treatment. Desalination 2018, 434, 161–168. [Google Scholar] [CrossRef]
  9. Criscuoli, A.; Drioli, E. New Metrics for Evaluating the Performance of Membrane Operations in the Logic of Process Intensification. Ind. Eng. Chem. Res. 2007, 46, 2268–2271. [Google Scholar] [CrossRef]
  10. Ali, A.; Quist-jensen, C.A.; Macedonio, F.; Drioli, E. Application of Membrane Crystallization for Minerals’ Recovery from Produced Water. Membranes (Basel) 2015, 5, 772–792. [Google Scholar] [CrossRef] [PubMed] [Green Version]
  11. Quist-Jensen, C.A.; Macedonio, F.; Conidi, C.; Cassano, A.; Aljlil, S.; Alharbi, O.A.; Drioli, E. Direct contact membrane distillation for the concentration of clarified orange juice. J. Food Eng. 2016, 187, 37–43. [Google Scholar] [CrossRef]
  12. Shirazi, M.M.A.; Kargari, A. A Review on Applications of Membrane Distillation (MD) Process for Wastewater Treatment. J. Membr. Sci. Res. 2015, 1, 101–112. [Google Scholar]
  13. Khayet, M. Membranes and theoretical modeling of membrane distillation: A review. Adv. Colloid Interface Sci. 2011, 164, 56–88. [Google Scholar] [CrossRef]
  14. Quist-Jensen, C.A.; Sørensen, J.M.; Svenstrup, A.; Scarpa, L.; Carlsen, T.S.; Jensen, H.C.; Wybrandt, L.; Christensen, M.L. Membrane crystallization for phosphorus recovery and ammonia stripping from reject water from sludge dewatering process. Desalination 2018, 440, 156–160. [Google Scholar] [CrossRef]
  15. Lu, D.; Li, P.; Xiao, W.; He, G.; Jiang, X. Simultaneous Recovery and Crystallization Control of Saline Organic Wastewater by Membrane Distillation Crystallization. AIChE J. 2017, 63, 2187–2197. [Google Scholar] [CrossRef]
  16. Quist-Jensen, C.A.; Macedonio, F.; Drioli, E. Integrated membrane desalination systems with membrane crystallization units for resource recovery: A new approach for mining from the sea. Crystals 2016, 6, 36. [Google Scholar] [CrossRef]
  17. Ji, X.; Curcio, E.; Al Obaidani, S.; Di Profio, G.; Fontananova, E.; Drioli, E. Membrane distillation-crystallization of seawater reverse osmosis brines. Sep. Purif. Technol. 2010, 71, 76–82. [Google Scholar] [CrossRef]
  18. Li, W.; Van der Bruggen, B.; Luis, P. Integration of reverse osmosis and membrane crystallization for sodium sulphate recovery. Chem. Eng. Process. Process Intensif. 2014, 85, 57–68. [Google Scholar] [CrossRef]
  19. Curcio, E.; Ji, X.; Matin, A.; Barghi, S.; Di, G.; Fontananova, E.; Macleod, T.; Drioli, E. Hybrid nanofiltration-membrane crystallization system for the treatment of sulfate wastes. J. Membr. Sci. 2010, 360, 493–498. [Google Scholar] [CrossRef]
  20. Quist-Jensen, C.A.; Macedonio, F.; Horbez, D.; Drioli, E. Reclamation of sodium sulfate from industrial wastewater by using membrane distillation and membrane crystallization. Desalination 2017, 401, 112–119. [Google Scholar] [CrossRef]
  21. Ali, A.; Quist-Jensen, C.A.; Macedonio, F.; Drioli, E. Optimization of module length for continuous direct contact membrane distillation process. Chem. Eng. Process. Process Intensif. 2016, 110, 188–200. [Google Scholar] [CrossRef]
  22. Gill, W.N.; Wiley, D.E.; Fell, C.J.D.; Fane, A.G. Effect of viscosity on concentration polarization in ultrafiltration. AIChE J. 1988, 34, 1563–1567. [Google Scholar] [CrossRef]
  23. Ali, A.; Tsai, J.-H.; Tung, K.-L.; Drioli, E. On designing and optimization of continuous direct contact membrane distillation process. Desalination 2018, 426, 97–107. [Google Scholar] [CrossRef]
  24. Ali, A.; Quist-Jensen, C.A.; Macedonio, F.; Drioli, E. On designing of membrane thickness and thermal conductivity for large scale membrane distillation modules. J. Membr. Sci. Res. 2016, 2, 179–185. [Google Scholar]
  25. Rodriguez-Navarro, C.; Doehne, E.; Sebastian, E. How does sodium sulfate crystallize? Implications for the decay and testing of building materials. Cem. Concr. Res. 2000, 30, 1527–1534. [Google Scholar] [CrossRef] [Green Version]
  26. Naruse, H.; Tanaka, K.; Morikawa, H.; Marumo, F.; Mehrotra, B.N. Structure of Na2SO4 (I) at 693 K. Acta Crystallogr. Sect. B Struct. Sci. 1987, 43, 143–146. [Google Scholar] [CrossRef]
  27. Eyser, W.; Components, T. Grystal Ghemistry of the System NarSOn-KrSOn-KrCrOn-Na,CrOn and of the Glaserite Phase. Am. Mineral. 1973, 58, 736–747. [Google Scholar]
  28. Rasmussen, S.E.; Jørgensen, J.E.; Lundtoft, B. Structures and Phase Transitions of Na2SO4. J. Appl. Crystallogr. 1996, 29, 42–47. [Google Scholar] [CrossRef]
  29. Bouchrit, R.; Boubakri, A.; Mosbahi, T.; Hafiane, A.; Bouguecha, S.A.T. Membrane crystallization for mineral recovery from saline solution: Study case Na2SO4 crystals. Desalination 2017, 412, 1–12. [Google Scholar] [CrossRef]
Figure 1. Membrane distillation and crystallization setup used in the experiments.
Applsci 09 00287 g001
Figure 2. Flux as a function of time for clean water. (a) At different feed temperatures, all with flow rate of 21.6 L/h, (b) at different flow rates for a feed temperatures of 56.9 ± 0.1 °C and 56.4 ± 0.2 °C for 14.8 L/h and 21.6 L/h, respectively.
Applsci 09 00287 g002
Figure 3. (a) Flux and (b) conductivity of permeate as a function of water recovery factor at different feed temperatures, and a flow rate of 21.6 L/h.
Applsci 09 00287 g003
Figure 4. (a) Flux and (b) conductivity of permeate as a function of recovery factor for the experiment conducted at 14.8 L/h, 21.6 L/h, and 30.7 L/h and feed temperatures of 47.7 ± 0.3 °C, 47.2 ± 0.3 °C, and 47.1 ± 0.2 °C, respectively.
Applsci 09 00287 g004
Figure 5. Pictures from an in-line PVM 19 microscope from experiment conducted at 56 °C and 21.6 L/h. (a) Needle-shaped crystalline structures, (b) needle and prismatic-shaped crystalline structures.
Applsci 09 00287 g005
Figure 6. Optical microscope images of the crystals precipitated in experiments carried out at a flow rate of 21.6 L/h. Magnification 10×. (a) 38 °C, (b) 47 °C, (c) 56 °C.
Applsci 09 00287 g006
Figure 7. Optical microscope images of the precipitated crystals in an experiment carried out at a feed temperature of 47 °C and flow rates of (a) 14.8 L/h, (b) 21.6 L/h, and (c) 30.7 L/h. Magnification in all of the cases was 1×.
Applsci 09 00287 g007
Figure 8. SEM pictures of the crystals at different magnifications for the membrane distillation/crystallization (MD/MCr) experiments conducted at different operating conductions.
Applsci 09 00287 g008
Figure 9. XRD spectra of the crystalline phases precipitated in the MD and MCr experiments. XRD of pure Na2SO4 was also made (blue curve).
Applsci 09 00287 g009
Figure 10. Normalized flux for virgin and used (before and after cleaning) membrane.
Applsci 09 00287 g010
Figure 11. Based on a plant with capacity of 270 kg/h, weight module = 16 kg, area module = 34 m2. (a) Footprint and weight, (b) P/S and P/W, (c) waste intensity.
Applsci 09 00287 g011aApplsci 09 00287 g011b
Table 1. Characteristics of wastewater solution before centrifugation.
pH7.36
Redox potential [mV]102
Conductivity [mS/cm]37.61
Dry matter [g/L]64.4 ± 0.4
Inorganic matter [%]88.7
Organic matter [%]11.3
Table 2. Composition of supernatant after centrifugation of the wastewater.
Supernatant [mg/L]
Dry matter [g/L]43.3
Inorganic matter [%]97.9
Organic matter [%]2.1
Conductivity [ms/cm]39
Mn2+3.648
Fe2+6
Mg2+7.813
P3−90
Na+2302
SO42− 18990
Table 3. Description of membrane and membrane module used in membrane distillation/crystallization (MD/MCr) experiments.
MaterialPolypropylene
TypeHollow fiber
No. of fibers19
Length of fibers (cm)42
Inner fiber diameter (mm)1.8
Outer fiber diameter (mm)2.7
Membrane thickness (mm)0.45
Average pore size (μm)0.2
Porosity (%)73
Surface area (cm2)45.1
Table 4. Maximum concentration of ions in the permeate at the end of experiments. The initial concentration was below the detection limit.
Concentration [mg/L]
Mn2+0.0043
Mg2+0.076
P3−0.0367
Na+16.6
Table 5. Content [%] of cations in crystalline phases. Not detected (nd).
ExperimentAlFeMgMnNaP
47 °C-21.6 L/hndnd0.000420.002128.47nd
56 °C-21.6 L/h0.065nd0.02330.003232.840.0053
38 °C-21.6 L/h0.0120.000050.0160.002326.210.0048
47 °C-30.7 L/h0.00320.00080.0150.002630.530.0028
47 °C-14.8 L/h0.1460.00270.0450.005923.32nd

