Analysis of the Moment Method and the Discrete Velocity Method in Modeling Non-Equilibrium Rarefied Gas Flows: A Comparative Study

1
School of Astronautics, Northwestern Polytechnical University, Xi’an 710072, China
2
School of Computer, National University of Defense Technology, Changsha 410073, China
*
Author to whom correspondence should be addressed.
Appl. Sci. 2019, 9(13), 2733; https://doi.org/10.3390/app9132733
Submission received: 23 May 2019
/
Revised: 29 June 2019
/
Accepted: 3 July 2019
/
Published: 5 July 2019
(This article belongs to the Special Issue Heat and Mass Transfer: Fundamentals and Applications in Thermal Energy)
Abstract
:In the present study, the performance of the moment method, in terms of accuracy and computational efficiency, was evaluated at both the macro- and microscopic levels. Three different types of non-equilibrium gas flows, including the force-driven Poiseuille flow, lid-driven and thermally induced cavity flows, were simulated in the slip and transition regimes. Choosing the flow fields obtained from the Boltzmann model equation as the benchmark, the accuracy and validation of Navier–Stokes–Fourier (NSF), regularized 13 (R13) and regularized 26 (R26) equations were explored at the macroscopic level. Meanwhile, we reconstructed the velocity distribution functions (VDFs) using the Hermite polynomials with different-order of molecular velocity moments, and compared them with the Boltzmann solutions at the microscopic level. Moreover, we developed a kinetic criterion to indirectly assess the errors of the reconstructed VDFs. The results have shown that the R13 and R26 moment methods can be faithfully used for non-equilibrium rarefied gas flows in the slip and transition regimes. However, as indicated from the thermally induced case, all of the reconstructed VDFs are still very close to the equilibrium state, and none of them can reproduce the accurate VDF profile when the Knudsen number is above 0.5.
1. Introduction
Due to the rapid development of micro-electro-mechanical systems (MEMS) [1,2] and the shale gas revolution in North America [3], extensive works have been devoted to constructing accurate physical models and efficient numerical methods for non-equilibrium gas flows [4,5]. In general, the behavior of such non-equilibrium gas flows can be described from either the microscopic or macroscopic points of view.
The Boltzmann equation is the fundamental equation for the dynamics of rarefied gases at the microscopic level, which uses a molecular velocity distribution function to describe the system state. Historically, there are two mainly categories of approaches to solve the Boltzmann equation. One is based on the probabilistic approach, well-known examples are the direct simulation Monte Carlo (DSMC) methods developed by Brid and Nanbu [6,7]. DSMC method is an excellent approach for solving high-speed rarefied gas flows, however, it becomes time-consuming if the flow is in the slip- and transition-flow regimes. Another one is based on the deterministic approach, well-known examples are the discrete velocity methods (DVMs) [8], which use a finite set of discrete velocity points to approximate the continuous molecular velocity space. In the past two decades, most of the deterministic numerical methods are developed based on the DVM. Many full Boltzmann solvers, especially the Fourier spectral methods [9,10] and fast-spectral methods [11,12,13,14], provide accurate numerical results, which can serve as reference solutions. However, the structure of the collision operator in the full Boltzmann solver is rather complicated: It is a fivefold integral with three dimensions in velocity space and two dimensions in a unit sphere. Therefore, the Boltzmann equation is usually replaced by simplified kinetic model equations, such as the Bathnagar–Gross–Krook (BGK) [15], ES-BGK [16], and Shakhov [17] models. And most of DVMs are developed for these Boltzmann model equations. Among those DVM solvers, the gas-kinetic unified algorithm was developed and applied to study the hypersonic flows around spacecraft re-entry problems [18,19]. The asymptotic preserving schemes, especially the unified gas-kinetic scheme (UGKS) [20,21] and the discrete unified gas-kinetic scheme [22,23], are proposed for problems involving different flow regimes. The performance of the discrete unified gas kinetic scheme and traditional Godunov DVM, in terms of accuracy and efficiency, has been evaluated with a wide range of Knudsen numbers [24]. Most recently, the unified gas-kinetic wave-particle method was developed under the UGKS framework, in which the evolution of simulation particles and distribution function was guided by evolution of macroscopic variables [25,26]. Even though great effort has been devoted to reducing the computational cost in solving the Boltzmann equation, the multi-dimensional nature of the VDF and the complicated structure of the nonlinear collision term still make the Boltzmann equation impractical for many applications. Therefore, alternative macroscopic modeling and simulation strategies for rarefied gas flows have been developed [27].
The most classical macroscopic equations for rarefied flows are the Navier–Stokes–Fourier (NSF) equations in association with the velocity-slip and temperature-jump wall boundary conditions. This set of equations has found a wide range of applications in most of today’s industrial problems where the Knudsen number Kn, i.e., the ratio of the mean free path of gas molecules to the characteristic flow length [27], is less than 10−1. However, additional efforts are required as the Knudsen number increases, and many macroscopic equations are proposed to describe the rarefied gas dynamics beyond the Navier–Stokes level. Chapman and Enskog proposed a technique via a formal asymptotic expansion of the molecular VDF in powers of the Knudsen number [28,29]. By truncating the Chapman–Enskog (CE) expansion into different orders, the approach leads to respectively the Euler, NS, Burnett, and super-Burnett equations at the zeroth-, first-, second-, and third-order approximations [30]. However, Karlin and Gorban have pointed out that the Burnett equations violate the underlying physics behind the Boltzmann equation [31], and Wu has argued that as the order of Chapman–Enskog expansion increases, the accuracy of the obtained macroscopic equations does not necessary increase [32].
In 1949, Grad proposed a new way to derive the macroscopic equations via the method of moment [33,34]. Unlike the CE expansion in which the molecular VDF is expanded in powers of the Knudsen number, Grad expanded the molecular VDF in Hermite polynomials [35]. In addition to the mass, momentum, and energy conservation laws, the governing equations for the shear stress and heat flux were obtained by multiplying the moment of the peculiar velocity with the Boltzmann equation and integrating over the velocity space . This set of equations is called G13 moment equations, which can be closed by expanding the VDF into the Hermite polynomials [23,24]. Struchtrup and Torrilhon [36,37] and Struchtrup [27] regularized the G13 moment equations (denoted as the R13 moment equations) by applying a CE-like expansion and an order-of magnitude approach. Gu and Emerson [38] and Struchtrup and Torrilhon [37,39] obtained the wall boundary conditions (WBCs) for the regularized 13 moment equations (R13) based on the Maxwell’s kinetic WBC [40]. The capability of the R13 moment equations in modeling microscale gas phenomena have been investigated [41], and the R13 moment method can capture the non-equilibrium effects with the Knudsen number up to 0.25 [41,42]. However, they cannot provide sufficient accurate description of the Knudsen layer [43,44]. To remedy the deficiency of the R13 equations, Gu and Emerson extended the theory of moment to regularized 26 (R26) equations [42], which is demonstrated as a potential engineering design tool for the non-equilibrium flows in the early transition regime [45,46,47,48,49].
The R26 moment equations have been successfully applied in the study of pressure driven Poiseuille flow [42,45], thermal transpiration flow [46], gas flows in porous media [47,48] and non-equilibrium rarefied flow past a circular cylinder [49]. However, a detailed comparative study between the moment method and the DVM, in terms of the accuracy and efficiency, at both the microscopic and macroscopic levels, remains relatively scarce in the literature. Therefore, the purpose of this paper is to give a detailed comparison of the moment methods and the discrete velocity method and provide essential information for users to choose the appropriate one for applications.
The remaining part of this paper is organized as follows. We first make an overview of the Boltzmann model equation and the discrete velocity method, as described in Section 2. The method of moments, including the R13 and R26 moment methods, are introduced briefly in Section 3, followed by the evaluation of the reconstructed VDFs, as described in Section 4. Numerical simulations of several types of typical non-equilibrium flows (1D force-driven Poiseuille flow, 2D lid-driven cavity flow, and thermal cavity flow induced by temperature gradients) are presented and discussed in Section 5 in comparison with the DVM data. A brief summary is finally given in Section 6.
2. The Kinetic Equation and Discrete Velocity Method
From the microscopic point of view, the behavior of the rarefied gas dynamics can be described from the Boltzmann model equation:
where denotes the VDF of gas molecular with the molecular velocity at the position and the time t. is the external acceleration. The mean relaxation time is related to the viscosity and pressure by [50]. In this work, the Bhatnagar–Gross–Krook (BGK) collision model [15] is utilized, and the equilibrium VDF can be defined as [40]:
where and T represent the density, bulk velocity and the temperature of the gas, respectively. R is the gas constant. For convenience, the intrinsic or peculiar velocity is introduced as, .
The classical way to solve this Boltzmann model equation is through the time-implicit discrete velocity method. Firstly, the time derivate term can be removed, and the discretization of the partial differential equation can be expressed by:
where the superscript n and n + 1 stand for the nth and n + 1th iterations, respectively. The right-hand side of the Equation (3) is the explicit part, and the left-hand side is the implicit part which can be solved by introducing a second-order upwind scheme. In the upwind scheme, the spatial gradient term with respect to the mesh point (e.g., in the x-direction), is evaluated by:
Then, the evolution equations for the VDF can be obtained by substituting Equation (4) into Equation (3), which yields:
Meanwhile, the Maxwell’s kinetic diffuse–specular wall boundary condition is applied [40], which assumes that a fraction of gas molecules undergoes diffusive reflection with Maxwellian distribution function , while the remaining part will be reflected specularly. Suppose the wall has a temperature of and moves with the velocity , the VDF for the reflected molecules at the wall is given by:
where is the normal unit vector of the wall pointing towards the gas in a frame in which the coordinates are attached to the wall. The reflected Maxwellian distribution function can be expressed as:
where is the reflected gas density and need to be determined such that the mass flux across the wall is equal to zero. In the Maxwell’s kinetic wall boundary condition, the cases of and correspond to the diffusive-reflection and specular-reflection conditions, respectively. The results obtained from the Boltzmann model equation can be served as the benchmark data.
3. The Method of Moments
The conservation laws for the mass, momentum, and energy read [27]:
in which, the pressure is related to the temperature T by the ideal gas law . and are the stress tensor and heat flux, respectively. Any subscript i, j, k represents the usual summation convention. The classic way to close this set of equations is through a CE expansion of the molecular distribution function, and yields the NSF equations:
in which, the angular brackets are used to denote the traceless part of a symmetric tensor. With the moments obtained from the NSF solutions, i.e., , the VDF can be approximated by the first-order expansion of Hermite polynomials ,
As the value of the Knudsen number increases, Newton’s law for stress and strain and Fourier’s law for heat flux and temperature gradient in Equation (9) do not hold anymore, and it is necessary to adopt the method of moments. In R13 moment method, the governing equations for the and are:
respectively. In which represent the unknown moments. To closed this set of R13 moment equations, the algebraic expressions for have been derived by Struchtrup and Torrilhon [27,36]. An alternative way to evaluate these high order moments is by deriving their governing equations from the Boltzmann equation. In R26 moment method, they are [42]:
present the unknown high order moments, and are the nonlinear source terms, they are all listed in Appendix A. To apply the R13 and R26 equations to non-equilibrium flows, appropriate wall boundary conditions are required. Based on the Maxwell’s kinetic wall boundary condition, Gu and Emerson and Torrilhon and Struchtrup derived a set of solid wall boundary conditions for these extended thermodynamic macroscopic equations, they are listed in ref [38,39,42]. With the moments available in the R13 moment equations, i.e., , the VDF can be approximated by the third-order expansion of Hermite polynomials ,
Similarly, the macroscopic quantities can be obtained after solving the R26 moment equations, and the VDF can be approximated by the fifth-order expansion of Hermite polynomials ,
With Equations (10), (13) and (14), the accuracy of different macroscopic equations including the NSF equations, R13 and R26 moment equations can be evaluated and compared with the Boltzmann solutions at the microscopic level.
4. Evaluation of the , and at the Microscopic Level
As ‘nonequilibrium’ is a very broadly used term, Meng et al. [51] propose a kinetic criterion to indirectly assess the errors introduced by a continuum-level description of the gas flow, as shown in Equation (15):
where and are the non-dimensional form of and , they are:
Similarly, we equate the accuracy of the reconstructed VDFs to how far the molecular velocity distribution function deviates from the . At the kinetic level, the errors of can be measured by:
where , and are the non-dimensional form of , and . With above assumptions and definitions, the analysis of the moment methods can be implemented at both the macroscopic and microscopic levels.
5. Numerical Results and Discussions
5.1. Force-Driven Poiseuille Flow
The performance of the moment equations and the DVM is first evaluated by simulating the one-dimensional (1D) force-driven Poiseuille flow between two parallel plates, which are located at and . The reference characteristic length and the reference temperature are set to be and , respectively. An external force is applied in the x-direction, and the non-dimensional force is set to be . The spatial space is discretized with 51 grids, and the velocity space for the DVM is discretized in a range of with 64 × 64 × 24 non-uniform distributed Newton–Cotes quadrature points. Independence of results with respect to the number of discrete velocities is already validated. In the DVM, the diffuse boundary condition is applied on both plates. Suppose the magnitude of the external acceleration is very small, the derivation of the force term can be approximated by:
The normalized velocity profiles along the channel cross-section using the NSF, R13, R26 equations and the DVM are shown in Figure 1. A good agreement can be observed between the DVM and the macroscopic equations when Kn = 0.01, the dimensionless maximum velocity appears in the center of the channel and both the micro- and macroscopic approaches have the ability to capture the velocity profiles accurately.
However, when , the NSF equations in association with the velocity slip and temperature jump boundary conditions underestimate the maximum velocity by about 8.2% in the center of the channel. Meanwhile, the R26 moment equations are more accurate than the R13 equations, which reduces the maximum velocity error from 3.6% to 1.1%. As the Knudsen number further increases, e.g., and , the NSF equations fail to predict the velocity profiles. Both R13 and R26 moment equations begin to lose their accuracy in the velocity prediction at , and they underestimate the maximum velocity by about 6.4% and 5.2% in the center of the channel and overpredict the slip velocity by about 28.8% and 12.4% in the near-wall region. From the Figure 1c,d, it is clear to see that the R26 moment equations can reproduce relatively more accurate slip velocity than that predicted by the R13 equations.
A detailed comparison for , , are shown in Figure 2. We choose the point as the characteristic point to evaluate their accuracy. Since the is a multi-dimensional function, the contours in the left panel of Figure 2 are non-dimensional VDFs with the molecular velocity . Similarly, the profiles in the right panel are dimensionless VDFs with the molecular velocity .
It is clear to see that, as the Knudsen number increases, the VDF shifts away from the equilibrium state. In the slip regime, where , the VDFs , , obtained from NSF equations and R13, R26 moment equations agree very well with that obtained from the DVM. However, when , the non-equilibrium effects begin to dominate, and is clearly away from the equilibrium, in contrast, all of the VDFs , , are not accurate anymore, as indicated in Figure 2f. From the magnification of the Figure 2f, we can also see that is closer to the DVM result in comparison with and . That also helps to explain why the R26 moment method is more accurate than the NSF and the R13 moment method.
As the Knudsen number further increases, e.g., , the moment method doesn’t work anymore. However, we can still evaluate the accuracy of , , using the moments obtained from the DVM, as shown in Figure 3. From the Figure 3a,b we can see that the ‘real VDF’ is clearly far away from the equilibrium state. In contrast, all of the VDFs , , can only describe the gas that is not far away from the continuum regime.
The corresponding errors of , , are calculated based on Equation (17). Four Knudsen numbers, i.e., are considered. The errors along the channel are shown in Figure 4.
The overall results in Figure 4 indicate that, as the Knudsen number increases, increase subsequently. When , all of the errors are very close to 0, so that all the macroscopic equations are able to predict accurate solutions. Besides, for all the tested Knudsen numbers, we can find that , which means is more accurate than and . Moreover, from each line of the error profile, it is easy to find that the value of the error in the near wall region is larger than that in the center of the channel, which indicates that the ‘non-equilibrium effects’ in the near wall region is stronger than that in the center of the channel.
Our simulations start from a global equilibrium state, and the convergence criterion for the steady-state is defined by Equation (19). For this case, all tests are done on single processor (Intel Corporation, Santa Clara, CA, USA, i7-8550u). The computational cost, in terms of the computational memory and time cost, are listed in Table 1.
Due to the multi-dimensional nature of the VDF, the computational memory cost of DVM is about 2528 times larger than the macroscopic solvers. Besides, in the slip regime, the convergence rate of the DVM is also much slower than the macroscopic solvers, especially when the Knudsen number Kn < 0.1. As the Knudsen number increases, e.g., Kn = 1, the implicit DVM becomes highly efficient which needs 46 steps to get the steady-state solutions. In contrast, the macroscopic equations, especially the R13 and R26 moment equations, cost more computational time than the DVM. That is because when the value of the Knudsen number is high, the relaxation factors for the R13 and R26 moment equations should be very small to avoid the divergence.
5.2. Lid-Driven Cavity Flow
In addition to the force-driven Poiseuille flow, the evaluation of the moment method is also performed on a 2D lid-driven cavity flow, which is also a standard benchmark problem to validate numerical accuracy and efficiency. The length and the height of the cavity are both set to be 10−5 m, and the velocity of the top-wall is 10 m/s. The reference length, temperature and viscosity are L0 = 10−5 M, T0 = 273 K and , respectively. Three Knudsen numbers, i.e., are considered. The spatial space is discretized with 101 × 101 non-uniform grids, and the velocity space for the DVM is discretized in a range of with non-uniform distributed Newton–Cotes quadrature points. Independence of results with respect to the number of discrete velocities and spatial grids are already validated. In the DVM, the diffuse boundary condition is applied on all the solid walls.
Figure 5 shows the normalized velocity profiles and the normalized heat flux along centerlines of the cavity for in the early slip regime. It is usually recognized that it is difficult for the traditional DVM in this regime due to the requirement of large meshes. However, in terms of the velocity prediction, we note that the results obtained from the microscopic and macroscopic equations with the fine mesh of 101 × 101 are in excellent agreement with each other. The dimensionless heat flux predicted by both the microscopic and macroscopic methods are presented in Figure 5c,d. It can be seen that the NSF equations with the velocity slip and temperature jump boundary conditions fail to reproduce the heat flux profiles at the Knudsen number of 0.01. Besides, the R13 moment equations overpredict the absolute value of the heat flux adjacent to the wall compared to the R26 moment equations. The overall agreement between the microscopic and macroscopic approaches in terms of the velocity profiles is better than that of the heat flux profiles. That is because, the heat flux, a high-order moment quantity, is more sensitive to the core model than low-order ones.
.
The accuracy of , , at is shown in Figure 6. It is clear to see that when , , , agree very well with the VDF obtained from the DVM.
In the early transition regime, e.g., , the NSF equations underpredict the velocity by about 12.3% close to the wall, as indicated in Figure 7. The R13 and R26 moment equations represent almost the same velocity profiles along the vertical centerline, and both of them agree very well with the DVM results. In terms of the , the R26 and R13 moment equations overpredict and underpredict the velocity adjacent to the wall by about 4.8% and 5.4%, respectively. It is also interesting to find that the heat flux profiles predicted by the R26 moment equations are not as accurate as these predicted by the R13 moment equations at . Similar phenomena appear in the pressure-driven Poiseuille flow given by Gu and Emerson [29], which demonstrates that the R26 moment equations are not necessary more accurate than the R13 moment equations.
As the Knudsen number further increase, e.g., , all of the macroscopic equations fail to reproduce correct heat flux profiles. That is because, compared to the lower-order moment quantity, such as the velocity, the heat flux is more sensitive to the accuracy of the VDF. However, both R13 and R26 moment equations are able to predict relatively accurate velocity profiles along the centerlines of the cavity, as shown in Figure 8. When the Knudsen number is above 1, it will be very difficult for the R13 and R26 moment equations to find the steady-state solutions.
In this case, three Knudsen numbers, i.e., , , , are considered. The errors of the reconstructed VDFs are compared and presented in Figure 9.
Several interesting phenomena can be observed from Figure 9. Firstly, as the Knudsen number increases (from to , as shown in each column of the figure), all of the errors increase. Secondly, from each row of the figure, we can see the overall solutions indicate that , which demonstrates that the R26 moment equations are more accurate than the R13 moment equations and the NSF equations at the microscopic level. Last but not least, from each sub-figure, we can see that the maximum errors appear near the upper wall of the cavity, especially at the corners of the cavity. In contrast, the minimum errors appear near the bottom of the cavity.
Take as an example, we have compared , , near the upper and bottom walls to evaluate whether the ‘nonequilibrium effects’ near the upper wall are stronger than that near the bottom wall. Two characteristic points include and are chosen along the vertical centerline of the cavity. The comparison of the with , , are shown in Figure 10, and they are evaluated under the same scale in -direction.
It can be seen that the difference between the and , , in Figure 10b is larger than that in Figure 10a, which means the ‘nonequilibrium effects’ in the upper wall region is stronger than that in the bottom wall region. Besides, we also find that both and are still very close to the Maxwellian equilibrium VDF, and that is why the R13 and R26 moment methods are not working when the Knudsen number is above 0.5.
For this case, all tests are done on a single processor, the computational memory and time cost are listed in Table 2. The convergence criterion for the steady-state is defined by Equation (19). We can see that the R13 and R26 moment methods have the ability to save the computational memory and time cost, especially in the slip and early transition regimes.
5.3. D Thermal Cavity Flow
The last case is the thermal cavity flow induced by temperature gradients at wall. The geometric configuration and numerical setup are sketched in Figure 11. The computational domain is a square, partitioned by structured rectangular mesh. The left and right walls are maintained at constant temperature , while at the top and bottom walls, , we introduce a linearly increasing temperature (from to ) in left half of domain, and a linearly decreasing temperature (from to ) in the right half. All the walls are treated as diffusive boundaries. The reference mean free path is calculated from the initial uniform density. The reference temperature and the characteristic length are set to be 273 K and 10−5 m, respectively.
Three cases corresponding to Kn = 0.01, Kn = 0.1, and Kn = 0.5 are computed. For all of these cases, the spatial space is discretized with 101 × 101 non-uniform points, and the discrete velocity space is discretized in the range of with non-uniform points. The nondimensional temperature contours and streamlines as well as the nondimensional velocity contours are shown in Figure 12. The temperature profiles along the vertical center and the horizontal center lines are shown in Figure 13.
As indicated from Figure 12, the overall agreement between the DVM and the moment methods, especially in terms of the temperature field, is quite well. For all the tested cases, four vortices are generated with two of them rotate counter-clockwise at the lower left and upper right of the cavity, and another two vortices rotate clockwise at the upper left and lower right of the cavity. Besides, we can find that the NSF equations are able to reproduce the temperature fields when , however, they can’t predict the velocity fields accurately. In contrast, both the R13 and R26 moment equations can reproduce accurate temperature and velocity fields in comparison with the DVM solutions. Moreover, from the Figure 13, it is found that from the regions near solid walls to the cavity center, the gas temperature increases along horizontal lines, while decreases along vertical lines. The maximum temperature value decreases as the degree of rarefaction increases. It is because both the interactions between gas molecules and hot wall and the molecular collisions become weak when the gas is far away from the equilibrium state.
From the microscopic point of view, like the other cases in this study, are evaluated at different Knudsen numbers, shown in Figure 14. Several interesting phenomena can be found: Firstly, the overall results show that, , which demonstrate the , reconstructed from the R26 moment equations, is more accurate than and . Secondly, like the lid-driven cavity case, as the Knudsen number increases, all of the VDFs , and begin to lose their accuracy, especially in the near wall region. Last but not least, the maximum errors of appear near the center of the upper and lower walls, which are also the hottest regions of the walls, as indicated in Figure 11 and Figure 14. Hence, we choose the point close to the hottest center of the lower wall as a characteristic point to evaluate the accuracy of VDFs. The comparison of , and are shown in Figure 14. The definitions of the dimensionless and the descriptions of the contours and the lines are similar to that described in the force-driven Poiseuille case.
When , moves away from the equilibrium states. However, , , and are still very close to the equilibrium states, as indicated in Figure 15c. From the Figure 15d, we can find that the is more accurate than that obtained from the R13 moment equations and the NSF equations. When , appears the special double peaks phenomenon, while all of the VDFs , , and cannot capture this special phenomenon.
Like the other cases in this study, the computational memory and time cost have been evaluated for the thermally gradients induced case, as shown in Table 3. For this case, all tests are done on single processor (Intel Corporation, Santa Clara, CA, USA, i7-8550u), and the convergence criterion for the steady-state is defined by Equation (20). The macroscopic equations are able to save tremendous computational time and memory cost in comparison with the DVM.
6. Conclusions
The main objective of this work is to quantify the computational performance of the moment methods at both the macro- and microscopic levels, so that researchers may choose the most appropriate method for their applications. Three types of rarefied gas flows have been investigated with different Knudsen numbers and the results have been validated using DVM results. From the macroscopic point of view, the simulation results show that, as the Knudsen number increases, the NSF equations will gradually lose this validation and accuracy. In contrast, both R13 and R26 moment equations are able to reproduce accurate results in the slip and the transition regimes.
From the microscopic point of view, the errors of the reconstructed VDFs are evaluated based on the ‘non-equilibrium indicator’. Several interesting phenomena have been found. Firstly, as the value of the Knudsen number increases, increase subsequently, especially in the near wall region. Secondly, the overall results show that, , which demonstrates the is more accurate than and . Last but not least, even though is much closer to the , all of , , and , are still very close to the equilibrium state. In terms of the computational cost, both the R13 and R26 moment methods have the ability to save tremendous computational memory (by more than 95%) and time cost in the slip and early transition regimes, in comparison with the DVM.
In summary, the moment method bridges the gap between the conventional hydrodynamic model and kinetic model in early transition regime, where the NSF and DVM become either inaccuracy or inefficient. In the slip and early transition (where the Knudsen number is below 0.5), the moment methods can predict the flow field accurately, besides, they are much faster than the implicit DVM, especially when . However, when , the time-implicit DVM is a better choice.
Author Contributions
W.Y. developed the code and performed the simulations. W.Y. analyzed the results and wrote the paper, S.T., H.Y. helped to revise the paper and analyze the results.
Funding
This research was funded by the National Natural Science Foundation of China (61702538), Scientific Research Projects of the National University of Defense Technology (ZK17-03-53).
Acknowledgments
The financial support to W. Yang from Yonghao Zhang and the Chinese Scholarship Council (CSC) during his visit to the UK are greatly acknowledged. W. Yang would also like to thank M.-T. Ho, P. Wang, W. Su, L. Zhu and L. Wu (at the University of Strathclyde, Glasgow, UK) and X.-J. Gu, J. Meng (STFC Daresbury Laboratory, UK) for the useful discussions in DVM and moment method.
Conflicts of Interest
The authors declare no conflict of interest.
Appendix A. High Order of Moments and Source Terms in Equation (12)
(1). Algebraic expression for high order of moments in terms of derivatives of lower moments:
(2). Expression for the source terms :
References
- Harley, J.C.; Huang, Y.; Bau, H.H.; Zemel, J.N. Gas flow in micro-channels. J. Fluid Mech. 1995, 284, 257–274. [Google Scholar] [CrossRef]
- Reese, J.M.; Gallis, M.A.; Lockerby, D.A. New directions in fluid dynamics: Nonequilibrium aerodynamic and microsystem flows. Philos. Trans. R. Soc. Lond. A 2003, 361, 2967–2988. [Google Scholar] [CrossRef] [PubMed]
- Wang, Q.; Chen, X.; Jha, A.N.; Rogers, H. Natural gas from shale formation—The evolution, evidences and challenges of shale gas revolution in United States. Renew. Sustain. Energy Rev. 2014, 30, 1–28. [Google Scholar] [CrossRef]
- Cercignani, C. The Boltzmann Equation and Its Applications; Springer: New York, NY, USA, 1988. [Google Scholar]
- Sone, Y. Kinetic Theory and Fluid Dynamics; Springer Science & Business Media, LLC: New York, NY, USA, 2002; pp. 123–160. [Google Scholar]
- Bird, G.A. Molecular Gas Dynamics and the Direct Simulation of Gas Flows; Clarendon Press: Oxford, UK, 1994; pp. 46–98. [Google Scholar]
- Nanbu, K. Direct simulation scheme derived from the Boltzmann equation. I. Monocomponent gases. J. Phys. Soc. Jpn. 1983, 52, 2042–2049. [Google Scholar] [CrossRef]
- Goldstein, D.; Sturtevant, B.; Broadwell, J.E. Investigations of the motion of discrete-velocity gases. Prog. Astronaut. Aeronaut. 1989, 118, 100–117. [Google Scholar]
- Pareschi, L.; Perthame, B. A Fourier spectral method for homogeneous Boltzmann equation. Transport Theory Stat. 1996, 25, 369–382. [Google Scholar] [CrossRef]
- Bobylev, A.V.; Rjasanow, S. Difference scheme for the Boltzmann equation based on fast Fourier transformation. Eur. J. Mech. B-Fluid 1997, 16, 293–306. [Google Scholar]
- Wu, L.; White, C.; Scanlon, T.J.; Reese, J.M.; Zhang, Y. Deterministic numerical solutions of the Boltzmann equation using the fast spectral method. J. Comput. Phys. 2013, 250, 27–52. [Google Scholar] [CrossRef] [Green Version]
- Wu, L.; Zhang, Y.; Reese, J.M. Fast spectral solution of the generalized Enskog equation for dense gases. J. Comput. Phys. 2015, 303, 66–79. [Google Scholar] [CrossRef] [Green Version]
- Wu, L.; Reese, J.M.; Zhang, Y. Solving the Boltzmann equation deterministically by the fast spectral method: Application to gas microflows. J. Fluid Mech. 2014, 746, 53–84. [Google Scholar] [CrossRef]
- Mouhot, C.; Pareschi, L. Fast algorithms for computing the Boltzmann collision operator. Math. Comput. 2006, 75, 1833–1852. [Google Scholar] [CrossRef] [Green Version]
- Bhatnagar, P.L.; Gross, E.P.; Krook, M. A model for collision processes in gases. I. small amplitude processes in charged and neutral one-component systems. Phys. Rev. 1954, 94, 511–525. [Google Scholar] [CrossRef]
- Holway, L.H., Jr. New statistical models for kinetic theory: Methods of construction. Phys. Fluids 1966, 9, 1658–1673. [Google Scholar] [CrossRef]
- Shakhov, E. Generalization of the Krook kinetic relaxation equation. Fluid Dyn. 1968, 3, 95–96. [Google Scholar] [CrossRef]
- Li, Z.-H.; Zhang, H.-X. Study on gas kinetic unified algorithm for flows from rarefied transition to continuum. J. Comput. Phys. 2004, 193, 708–738. [Google Scholar] [CrossRef]
- Li, Z.-H.; Bi, L.; Zhang, H.; Li, L. Gas-kinetic numerical study of complex flow problems covering various flow regimes. Comput. Math. Appl. 2011, 61, 3653–3677. [Google Scholar] [CrossRef]
- Xu, K.; Huang, J.-C. A unified gas-kinetic scheme for continuum and rarefied flows. J. Comput. Phys. 2010, 229, 7747–7764. [Google Scholar] [CrossRef]
- Xu, K.; Huang, J.-C. An improved unified gas-kinetic scheme and the study of shock structures. IMA J. Appl. Math. 2011, 76, 698–711. [Google Scholar] [CrossRef]
- Guo, Z.; Xu, K.; Wang, R. Discrete unified gas kinetic scheme for all Knudsen number flows: Low-speed isothermal case. Phys. Rev. E 2013, 88, 033305. [Google Scholar] [CrossRef] [Green Version]
- Guo, Z.; Wang, R.; Xu, K. Discrete unified gas kinetic scheme for all Knudsen number flows. II. Thermal compressible case. Phys. Rev. E 2015, 91, 033313. [Google Scholar] [CrossRef] [Green Version]
- Wang, P.; Ho, M.-T.; Wu, L.; Guo, Z.; Zhang, Y. A comparative study of discrete velocity methods for low-speed rarefied gas flows. Comput. Fluids 2018, 161, 33–46. [Google Scholar] [CrossRef] [Green Version]
- Liu, C.; Zhu, Y.; Xu, K. Unified gas-kinetic wave-particle methods I: Continuum and rarefied gas flow. arXiv 2018, arXiv:1811.07141. [Google Scholar]
- Zhu, Y.; Liu, C.; Zhong, C.; Xu, K. Unified gas-kinetic wave-particle methods II: Multiscale simulation on unstructured mesh. arXiv 2019, arXiv:1903.11861. [Google Scholar]
- Struchtrup, H. Macroscopic Transport Equations for Rarefied Gas Flows; Springer: New York, NY, USA, 2005. [Google Scholar]
- Chapman, S. On the law of distribution of molecular velocities, and the theory of viscosity and thermal conduction, in a non-uniform simple monatomic gas. Philos. Trans. R. Soc. A 1916, 216, 538–548. [Google Scholar] [CrossRef]
- Enskog, D. Kinetische Theorie der Vorgänge in mässig verdünnten Gasen; Almqvist och Wiksells boktryckeri, Uppsala University: Uppsala, Sweden, 1917. [Google Scholar]
- Chapman, S.; Cowling, T.G. The Mathematical Theory of Non-Uniform Gases; Cambridge University Press: Cambridge, UK, 1970. [Google Scholar]
- Karlin, I.V.; Gorban, A.N. Hydrodynamics from Grad’s equations: What can we learn from the exact solutions? Ann. Phys. 2002, 11, 783–833. [Google Scholar] [CrossRef]
- Wu, L. On the accuracy of macroscopic equations in the dynamic light scattering by rarefied gas. In Proceedings of the 31st International Symposium on Rarefied Gas Dynamics, Glasgow, UK, 23–27 July 2018. [Google Scholar]
- Grad, H. Asymptotic Theory of the Boltzmann Equation. Phys. Fluids 1963, 6, 147–181. [Google Scholar] [CrossRef]
- Grad, H. On the kinetic theory of rarefied gases. Commun. Pure Appl. Math. 1949, 2, 331–407. [Google Scholar] [CrossRef]
- Grad, H. Note on N-dimensional Hermite polynomials. Commun. Pure Appl. Math. 1949, 2, 325–330. [Google Scholar] [CrossRef]
- Struchtrup, H.; Torrilhon, M. Regularization of Grad’s 13 moment equations: Derivation and linear analysis. Phys. Fluids 2003, 15, 2668–2680. [Google Scholar] [CrossRef]
- Struchtrup, H.; Torrilhon, M. H Theorem, regularization and boundary conditions for linearized 13 moment equations. Phys. Rev. Lett. 2007, 99, 014502. [Google Scholar] [CrossRef]
- Gu, X.-J.; Emerson, D.R. A computational strategy for the regularized 13 moment equations with enhanced wall-boundary conditions. J. Comput. Phys. 2007, 225, 263–283. [Google Scholar] [CrossRef]
- Torrilhon, M.; Struchtrup, H. Boundary conditions for regularized 13-moment-equations for micro-channel-flows. J. Comput. Phys. 2008, 227, 1982–2011. [Google Scholar] [CrossRef] [Green Version]
- Maxwell, J.C. On stresses in rarified gases arising from inequalities of temperature. Phil. Trans. R. Soc. Lond.-A 1879, 170, 231–256. [Google Scholar]
- Gu, X.-J.; Barber, R.W.; Emerson, D.R. How far can 13 moments go in modeling microscale gas phenomena? Nanosac. Microsc. Therm. 2007, 11, 85–97. [Google Scholar] [CrossRef]
- Gu, X.-J.; Emerson, D.R. A high-order moment approach for capturing non-equilibrium phenomena in the transition regime. J. Fluid Mech. 2009, 636, 177–216. [Google Scholar] [CrossRef]
- Young, J.B. Calculation of Knudsen layers and jump conditions using the linearised G13 and R13 moment methods. Int. J. Heat Mass Transfer 2011, 54, 2902–2912. [Google Scholar] [CrossRef]
- Gu, X.-J.; Emerson, D.R.; Tang, G.-H. Analysis of the slip coefficient and defect velocity in the Knudsen layer of a rarefied gas using the linearized moment equations. Phys. Rev. E 2010, 81, 016313. [Google Scholar] [CrossRef] [PubMed]
- Tang, G.H.; Zhai, G.X.; Tao, W.Q.; Gu, X.J.; Emerson, D.R. Extended thermodynamic approach for non-equilibrium gas flow. Commun. Comput. Phys. 2013, 13, 1330–1356. [Google Scholar] [CrossRef]
- Sheng, Q.; Tang, G.H.; Gu, X.J.; Emerson, D.R.; Zhang, Y.H. Simulation of thermal transpiration flow using a high-order moment method. Int. J. Mod. Phys. C 2014, 25, 1450061. [Google Scholar] [CrossRef]
- Lu, Y.B.; Tang, G.H.; Sheng, Q.; Gu, X.J.; Emerson, D.R.; Zhang, Y.H. Knudsen’s permeability correction for gas flow in tight porous media using the R26 moment method. J. Porous Media 2017, 20, 787–805. [Google Scholar] [CrossRef]
- Wu, L.; Ho, M.T.; Germanou, L.; Gu, X.J.; Liu, C.; Xu, K.; Zhang, Y.H. On the apparent permeability of porous media in rarefied gas flows. J. Fluid Mech. 2017, 822, 398–417. [Google Scholar] [CrossRef] [Green Version]
- Gu, X.-J.; Barber, R.W.; John, B.; Emerson, D.R. Non-equilibrium effects on flow past a circular cylinder in the slip and early transition regime. J. Fluid Mech. 2019, 860, 654–681. [Google Scholar] [CrossRef]
- White, F.M. Viscous Fluid Flow; McGraw-Hill: New York, NY, USA, 1991. [Google Scholar]
- Meng, J.; Dongari, N.; Reese, J.M.; Zhang, Y. Breakdown parameter for kinetic modeling of multiscale gas flows. Phys. Rev. 2014, 89, 063305. [Google Scholar] [CrossRef] [PubMed] [Green Version]
Figure 1.
Normalized velocity profiles along the channel cross-section at (a) Kn = 0.01; (b) Kn = 0.1; (c) Kn = 0.5; (d) Kn = 1.
Figure 1.
Normalized velocity profiles along the channel cross-section at (a) Kn = 0.01; (b) Kn = 0.1; (c) Kn = 0.5; (d) Kn = 1.

Figure 2.
Comparison of the dimensionless VDF with , and at (a,b) ; (c,d) ; (e,f) . Left panel of the figure, contours: VDF obtained from the DVM; lines: obtained from the R26 moment solutions. Right panel of the figure, VDFs against the dimensionless molecular velocity along the molecular velocity cross-section where . And the terms: ‘NSF’, ‘R13′, ‘R26′ corresponding to , , reconstructed from the NSF solutions and R13, R26 moment solutions, respectively. The same notations are also used in the following figures unless otherwise stated.

Figure 3.
Comparison of with . (a) Contour: VDF obtained from the DVM, lines: using the moments obtained from the DVM; (b) Profiles of using DVM results.
Figure 3.
Comparison of with . (a) Contour: VDF obtained from the DVM, lines: using the moments obtained from the DVM; (b) Profiles of using DVM results.

Figure 4.
along the channel at (a) ; (b) .

Figure 5.
The simulation results of the cavity flow at .

Figure 6.
Comparison of the dimensionless VDFs , , , and at . The notations have been defined in Figure 2.
Figure 6.
Comparison of the dimensionless VDFs , , , and at . The notations have been defined in Figure 2.
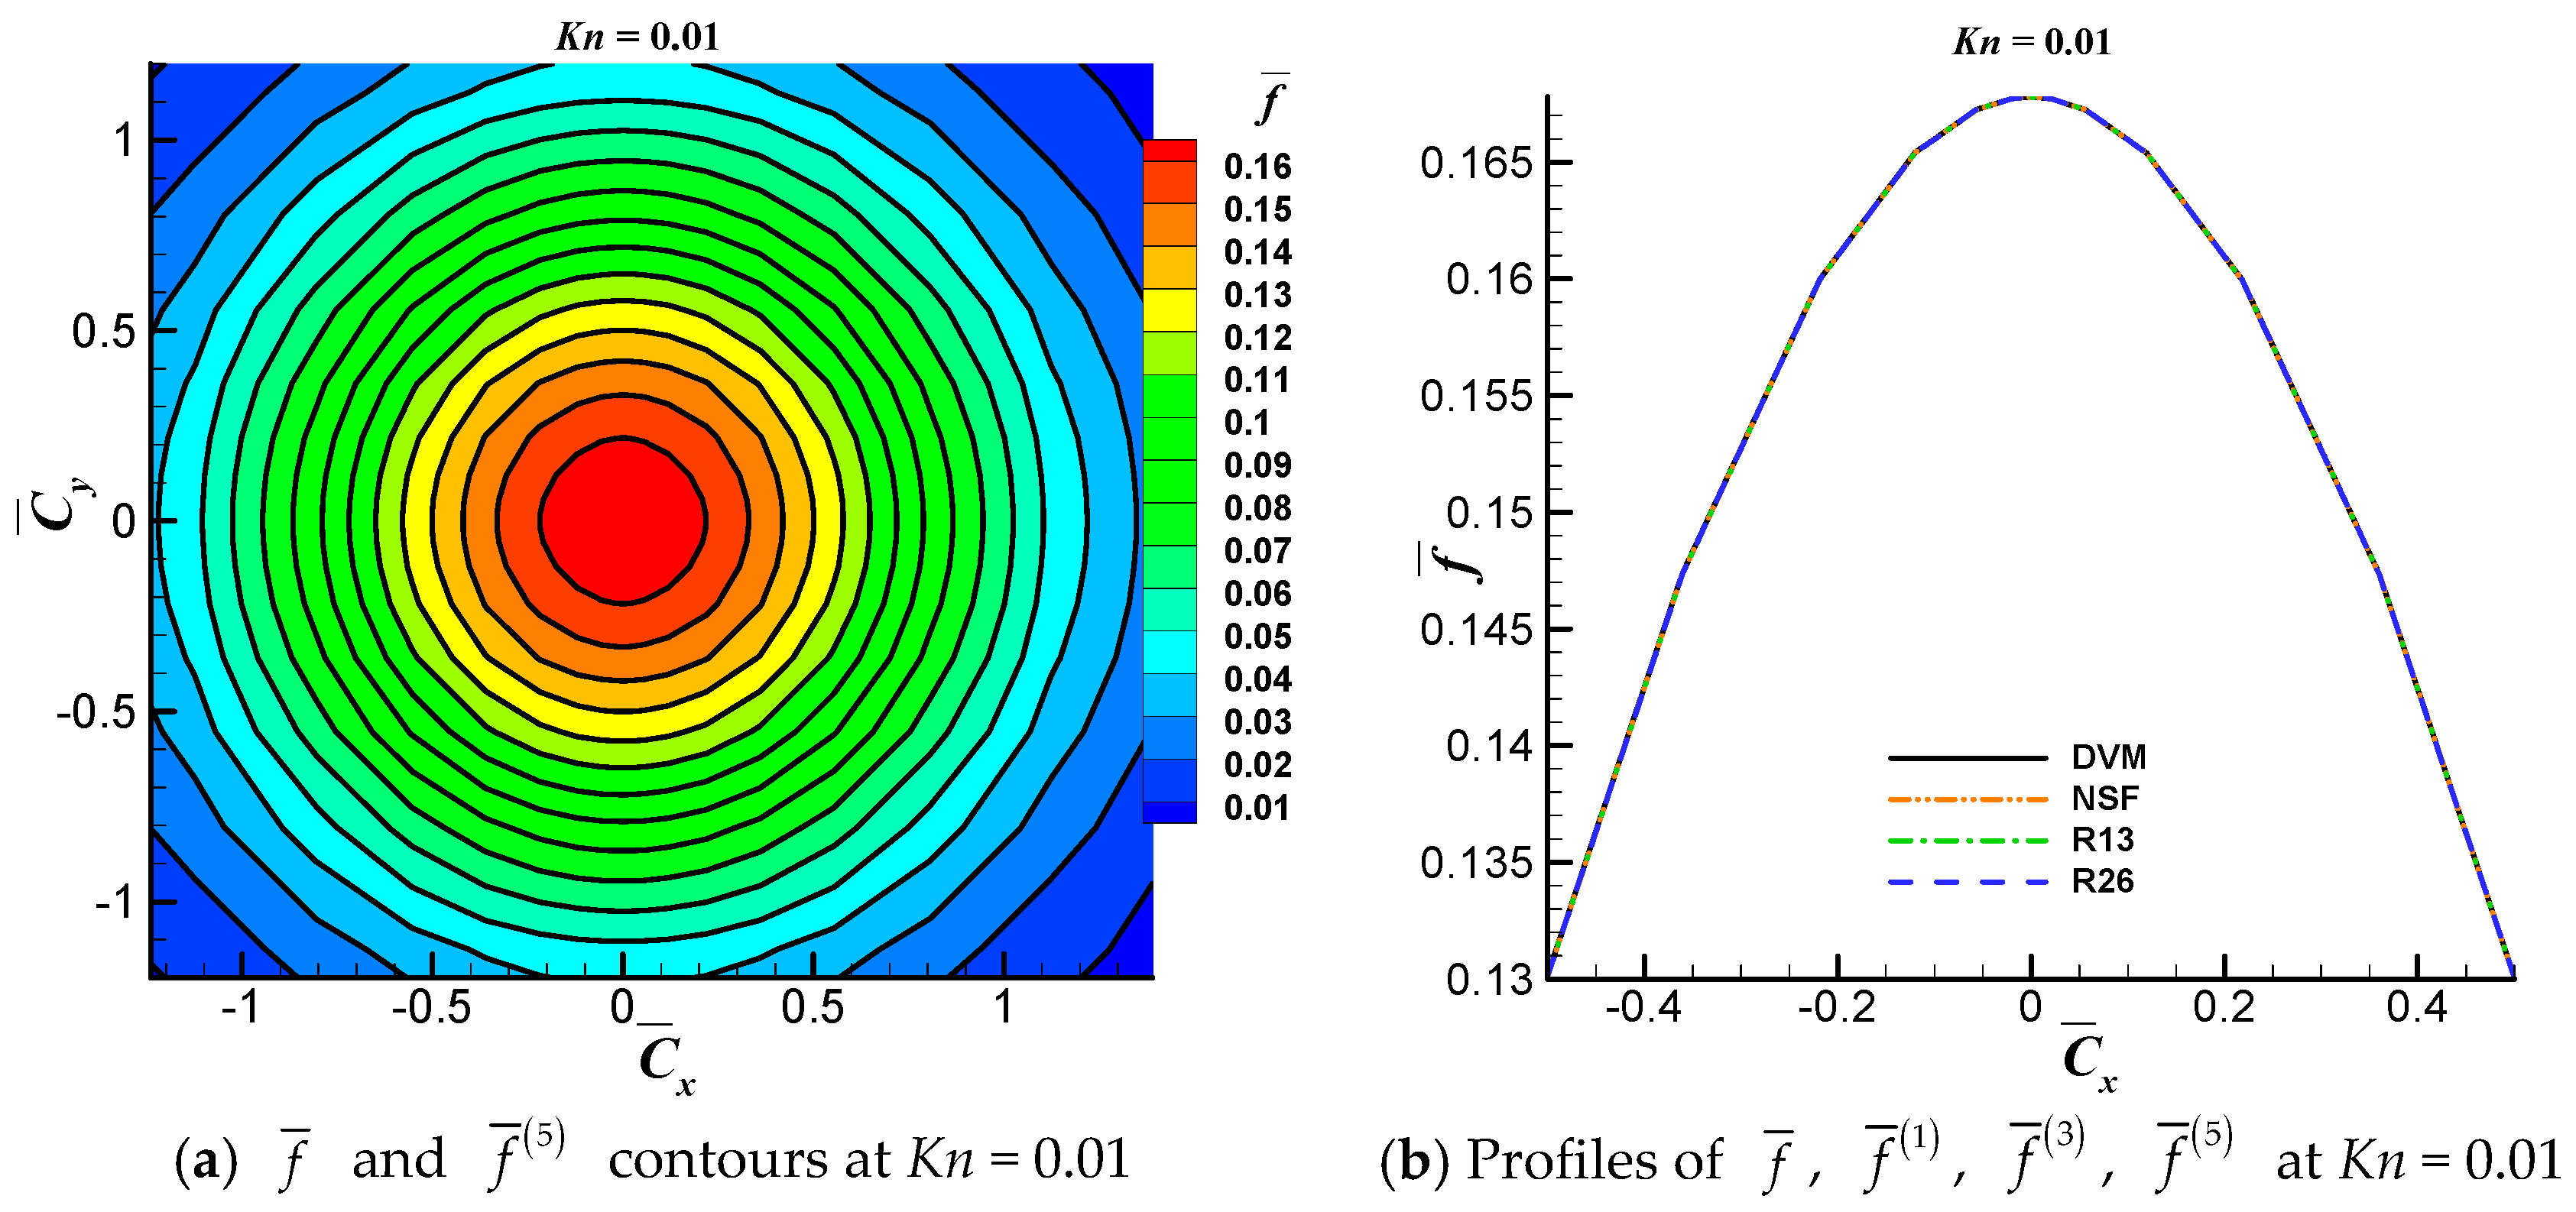
Figure 7.
The simulation results of the cavity flow at .


Figure 8.
The simulation results of the cavity flow at .

Figure 9.
Contours of at (a–c) ; (d–f) ; (g–i) .

Figure 10.
Comparison of the VDF with , , .

Figure 11.
Numerical setup for thermally driven cavity flow.

Figure 12.
Comparison of , contours and streamlines of the temperature gradients induced flow case at different Knudsen numbers: (a,b) Kn = 0.01, (c,d) Kn = 0.1, (e,f) Kn = 0.5. Due to symmetry of the problem, in each sub-figure, upper left and upper right are results obtained from the DVM and R26 moment method, respectively; lower left and lower right are results obtained from the R13 moment method and NSF, respectively.

Figure 13.
Temperature profiles along the vertical center (a–c) and the horizontal center lines (d–f) at different Knudsen numbers.
Figure 13.
Temperature profiles along the vertical center (a–c) and the horizontal center lines (d–f) at different Knudsen numbers.

Figure 14.
Contours of the at (a–c) Kn = 0.01; (d–f) Kn = 0.1; (g–i) Kn = 0.5.

Figure 15.
Comparison of the VDFs at (a,b): ; (c,d): ; (e,f): . Left panel of the figure, contours and white lines: ; black lines: ; red dash dot lines: . The remaining notations have been defined in Figure 2.
Figure 15.
Comparison of the VDFs at (a,b): ; (c,d): ; (e,f): . Left panel of the figure, contours and white lines: ; black lines: ; red dash dot lines: . The remaining notations have been defined in Figure 2.


Table 1.
Comparison of the computational cost between the DVM and the moment methods.
| Method | Computational Memory (MB) | Computational Time (Min) | |||
|---|---|---|---|---|---|
| Kn = 0.01 | Kn = 0.1 | Kn = 0.5 | Kn = 1 | ||
| DVM | 5562.00 | 142.2 | 19.18 | 3.65 | 2.40 |
| NSF | 2.20 | 0.50 | 0.20 | 0.25 | 1.27 |
| R13 | 2.20 | 2.00 | 1.20 | 3.52 | 6.46 |
| R26 | 2.20 | 3.20 | 2.50 | 4.36 | 10.38 |
Table 2.
Comparison of the computational cost between the DVM and moment method.
| Method | Computational Memory (MB) | Computational Time (Min) | ||
|---|---|---|---|---|
| Kn = 0.01 | Kn = 0.1 | Kn = 0.5 | ||
| DVM | 9943.6 | 325.44 | 152.62 | 47.83 |
| NSF | 11.00 | 1.98 | 1.37 | 1.52 |
| R13 | 11.00 | 5.58 | 8.37 | 22.32 |
| R26 | 11.10 | 8.55 | 12.82 | 29.92 |
Table 3.
Comparison of the computational cost between the DVM and moment method.
| Method | Computational Memory (MB) | Computational Time (Minutes) | ||
|---|---|---|---|---|
| Kn = 0.01 | Kn = 0.1 | Kn = 0.5 | ||
| DVM | 10691 | 265.14 | 126.24 | 36.6 |
| NSF | 10.8 | 0.46 | 1.00 | 1.20 |
| R13 | 11.2 | 1.08 | 5.58 | 15.50 |
| R26 | 11.2 | 1.20 | 10.26 | 24.46 |
© 2019 by the authors. Licensee MDPI, Basel, Switzerland. This article is an open access article distributed under the terms and conditions of the Creative Commons Attribution (CC BY) license (http://creativecommons.org/licenses/by/4.0/).
Share and Cite
MDPI and ACS Style
Yang, W.; Tang, S.; Yang, H. Analysis of the Moment Method and the Discrete Velocity Method in Modeling Non-Equilibrium Rarefied Gas Flows: A Comparative Study. Appl. Sci. 2019, 9, 2733. https://doi.org/10.3390/app9132733
AMA Style
Yang W, Tang S, Yang H. Analysis of the Moment Method and the Discrete Velocity Method in Modeling Non-Equilibrium Rarefied Gas Flows: A Comparative Study. Applied Sciences. 2019; 9(13):2733. https://doi.org/10.3390/app9132733
Chicago/Turabian StyleYang, Weiqi, Shuo Tang, and Hui Yang. 2019. "Analysis of the Moment Method and the Discrete Velocity Method in Modeling Non-Equilibrium Rarefied Gas Flows: A Comparative Study" Applied Sciences 9, no. 13: 2733. https://doi.org/10.3390/app9132733
Note that from the first issue of 2016, this journal uses article numbers instead of page numbers. See further details here.