1. Introduction
Three-dimensional elliptical vibration cutting (3D-EVC) is an ultra-precision cutting technology with significant development potential. Its unique characteristics of intermittent cutting, friction reversal, and ease of chip removal can improve the machinability of difficult-to-cut materials in the cutting process [
1,
2,
3]. Since 3D-EVC technology was first introduced in 2005, the research field has mainly focused on the mechanism of cutting, the design of 3D-EVC apparatus, path planning of the tool, specific applications, and so on. [
4,
5]. At present, how to study the chatter phenomenon in the process of non-resonance 3D-EVC machining is an important problem. In the ultra-precision cutting technology processes, the main reasons that the effect of unstable vibration could be reduced is by the increase of the spindle speed, small cutting depth, and great performance of the diamond tool. But the damage accompanying chatter is mainly reflected in reducing the accuracy of the work-piece of the optical parts, increasing the surface roughness of the work-piece, speeding up the wear on the cutting tools, and causing damage to the spindle of the machine tool [
6,
7].
EVC is an intermittent cutting technology, which has the characteristics of friction reversal, tool wear suppression, and easy chip removal. However, there is no specific literature on the identification of chatter in the 3D-EVC cutting processes [
8]. In 2011, Ma et al. proposed that the two-dimensional EVC technology had a certain inhibitory effect in chatter suppression compared to the traditional cutting method, and the effectiveness of the effect of chatter suppression was verified by experiment, but this was limited to two-dimensional elliptical vibration cutting [
9]. In 2016, Jung et al. collected the real-time signal from the 2D-EVC process and analyzed the chatter phenomenon according to the frequency domain analysis and surface of the work-piece [
10]. They obtained the friction chatter mechanism of the plough force during the initial period of each ellipse movement cycle and suppressed the chatter vibration by changing the guiding angle in 2D-EVC process. It was also the earliest research on identification and suppression of the chatter phenomenon in the 2D-EVC cutting processes. Therefore, exploring a new method to identify the chattering phenomenon applied to the 3D-EVC processes is critical to improving the machining accuracy of the 3D-EVC technology.
In the field of ultra-precision cutting, research on chatter is focused on the influence of undesired vibration, the chatter identification and the modeling method of chatter mechanism, and so on. Chatter is a poor vibration phenomenon in metal processing, which has effects on the machined work-piece surface quality, reduced cutting efficiency and productivity, as well as producing a lot of noise, and so on. The mechanical vibration has three forms: free vibration, forced vibration, and self-excited vibration. The free vibration is caused by impact during the machining process. The forced vibration is mainly caused by the unbalance effect of the machine tool components. The free vibration and forced vibration are relatively easy to identify and eliminate. However, the self-excited vibration is a significant factor affecting cutting stability. Zhang et al. proposed the physical modes of vibration, in ultra-precision machining, and the effect on the generated surface is related to the many factors, including the properties of materials, cutting conditions and the relative vibration between tool and work-piece [
11]. Chen et al. presented the mathematical models for modeling and analyzing the vibration and surface roughness in precision turning, and also established a relationship model between tool vibration and surface profile and roughness in the precision end-milling process [
11,
12]. A simple method for the detection of milling chatter was presented by Zhang. The assessment of milling process stability by recursive drawing method combined with Hilbert Huang transform was proposed by Rafal [
13]. In addition, with the development of the sensor and the modern signal processing technology, chatter identification technology has been greatly improved. Various signals have been applied in chatter identification, such as cutting force [
14,
15,
16], sound [
17] and the acceleration [
18,
19]. Cao et al. presented an effective chatter identification method based on the two advanced signals processing techniques, wavelet package transform (WT) and Hilbert-Huang transform (HHT), and the experimental results proved that the method can identify the chatter effectively [
20]. In 2015, Cao et al. adopted a self-adaptive analysis method named ensemble empirical mode decomposition (EEMD), extracted two nonlinear indices as the indices of chatter symptoms, and presented a method for identifying the chattering phenomenon based on the two points in the end milling process. The results have shown that the mean value and standard deviation increase with the cutting state’s instability [
21,
22].
The vibration signals belong to unsteady and nonlinear signals in the 3D-EVC process [
23], traditional time-frequency analysis methods can analyze the global mean of the signal in the time-frequency domain, but it cannot analyze the feature information about the local area. In order to solve the lack of self-adaptability or poor adaptability in traditional time-frequency analysis methods, Huang et al. proposed a novel and adaptive decomposition method, which was named empirical mode decomposition (EMD), in 1998 [
24]. Liu et al. decomposed the motor current signal into intrinsic mode functions (IMFs) and extracted the energy index and kurtosis index based on those IMFs for chatter detection [
21]. Compared with the traditional time-frequency analysis, EMD is more appropriate for analyzing the non-stationary and nonlinear signals, as the EMD method can not only yield clear distribution for instantaneous frequency and amplitude, but also reflect the time-variation of the total energies, which is significant for the non-stationary and nonlinear signals. In recent years, the EMD method has been applied to signal processing, fault diagnosis [
25] and pattern recognition [
25,
26].
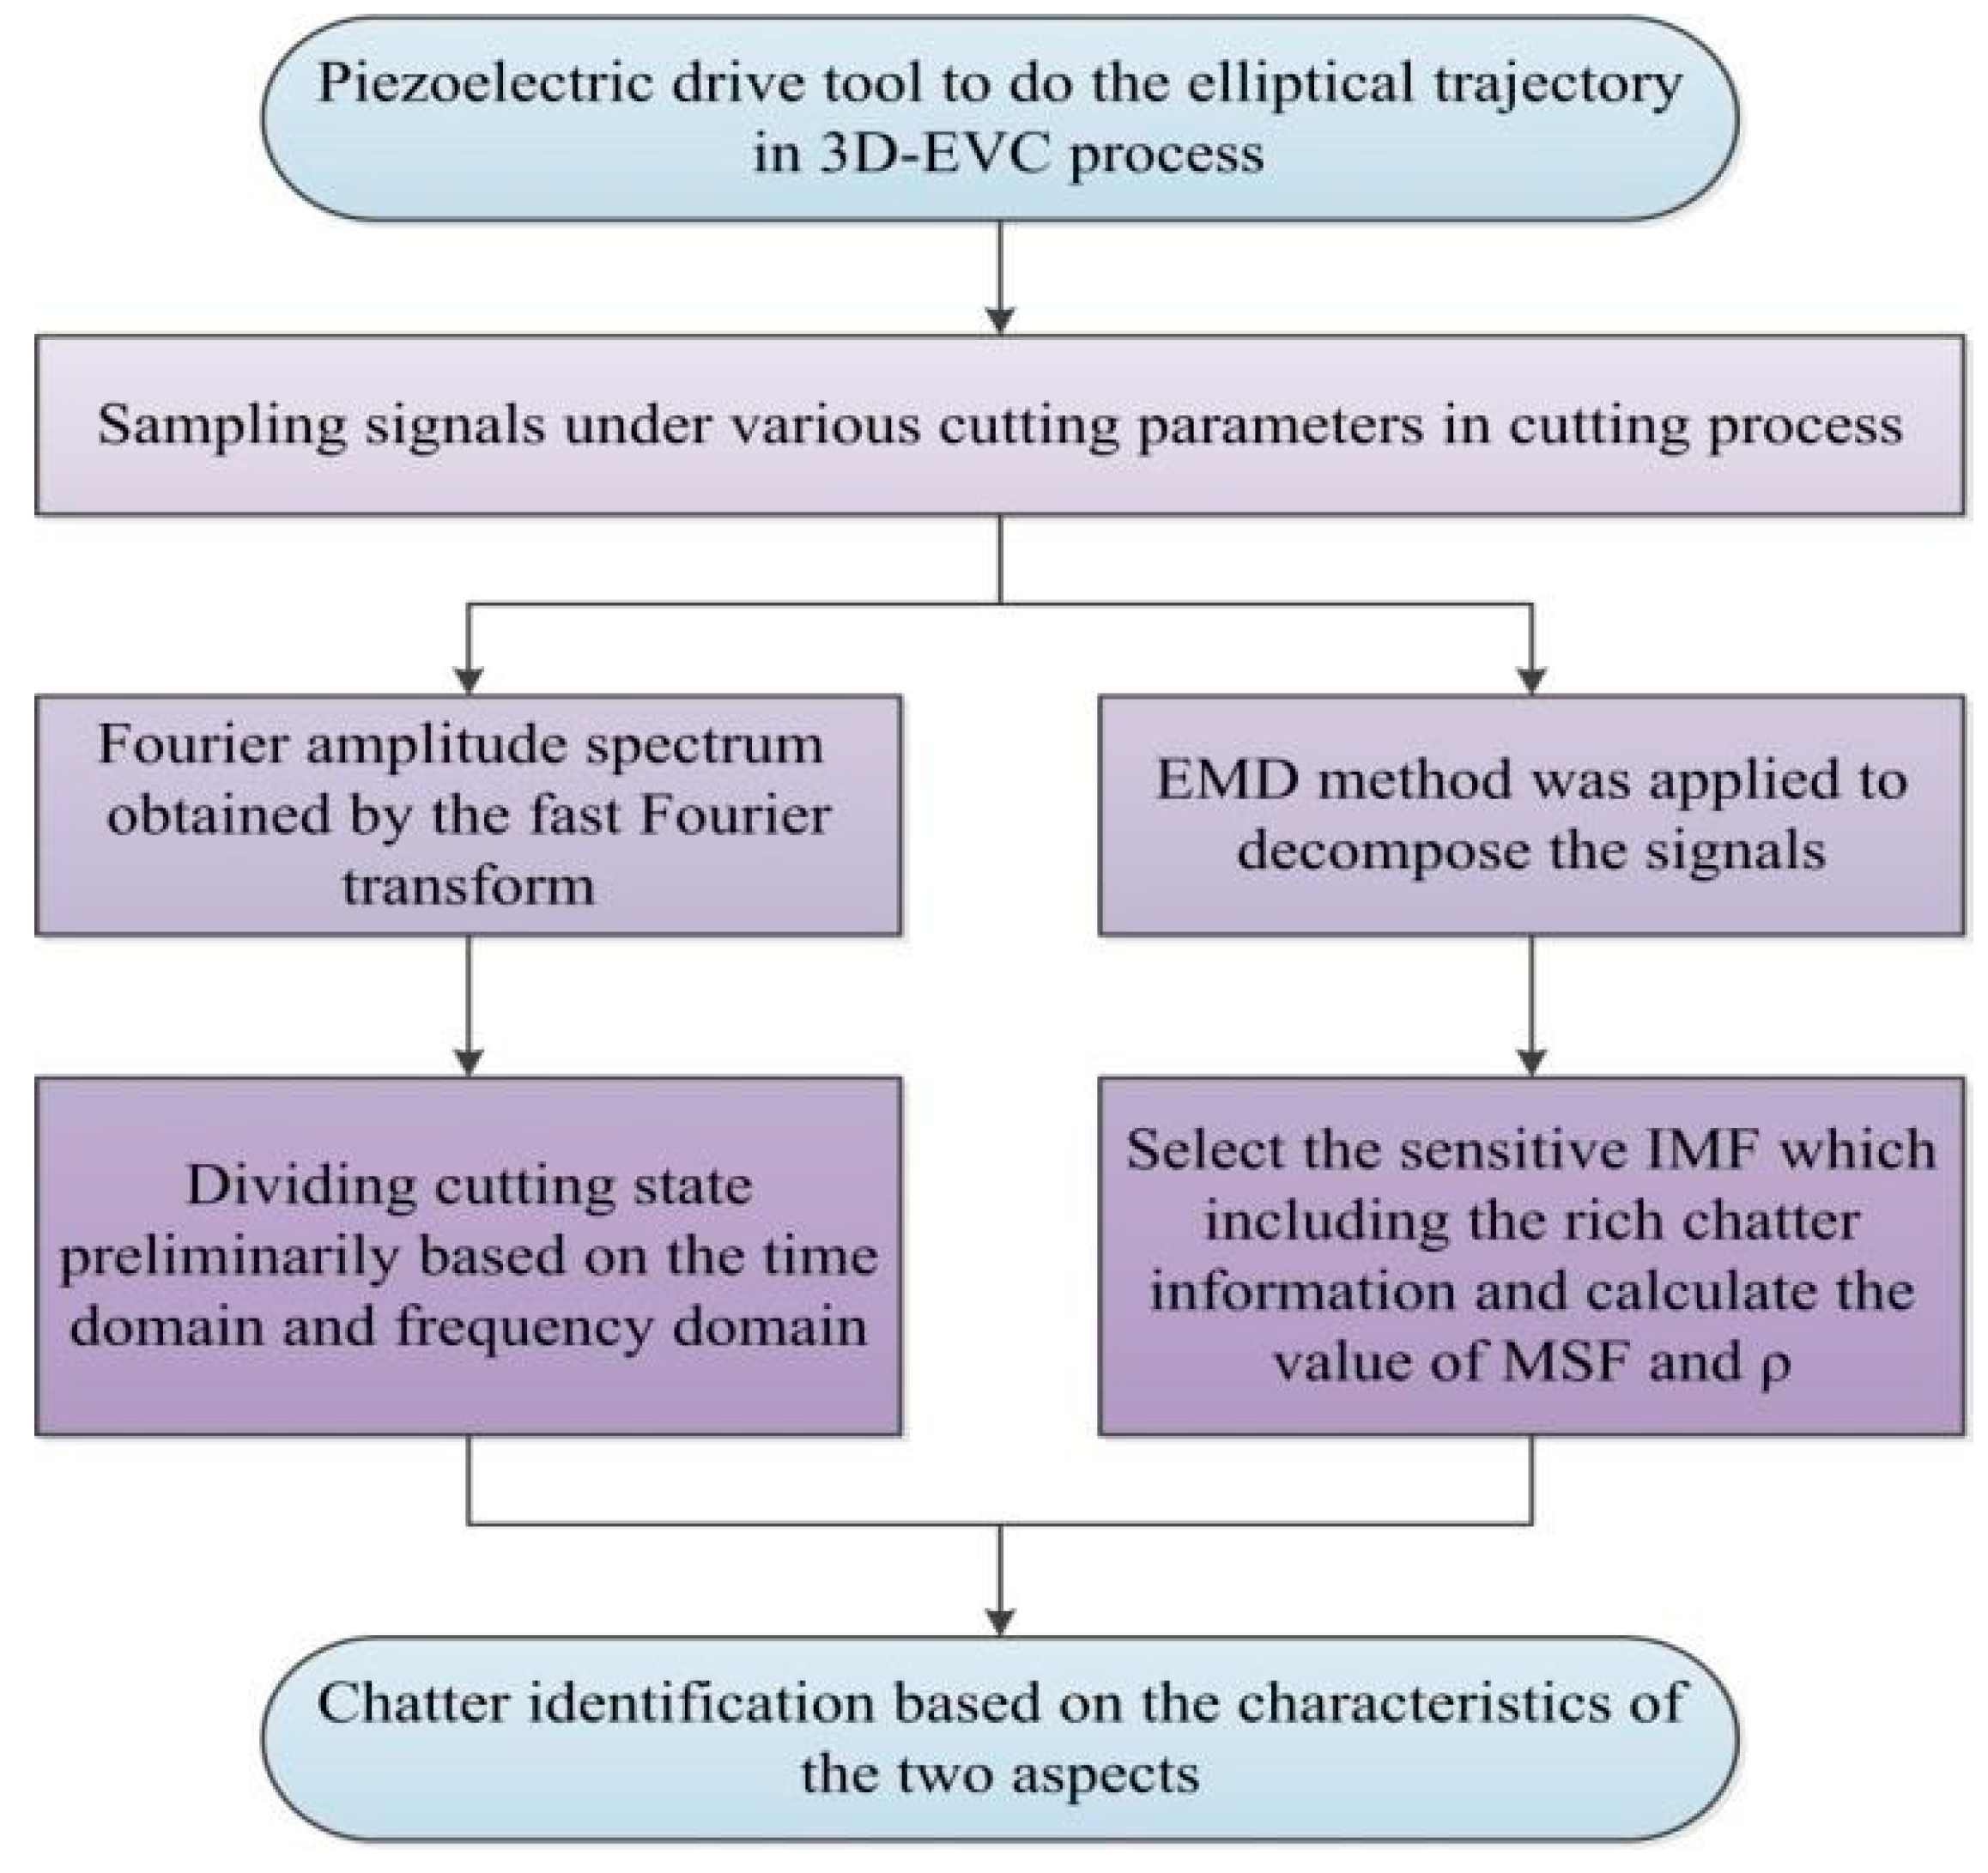
Based on the above research, this paper presents chatter identification based on the empirical mode decomposition (EMD) technique and feature extraction. The method of chatter identification developed is divided into two parts: initial identification and feature extraction identification. In 3D-EVC operations, the vibration signals are collected by displacement sensors and converted to frequency domain signals by fast Fourier transform (FFT), and the cutting state of the whole machining system is determined according to the change of frequency. The vibration signals are decomposed by EMD, a series of intrinsic mode functions (IMFs), so the instantaneous frequency can be reflected by the vibration signals at any point. Selecting the primary IMFs which contain rich chatter information as the object in feature extraction identification, two identification indexes, that is, the mean square frequency (MSF) and self-correlation coefficient (), were calculated from the primary IMFs using MATLAB software to judge the chatter phenomenon. In addition, chatter identification is organized as follows. First step is the fast Fourier transform (FFT) analysis of the time domain signal to observe whether the frequency changes during the cutting process. If there is a frequency domain mutation, it indicated that chatter occurs during the cutting process. The second step is eigenvalue identification, which serves two purposes. One needs to test the chatter identification result of the initial step by using two distinct eigenvalue changes during the cutting process. More importantly, the eigenvalue can reflect the state change of the cutting process to a certain extent, which is used as a theoretical basis for the online identification of chatter.
This paper is structured as follows.
Section 2 briefly introduces the signal processing method empirical mode decomposition (EMD), and describes the theory and strategy of the chatter identification. Then experimental setup and the cutting parameter setting are described in
Section 3. The results and discussions of the chatter identification method developed are given in
Section 4. Finally, the conclusions are given in
Section 5.
2. Theory of Chatter Identification
2.1. Empirical Mode Decomposition
With the rapid development of the time-frequency analysis, some signal processing technologies (such as short time Fourier transform, Wigner-Ville distribution and Wavelet transform) have the ability to analyze non-stationary and nonlinear signals. However, the methods of traditional time-frequency analysis have some limitations during analysis of non-stationary and nonlinear signals, such as a lack of adaptability. Compared with the methods of traditional time-frequency analysis, empirical mode decomposition (EMD) is more appropriate for analyzing the non-stationary and nonlinear signals. The EMD method can obtain clear instantaneous frequency and amplitude distribution and can reflect the time variation of total energy. This is very important for non-stationary and nonlinear signals. During the process of EMD, the vibration signal is processed smoothly, the fluctuations under different scales and the trend of the change are decomposed step by step, a series of data columns are generated with different characteristic scales, named the intrinsic mode functions (IMFs). The IMF obtained by the EMD is the approximate single-frequency signal which exists only at one frequency in every moment. It contains the real physical process in the vibration signals. In this method, the chatter phenomenon can be identified correctly by extracting the sensitive characteristic undesired vibration signal in each IMF.
In the process of EMD, if the local mean value is set to zero and has locally symmetric properties for a function or signal, then the essential condition of the mean instantaneous frequency is the same number of extreme points and zero-crossing points. Therefore, Huang et al. proposed the compact of the intrinsic mode function (IMF). These mode functions must satisfy the following two conditions:
- (1)
The number of extreme points and the number of zero-crossing points must be either equal or differ at most by one in the whole dataset.
- (2)
The local upper and lower envelope at any data point is symmetrical, which means the envelope of the local minimum value and the maximum value is zero.
The IMF reflects the inherent oscillatory of non-stationary and nonlinear signals, and there is only first -order oscillation mode in each of cycles. The phenomenon of mode mixing is nothingness. A typical of the IMF have the same extreme points and the number of zero-crossing points, at the same time, the upper and lower envelope is symmetrical about the time-axis, just exist a single frequency component at any time, as shown in
Figure 1.
In addition, the EMD method which decomposes the signal is based on the following three assumptions:
- (1)
The signal has two extreme points at least—a maximum point and a minimum point.
- (2)
The characteristic time scale is defined as the time interval of the adjacent extreme points.
- (3)
If the signal does not have the extreme point but an inflection point exists, then derivation is performed one or more times to obtain the extreme points before decomposing the signal, and the results can be obtained by integrating the corresponding component.
The following is the brief description of the EMD algorithm:
First, calculating all local extreme point for a given signal
, and forming the upper envelope by adopting the line cubic spline curve, and the lower envelope line also formed by the same way. The value of difference between
and the mean
of upper (E1) and lower (E2) envelope is
. Then the new data
are obtained as shown as follows:
Regard as the new signal , and repeat the above steps until meets the two required conditions of IMFs, where represents the first order IMF sifting from the original signal. In general, the first order IMF contains the highest frequency component of the signal.
Then obtain a difference signal
which removes the high frequency component after separated
from the original
:
where
is regarded as the new signal, and repeat the sifting process until the mean line between the upper and lower envelope line is close to zero at any point, denoted by
:
Finally,
could be represented as the sum of IMFs and a residual function:
where
is a residual function which represents the average trend of the signal. The IMF component
represents the signal components from high to low in different frequency, respectively. The flowchart of the EMD algorithm as follows in
Figure 2.
2.2. Principle of Chatter Identification
Because of the inevitability of vibration in the cutting process, the displacement signals collected in the 3D-EVC processes are actually nonlinear and non-stationary signals. In the process of 3D-EVC, the selection of the chatter signal is significant for correctly identifying instability phenomena. In the process of the specific chatter identification experiment, the signal selected during the 3D-EVC process should follow the following two points: (1) the change of the state in the cutting process can be reflected from two aspects of the time domain and the frequency domain; and (2) the assembly of the sensor cannot affect the stability of the whole cutting system.
In the traditional machining process, the common signals applied in chatter identification are mainly the tool tip vibration displacement signal, the cutting force signal, the sound signal and the cutting acceleration signal. However, 3D-EVC technology is an ultra-precision manufacturing technology, and the cutting process has high precision as the small cutting rate, high cutting speed, and low cutting depth. In addition, the displacement sensor is easy to assemble with the tool without affecting the whole cutting system characteristics with high resolution. Therefore, the displacement sensor is used to measure the vibration and displacement signals of the tool tip as the main signal for chatter identification in the process of 3D-EVC.
In the process of 3D-EVC, the vibration frequency under a stable machining state is the frequency of the tool tip vibration set in the 3D-EVC apparatus. In order to avoid the phenomenon of over cutting or not cutting during the process, the vibration frequency of tool ellipse is relatively low. In this paper, the vibration frequency of the tool tip in the three directions is set as 40 Hz, so the chatter frequency is higher than the original vibration frequency of the tool. When the cutting process becomes unstable during processing, the phenomenon of frequency shift will appear and the unstable frequency of chatter phenomenon during the cutting process will exceed the elliptical vibration frequency applied to the diamond tool in the non-resonant 3D-EVC apparatus. On the other hand, another important factor in the chatter identification strategy is the selection of chatter characteristics. There are many methods for extracting the features of the chatter state in the time domain and frequency domain. The mean square frequency (MSF) is an ideal characteristic value which could reflect the changing situation of the cutting signal in the frequency domain. MSF represents the weighted mean of the square of the vibration frequency, and the weight is the amplitude of the power spectrum. In the cutting process, the machining frequency is not a constant value due to the chatter appearance as a result of the change of cutting parameters, tool wear, the properties of the work-piece material and the processing mechanism under different processing methods, and so on. The chatter phenomenon will appear and the frequency of chatter gradually increase and exceed the elliptical vibration frequency applied to the diamond tool in the non-resonant 3D-EVC apparatus with the change of the cutting parameter. The formula of MSF is shown as the following:
In addition, the other parameter used for chatter identification is the one step self-correlation coefficient
. In general,
has a consanguineous relationship with the variety of energy in vibration signals, the value of
will reduce suddenly when the energy concentrates around the chatter frequencies when the amplitude of vibration signals becomes uneven with the chatter frequency. The value of
can be expressed as:
where
is the sampling interval, the value of
decreased with the increase of
.
If the signal contains a variety of harmonic components, then the value of
can be expressed as:
In general, the conventional fast calculation method is shown as the following:
where,
,
,
,
, respectively.
represents the sample data,
is one order difference,
and
represents the sampling point and the sampling interval, respectively.
Therefore, synthesizing two characteristic parameters of MSF and , which represents the characteristics of vibration signal in the frequency domain, the changes of vibration states can be reflected accurately.
2.3. The Flow Chart of Chatter Identification
The flow chart of chatter identification in the 3D-EVC process is illustrated in
Figure 3. Firstly, the driving signal is generated by Power PMAC controller (Delta Tau Data Systems, Inc., USA), and used for driving the piezoelectric stack in the cutting tool with the elliptical trajectory in three-dimensional space. The different vibration states can be obtained by changing the cutting parameters (the depth of cut, spindle speed or the feed rate). The vibration signal of the diamond tool in the processing of 3D-EVC was collected by the displacement sensors, and converted to frequency domain signal by fast Fourier transform (FFT), and the cutting state is determined (stable cutting, transient state and chatter state) according to the variation of frequency. On the other hand, the method of EMD is used for the vibration signals under various vibration states, selecting the sensitive IMFs which including the rich chatter information and calculate the value of MSF and
corresponding to three cutting states. Finally, the chatter phenomenon in the 3D-EVC process can be identified correctly based on the two aspects of change characteristics.
3. Experimental Setup
The proposed chatter identification method has been carried out in an ultra-precision machining machine, as shown in
Figure 4.
A copper bar is chosen as the work-piece and installed on the air spindle of the ultra-precision machining machine. The capacitive micro-displacement sensors with four measurement channels (Micro-sense DE 5300-013) are mounted on the handle of the apparatus to measure the vibration signals in three directions during cutting, the vibration signals are collected and then transmitted to the computer, which is used for data storage and signal processing. In addition, the power amplifier (PI, E-500), which has a criterion amplification factor 1060.1, is employed to amplify the driving signal. The Power PMAC controller generates the driving signals to drive the piezoelectric stack in the apparatus. The apparatus of 3D-EVC is driven by the piezoelectric hybrid, which, given the sinusoidal excitation signal, can be expressed as:
where,
,
and
are the given sinusoidal excitation signal in X, Y and Z directions of tool tip corresponding to the coordinate system in machine tools, respectively.
,
and
are the amplitudes of driving singles in three directions generated by three piezoelectric stacks, respectively.
represents the time. In addition,
,
and
are the angular frequency imposed on the piezoelectric stacks, and
,
and
are the phase of driving signal along X, Y and Z directions, respectively.
In order to compare the different cutting states during the cutting process, the value of spindle speed and the feed rate is fixed (90 rpm/min and 10 mm/min, respectively), the depth of cut is set to 5 μm, 10 μm and 20 μm, respectively. The cutting process was slotting with the oil mist cutting fluid. To avoid the phenomenon of overcut or the larger cutting marks between the two periods, the amplitude of piezoelectric driving signal is 6 μm. The detailed experimental conditions are listed in
Table 1, and the main parameters of the material are listed in
Table 2.
5. Conclusions
In this paper, a new chatter identification method based on signal processing was proposed to identify chatter phenomenon during the 3D-EVC process. The 3D vibration signals of the tool-tip are obtained by the displacement sensor, which is installed in the 3D-EVC apparatus, and the vibration signals were chosen as the object of decomposition, based on the visualized time and frequency domain data in the Z direction. The method of chatter identification developed is divided into two parts: initial identification and feature extraction identification. The amplitude spectrum obtained by FFT was used as a preliminary criterion for chatter identification. Then, the EMD method was employed to decompose the vibration signal including the rich undesired vibration information, the mean square frequency, and the one-step self-correlation coefficient, which were calculated as the identification criteria for identifying the chatter in the 3D-EVC process. The experimental results show:
- (1)
The vibration signals obtained by the displacement transducer and the amplitude spectrum obtained by FFT have reflected the trend of vibration state in the 3D-EVC process from the time and the frequency domain, respectively. The frequency shift phenomenon appeared with the vibration energy increasing gradually in the machining processes.
- (2)
Both the mean square frequency and the one step self-correlation coefficient have been changed suddenly in the cutting process. The value of the mean square frequency increases from 210 to 6800, in contrast, the value of the one step self-correlation coefficient reduces from 0.95 to 0.29. Therefore, these two parameters can be used as the index of the chatter phenomenon.
In future work, the effects of model parameters will be theoretically analyzed with stability lobe theory. Moreover, a chatter suppression method should be developed by combining sensorless chatter detection with an optimization algorithm.

 ,
, 


