Data Fusion of Multivariate Time Series: Application to Noisy 12-Lead ECG Signals


1
School of Electrical Engineering, Northwest Minzu University, Lanzhou 730030, China
2
Key Laboratory of China’s Ethnic Languages and Information Technology, Northwest Minzu University, Ministry of Education, Lanzhou 730030, China
3
New Energy (Photovoltaic) Industry Research Center, Qinghai University, Qinghai 810000, China
4
School of Automation, Beijing University of Posts and Telecommunications, Beijing 100876, China
*
Author to whom correspondence should be addressed.
Appl. Sci. 2019, 9(1), 105; https://doi.org/10.3390/app9010105
Submission received: 3 November 2018
/
Revised: 8 December 2018
/
Accepted: 22 December 2018
/
Published: 29 December 2018
(This article belongs to the Special Issue Complex Networks and Machine Learning: From Molecular to Social Sciences)
Abstract
:Twelve-lead Electrocardiograph (ECG) signals fusion is crucial for further ECG signal processing. In this paper, based on the idea of the local weighted linear prediction algorithm, a novel fusion data algorithm is proposed, which was applied in data fusion of the 12-lead ECG signals. In order to analyze the signal quality comprehensively, the quality characteristics should be adequately retained in the final fused result. In our algorithm, the values for the weighted coefficient of state points were closely related to the final fused result. Thus, two fuzzy inference systems were designed to calculate the weighted coefficients. For the sake of assessing the performance of our method, synthetic ECG signals and realistic ECG signals were applied in the experiments. Experimental results indicate that our method can fuse the 12-lead ECG signals effectively with the quality characteristics of original ECG signals inherited properly.
1. Introduction
ECG records the physiological information of cardiac activity by deploying electrodes placed at different positions of the body, which is widely applied in clinical diagnosis and monitoring. However, ECG recordings gathered in clinical settings are often contaminated by noise and artifacts. Due to the overlapping frequency bands and similar morphologies in noise and ECG signal [1,2], the distorted characteristics of ECG signal result in false alarms (FA) in intensive care unit (ICU), and imprecise measurement of ECG signals [2]. Thus, ECG signal quality assessment is necessary for further ECG signal processing.
The aim of ECG quality assessment algorithm is to extract the characteristics of the ECG signal appropriately [3,4,5,6,7,8,9,10,11,12,13,14,15,16]. Time-domain characteristics or frequency-domain characteristics are used, among the majority of the proposed algorithms. For the time-domain instance, Moody et al. adopted the Karhumen–Loeve basis functions to represent the QRS complex and employed the residual error of the reconstructed QRS complex to estimate the instantaneous noise of the original signal [3]. In the frequency-domain instance, via a long-term ECG recording from the coronary care unit, the frequency content and the number of times ECG exceeds a preset limit were used to analyze the ECG quality [4]. Kalkstein et al. employed machine learning methods to identify data collection problems at 12-leads ECG [5]. In [6], Chudacek et al. devised five simple rules to detect the most common distortions of the ECG signal. In [7], an ensemble of decision trees was used to assess the usability of ECG signals. In [8], Jekova et al. presented a method for scoring the noise level via the ECG amplitude, powerline noise, baseline wander, electromyography (EMG), and peak artifacts.
Clifford et al. proposed some signal quality indices (SQIs), which involve both time-domain and frequency-domain characteristics, and can partly reflect the state of the ECG quality [9]. In [10], Li et al. developed four novel signal quality indices and enriched SQIs in some way. In [11], Li et al. studied a multi-level ECG quality assessment method based on a support vector machine. In this paper, thirteen signal quality indices were derived from the ECG signals, which were used for multi-level ECG quality classification. In [12], a naive Bayes classifier, a novel set of signal quality indices (SQIs), and an existing adaptive Kalman filter were used for noninvasive fetal ECG signal quality assessment. In [13], multiple signal quality indices and machine learning were used to divide the acceptable and unacceptable ECG segments. Satija et al. presented an overview of ECG signal quality assessment methods and highlighted the limitations of these algorithms [14]. Chen et al. introduced Dower transformation to convert 12-lead ECG signals to 3-lead vectorcardiogram (VCG), which are properly decomposited by multiscale recurrence analysis in each scale [15]. Wavelet analysis is also an effective algorithm for handling nonlinear and nonstationary signals. However, VCG signals are decomposed into a series of multiple wavelet scales and this increases the amount of pending data observably. In other words, in [15], the application of multiscale recurrence analysis virtually weakens the original intention of the Dower transformation. Shahriari et al. employed a structural similarity measure to compare images of two ECG signals and the representative ECG images were chosen as templates for the ECG signal quality assessment [16]. In [17], via the features of 12-lead ECG signals, Agrafioti et al. addressed the identification of different human individuals, where the autocorrelation method and linear discriminant analysis were used to extract the features of the ECG segments from different leads. These features were combined further at the decision level by various voting principles. Yu et al. developed a specific fusion method to detect multi-channel maternal ECG R-wave peak locations by a single-lead ECG R-peak detection algorithm [18]. For human activity recognition, feature fusion is commonly employed to measure the features of each lead of the multi-lead ECG signals [19]. However, the aforementioned methods can only be performed on a single-lead ECG signal. Once facing multi-lead ECG signals, the signal of each lead must be analyzed individually; thereby the computational efficiency is reduced.
The motivation for this work originates from a purpose to comprehensively assess the quality of 12-lead ECG signals and effectively reduce the computational complexity. The key solution lies in converting the 12-lead ECG signals into a single-lead physiological signal with the quality characteristics of original signals being inherited in the single-lead signal as much as possible.
Few papers in the literature have discussed the data fusion of multi-lead ECG signals. Analogously, in [20], Cong et al. presented the multivariate data fusion algorithm (MDF), which was applied to in multivariate phase space reconstruction of oil film whirling in the rotor system. The features of the system in the fused results can be used in fault diagnosis. For the fusion of multi-lead ECG signals, we carried out some preliminary theoretical and experimental research [21,22]. In these studies, the multi-lead ECG signals were converted into a single-lead signal via the local weighted zero-order model. The weighted coefficients of the model were further estimated by the information of the Euclidean distance between two adjacent state points and the angle between two neighboring vectors, respectively. Previous studies implied that ECG signals are chaotic [23]. For chaotic signals, the local weighted linear prediction algorithm (LWLPA) has been widely used in the prediction of chaotic time series. Inspired by LWLPA, in this paper, we propose a novel data fusion algorithm (NDFA) for 12-lead ECG signals, which can integrate the qualitative characteristics of 12-lead ECG signals into a single-lead signal adequately.
The main contributions of the paper are threefold: (1) In this paper, how to compress the number of the leads for 12-lead ECG signals is addressed firstly; (2) as the ECG signals possess chaotic characteristics, based on the idea of LWLPA, NDFA is applied to fuse 12-lead ECG signals; and (3) To reserve the quality characteristics of ECG signals as much as possible, in NDFA, two fuzzy inference systems are designed to calculate the weighted coefficient of each lead ECG signal properly.
The outline of the rest of this paper is as follows: In Section 2, LWLPA is briefly discussed as preliminary; Section 3 introduces NDFA, based on LWLPA; the performance of NDFA is evaluated by synthetic ECG signals and realistic ECG signals in Section 4; and finally, Section 5 contains the conclusion.
2. The Local Weighted Linear Prediction Algorithm
In the course of signal quality assessment of 12-lead ECG signals, compressing the pending ECG data is effective for further improving the efficiency of the assessment algorithms. Since cardiac signals reveal the possibility of deterministic chaos, here LWLPA—an important prediction method of chaotic time series—was used to fuse 12-lead ECG signals. In this section, as a preliminary, we briefly review the algorithm, which is closely related to NDFA.
For the chaotic time series , the dynamics characteristics of the chaotic time series can be well reflected in m-dimensional space through vectors , , where m is the embedding dimension and the delay time. Takens F. [24] proved that if the embedding dimension m and delay time can be chosen appropriately, the regular evolutionary trajectory of chaotic systems could be completely reconstructed and revealed in an m-dimensional space. Suppose that Xk is the current state point of the chaotic system, and the future state Xk+1 of the system needs to be predicted. In LWLPA, the neighboring states of the current state point Xk need to be chosen from the reconstructed trajectories. With the neighborhood Xki and the linear prediction model , where , the future state Xk+1 can be approximately estimated.
In LWLPA, the neighboring vectors are effectively used to predict the future state of the chaotic time series via the linear prediction model. From the data compression perspective, neighboring points in the reconstructed space are converted to an estimated state point. Inspired by the method, NDFA will be devised in the next section.
3. The Novel Data Fusion Algorithm
As the most important section of this paper, the basic idea of the NDFA algorithm will be briefly introduced in Section 3.1. Both the significance of weighted coefficients in NDFA and how to obtain these appropriate parameters will be discussed in Section 3.2. NDFA is summarized in Section 3.3.
3.1. Basic Idea of Novel Data Fusion Algorithm
How to significantly improve the efficiency of ECG quality assessment algorithm is a realistic issue. It will facilitate solving this problem if the pending 12-lead ECG signals are compressed effectively. Evidently the LWLPA algorithm can successfully meet the requirement of the problem above.
To illustrate the basic idea of our algorithm, an example will be given. According to the phase space reconstruction theorem, consider the two reconstructed phase trajectories L1 and L2, shown in Figure 1. In this example, suppose that the trajectory LF is the fused result of the trajectories L1 and L2. Furthermore, the state point XF on the trajectory LF should satisfy the linear prediction model , where . Here, how to obtain the parameters a and b in the linear prediction model is a critical problem.
From the point of LWLPA, in Figure 1, the vectors X1(p) and X2(p) can be regarded as the neighboring vectors of the current state XF(p). With the two vectors being employed, we can calculate the parameters a and b by (5). The equation is as follows:
where is the weighted coefficient, which reflects the degree of impact from the state point to the fusion result. Then the fused state can be calculated as:
The fused trajectory LF will be employed for the original signal quality assessment. It implies that to some extent, the characteristic information of original signal ought to be fused in the trajectory LF. Here, how to effectively inherit the characteristic information by fused result is a key for NDFA.
In Figure 1, there is an evident amplitude of the point X1(p − 1) on the trajectory L1 and the time-domain characteristic should be well inherited in the fused trajectory LF. Thus, based on Equation (1), a greater value for weighted coefficient of the state X1(p − 1) should be chosen, which will further enhance the impact on the final result. Here, the Euclidean distance of two neighboring points and the angle between two neighboring vectors on evolutionary trajectory L are used to estimate the weighted coefficients. In Figure 1, X1(p) and X2(p) are the p-step state points on the evolutionary trajectories L1 and L2, respectively. The vector can be easily calculated through two adjacent state points, e.g., for the evolutionary trajectories L1, , and then the angle can be obtained via the two neighboring vectors and . The modulus of vector is the Euclidean distance between X1(p) and X1(p − 1). For the lth evolutionary trajectory Ll, the modulus of vector and the angle can well reflect the evolutionary trend of the trajectory. In Figure 1, for the trajectory L1, the values of the modulus of , and the vector angles , are greater than the values of the trajectory L2 at the same step. Characteristics of evolutionary trajectory can be described objectively by them. According to the idea, the change of evolutionary trajectory is positively related to the values of the two parameters. Based on the relationship, the weighted coefficient of the data point can be approximately estimated.
3.2. Fuzzy Inference System Design for NDFA
As an important application of fuzzy logic and fuzzy sets theory [25], the fuzzy inference system (FIS) has been successfully applied in decision support and other subjects. FIS is useful for dealing with linguistic concepts, via achieving nonlinear mappings between inputs and outputs. In this subsection, two simple FISs; FISd and , will be devised, which can be used to estimate the weighted coefficients of LWLPA by the modulus of vector and the angle, respectively.
Here, FISd is applied to estimate the evolutionary trend of the reconstruction trajectory by the modulus D of the vector and the change rate Dr of the modulus of adjacent vectors. Thus, in FISd, there are two input variables D, Dr and one output variable Od.
The two variables D and Dr can be calculated as:
where D(p) and Dr(p) are the Euclidean distance and the change rate of X(p) at p-step, respectively.
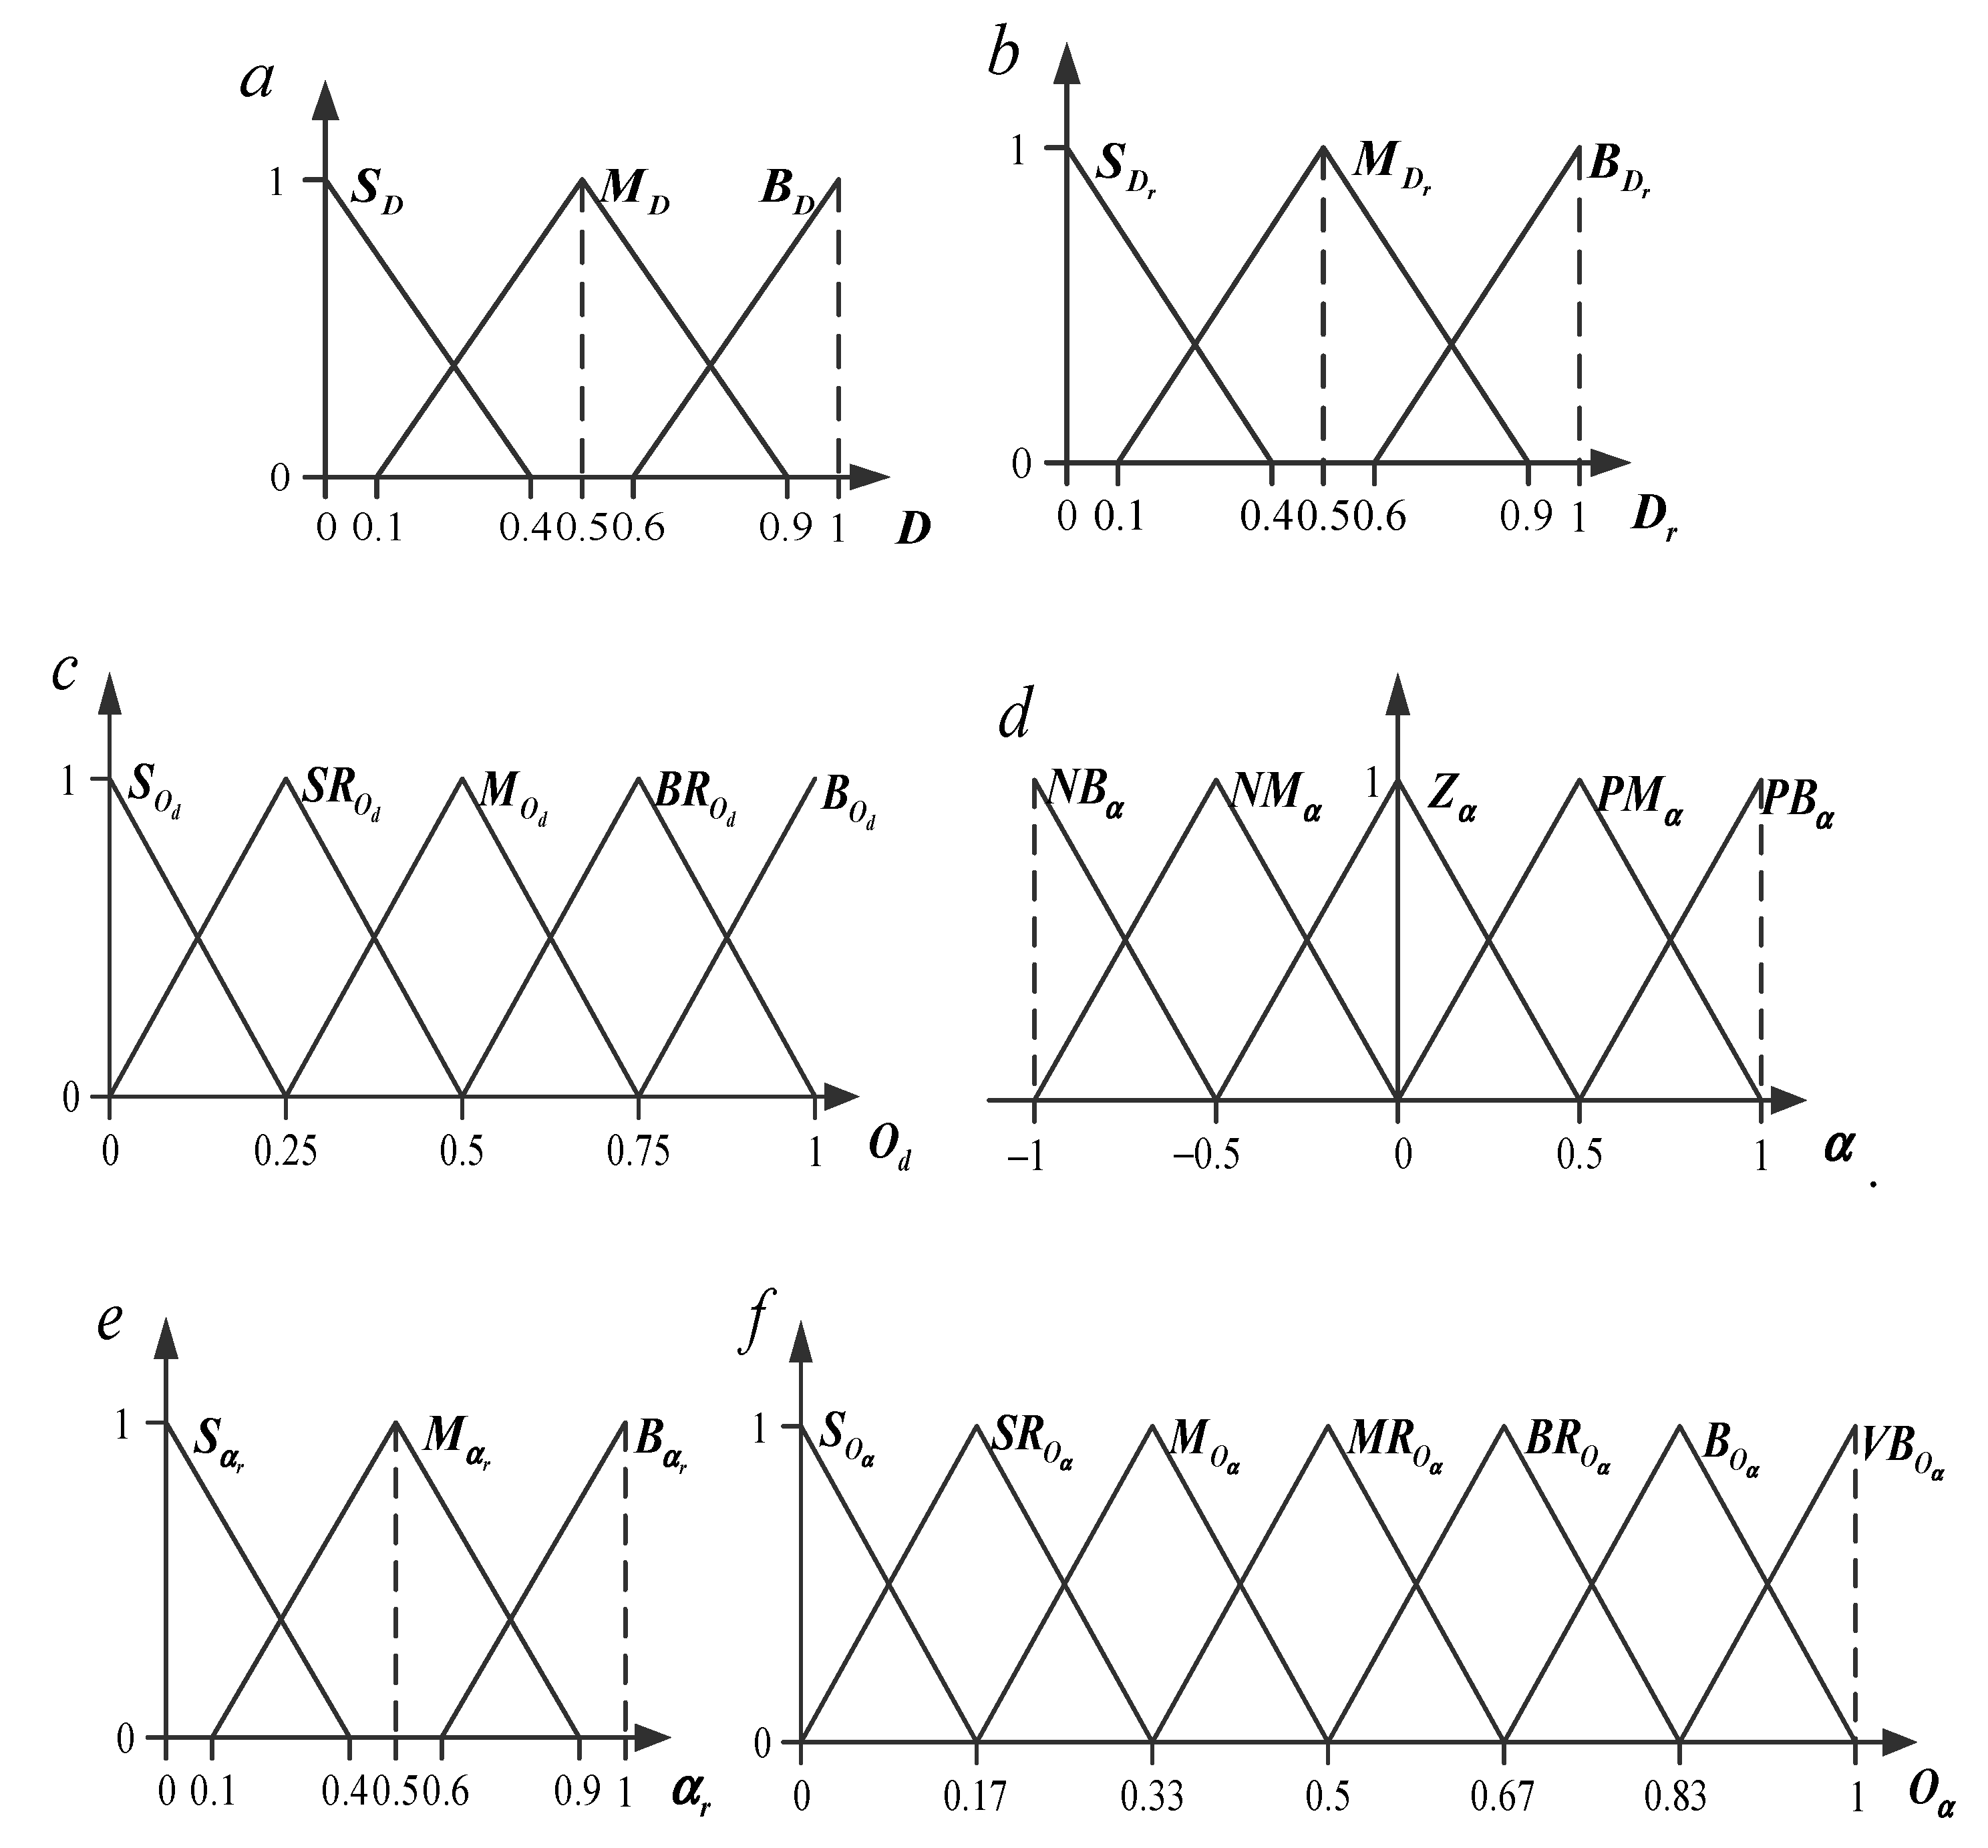
In the further design of FISd, the universe of the three variables D, Dr and Od are set within the interval [0,1] uniformly. The universe of the variables D, Dr and Od are divided into several fuzzy sets and the numbers of the fuzzy sets are 3, 3 and 5, respectively, shown in Figure 2a–c. According to the aforementioned relationship, the inference rules of FISd can be designed properly, which are summarized in Table 1. Based on FISd, the evolutionary trend of trajectory is estimated quantitatively and the parameter can be calculated as:
where is the number of rules of FISd, is the output of the qth rule and the rule activation for the qth rule.
Similarly, the change of the reconstruction trajectory can also be reflected by the angle of the adjacent vectors. Thus, according to the aforementioned relationship, the fuzzy inference system can be similarly designed. consists of two inputs variables , and one output variable . The two input variables are the arc-cosine angle of and the change rate of the cosine function, which can be obtained as:
where is the angle between two neighboring vectors V(p) and V(p − 1); and the change rate of the cosine function at p-step.
In the design of , the universe of the input variable is set within the interval [−1,1] and the other two variables, and , are set within [0,1]. The universe of the variables is divided into five fuzzy sets and the number of the fuzzy sets of the other two variables, and , are 3 and 7, respectively, shown in Figure 2d–f. Based on the aforementioned analysis, the inference rules of is devised to describe the relationship between the change of trajectory and the angle of neighboring vectors felicitously, which are summarized in Table 2. With being employed, we can obtain the quantitative parameter , which is computed as:
where is the number of rules of , is the output of the qth rule and the rule activation for the qth rule.
The two parameters and can describe the change of the reconstruction trajectory from the modulus of the vector and the angle between neighboring vectors perspectives, respectively. Thus, the parameters and should be comprehensively calculated as:
where and are the values of the data point at p-step.
For the lth evolutionary trajectory Ll, the weighted coefficient in the Equation (1) can be computed as:
where the Ln is the number of the phase trajectories and the parameter is set to 1 [26]. Here, the minimum value needs to be selected.
3.3. NDFA Algorithm
Now the weighted coefficient of point on evolutionary trajectory can be calculated. By utilizing the weighted coefficients, the NDFA algorithm can successfully accomplish the task of data reduction. The steps of the approach are listed as follows:
(1) Choose the proper embedding dimension mmax, delay time , initial condition XF(0), and for each lead of 12-lead ECG signals, construct the vector Xl as:
where and Xl is the evolutionary trajectory of the lth lead ECG signal on reconstructed trajectory. XF(0) is chosen as centroid of all the neighbor neighboring vectors , which is the point of the reconstruction trajectory of the sth lead ECG signal at p = 0.
Here the embedding dimension and delay time should be selected as:
(2) For the lth evolutionary trajectory Xl, calculate the parameters D(p), Dr(p), and by Equations (3), (4), (6), and (7), respectively. With the two FISs, and being properly estimated, the weighted coefficient of the state Xl(p) at the p-step can be computed by Equation (10).
(3) Compute linear fitting parameters a and b by the least square equation:
where .
(4) Through the linear prediction equation, the final fused state XF(p + 1) is calculated as:
In this section, NDFA for 12-lead ECG signals is introduced. In the algorithm, the linear prediction equation is used to compute the fused state. With the qualitative characteristics of original signal preserved, the weighted coefficient of each reconstructed trajectory is estimated through FIS properly. In the next section, the algorithm will be applied to 12-lead ECG signals and the performance of this algorithm will be further illustrated.
4. Application of NDFA in 12-Lead ECG Signals
In this section, for the sake of assessing the performance of NDFA, synthetic ECG signals and realistic ECG signals are applied in the experiments. In Section 4.1, we evaluate the validity of NDFA by synthetic ECG signals. Then based on three types of noises from the MIT-BIH Noise Stress Test Database (NSTDB) [27,28], the noise tolerance of the algorithm will be analyzed in detail. In Section 4.2, NDFA is executed on the database of PhysioNet/Computing in Cardiology Challenge 2011 [29], and the MIT-BIH database to further illustrate the performance of the algorithm. It is worth mentioning that, in this study, the False Nearest Neighbors (FNN)and the Average Displacement (AD) algorithms were adopted to determine the optimal embedding dimension ms and delay time .
4.1. Synthetic Signals Experiments
4.1.1. Ideal Synthetic Signals Experiments
As realistic ECG signals are recorded in clinical environment, the signals would be contaminated inevitably by the noise and artifacts with different magnitudes. To solve this problem, synthetic ECG signals were widely applied in estimating the performance of the algorithm. In [30], McSharry et al. proposed a dynamical model for generating synthetic ECG signals. Based on the idea of systems dynamics, Sameni et al. [31] and Clifford et al. [32] developed an improved dynamical model, which can generate 12-lead synthetic ECG signals. In the experiment, ideal VCG signals were obtained via the model, as shown in Figure 3 and it will be employed for testing the performance of NDFA.
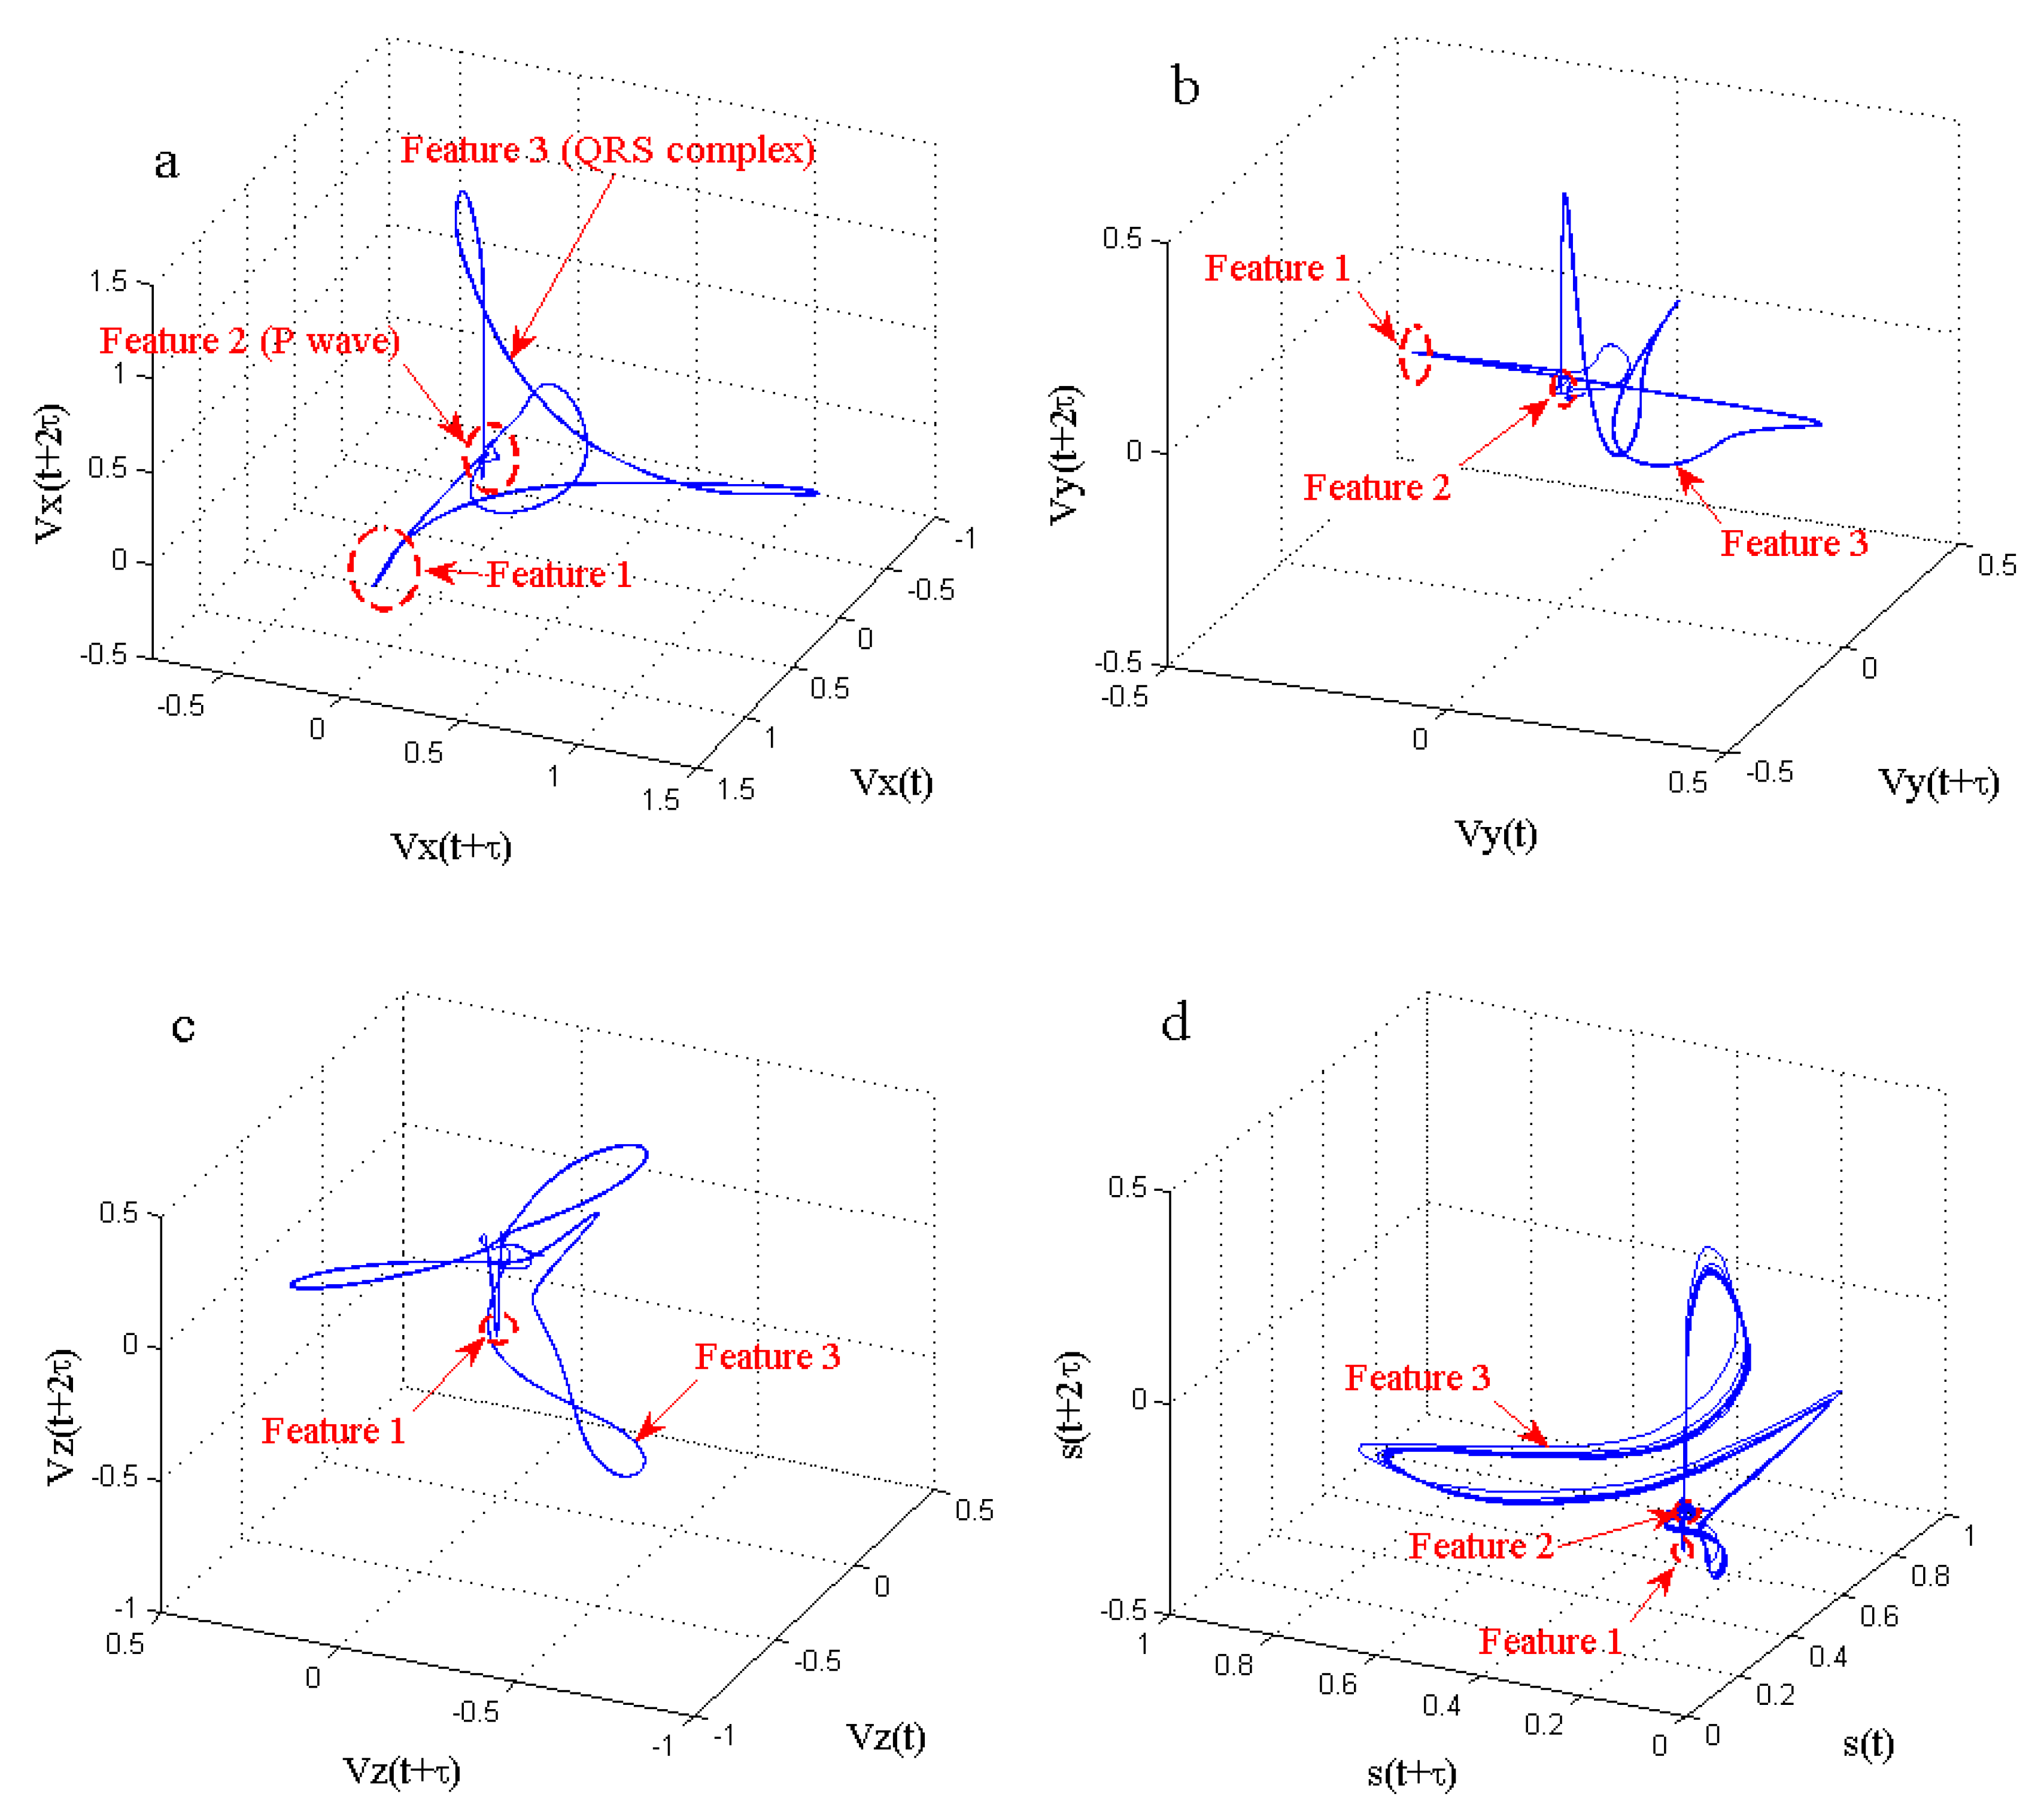
Figure 4a–c represent the reconstructed trajectories of Vx, Vy and Vz, respectively. Figure 4d represents the fused signal of VCG signals s. From the morphology of reconstructed trajectory perspective, it is clear that there are needle-like features (Feature 1) on the three trajectories. Meanwhile, the longer closed trajectory (Feature 3) and disordered feature of the closed trajectory within a small space (Feature 2) are shown distinctly in Figure 4a–c. In Figure 4a, the local trajectories of Features 2 and 3 essentially reflect the P wave and QRS complexes in ECG signal, respectively. Evidently, the three features of original VCG signals are well described by the fused trajectory s.
Correlation Coefficient and Procrustes distance [33,34,35] are widely used in similarity measure. Although ECG signals possess the non-stationary characteristic, the signals within a short time span are stationary and predictable relatively. Therefore, in order to manifest the advantage of NDFA more objectively, Correlation Coefficient (Cor) is introduced to assess the performance of our algorithm. Cor is defined as:
where the similarity of two reconstructed trajectories can be described quantitatively by parameter Cor.
Here, to illustrate the similarity of these signals integrally, the mean values of the VCG signals and the fused signal s need to be calculated. Via Equation (16), the mean value of correlation coefficients , and is 0.3540. Analogously, the mean value of correlation coefficients , and is 0.5517. The results illustrate that the three features of original signals Vx, Vy, and Vz are well preserved in the fused signal.
4.1.2. Noise Contaminated Synthetic Signals Experiments
In this subsection, the trajectory fusion problem of the noisy VCG signals will be discussed. To ensure the objectivity of experiment in this study, realistic noises were adopted from NSTDB and the three types of realistic noise, baseline wander (BW), electrode movement (EM), and muscle artifact (MA) are shown in Figure 5, respectively.
To further illustrate the validity of NDFA, the three types of noise, BW, EM and MA, were added to clean synthetic VCG signals with different magnitudes of signal noise ratio (SNR). Twelve-lead ECG signals were transformed to 3-lead VCG signals by linear transformation. It means that the signal quality of 12-lead ECG was inherited to some degree. In other words, if one lead signal in 12-lead ECG signals is contaminated by noise, the quality characteristics of the lead signal will also be reflected in the VCG signals. In the experiment, the lead Vx of VCG signals is randomly chosen, which is contaminated by the noise. The parameters of the SNR levels are summarized in Table 3 [11].
Here the lead Vx is polluted by BW and the magnitudes of SNR are 12 dB, 6 dB, 0 dB, and −6 dB, respectively. In Table 4, correlation coefficient is the mean value of Cor(Vx,Vy) and Cor(Vx,Vz). The parameter is the mean value of Cor(s,Vx), Cor(s,Vy), and Cor(s,Vz). The values of parameters and reflect the degree of correlations between the original and fused signals. From Table 4, we can find that, under the different SNR levels, the correlation coefficient is greater than consistently, thereby designating the effectiveness of NDFA.
Analogously, here the clean Vx signal is polluted by the noise of EM and MA with different magnitudes of SNR and the correlations coefficients are calculated in Table 5 and Table 6. In the two tables, the relations between noisy signals and fused results are highly consistent with the relation reflected in Table 4.
With the experimental results being comprehensively analyzed under different conditions, it suggests that with NDFA being employed, the reconstructed trajectories of fused results can effectively describe the quality characteristics of noisy synthetic ECG signals. In order to test the performance of our method adequately, some realistic ECG signals will be applied in Section 4.2.
4.2. Realistic Signals Experiments
As an important database, PhysioNet/Computing in Cardiology Challenge 2011 has been widely used for testing the ECG quality assessment algorithms. In the database, standard 12-lead ECG signal is sampled at 500 Hz and recorded for 10 s. There are 1000 12-lead ECG records to be employed as the train set (Set A), with the signal quality being quantified by a group of annotators being professional in ECG analysis. In Set A, 773 ECG records were acceptable, 225 signals were unacceptable, and the remaining were indeterminate. In this subsection, four sets of realistic 12-lead ECG signals were randomly selected from set A for assessing the performance of NDFA. The quality of No. 1027085 and No. 1075113 was acceptable, and the quality of No. 1063069 and No. 1003574 was unacceptable.
In order to analyze the ECG signal quality, the realistic ECG signals needed to be pre-processed before quality assessment. Firstly, each lead of the 12-lead ECG signals was examined for the constant signal detection. If some constant signals were contained in the ECG signals, then the realistic signal needed further processing and it was identified as being unacceptable. Otherwise, the 12-lead ECG signals were transformed into VCG signals by the inverse Dower transformation matrix [36] under the following equation:
where Dinv is given by
Based on the transformation, the quality characteristics of original signals can be completely inherited by VCG signals.
Via NDFA, the VCG signals and reconstructed trajectory of fused result for the signals of No. 1027085 and No. 1075113 are shown in Figure 6a,b. As the qualities of the two signals were acceptable, the VCG signals demonstrated periodic changes and significant physiological meaning. Furthermore, the reconstructed trajectories of the fused results implied the regular evolutionary characteristics. On the contrary, the other two realistic signals were unacceptable. From Figure 6c,d, the VCG signals and fused results indicated discursive and unsystematic evolutionary characteristics.
In order to intuitively estimate the performance of NDFA further, the ECG segment of No. 106 from MIT-BIH database was extracted. The duration of the ECG segment was 1.11 s, which was sufficient for all features of the ECG signal to be contained. Via NDFA, two lead ECG signals of the signal segment were fused and the results are shown in Figure 7. Figure 7a is the reconstructed trajectory of the lead MLII, and two characteristics of the trajectory morphology can be well reflected. In the figure, there is a longer closed trajectory (Feature 2), which is the reconstructed trajectory of the QRS complex. Furthermore, the reconstructed trajectory of the P wave appears as the unordered characteristic of the closed trajectory (Feature 1). Figure 7b is the reconstructed trajectory of the lead V5, which similarly contains two features, Feature 1 and Feature 2. As the key features, the two features need to be well reserved in the fused trajectory. The fused result of the ECG segment is shown in Figure 7c. We can find that the two features were contained in the fused trajectory evidently.
4.3. Performance Comparison of Data Fusion Algorithms
The MIT-BIH database is a source for standard ECG test available, and the database has been applied in the fundamental research. Each ECG recording in the database contains two leads, MLII and V5, which are sampled at 360 Hz and recorded for 10 s.
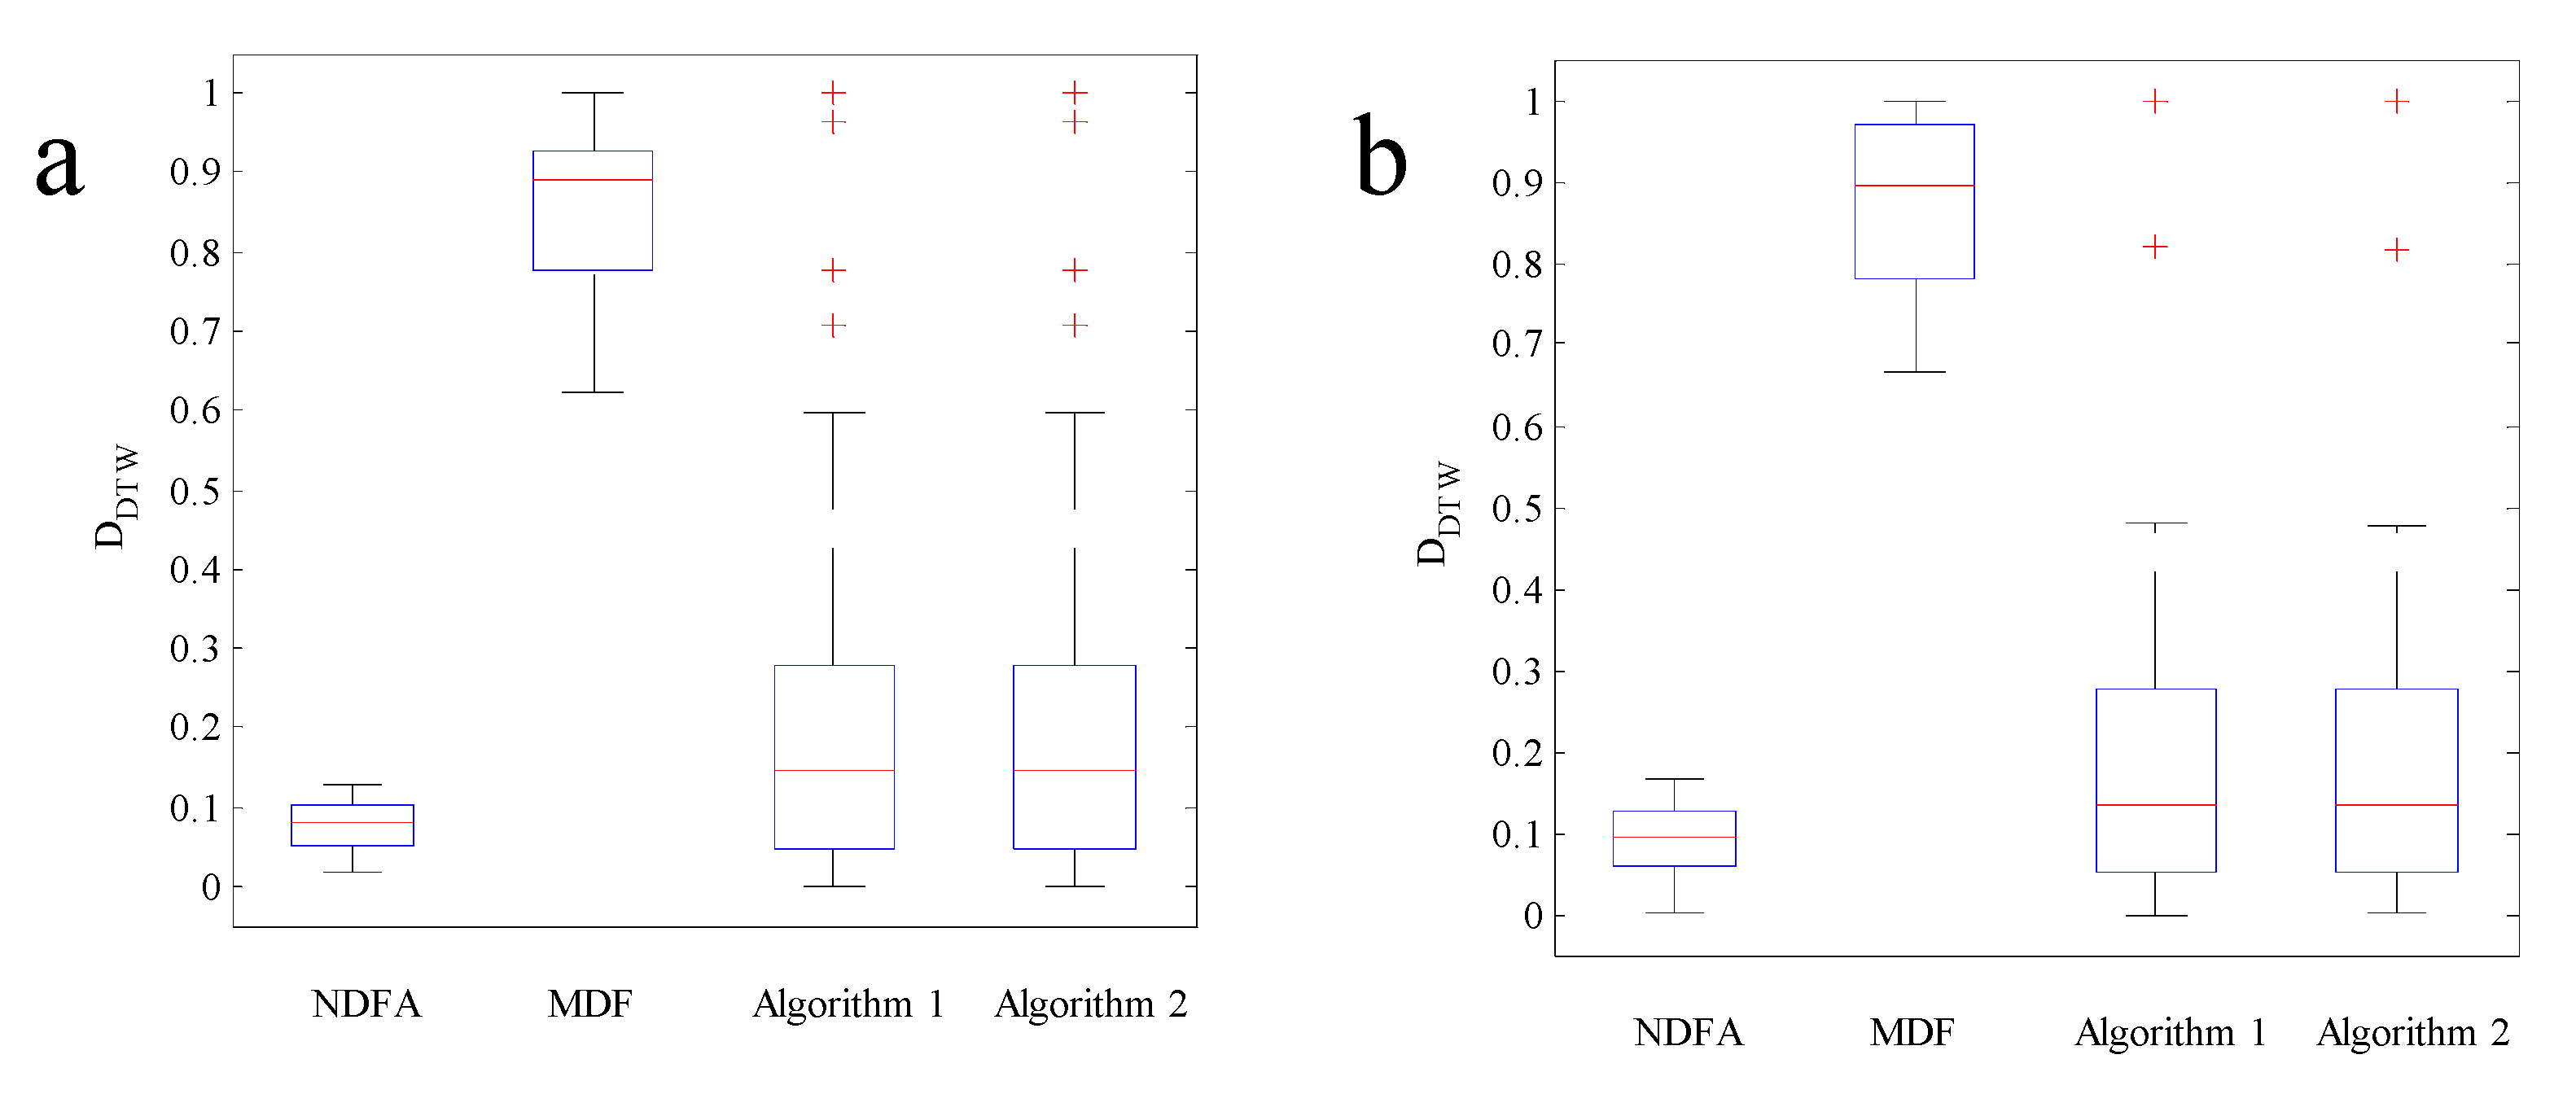
Here, the four data fusion algorithms, NDFA, MDF, the algorithm 1 [21], and the algorithm 2 [22], were applied in the MIT-BIH database. With the experimental results of the four data fusion algorithms compared, the advantages of NDFA were well manifeste. In the experiment, two lead ECG signals; MLII and V5, were fused by the four algorithms, respectively. To show the advantage of NDFA, the similarity of the fused signals and the original ECG signals were calculated by the Dynamic Time Warping Algorithm (DTW), objectively. DTW is a well-known technique to describe the level of the similarity of the two warped time sequences. The algorithm has been successfully applied in automatic speech recognition [37]. Here, the similarities of two lead ECG signals and the fused signals were calculated by DTW. Then the numerical values of the results were normalized further. The degree of the similarity between the original and fused signals were reflected by the normalized results, DDTW, and the smaller value of DDTW implies that the morphology features of two signals were somewhat similar. Figure 8a shows the similarity between the fused signals by four algorithms and the lead MLII. The means and variances of the parameter DDTW derived by NDFA, MDF, algorithm 1, and algorithm 2 were 0.0616, 0.0011; 0.8474, 0.0110; 0.2257, 0.0645; 0.2256, and 0.0644, respectively. Analogously, for fused signals and the lead V5, the means and variances of the parameter DDTW based on NDFA and MDF were 0.0921, 0.0017; 0.8768, 0.0102; 0.1959, 0.0426; 0.1958, and 0.0425 in Figure 8b. As can be seen, via NDFA, the means and the variances of the parameter DDTW were smaller, compared with the experiment results under the others. Figure 8 demonstrates that the characteristics of two leads ECG signals, MLII and V5, can be well reserved on the fused signal yielded from NDFA, and reflects that the performance of our algorithm exceeds MDF, algorithms 1 and 2.
In this section, NDFA is evaluated by the two databases of PhysioNet/Computing in Cardiology Challenge 2011 and MIT-BIH, respectively. Experimental results indicate that the fused trajectory can effectively inherit the quality characteristics of the realistic ECG signals.
5. Conclusions
In this paper, NDFA was proposed, which utilizes the idea of LWLPA to fuse 12-lead ECG signals. Meanwhile, two fuzzy inference systems were designed for effectively inheriting the characteristics of original signals. In this study, Synthetic ECG signals, noisy synthetic ECG signals, and realistic ECG signals were employed to test the validity of the algorithm. Due to the limitation of papers length, two 12-lead ECG signals were adopted randomly from Set A of PhysioNet/Computing in Cardiology Challenge 2011, which contains 773 acceptable qualities of ECG records. Analogously, two 12-lead ECG signals were adopted randomly from the data set, which was tagged as unacceptable quality. By the analysis of the remaining data in Set A, the quality characteristics of ECG signals can be exhibited by the reconstructed trajectories of the fused signals clearly. The experimental results indicate that NDFA can effectively compress the 12-lead ECG signals, and well fuse the quality characteristics of the original signal.
There are still many problems that require solutions. If the fused signal needs to be analyzed further, how to obtain the quantified characteristic parameters is still a crucial problem in the quality estimation of ECG signals, although the quality characteristics of the fused signal can be observed easily. The recurrence quantification analysis (RQA) method particularly suits for handling biological signals. Hence, RQA should be used to extract the quality characteristics of the fused signal in the further research. Additionally, how to design the optimized FISs is also to be dealt with in future work.
Author Contributions
C.D. wrote the paper and analyzed the data; B.W. and N.C. participated in writing the paper.
Funding
This research was funded by National Natural Science Foundation (NNSF) of China (Grants 11805156, 61867005), Natural Science Foundation of Gansu Province (Grant 17JR5RA278), Natural Science Foundation of Qinghai Province (Grant 2019-ZJ-948Q), and Fundamental Research Funds for the Central Universities (Grants 31920180121, 31920170015, 31920160003, and 31920170141).
Acknowledgments
The authors gratefully acknowledge the insightful comments and suggestions from the reviewers and editors, which have helped improve the presentation.
Conflicts of Interest
The authors declare no conflicts of interest.
References
- Clifford, G.D. ECG statistics, noise, artifacts, and missing data. In Engineering in Medicine and Biology, 1st ed.; Artech House: Norwood, MA, USA, 2006. [Google Scholar]
- Behar, J.; Oster, J.; Li, Q.; Clifford, G.D. ECG signal quality during arrhythmia and its application to false alarm reduction. IEEE Trans. Biomed. Eng. 2013, 60, 1660–1666. [Google Scholar] [CrossRef]
- Moody, G.B.; Mark, R.G. QRS morphology representation and noise estimation using the Karhumen-Loeve transform. Comput. Cardiol. 1989, 16, 267–272. [Google Scholar]
- Allen, J.; Murray, A. Assessing ECG signal quality on a coronary care unit. Physiol. Meas. 1996, 17, 249–258. [Google Scholar] [CrossRef] [PubMed]
- Kalkstein, N.; Kinar, Y.; Na’aman, M.; Neumark, N.; Akiva, P. Using machine learning to detect problems in ECG data collection. Comput. Cardiol. 2011, 38, 437–440. [Google Scholar]
- Chudacek, V.; Zach, L.; Kuzilek, J.; Spilka, J.; Lhotska, L. Simple scoring system for ECG quality assessment on android platform. Comput. Cardiol. 2011, 38, 449–451. [Google Scholar]
- Zaunseder, S.; Huhle, R.; Malberg, H. CinC Challenge—Assessing the usability of ECG by ensemble decision trees. Comput. Cardiol. 2011, 38, 277–280. [Google Scholar]
- Jekova, I.; Krasteva, V.; Dotsinsky, I.; Christov, I.; Abcherli, R. Recognition of diagnostically useful ECG recordings: Alert for corrupted or interchanged leads. Comput. Cardiol. 2011, 38, 429–432. [Google Scholar]
- Clifford, G.D.; Azuaje, F.; Mcsharry, P. Advanced Methods and Tools for ECG Data Analysis; Artech House: Norwood, MA, USA, 2006. [Google Scholar]
- Li, Q.; Mark, R.G.; Clifford, G.D. Robust heart rate estimation from multiple asynchronous noisy sources using signal quality indices and a Kalman filter. Physiol. Meas. 2008, 29, 15–32. [Google Scholar] [CrossRef]
- Li, Q.; Rajagopalan, C.; Clifford, G.D. A mathine learning approach to multi-level ECG signal quality classification. Comput. Meth. Prog. Biol. 2014, 117, 435–447. [Google Scholar] [CrossRef]
- Andreotti, F.; Grasser, F.; Malberg, H.; Zaunseder, S. Non-Invasive Fetal ECG Signal Quality Assessment for Multichannel Heart Rate Estimation. IEEE Trans. Biomed. Eng. 2017, 64, 2793–2802. [Google Scholar]
- Liu, C.; Zhang, X.; Zhao, L.; Liu, F.; Chen, X.; Yao, Y.; Li, J. Signal Quality Assessment and Lightweight QRS Detection for Wearable ECG SmartVest System. IEEE Internet Things J. 2018. [Google Scholar] [CrossRef]
- Satija, U.; Ramkumar, B.; Manikandan, M.S. A Review of Signal Processing Techniques for Electrocardiogram Signal Quality Assessment. IEEE Rev. Biomed. Eng. 2018, 11, 36–52. [Google Scholar] [CrossRef] [PubMed]
- Chen, Y.; Yang, H. Self-organized neural network for the quality control of 12-lead ECG signals. Physiol. Meas. 2012, 33, 1399–1418. [Google Scholar] [CrossRef] [PubMed]
- Shahriari, Y.; Fidler, R.; Pelter, M.; Bai, Y.; Villaroman, A.; Hu, X. Electrocardiogram Signal Quality Assessment Based on Structural Image Similarity Metric. IEEE Trans. Biomed. Eng. 2017, 65, 745–753. [Google Scholar] [CrossRef] [PubMed]
- Agrafioti, F.; Dimitrios, H. Fusion of ECG sources for human identification. In Proceedings of the 3rd International Symposium on Communications, Control and Signal Processing, St Julians, Malta, 12–14 March 2008; pp. 1542–1547. [Google Scholar]
- Yu, Q.; Guan, Q.; Li, P.; Liu, T.; Huang, X.; Zhao, Y.; Liu, H.; Wang, Y. Fusion of detected multi-channel maternal electrocardiogram (ECG) R-wave peak locations. BioMed. Eng. OnLine 2016, 15, 1–16. [Google Scholar] [CrossRef] [PubMed]
- Nweke, H.F.; Ten, Y.W.; Mujtaba, G.; Al-garadi, M.A. Data Fusion and Multiple Classifier Systems for Human Activity Detection and Health Monitoring: Review and Open Research Directions. Inf. Fusion 2019, 46, 147–170. [Google Scholar] [CrossRef]
- Cong, R.; Liu, S.L.; Ma, R. An approach to phase space reconstruction from multivariate data based on data fusion. Acta Phys. Sin. 2008, 57, 7487–7493. (In Chinese) [Google Scholar]
- Diao, C.; Wang, B.; Cai, N. Data fusion of multivariate time series based on local weighted zero-order prediction algorithm. In Proceedings of the 2017 36th Chinese Control Conference (CCC), Dalian, China, 26–28 July 2017; pp. 5663–5667. [Google Scholar]
- Diao, C.; Wang, B.; Cai, N. A Novel Data Fusion Algorithm for Multivariate Time Series. In Proceedings of the 2018 Chinese Control and Decision Conference (CCDC), Shenyang, China, 9–11 June 2018; pp. 6331–6333. [Google Scholar]
- Govindan, R.B.; Narayanan, K.; Gopinathan, M.S. On the evidence of deterministic chaos in ECG: Surrogate and predictability analysis. Chaos Interdiscip. J. Nonlinear Sci. 1998, 8, 495–502. [Google Scholar] [CrossRef]
- Takens, F. Detecting strange attractors in turbulence. Lect. Notes Math. 1981, 898, 366–381. [Google Scholar]
- Zadeh, L.A. Fuzzy sets. Inf. Control 1965, 8, 338–353. [Google Scholar] [CrossRef] [Green Version]
- Qu, J.; Wang, X.; Qiao, Y.; Gao, F.; Zhou, D. An improved local weighted linear prediction model for chaotic time series. Chin. Phys. Lett. 2014, 31, 16–20. [Google Scholar] [CrossRef]
- Moody, G.B.; Muldrow, W.K.; Mark, R.G. A noise stress test for arrhythmia detectors. Comput. Cardiol. 1984, 11, 381–384. [Google Scholar]
- Goldberger, A.L.; Amaral, L.A.; Glass, L.; Hausdorff, J.M.; Ivanov, P.C.; Mark, R.G.; Mietus, J.E.; Moody, G.B.; Peng, C.K.; Stanley, H.E. PhysioBank, PhysioToolkit, and PhysioNet: Components of a new research resource for complex physiologic signals. Circulation 2000, 101, 215–220. [Google Scholar] [CrossRef]
- Silva, I.; Mood, G.B.; Celi, L. Improving the quality of ECGs collected using mobile phones: The PhysioNet/Computing in Cardiology Challenge 2011. Comput. Cardiol. 2011, 38, 273–276. [Google Scholar]
- McSharry, P.E.; Clifford, G.D.; Tarassenko, L.; Smith, L.A. A dynamical model for generating synthetic electrocardiogram signals. Biomed. Eng. 2003, 50, 289–294. [Google Scholar] [CrossRef] [PubMed] [Green Version]
- Sameni, R.; Clifford, G.D.; Jutten, C.; Shamsollahi, M.B. Multichannel ECG and noise modeling: Application to maternal and fetal ECG signals. EURASIP J. Appl. Signal Proces. 2007, 2007, 94. [Google Scholar] [CrossRef]
- Clifford, G.D.; Nemati, S.; Sameni, R. An artificial vector model for generating abnormal electrocardiographic rhythms. Physiol. Meas. 2010, 31, 595–609. [Google Scholar] [CrossRef] [Green Version]
- Daubechies, A.A.I. The continuous Procrustes distance between two surfaces. Mathematics 2011, 29, 322–324. [Google Scholar]
- Dahl, T.; Naes, T. Outlier and group detection in sensory panels using hierarchical cluster analysis with the Procrustes distance. Food Qual. Preference 2004, 15, 195–208. [Google Scholar] [CrossRef]
- Ejlali, N.; Faghihi, M.R.; Sadeghi, M. Bayesian comparison of protein structures using partial Procrustes distance. Stat. Appl. Genet. Mol. Biol. 2017, 16, 243–257. [Google Scholar] [CrossRef]
- Dower, G.E.; Yakush, A.; Nazzal, S.B.; Jutzy, R.V.; Ruiz, C.E. Deriving the 12-lead electrocardiogram from four (EASI) electrodes. Electrocardiology 1988, 21, S182–S187. [Google Scholar] [CrossRef]
- Xie, B.; Han, M.; Zhang, P.; Zhang, W. Optimization algorithm of dynamic time warping for speech recognition of aircraft towing vehicle. J. Comput. Appl. 2018, 38, 1771–1776. [Google Scholar]
Figure 1.
The reconstructed phase trajectory L1 and L2, and the fused trajectory LF to illustrate the basic idea of the novel data fusion algorithm (NDFA).
Figure 1.
The reconstructed phase trajectory L1 and L2, and the fused trajectory LF to illustrate the basic idea of the novel data fusion algorithm (NDFA).

Figure 2.
Partitioning results of variables with triangular membership function. (a–f) are partitioning results of D, Dr, Od, α, αr and respectively.
Figure 2.
Partitioning results of variables with triangular membership function. (a–f) are partitioning results of D, Dr, Od, α, αr and respectively.

Figure 3.
Synthetic ECG signals.

Figure 4.
Reconstructed phase trajectories of synthetic ECG signals. (a–c) are reconstructed phase trajectories of Vx, Vy and Vz, respectively. (d) Is reconstructed phase trajectory of final fused result via NDFA.
Figure 4.
Reconstructed phase trajectories of synthetic ECG signals. (a–c) are reconstructed phase trajectories of Vx, Vy and Vz, respectively. (d) Is reconstructed phase trajectory of final fused result via NDFA.

Figure 5.
Realistic noise signals.

Figure 6.
Three-lead VCG signals by realistic 12-lead ECG signals transformation and reconstructed trajectories of fused results. (a–d) are results of the signal of No.1027085, No.1075113, No.1027085, and No.1075113, respectively.
Figure 6.
Three-lead VCG signals by realistic 12-lead ECG signals transformation and reconstructed trajectories of fused results. (a–d) are results of the signal of No.1027085, No.1075113, No.1027085, and No.1075113, respectively.

Figure 7.
Reconstructed phase trajectories of ECG signals (No.106). (a) and (b) are reconstructed phase trajectories of lead MLII and lead V5, respectively. (c) is reconstructed phase trajectory of final fused result via NDFA.
Figure 7.
Reconstructed phase trajectories of ECG signals (No.106). (a) and (b) are reconstructed phase trajectories of lead MLII and lead V5, respectively. (c) is reconstructed phase trajectory of final fused result via NDFA.

Figure 8.
Performance comparison of NDFA, MDF, Algorithms 1 and 2 by DTW. (a) Is the comparison for the fused signals by four algorithms and the lead MLII. (b) Is the comparison for the fused signals by four algorithms and the lead V5.
Figure 8.
Performance comparison of NDFA, MDF, Algorithms 1 and 2 by DTW. (a) Is the comparison for the fused signals by four algorithms and the lead MLII. (b) Is the comparison for the fused signals by four algorithms and the lead V5.


Table 1.
Inference rules of fuzzy inference system (FISd) on the evolutionary trend of reconstruction trajectory.
Table 1.
Inference rules of fuzzy inference system (FISd) on the evolutionary trend of reconstruction trajectory.
| D | ||||
| SD | MD | BD | ||
| Dr | ||||
Table 2.
Inference rules of fuzzy inference system () on the angle of adjacent vectors.
Table 3.
SNR magnitudes for noise, baseline wander (BW), electrode movement (EM) and muscle artifact (MA).
Table 3.
SNR magnitudes for noise, baseline wander (BW), electrode movement (EM) and muscle artifact (MA).
| SNR Levels (dB) | ||||
|---|---|---|---|---|
| BW | 12 | 6 | 0 | −6 |
| EM | 6 | 0 | −6 | −12 |
| MA | 12 | 6 | 0 | −6 |
Table 4.
Cor for BW with different signal noise ratio (SNR) levels.
| SNR (dB) | 12 | 6 | 0 | −6 |
|---|---|---|---|---|
| 0.3449 | 0.3103 | 0.2340 | 0.1368 | |
| 0.5369 | 0.5329 | 0.5177 | 0.4566 |
Table 5.
Cor for EM under different SNR levels.
| SNR (dB) | 6 | 0 | −6 | −12 |
|---|---|---|---|---|
| 0.3281 | 0.2598 | 0.1665 | 0.0944 | |
| 0.5347 | 0.5156 | 0.4728 | 0.4080 |
Table 6.
Cor for MA under different SNR levels.
| SNR (dB) | 12 | 6 | 0 | −6 |
|---|---|---|---|---|
| 0.3498 | 0.3192 | 0.2476 | 0.1539 | |
| 0.5439 | 0.5221 | 0.4970 | 0.4379 |
© 2018 by the authors. Licensee MDPI, Basel, Switzerland. This article is an open access article distributed under the terms and conditions of the Creative Commons Attribution (CC BY) license (http://creativecommons.org/licenses/by/4.0/).
Share and Cite
MDPI and ACS Style
Diao, C.; Wang, B.; Cai, N. Data Fusion of Multivariate Time Series: Application to Noisy 12-Lead ECG Signals. Appl. Sci. 2019, 9, 105. https://doi.org/10.3390/app9010105
AMA Style
Diao C, Wang B, Cai N. Data Fusion of Multivariate Time Series: Application to Noisy 12-Lead ECG Signals. Applied Sciences. 2019; 9(1):105. https://doi.org/10.3390/app9010105
Chicago/Turabian StyleDiao, Chen, Bin Wang, and Ning Cai. 2019. "Data Fusion of Multivariate Time Series: Application to Noisy 12-Lead ECG Signals" Applied Sciences 9, no. 1: 105. https://doi.org/10.3390/app9010105
Note that from the first issue of 2016, this journal uses article numbers instead of page numbers. See further details here.