1. Introduction
The total world’s consumption of marketed energy is expected to expand from 549 quadrillion Btu in 2012 to 629 quadrillion Btu in 2020, and to 815 quadrillion Btu in 2040. In other words, the total world energy consumption is projected to increase by approximately 48% from 2012 to 2040 [
1]. Fossil fuels remain the main sources in the global energy mix, and they are associated with the increase in carbon dioxide (CO
2) emissions. The deployment of renewable energy sources (RES) can play a critical role in reducing both (CO
2) emissions and fossil fuel dependency [
2]. Therefore, the use of renewable energy sources is being emphasized around the world for sustainable and green energy production to meet the energy demands [
3]. Renewable energy is the world’s fastest-growing source of energy (an average increase of 2.6%/year), owing to government policies and incentives promoting the use of non-fossil energy sources in many countries [
1]. Among all of the renewable resources, solar energy is the most abundant, inexhaustible, and clean source [
4]. Photovoltaics technology is an elegant technology that is available for the efficient use of solar power [
5].
The energy consumed in the building sector consists of residential and commercial end users and accounts for 20.1% of the total delivered energy consumed worldwide. The delivered energy consumption in buildings worldwide is predicted to increase by an average of 1.5%/year between 2012 and 2040 [
1]. Building-integrated photovoltaic (BIPV) technology aims to transform buildings from energy consumers to energy producers [
6]. Recently, market research forecasted the rapid expansion of the BIPV and photovoltaics (PV) market. The world PV market is expected to increase the total global installed solar capacity from 229 GW in 2015 to 600 GW in 2020. The installed capacity of BIPV was 0.3 GW in 2012 and the market is expected to grow at a compound annual growth rate (CAGR) of 18.70% per year, which will result in a capacity of 1.2 GW in 2019 [
7].
BIPVs are defined as PV modules that can be integrated in a building envelope (into the roof or façade) by replacing conventional building materials (e.g., tiles) [
8]. As the height of the building to which a BIPV system can be applied is increased, most of the areas where modules can be installed are at the elevations of buildings. The installation of a BIPV system at an elevation means that it cannot be installed at the optimal installation angle. In addition, there is a high likelihood of performance degradation due to various factors, such as adjacent buildings, barriers, and IAMs (incident angle modifiers). Therefore, in the case of a BIPV system, there is a need to investigate the performance loss factors and their characteristics.
Various studies have been conducted on the performance loss factors of PV and BIPV systems. Recent studies of module temperature have been conducted to evaluate the effects of the temperature coefficient and rear ventilation condition, or to propose and verify a method for predicting the module temperatures. Experimental studies on module temperature focus on the power generation performance of the module according to the rear ventilation condition [
9], and the temperature dependence of the open circuit voltages of various kinds of commercial crystalline silicon photovoltaic modules [
10]. The theoretical research on module temperature looks at the development of a platform for module temperature prediction using computational fluid dynamics [
11]. In addition, there was a paper that reviewed the proposed methods for reducing the prediction error of the single diode method, which is mainly used in the performance prediction of PV systems [
12]. A prior study compared the temperature coefficients measured under ambient conditions with those under STC (standard test conditions) [
13], and another study developed a method to reduce the module temperatures by modifying the module shape using a simulation program [
14]. Previous studies on dust and soiling were performed under various experimental conditions and module types [
15,
16,
17,
18]. A previous research examined the correlation between dust and wind velocity by making an experimental device to quantify the effects of wind velocity and dust [
19], and there was also research on the characteristics of dust particles, such as the density, size, volume, and the specific weight [
20]. In addition, a prior study compared the efficiencies depending on the presence or absence of cleaning, using long-term measured data after exposing the module to ambient air [
18]. The results of outdoor experiments showed that 40% of the maximum module efficiency was lost due to dust. A study conducted through exposure to ambient air without artificially changing the experimental conditions suggested that the effects of dust were influenced significantly by regional characteristics. On the other hand, there has been a lack of research on the performance degradation related to the power conditioning system (PCS). Since the power generated from the PV array is DC, it must be converted to AC power in order to supply electric power to the electric load equipment, or to connect with the grid. This role is performed in the PCS. In addition, it should have the maximum power point tracking (MPPT) control function so that the output of the PV array can always generate at the maximum power point. Since it operates in conjunction with the grid, it protects the PCS from system accidents, it should have several protective functions to protect the system. For this reason, it is called the power conditioner or PCS, as it is different from a general purpose inverter. Previous studies have attempted to predict the PCS temperature increase related to the performance of the PCS [
21], select the optimized capacity of PCS using measured data [
22], and assess MPPT controls, one of the functions of PCS [
23,
24].
In previous studies, various loss factors were investigated, but there has been no research on the various installation conditions (azimuth angle and inclined angle) in the same system, so there are limitations on making a comparison among the performance loss factors according to the installation conditions. In addition, there is a paucity of research on the correlations among the PCS stands by loss, PCS capacity, and the array capacity.
The main purpose of this paper is to evaluate the power generation performance loss factors that can occur in BIPV and PV systems by installation conditions. The effect of the power generation performance loss factors varies, depending on the installation conditions. For this reason, this paper evaluates the effect using actual monitoring data of a BIPV system composed of various installation conditions (horizontal, south-inclined, south-vertical, west-vertical). Among various power generation performance loss factors, this paper analyzed DC–AC conversion loss caused by a capacity mismatch of PV arrays and PCS that can occur in the system design, module temperature, dust and soiling, and PCS standby loss during operation.
Following this introduction,
Section 2 presents a method for analyzing the effects of power generation performance and generation performance loss factors, and
Section 3 introduces the BIPV performance test facility analyzed in this study.
Section 4 and
Section 5 present the results of the power generation performance analysis and the analysis of the effect of each performance loss factors. Finally,
Section 6 outlines the conclusion of the paper and discusses the results.
2. Methodology
Because the BIPV system is installed on the building envelope, there is a high likelihood of efficiency deterioration due to factors, such as the installation angle, shade due to surrounding obstacles, and an increase in the temperature of the PV module. In particular, the possibility of the deterioration of BIPV module efficiency installed on the vertical elevation is greater. In addition, although a PV system is a simpler system than conventional power generation systems (except thermal power stations), because of the complexity of internal power loss factors, it is important to analyze major power loss factors arising during the process from converting the solar energy source to the PV array output, to the final system output. Therefore, this study analyzed the power generation performance and power generation performance loss factors of the BIPV system.
2.1. Power Generation Performance
The power generation performance of the BIPV system was analyzed using measured data. The analysis period was a total of 366 days from 1 January 2012 to 31 December 2012. Statistical analysis of the measured data of a total of 307 days was performed; data with measurement errors due to power failure and system malfunction during the period were excluded.
The power generation performance was analyzed using the performance ratio of International Electrotechnical Commission (IEC) 61724. The PR (performance ratio), which is defined as the ratio of the final yield (
) during actual operation to the reference yield (
) under STC, can be differentiated into subcategories of system loss (
) and capture loss (
). The main reason behind the system loss is the DC–AC conversion loss of the inverter. Capture loss, on the other hand, is lost for a variety of reasons, such as module temperature, wiring, string diode, low irradiation loss, partial shading loss, dust and containments loss, snowing loss, irregular irradiation condition, solar cell mismatch, MPPT failures loss, and inefficient system configuration. The analysis procedures on the measured power yield data were based on IEC guideline 61724 [
25] to calculate the power yield performance. The power generation performance was analyzed using Equations (1)–(6).
where
is the performance ratio (-),
is the reference yield (h/day),
is the final yield (h/day),
is the array yield (h/day),
is the daily accumulated irradiation of the plan of array (POA) (kWh/m
2),
is the irradiation of STC (1 kWh/m
2),
is the daily accumulated DC power (kWh),
is the daily accumulated AC power (kWh), and
is the installation capacity (kWp).
2.2. Power Generation Performance Loss Factors
Power generation performance loss factors can be classified into capture losses and system losses. System loss refer to the loss factors related to the PCS, and they involve relatively fewer specific loss factors, such as MPPT mismatching and DC–AC conversion. On the other hand, capture loss includes relatively greater various loss factors, such as variations in the solar incidence angle, contamination of the module surface, effects of shading, decreases in the power output due to a temperature rise, mismatch of the PV array, and PCS standby loss. In this study, the loss factors common in all systems, such as the module surface temperature, dust and soiling, PCS standby loss, and DC–AC conversion loss, among various loss factors of BIPV and PV systems, were analyzed using measured data.
2.2.1. Module Surface Temperature
Previous research [
26] showed that the annual power generation loss of a PV system due to an increase in module temperature is up to 17%. If the installation type of a PV array allows enough rear ventilation and the cooling effect by ambient air, and airflow is large, the losses due to a temperature rise can be reduced. On the other hand, rear ventilation conditions are not easily formed because the BIPV module in system is used as a building material to replace the envelope and windows of buildings. Therefore, the temperature loss factor is a power generation performance loss factor that requires extra consideration regarding the BIPV system. To analyze the performance loss due to an increase in the module temperature, this study compared the power generation performance before and after a temperature loss correction using the DC power, the module temperature, the temperature coefficient, and the equation for the temperature-corrected DC power. Equation (7) [
25] was used to obtain the temperature-corrected DC power:
where
is the temperature-corrected theoretical DC energy generation (kWh),
is the measured DC energy generation (kWh),
is the temperature coefficient (%/K), and
is the module temperature (K).
2.2.2. Dust and Soiling
Dust and soiling cause an annual energy production loss of approximately 2–8%, and this factor can cause energy production losses of up to 20% in a dry summer [
27]. The performance loss by module surface contamination can be solved to some extent through a module surface cleaning effect from natural rainfall [
28]. On the other hand, if PV modules are installed horizontally, the cleaning effect of rainfall is less compared to that of an inclined plane. Therefore, this study analyzed the changes in power generation performance according to artificial cleaning for four installation types with different azimuth angles and inclined angle conditions. Performance analysis was conducted using the solar irradiation and power generation efficiency of each array during a specific period.
2.2.3. PCS Standby Loss
The PCS remains in standby mode until more than a certain amount of power is not produced in the PV array (until the operating conditions of PCS are met). This is called the automatic start/stop function of the PCS. In this paper, “PCS standby loss” is defined as the loss that occurs when the solar irradiation incident on the PV array exists but does not satisfy the conditions for operating the PCS, and thus PCS remains in standby mode due to the automatic start/stop function of the PCS. To analyze the PCS standby loss, the representative days of clear sky (3 June 2012) and overcast sky (6 June 2012) were analyzed according to the sky conditions, and the monthly ratio of unused solar irradiation was analyzed.
2.2.4. DC–AC Conversion Loss
The conversion efficiency of the PCS is generally more than 90% when the input power is 30–50% of the rated power, and it is low when the input power is less than 10% of the rated power [
29]. In other words, to reduce the losses in the DC-to-AC conversion process of the PCS, the design of the PV system must ensure that the PCS input power meets the rated power of the PCS, through an optimal capacity design of the PV array and the PCS. In the BIPV system examined in this study, a PV array of 0.528 kWp was connected to a 3 kW PCS. That is, the input power of 17.6% of the rated capacity of PCS was connected. Therefore, it is expected that the normal conversion efficiency of the PCS cannot be realized. To analyze the DC–AC conversion loss, the PCS conversion efficiency depending on the input power was calculated using the PCS input power and the conversion efficiency.
3. Overview of the BIPV Performance Test Facility
The BIPV system examined in this study was located on the rooftop of a five-story building in Daejeon, the Republic of Korea. Each array of the BIPV system was installed to avoid shading due to adjacent buildings and other structures. The BIPV system consisted of four arrays in different orientations and tilt angles. Each array was connected to a separate PCS and connected to the grid.
Table 1 provides an installation overview of the BIPV system, and
Figure 1 shows the front view of the BIPV system.
Four different arrays were installed on horizontal (HR 0°), south-inclined (SI 30°), south vertical (SV 90°), and west vertical (WV 90°) directions, respectively. Each array consisted of 12 transparent a-Si BIPV modules connected in 6 series × 2 parallel and had an installed capacity of 0.528 kWp. The transparent a-Si BIPV module was a transparent BIPV module constructed in the shape of a window with a 10 mm thick single-plate module made by joining an a-Si thin-film cell (5 mm TCO Glass + a-Si thin-film cell), an EVA (ethylene vinyl acetate) film, and 5 mm thick rear glass.
Figure 2 shows the composition of the PV glass and the PV glazing.
Table 2 and
Table 3 list the specifications of the module and PCS applied to the system.
The monitoring system was also installed when the BIPV system was constructed, to analyze the power generation performance and power loss factor of the BIPV system. Power, voltage, and current for DC and AC was monitored. In addition, external environmental factors such as irradiation and module temperature, directly affecting the power generation performance, were monitored. In order to measure the irradiation of each arrays, the irradiation sensors (pyranometer) were installed at the same installation condition as each array. The module temperature was measured as shown in
Figure 2, and the power loss factor analysis was performed using the module rear temperature.
4. Measured Power Generation Performance of the BIPV System
The power generation performance for each array was analyzed using the measured data for one year in 2012.
Figure 3 shows the final yield, the system loss, and the capture loss according to each array.
Regarding the final yield, SI 30° showed the highest final yield at 3.03 h/day, followed in order by HR 0° (2.72 h/day), SV 90° (1.85 h/day), and WV 90° (1.36 h/day). SI 30°, which is the installation condition for receiving a high accumulated irradiation, showed the highest final yield. The capture loss and system loss also showed the same tendency as the final yield analysis results. SI 30° showed the highest capture losses of 0.55 h/day, followed in order by HR 0° (0.53 h/day), SV 90° (0.43 h/day), and WV 90° (0.33 h/day). Regarding the system losses, SI 30° showed the highest system loss (0.82 h/day), followed in order by HR 0° (0.66 h/day), SV 90° (0.45 h/day), and WV 90° (0.34 h/day) in descending order.
Figure 4 shows the analysis results of the ratio of the final yield to the reference yield (PR) and the ratios of the system loss and capture loss according to the installation conditions. In the annual PR according to the installation condition, HR 0° showed the highest PR (69.5%), followed in order by SI 30° (69.0%), SV 90° (67.8%), and WV 90° (66.8%). The PR did not exceed 70% under any installation conditions. Therefore, the power generation performance was lower than that of the PV system reported in a previous study of International Energy Agency (IEA) [
30]. In addition, the ratios of the system loss were relatively higher than the results of a previous study [
7] that analyzed the power generation performance of the BIPV system, to which the same module and inverter were applied. In other words, it was presumed that higher system losses compared to those of other systems led to performance loss.
5. Power Generation Performance Loss Factor of the BIPV System
In
Section 4, an analysis of the power generation performance of the BIPV system and power generation performance loss indices of the capture loss and system loss using the data of solar irradiation and the output of the PV array and PCS is presented. For the system losses, loss factors, such as the PCS conversion efficiency and MPPT mismatching of the PCS could be distinguished. On the other hand, in the case of capture losses, many subcategorical loss factors, such as the variation of the incident angle of solar irradiation, module surface contamination, shading effects, output power lowering due to the temperature rise, mismatch effects in a PV array, wiring loss, and PCS stand by loss, worked together in a complex manner. Therefore, it was difficult to analyze and express them as quantified values. Accordingly, in
Section 5, the loss characteristics were analyzed using the measured data by classifying the factors affecting the power generation performance of a BIPV system.
5.1. Module Surface Temperature
Figure 5 shows the monthly module surface temperature of each PV array in the form of a box-and-whisker plot. The marker in the middle represents the mean; the box represents the mean ± deviation; the whiskers represent the maximum and minimum values.
The PV module surface temperature of SI 30° continued to show the distribution of the highest temperatures throughout the year. The temperature distribution of SV 90° was similar to that SI 30° in the winter. WV 90° showed a distribution of the lowest temperatures during winter, but it exhibited a distribution of high temperatures approximating to that of SI 30° during summer. The PV module surface of HR 0° showed a distribution of low temperatures throughout the year, regardless of the season. This is in contrast to the general temperature behavior of the horizontal plane receiving the highest accumulated irradiation during summer. Although the other three PV arrays were integrated into the building replacing a window, the PV array of the horizontal plane was installed in the form of a rooftop pergola that is exposed to ambient air. As a result, rear ventilation was possible, which explains why it showed a lower temperature distribution than the other three PV arrays.
Table 4 lists the analysis results of the monthly averaged PV module surface temperatures under each installation condition.
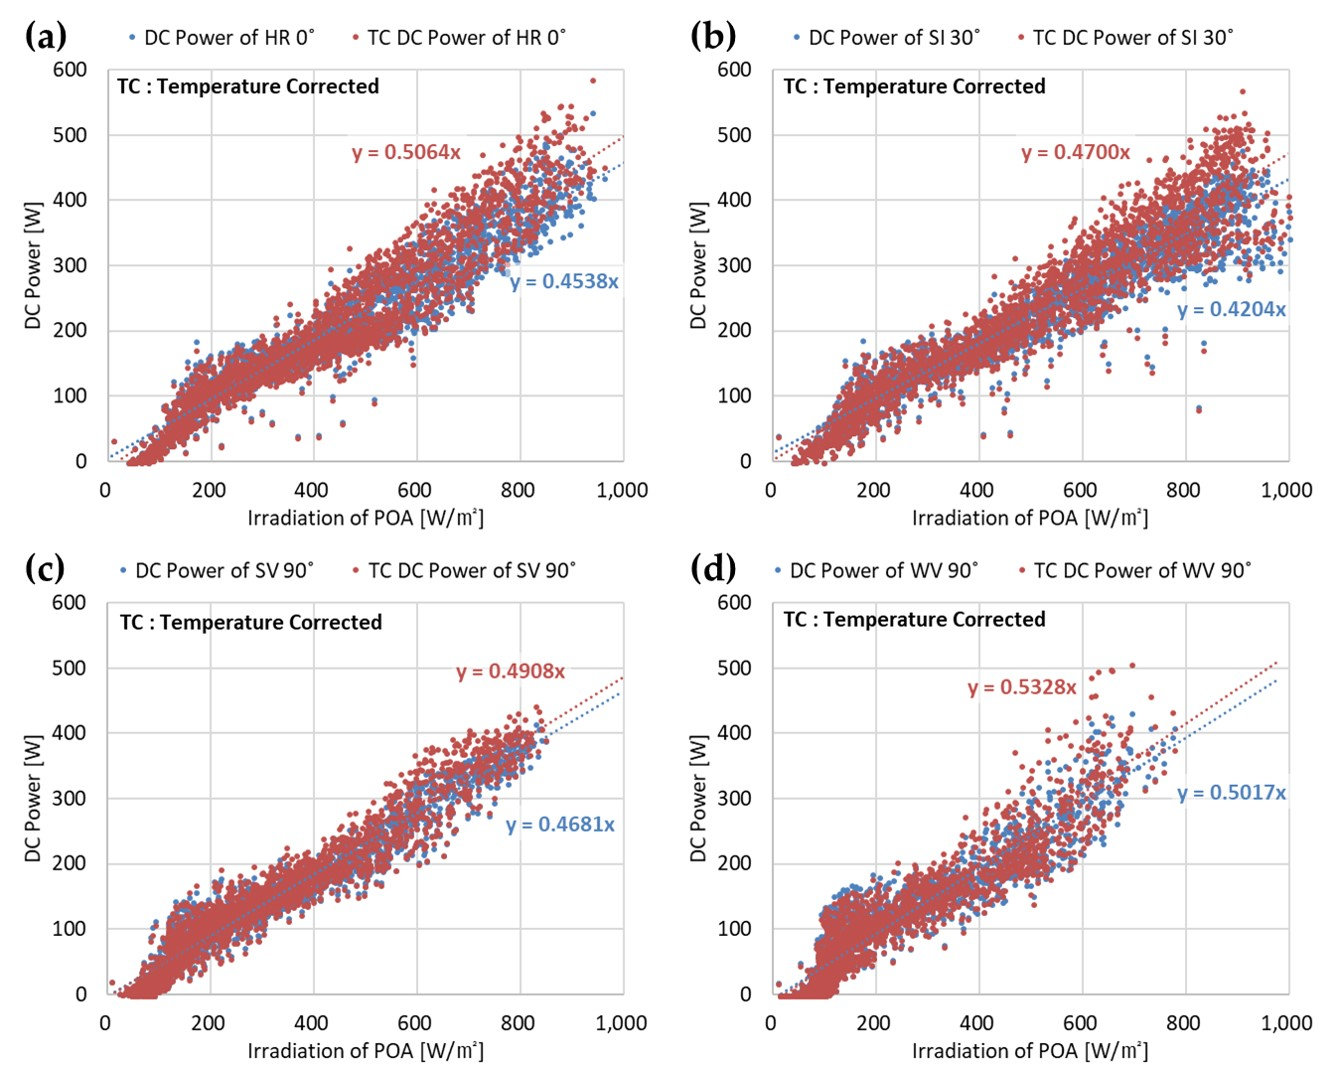
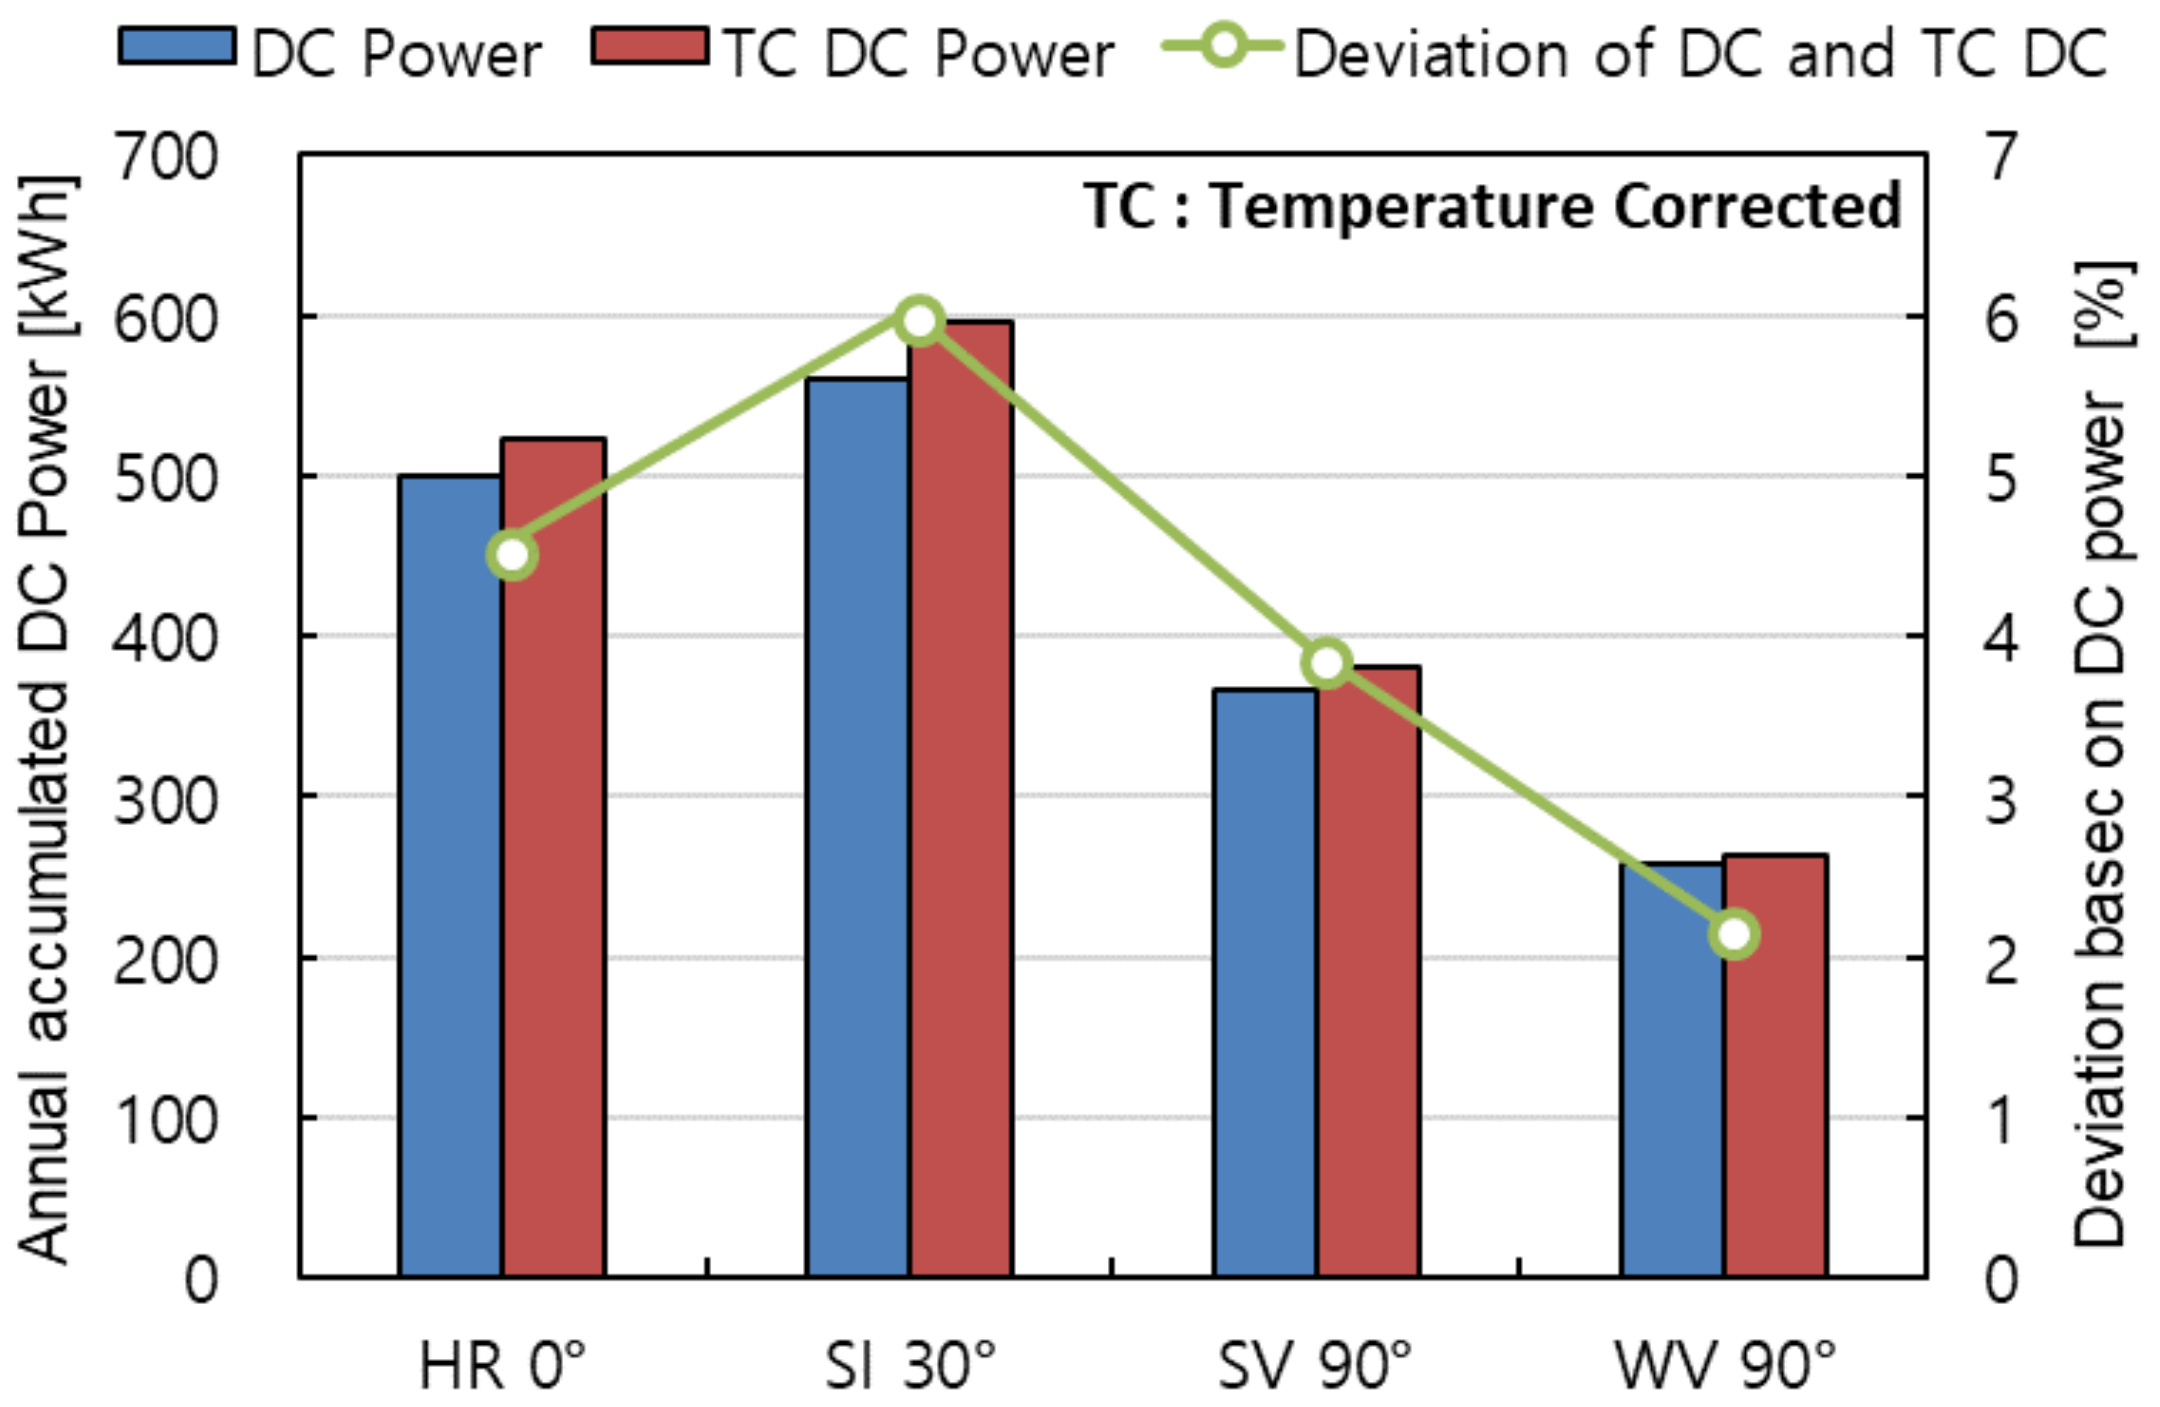
Figure 6 shows the DC power according to the changes in irradiation and temperature-corrected DC power. The temperature-corrected DC power was calculated using Equation (7). The temperature-corrected DC power is the value that includes the amount of DC power that is lost due to the temperature increase. The difference between the DC power and temperature-corrected DC power makes it possible to analyze the losses caused by an increase in the module temperature in each array. Based on the analysis results shown in
Figure 6, the annual DC power losses due to an increase in temperature were calculated, as shown in
Figure 7.
As a result of analyzing the ratio of the annual energy production lost due to an increase in temperature with respect to the measured DC power, the ratio was 4.6% for HR 0°, 6.0% for SI 30°, 3.9% for SV 90°, and 2.2% for WV 90°. In other words, the annual DC power loss was estimated to be 2.2–6.0%. The largest DC power loss was found to occur in SI 30°, which showed the highest PV module surface temperature, and the lowest power generation loss occurred in WV 30°. This result of the analysis occurred, despite the fact that the monthly averaged PV module surface temperature of the horizontal plane was low because the rate of the distribution of temperatures over 50 °C was higher in the horizontal plane than in the south vertical plane.
5.2. Dust and Soiling
This BIPV system has been operated without any cleaning since its completion in November 2009.
Figure 8 shows the precipitation and snowfall during the operating period (November 2009–February 2013) of the BIPV system. It is expected that there was a cleaning effect by rainfall and snowfall the operation period. However, this study focused on the effects of forcible cleaning of the BIPV system operated for 40 years.
The effect of cleaning was analyzed to determine the impact of dust and soiling on the power generation performance degradation of the PV system. The monitoring data used to analyze the impacts on the dust and soiling-utilized part of the data from February to March 2013. On 5 March 2013, the four arrays were cleaned to analyze the effects of cleaning. The index used for the effect analysis was the array conversion efficiency. The conversion efficiency of the PV array is affected by various environmental factors, such as the solar spectrum, changes in the incident angle of the Sun, and the solar radiation intensity. In this study, to minimize the influence of factors other than the cleaning effect, the data was measured for one hour when the solar irradiation intensity was highest among the data measured before and after cleaning at each installation position.
Table 5 lists the representative days and time selected for the analysis.
Figure 9 shows the irradiation and module temperature for each array during the analysis period (1 h).
Figure 10 and
Table 6 present the power generation efficiency before and after cleaning under each installation condition. An analysis of the changes in PV array efficiency due to cleaning under each installation condition showed no significant difference in the vertical planes. The PV array efficiencies of SV 30° before and after cleaning were 4.5% and 4.6%, respectively. The PV array efficiency of WV 30° increased from 3.5% to 3.7%, showing an approximate 5.7% improvement rate for the power generation efficiency, compared to the value before cleaning. On the other hand, the PV array efficiency of the HR 0° and SI 30° was improved by 23.1% and 14.3%, respectively, compared to the values before cleaning. These results show that continuous maintenance (ex. cleaning) is required to improve the power generation performance in the case of PV systems installed on the horizontal and inclined planes.
5.3. PCS Standby Loss
The PCS installed in the BIPV system examined in this paper operated only if the output voltage of the PV array exceeded 190 V. As can be seen in
Figure 11, when the solar radiation was 0–100 W/m
2, it can be confirmed that the DC power generation was 0 W. This means that the PCS operation commenced when the irradiation intensity of the array having an installation capacity of 0.528 kWp was 100 W/m
2 or more. Therefore, it is impossible to utilize solar irradiation if the solar radiation intensity is below the level that can satisfy the driving condition of the PCS. This irradiation during standby mode varies according to the meteorological and installation conditions of the PV array, and it occurs mainly when irradiation is low or when there is a barrier, such as snow on the PV array even if the irradiation intensity is high. The measured data of SI 30° was used to analyze the PCS standby loss according to the meteorological conditions. The analysis was conducted by selecting the representative day; one day of June was nominated according to the sky condition. The representative day was selected based on the cloud cover, as listed in
Table 7.
Figure 11 shows the irradiation and output of the PV array of SI 30° according to the sky conditions. In the case of an overcast sky, the irradiation intensity was 100 W/m
2 or less most of the time, and the PCS was repeatedly operated and stopped. For a clear sky, most of the irradiation intensity was 100 W/m
2 or more, the irradiation intensity satisfied the driving condition of the PCS, so the PCS operated continuously. The analysis results for overcast sky and clear sky showed that the array of the south vertical plane satisfied the driving condition of PCS when the solar radiation intensity was approximately 100 W/m
2. The monthly ratio of solar irradiation during the standby mode of each array as the PCS standby loss was calculated in the same way, and the results are shown in
Figure 12 and
Table 8.
The total amount of irradiation not used for power generation due to the automatic start/stop function of PCS among the amounts of accumulated irradiation obtained for one year under each installation condition was estimated to be 6.8% for HR 0°, 4.9% for SI 30°, 8.4% for SV 90°, and 15.7% for WV 90°. When the influence of snow during winter in the horizontal and south-inclined planes was excluded, the ratio was reduced to 5.1% and 4.6% for the horizontal and south-inclined planes, respectively. This means that 4.6% to 15.7% of the annual irradiation is not used for power generation depending on the installation conditions, due to the PCS standby loss. In particular, in WV 90°, a large loss of 15.7% of annual accumulated irradiation occurred due to the installation location characteristics. The PCS standby loss was a factor not considered in the IEC 61724 standard for evaluating the performance of a PV system, based on the accumulated irradiation, and it needed to be considered together as a PCS loss factor, depending on the installation location conditions of the PV system.
5.4. DC–AC Conversion Loss
The PV arrays under each installation condition in the BIPV system used in this study were configured to have a design capacity of 0.528 kWp, and each PV array was connected to the PCS with a rated capacity of 3 kW. Therefore, this study analyzed how the configuration of the PV array, which has significantly smaller capacity than the rated capacity of the PCS, affects the PCS DC–AC power conversion performance.
Table 9 lists the ratio of time for each PCS input power range, which was calculated by dividing the magnitude of the PCS input power into nine PCS input power ranges for each installation condition of PV arrays. The annual ratio of time for the PCS input power below 200 W was 61.5% for HR 0°, 54.1% for SI 30°, 77.0% for SV 90°, and 83.8% in WV 90°. In other words, the PCS input power of all the PV arrays was less than 6.7% of the rated output of the PCS for more than half of the PCS operating times over a year.
The PCS DC–AC conversion efficiency was lowered sharply by significantly lowering the input power below the rated power of the PCS, and the reduced PCS conversion efficiency had a critical impact on the system performance.
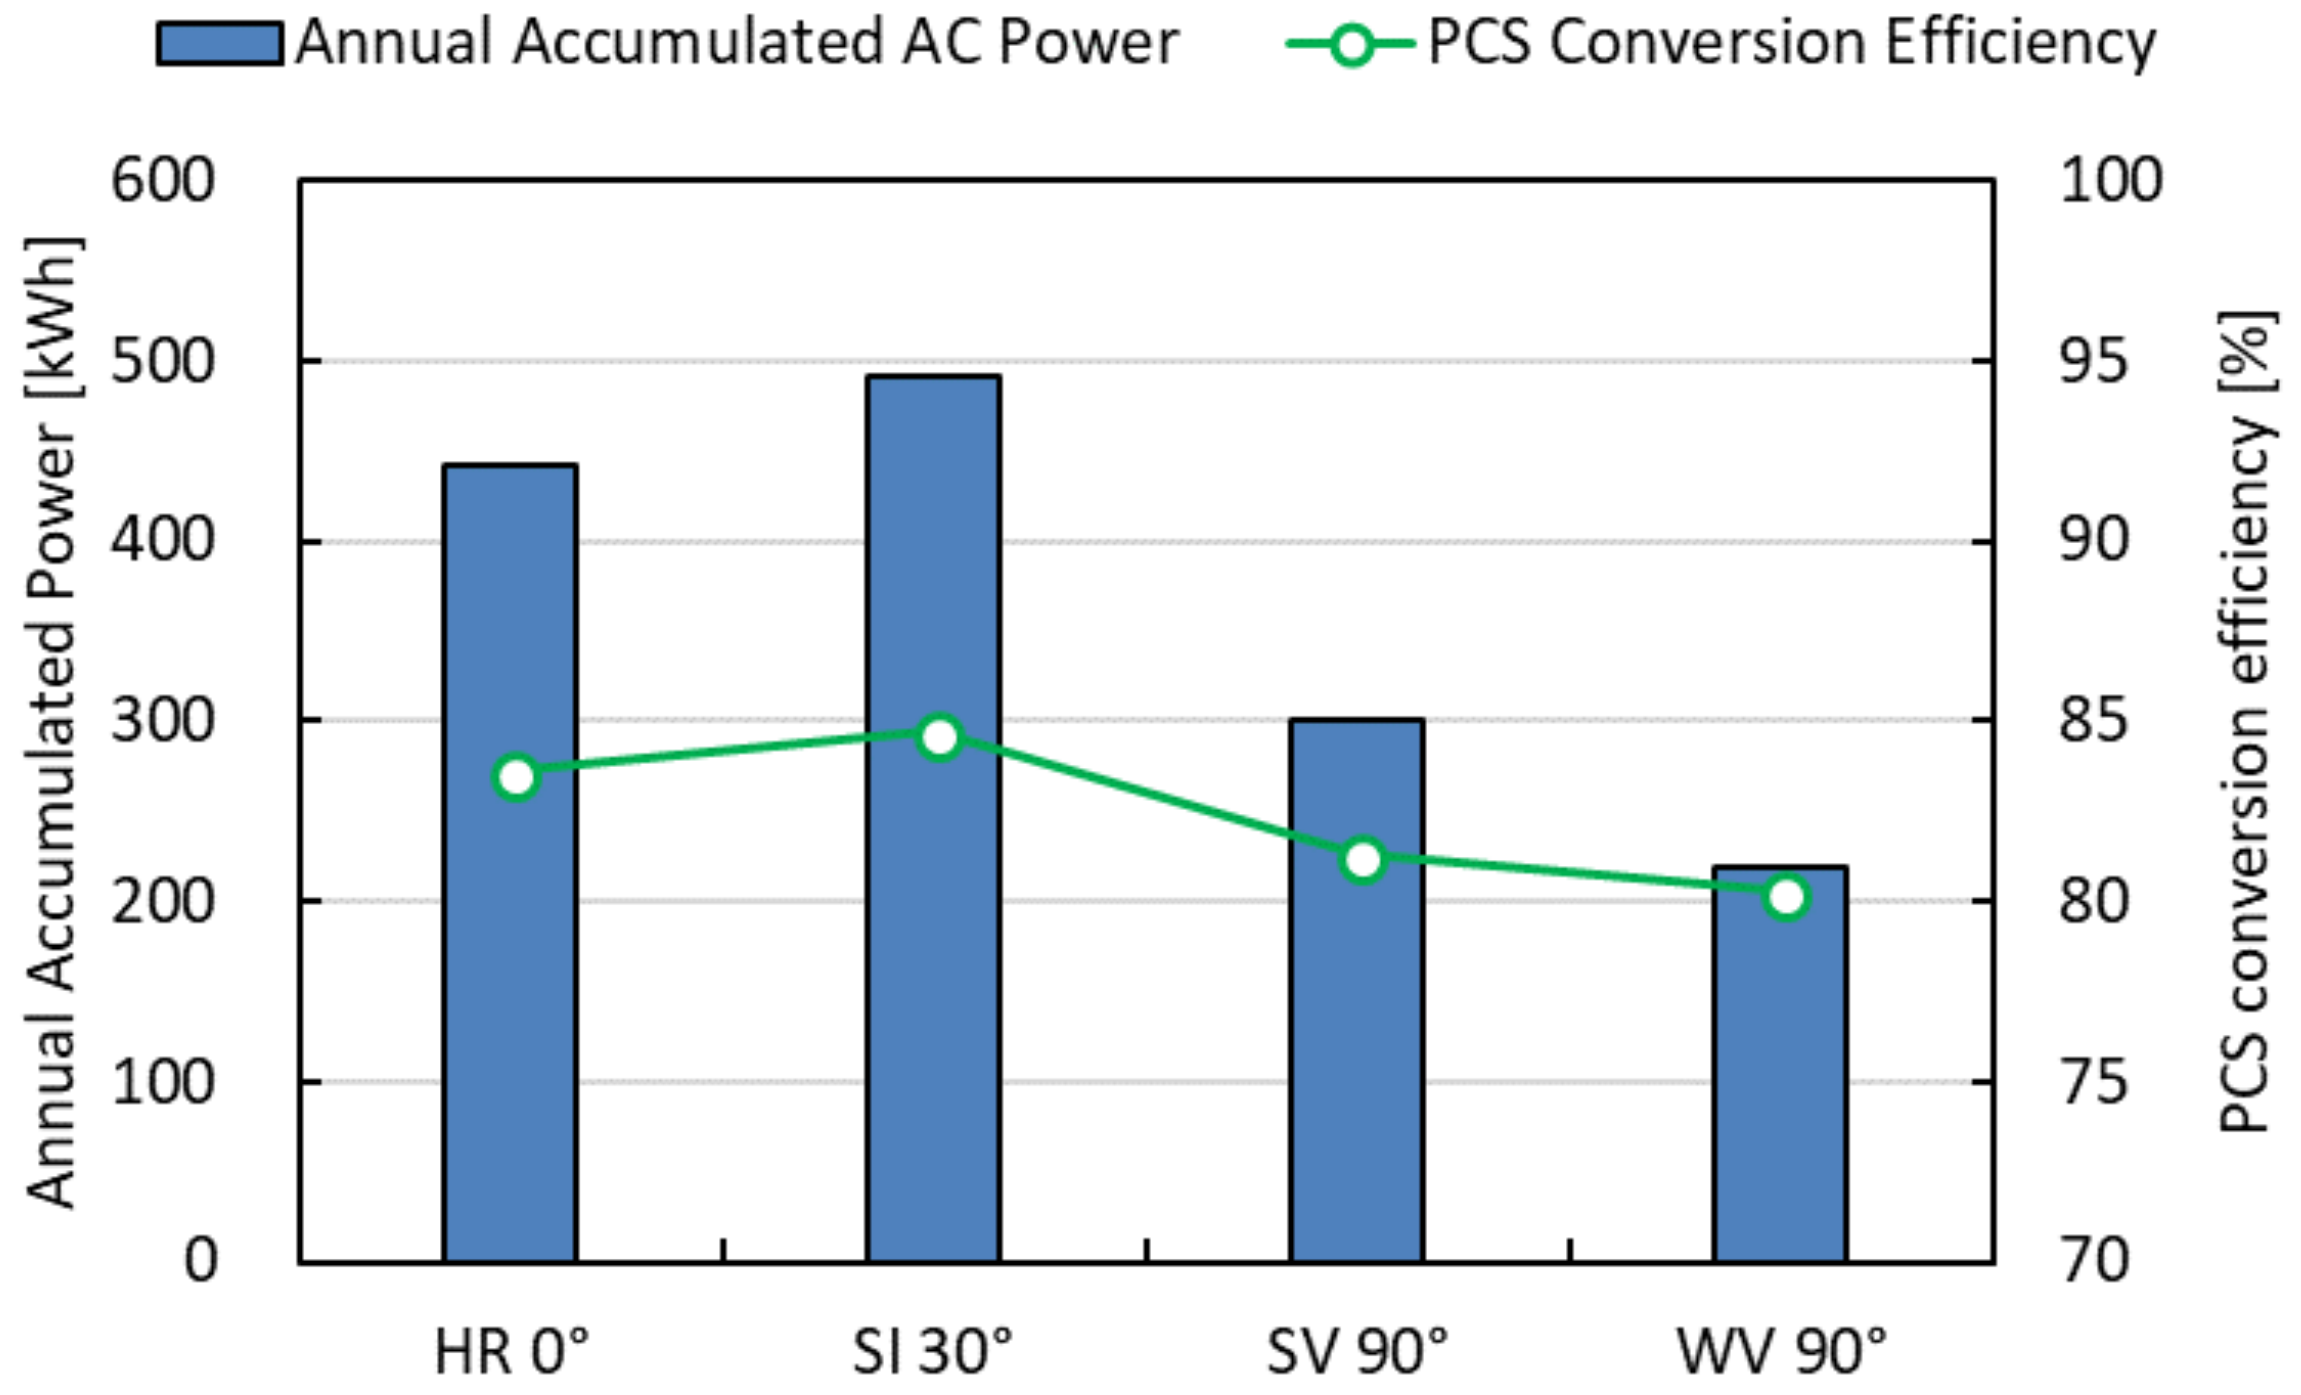
Figure 13 shows the analysis results of the annual PCS conversion efficiency of each PV array. SI 30° showed the highest conversion efficiency (84.7%), followed in order by HR 0° (83.6%), SV 90° (81.3%), and WV 90° (80.3%). The analyzed PCS conversion efficiency, ranging from 80.3(%) to 84.7(%), was significantly lower than the indicated efficiency of the PCS products (94.5%). Moreover, they were also much lower than the PCS conversion efficiency range (89–91%) of PV systems derived in previous research [
31]. If the input power of the PCS is within the range that allows the PCS to operate normally, the PR of the BIPV system used in this study would be expected to rise.
Figure 14 shows the PR of each array calculated assuming that the annual PCS conversion efficiency was 90%. When the PCS conversion efficiency was assumed to be 90%, the ratio of the system loss decreased, causing an increase in the final yield, which eventually resulted in an increase in PR. The actual PR of each PV array in the BIPV system did not exceed 70%, but when the PCS conversion efficiency was assumed to be 90%, the calculated PR ranged from 73.1(%) to 75.0(%). The increase rate of the PR was calculated to be 5.4% for HR 0°, 4.1% for SI 30°, 7.2% for SV 90°, and 8.0% for WV 90°. These results showed that designing a BIPV system without considering the impact of the PCS or PV array on the other subsystem could reduce the overall performance by up to 8.0%.
6. Discussion and Conclusions
This study examined the power generation performance of a BIPV system depending on the installation conditions (horizontal, south-inclined, south-vertical, west-vertical), and the power loss factors based on the long-term measured data of a BIPV system located in Korea. The power performance loss factors were analyzed by the module surface temperature, dust and soiling, PCS standby loss, and DC–AC conversion loss.
Power performance analysis was conducted through a performance ratio of IEC 61724. The analysis of the final yield showed that the final yield of HR 0° was 3.03 h/day. This was 2.2 times larger than that of WV 90°, which showed the lowest final yield (1.36 h/day). In addition, the PR ranged from 66.8(%) to 69.5(%) depending on the installation conditions, and HR 0° showed the highest power generation performance. Compared to the results of a previous study of the power generation performance of the BIPV system composed of the same module and PCS [
7], the system loss was relatively higher and the PRs of all arrays were less than 70(%).
An analysis of the power performance loss factors showed that the annual power performance loss due to the increase in module surface temperature ranged from 2.2(%) to 6.0(%). Regarding the losses due to the temperature rise, SI 30° showed the highest loss ratio of 6.0(%), followed by HR 0° (4.6(%)), SV 90° (3.9(%)), and WV 90° (2.2(%)). HR 0° showed a distribution of low temperatures throughout the year in the module surface temperature, but it showed the second highest power generation performance loss after SI 30°. Based on the analysis results, this large power performance loss was because although the average monthly temperature was low, the time when the temperature was 50 ℃ or higher was longer in HR 0° than in the other PV arrays.
The effects of dust and soiling on power performance losses were analyzed by comparing the power generation efficiencies before and after cleaning on the representative day. The efficiency of each PV array before cleaning was 3.9(%) HR 0°, 3.5(%) for SI 30°, 4.5(%) for SV 90°, and 3.5(%) for WV 90°. After cleaning, the efficiency of PV array was increased to 4.8(%) for HR 0°, 4.0(%) for SI 90°, 4.6(%) for SV 90°, and 3.7(%) for WV 90°. Compared to the efficiency values before cleaning, the performances of SV 90° and WV 90° were improved by approximately 5.7(%) and 2.2(%), respectively, whereas that of HR 0° and SI 30° were improved by 23.1(%) and 14.3(%), respectively. These results suggest that continuous management is required to maintain the initial power generation performance of PV systems installed on a horizontal or inclined plane.
An analysis of the power performance losses due to the PCS standby loss was conducted using the accumulated irradiation of the time when the PCS would not operate. The total ratio of the irradiation that was not used for power generation because the automatic start/stop function of the PCS was analyzed to be 6.8(%) for HR 0°, 4.9(%) for SI 30°, 8.4(%) for SV 90°, and 15.7(%) for WV 90°. When the influence of snow was excluded, the ratio was reduced to 5.1(%) for HR 0° and to 4.6(%) for SI 30°. These results show that 4.6–15.7(%) of the annual irradiation is not utilized for power generation due to the PCS standby mode.
The BIPV system investigated in this study was connected to a PV array with a capacity of 17.6(%) of the rated capacity of the PCS. The analysis results of the output of each PV array showed that more than half of the output values measured over a year were below 6.7(%) of the rated capacity of PCS. This caused a deterioration of the conversion efficiency of the PCS. An analysis of the annual conversion efficiency of each PV array, showed that SI 30°, which is a favorable condition for receiving intense irradiation compared to other PV arrays, showed the highest efficiency of 84.7(%), followed in order by HR 0° (83.6(%)), SV 90° (81.3(%)), and WV 90° (80.3(%)). These results indicated that the conversion efficiency of the PCS decreased as the solar irradiation conditions become less favorable. When PR was calculated, assuming the PCS performance when it operates normally, it showed an increase of 4.1(%) to 8.0(%).
The optimal installation condition for South Korea PV system is the southward inclination angle of 30. However, it is very difficult to install the BIPV system under optimum installation conditions except for the case where it is installed on the roof or the rooftop of the building. In addition, since the BIPV system is installed mainly on the elevation of the building, the installation azimuth of the PV array is also limited. For this reason, the BIPV system generates less power than the PV system.
There is a limit to the increase of power generated by the BIPV system. Therefore, it is necessary to pay attention to and manage the performance loss factors that may occur in its design and operation. The results of this study can quantitatively evaluate some performance factors that may arise from design to operation of BIPV system. Since the effect of the performance loss factor by the installation condition under the same environmental condition was evaluated, it was possible to derive the loss factor to be considered further according to the installation condition.
In case of installation conditions with a high accumulated irradiance, it was confirmed that the power generation was large, but that the efficiency of the PV array was relatively lower. In case of installation conditions with low accumulated irradiation, the power generation was small, but the performance loss due to module temperature was also small. It is also expected that it will be able to maintain the design performance in the long term because the influence on dust and soiling is relatively low. In the case of performance loss due to the capacity mismatch of the PCS and the PV array, the installation condition with low accumulated irradiation was analyzed to have a large performance loss.
The results of this study demonstrate the effects of the performance loss factors that can occur in general BIPV and PV systems, even though the degree of the impact may vary from region to region. Efforts are needed to maintain the design performance of the BIPV system through ongoing management from design to operation.


