Gene Selection in Cancer Classification Using Sparse Logistic Regression with L1/2 Regularization

Faculty of Information Technology, Macau University of Science and Technology, Macau 999078, China
*
Author to whom correspondence should be addressed.
Appl. Sci. 2018, 8(9), 1569; https://doi.org/10.3390/app8091569
Submission received: 8 August 2018
/
Revised: 29 August 2018
/
Accepted: 4 September 2018
/
Published: 6 September 2018
(This article belongs to the Section Applied Biosciences and Bioengineering)
Abstract
:In recent years, gene selection for cancer classification based on the expression of a small number of gene biomarkers has been the subject of much research in genetics and molecular biology. The successful identification of gene biomarkers will help in the classification of different types of cancer and improve the prediction accuracy. Recently, regularized logistic regression using the regularization has been successfully applied in high-dimensional cancer classification to tackle both the estimation of gene coefficients and the simultaneous performance of gene selection. However, the has a biased gene selection and dose not have the oracle property. To address these problems, we investigate regularized logistic regression for gene selection in cancer classification. Experimental results on three DNA microarray datasets demonstrate that our proposed method outperforms other commonly used sparse methods and in terms of classification performance.
1. Introduction
With the development of DNA microarray technology, biological researchers can pay more attention to simultaneously studying the expression levels of thousands of genes [1,2]. Cancer classification based on gene expression levels is one of the most active topics in genome research, which is appropriate for gene expression levels in different situations (e.g., normal and abnormal) [3,4]. However, cancer classification using DNA microarray data is a challenge because of the data’s high dimension and small sample size [5]. Generally, the number of genes ranges in the thousands from a hundred or fewer tissue samples, and so gene selection has recently emerged as important technology for cancer classification [6]. Gene selection is applied because only a small subset of genes is strongly indicative of a targeted disease. From the biological perspective, effective gene selection methods can be desirable to help to classify different types of cancer and improve the accuracy of prediction [7,8,9].
Many gene selection methods have been proposed for selection of the subset of meaningful and important genes that can achieve high cancer classification performance. Recently, there has been growing interest in applying regularization techniques in gene selection. Regularization methods are an important embedded technique [10,11,12,13]. From the statistical perspective, regularization methods can prevent over-fitting. Many statistical methods have been successfully applied to cancer classification. Among them, logistic regression [14,15,16,17] is a powerful discriminative method, and has a direct probabilistic interpretation that can obtain classification probabilities apart from the class label information. However, logistic regression is not suitable for solving the high-dimensional and small sample size problem because the design matrix is singular. Thus, Newton–Raphson’s method cannot work. Regularized logistic regression has been successfully applied in cancer classification in order to be suitable for high dimension and small sample size [7,8]. The advantages of regularized logistic regression can improve the classification accuracy by shrinking the regression coefficients and selecting a small subset of genes. Different regularization terms are applied to regularized logistic regression. The widely popular regularization term is penalty, which is the least absolute shrinkage and selection operator (lasso) [18]. Meanwhile, there are various of versions of , such as smoothly clipped absolute deviation (SCAD) [19], maximum concave penalty (MCP) [20], group lasso [21], and so on. The regularization can assign some genes’ coefficients to zero for variable selection. Thus, the regularization has been widely applied to data with high dimension and small sample size.
Although a well-known regularization method is the penalty, it has some limitations [22]. The regularization does not have oracle property [19], which means the aim-listed probability of selecting the right set of genes (with nonzero coefficients) converges to one, and the estimators of the nonzero coefficients have asymptotically normal distribution with the same means and covariances as if the zero coefficients were known in the prior. Besides, there is grouping among genes in DNA microarray data. Related to this limitation, concerning the grouping property, Zhou and Hastie proposed the elastic net penalty () [23], which is a linear combination of and penalties. In addition, regularization is not sparser. To overcome this limitation, Xu et al. proposed the penalty—a method that can be taken as a representative of penalty in both sparsity and computational efficiency, and has demonstrated many attractive properties, such as unbiasedness and oracle properties [24,25,26]. Therefore, we investigated regularized logistic regression for gene selection in cancer classification. The approach is suitable for DNA data with high dimension and small sample size. To evaluate the effectiveness of the approach, three public datasets were applied to cancer classification. Additionally, we compared other commonly used sparse methods and to our methods.
Our research can be summarized as follows are given as follows:
- identification of gene biomarkers will help to classify different types of cancer and improve the prediction accuracy.
- The penalized logistic regression is used as a gene selection method for cancer classification to overcome the over-fitting problem with high-dimensional data and small sample size.
- Experimental results on three GEO lung cancer datasets corroborate our ideas and demonstrate the correctness and effectiveness of penalized logistic regression.
2. Methods
2.1. Regularized Logistic Regression
In this paper, we only consider a general binary classification problem and get a predictor vector X and a response variable y, which consists of genes and corresponding tissue samples, respectively. Suppose we have n samples, D = (, ), (, ), …, (, ), where = (, , …, ) is ith input pattern with dimensionality p, which means the has p descriptors and denotes the value of gene j for the ith sample. is a corresponding variable that takes a value of 0 or 1. Define a classifier , and the logistic regression is shown as follows:
Additionally, the log-likelihood can be expressed as follows:
We can get the value of vector from Equation (2). However, solving Equation (2) can result in over-fitting with data of high dimension and small sample size. Therefore, in order to address the problem, we add the regularization terms to Equation (2):
where and are loss function and penalty function, respectively, and is a tuning parameter. Note that . When q is equal to 1, the has been proposed. Moreover, there are various of versions of , such as SCAD, MCP, group lasso, and so on. We add the regularization to Equation (2). The formula is expressed as follows:
From a biologist’s point of view, there is a grouping property among genes, which is a limitation of regularization. To overcome this limitation, Zou et al. proposed the elastic net () regularization method for gene selection. The regularization tries to combine with in order to search for highly correlated genes and perform gene selection simultaneously. The regularized logistic regression using is exhibited as follows:
2.2. Regularized Logistic Regression
Despite the advantages of and , there are some limitations. and have a biased gene selection, and they do not have an oracle property. Besides, theoretically, the -type regularization with the lower value of q would lead to better solutions with more sparsity. However, difficulties with convergence arise when q is very close to zero. Therefore, Xu et al. proposed regularization. When , comparing with , the convergence of regularization is not high, while when , comparing with , solving the regularization is much simpler. Thus, the regularization can be taken as a representative of regularization. The regularized logistic regression is as follows:
where the value of can be obtained by calculating Equation (7).
In this paper, we apply the coordinate descent algorithm to solve Equation (7). The algorithm is a “one-at-a-time” algorithm and solves , and other (representing the parameters remaining after the jth element is removed) are fixed [7,8]. Suppose that we have n samples, D = (, ), (, ), …, (, ), where = (, , …, ) is the ith input pattern with dimensionality p, which means the has p genes and denotes the value of genes j for the ith sample. is a corresponding variable that takes a value of 0 or 1. indicates that the ith sample is in Class 1 and indicates that the ith sample is in Class 2. Inspired by Friedman et al. [27], Xu et al. [26], and Xia et al. [28], the univariate half thresholding operator for a -penalized logistic regression coefficient is as follows:
Besides, the univariate thresholding operator of the coordinate descent algorithm for the regularization can be defined as:
where is a soft thresholding operator for the if a is equal to 1, as follows:
Inspired by Reference [7], Equation (7) is linearized by one-term Taylor series expansion:
where , , and . Redefine the partial residual for fitting as and . A pseudocode of coordinate descent algorithm for penalized logistic regression is described in Algorithm 1 [7].
| Algorithm 1: A coordinate descent algorithm for penalized logistic regression. |
 |
2.3. Classification Evaluation Criteria
In order to evaluate the cancer classification performance of the proposed method, accuracy, sensitivity, and specificity were applied to three public DNA microarray data. The formulas of accuracy, sensitivity, and specificity are shown as follows [29]:
where refers to true positives, refers to true negatives, refers to false positives, and refers to false negatives.
3. Datasets
In this section, three public QSAR datasets were obtained online, including GSE10072 [30], GSE19804 [31], and GSE4115 [32]. A brief description of these datasets is given in Table 1.
3.1. GSE10072
The dataset is provided by the National Cancer Institute (NIH). There are 107 samples, of which 58 are lung tumor, and the other 49 are normal lung. Each sample contained 22,283 genes.
3.2. GSE19804
We obtained this dataset online. For data preprocessing, we utilized 120 samples, which consisted of 60 lung cancer and 60 lung normal samples, with 54,675 genes for the model as input.
3.3. GSE4115
This cancer dataset is from the Boston University Medical Center. After preprocessing, the number of lung cancer and normal lung samples was 97 and 90, respectively. Each sample contained 22,215 descriptors.
4. Results
In this section, two methods are compared to our proposed method, including and . To evaluate the prediction accuracy of the three logistic regression models, we first used random partition to divide the samples. That is to say, the samples were divided into training samples (70%) and testing samples (30%). The detailed information of the three publicly available datasets used in the experiments are shown in Table 2. Secondly, in order to obtain the tuning parameter , we applied 5-fold cross validation to the training set. Thirdly, the classification evaluation criteria were the corresponding average number at 50 runs.
Table 3 shows that the results of the training set and testing set were obtained by , , and . The results obtained by were better those of and . For example, for the training set in the dataset GSE10072, the values of sensitivity, specificity, and accuracy of were the same as for . Besides, the values of sensitivity and accuracy of were 0.98, and 0.99 lower than those of . For the testing set in dataset GSE4115, and ranked first and second, respectively. was the last. For instance, the value of accuracy of was 0.80, higher than the 0.77 and 0.78 of and , respectively. Moreover, was more sparse than and . As shown in Figure 1, In dataset GSE17084, the number of selected genes of was 8, lower than the respective 33 and 82 of and . In a word, was superior to and .
In order to search the common gene signatures selected by the different methods, we used VENNY software (2.1.0 Centro Nacional de Biotecnología, Madrid, Spain, 2015) [33] to generate Venn diagrams. As shown in Figure 2, we considered the common gene signatures selected by the logistic regression model with , , and regularization methods, which are the most relevant signatures of lung cancer. Hence, 2, 3, and 2 common genes were found in these methods for different datasets.
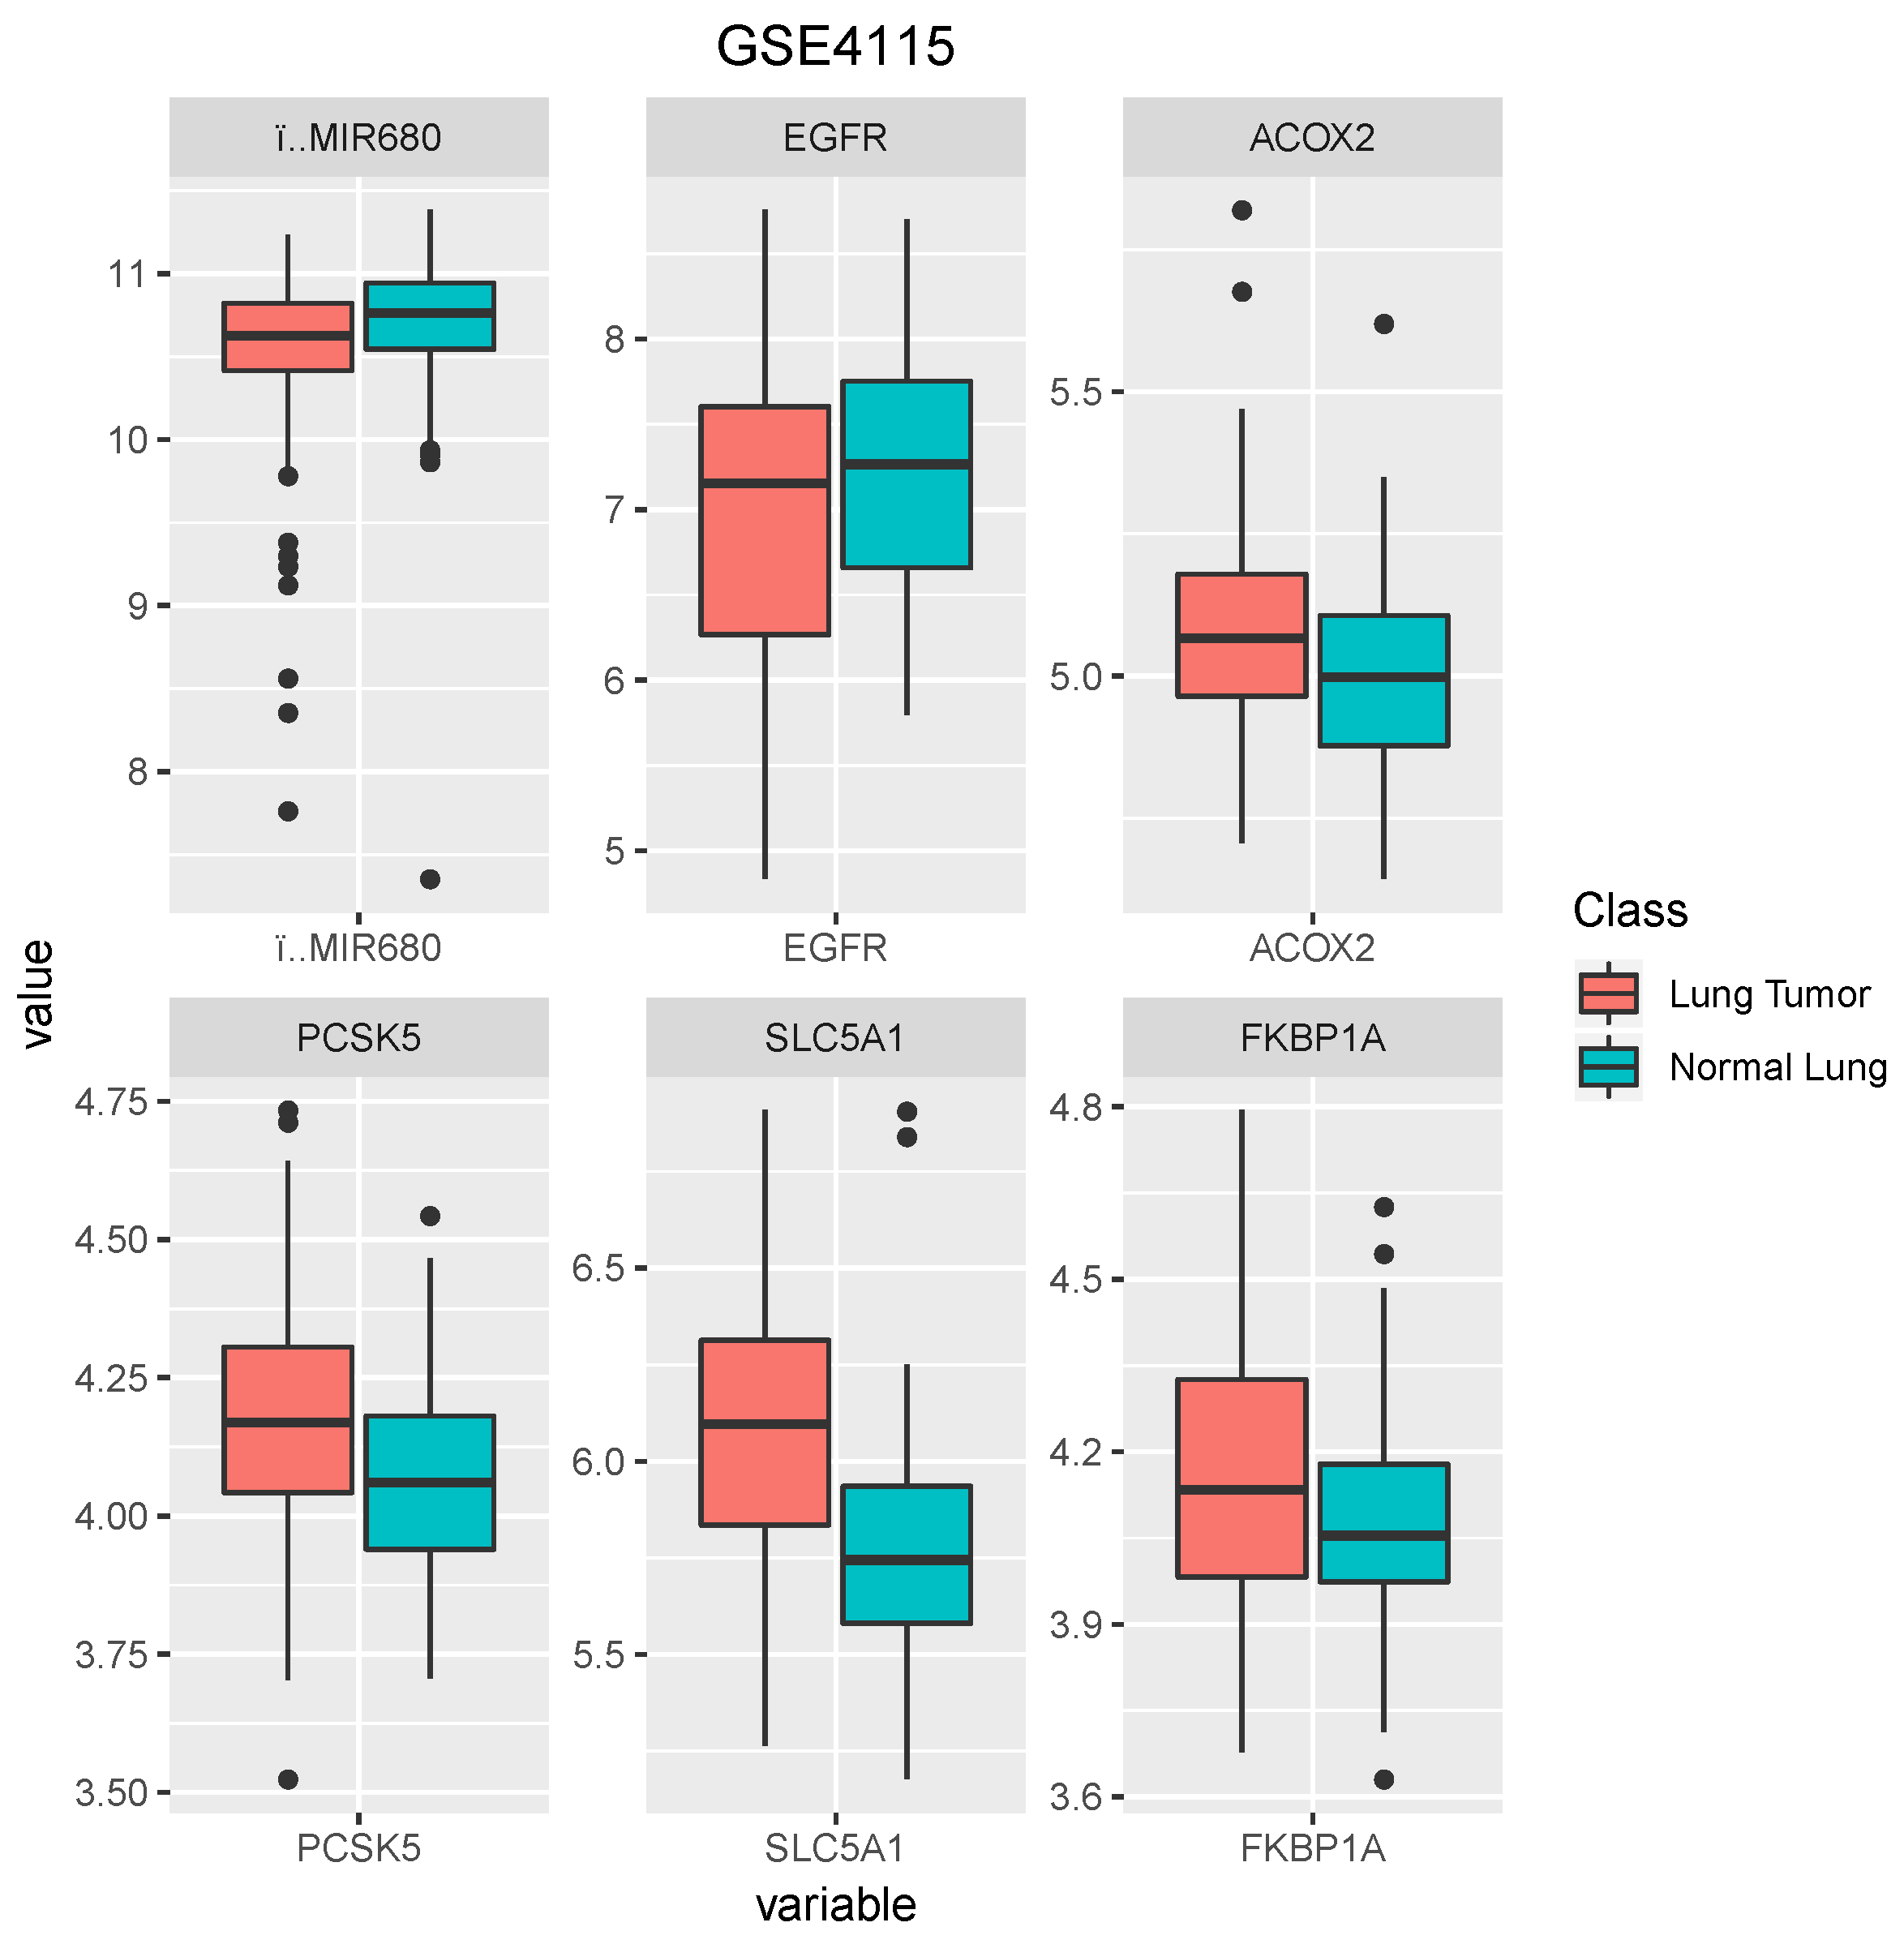
Table 4 shows that the genes were selected by . At the beginning of the experiments, the attribute of genes was prob set ID. Thus, we could transform prob set ID to gene symbol by using the software DAVID 6.8 [34]. The data distribution for the selected genes is displayed in Figure 3, Figure 4 and Figure 5. From inspecting the figures, we can find that some genes facilitated the classification of lung tumor and normal lung, such as FAM107A, KDELR2, AASS, and SFRP1 for dataset GSE10072; and SOCS2 and EHD2 for dataset GSE19804. In addition, we found that a common gene in the three different datasets using was EGFR [35,36]. However, due to the distribution of the data of different datasets, we cannot use gene EFGR to classify different types of cancer and improve the prediction accuracy. Furthermore, the literature indicates that never-smokers with adenocarcinoma have the highest incidence of EGFR, HER2, ALK, RET, and ROS1 mutations [37]. Therefore, our proposed is an effective technique in gene selection and classification.
5. Conclusions
In cancer classification with data of high dimension and small sample size, only a small number of genes strongly suggest specific diseases. Therefore, gene selection is widely popular in cancer classification. Especially, regularization methods have the capacity to select a small subset of meaningful and important genes. In this study, we applied to a logistic regression model to perform gene selection. Additionally, during the updating of the estimated coefficients, the proposed method utilizes a novel univariate half thresholding.
Experimental results on three cancer datasets demonstrated that our proposed method outperformed the other commonly used sparse methods and in terms of classification performance, while fewer but informative genes were selected—especially the gene EFGR. Therefore, regularization is a promising tool for feature selection in classification problems.
Author Contributions
S.W. contributed to collecting datasets and analyzing data. S.W. and H.J. designed and implemented the algorithm. H.S. and Z.Y. contributed to the interpretation of the results. S.W. took the lead in writing the manuscript. S.W., H.J., H.S., and Z.Y. revised the manuscript.
Funding
This research received no external funding.
Acknowledgments
This work is supported by the Macau Science and Technology Development Funds Grand No. 003/2016/AFJ from the Macau Special Administrative Region of the People’s Republic of China.
Conflicts of Interest
The authors declare no conflict of interest.
References
- Kalina, J. Classification methods for high-dimensional genetic data. Biocybern. Biomed. Eng. 2014, 34, 10–18. [Google Scholar] [CrossRef]
- Kastrin, A.; Peterlin, B. Rasch-based high-dimensionality data reduction and class prediction with applications to microarray gene expression data. Expert Syst. Appl. 2010, 37, 5178–5185. [Google Scholar] [CrossRef] [Green Version]
- Lotfi, E.; Keshavarz, A. Gene expression microarray classification using PCA–BEL. Comput. Biol. Med. 2014, 54, 180–187. [Google Scholar] [CrossRef] [PubMed]
- Algamal, Z.Y.; Lee, M.H. Penalized logistic regression with the adaptive LASSO for gene selection in high-dimensional cancer classification. Expert Syst. Appl. 2015, 42, 9326–9332. [Google Scholar] [CrossRef]
- Chen, S.X.; Qin, Y.L. A two-sample test for high-dimensional data with applications to gene-set testing. Ann. Stat. 2010, 38, 808–835. [Google Scholar] [CrossRef]
- Yata, K.; Aoshima, M. Intrinsic dimensionality estimation of high-dimension, low sample size data with d-asymptotics. Commun. Stat. Theory Methods 2010, 39, 1511–1521. [Google Scholar] [CrossRef] [Green Version]
- Liang, Y.; Liu, C.; Luan, X.Z.; Leung, K.S.; Chan, T.M.; Xu, Z.B.; Zhang, H. Sparse logistic regression with a L1/2 penalty for gene selection in cancer classification. BMC Bioinform. 2013, 14, 198. [Google Scholar] [CrossRef] [PubMed]
- Huang, H.H.; Liu, X.Y.; Liang, Y. Feature selection and cancer classification via sparse logistic regression with the hybrid L1/2+2 regularization. PLoS ONE 2016, 11, e0149675. [Google Scholar] [CrossRef] [PubMed]
- Huang, H.H.; Liu, X.Y.; Liang, Y.; Chai, H.; Xia, L.Y. Identification of 13 blood-based gene expression signatures to accurately distinguish tuberculosis from other pulmonary diseases and healthy controls. Bio-Med. Mater. Eng. 2015, 26, S1837–S1843. [Google Scholar] [CrossRef] [PubMed]
- Ma, S.; Huang, J. Regularized gene selection in cancer microarray meta-analysis. BMC Bioinform. 2009, 10, 1. [Google Scholar] [CrossRef] [PubMed]
- Deng, H.; Runger, G. Gene selection with guided regularized random forest. Pattern Recognit. 2013, 46, 3483–3489. [Google Scholar] [CrossRef] [Green Version]
- Allen, G.I. Automatic feature selection via weighted kernels and regularization. J. Comput. Graph. Stat. 2013, 22, 284–299. [Google Scholar] [CrossRef]
- Zou, H.; Yuan, M. Regularized simultaneous model selection in multiple quantiles regression. Comput. Stat. Data Anal. 2008, 52, 5296–5304. [Google Scholar] [CrossRef]
- Harrell, F.E. Ordinal logistic regression. In Regression Modeling Strategies; Springer: New York, NY, USA, 2015; pp. 311–325. [Google Scholar]
- Menard, S. Applied Logistic Regression Analysis; Sage: Newcastle upon Tyne, UK, 2002; Volume 106. [Google Scholar]
- Hayes, A.F.; Matthes, J. Computational procedures for probing interactions in OLS and logistic regression: SPSS and SAS implementations. Behav. Res. Methods 2009, 41, 924–936. [Google Scholar] [CrossRef] [PubMed] [Green Version]
- Wang, Q.; Dai, H.N.; Wu, D.; Xiao, H. Data analysis on video streaming QoE over mobile networks. EURASIP J. Wirel. Commun. Netw. 2018, 2018, 173. [Google Scholar] [CrossRef]
- Tibshirani, R. Regression shrinkage and selection via the lasso. J. R. Stat. Soc. Ser. B (Methodol.) 1996, 58, 267–288. [Google Scholar]
- Fan, J.; Li, R. Variable selection via nonconcave penalized likelihood and its oracle properties. J. Am. Stat. Assoc. 2001, 96, 1348–1360. [Google Scholar] [CrossRef]
- Zhang, C.H. Nearly unbiased variable selection under minimax concave penalty. Ann. Stat. 2010, 38, 894–942. [Google Scholar] [CrossRef]
- Meier, L.; Van De Geer, S.; Bühlmann, P. The group lasso for logistic regression. J. R. Stat. Soc. Ser. B (Stat. Methodol.) 2008, 70, 53–71. [Google Scholar] [CrossRef] [Green Version]
- Feng, Z.Z.; Yang, X.; Subedi, S.; McNicholas, P.D. The LASSO and sparse least squares regression methods for SNP selection in predicting quantitative traits. IEEE/ACM Trans. Comput. Biol. Bioinform. (TCBB) 2012, 9, 629–636. [Google Scholar] [CrossRef] [PubMed]
- Zou, H.; Hastie, T. Regularization and variable selection via the elastic net. J. R. Stat. Soc. Ser. B (Stat. Methodol.) 2005, 67, 301–320. [Google Scholar] [CrossRef]
- Xu, Z.B.; Guo, H.L.; Wang, Y.; Zhang, H. Representative of L1/2 regularization among Lq (0 < q ≤ 1) regularizations: An experimental study based on phase diagram. Acta Autom. Sin. 2012, 38, 1225–1228. [Google Scholar]
- Xu, Z.; Zhang, H.; Wang, Y.; Chang, X.; Liang, Y. L1/2 regularization. Sci. China Inf. Sci. 2010, 53, 1159–1169. [Google Scholar] [CrossRef]
- Xu, Z.; Chang, X.; Xu, F.; Zhang, H. L1/2 regularization: A thresholding representation theory and a fast solver. IEEE Trans. Neural Netw. Learn. Syst. 2012, 23, 1013–1027. [Google Scholar] [PubMed]
- Friedman, J.; Hastie, T.; Tibshirani, R. Regularization paths for generalized linear models via coordinate descent. J. Stat. Softw. 2010, 33, 1. [Google Scholar] [CrossRef] [PubMed]
- Xia, L.Y.; Wang, Y.W.; Meng, D.Y.; Yao, X.J.; Chai, H.; Liang, Y. Descriptor Selection via Log-Sum Regularization for the Biological Activities of Chemical Structure. Int. J. Mol. Sci. 2017, 19, 30. [Google Scholar] [CrossRef] [PubMed]
- Sohal, H.; Eldridge, S.; Feder, G. The sensitivity and specificity of four questions (HARK) to identify intimate partner violence: A diagnostic accuracy study in general practice. BMC Fam. Pract. 2007, 8, 49. [Google Scholar] [CrossRef] [PubMed]
- Gene Expression Signature of Cigarette Smoking and Its Role in Lung Adenocarcinoma Development and Survival. Available online: https://www.ncbi.nlm.nih.gov/geo/query/acc.cgi?acc=GSE10072 (accessed on 27 December 2017).
- Genome-Wide Screening of Transcriptional Modulation in Non-Smoking Female Lung Cancer in Taiwan. Available online: https://www.ncbi.nlm.nih.gov/geo/query/acc.cgi?acc=GSE19804 (accessed on 3 June 2018).
- Airway Epithelial Gene Expression Diagnostic for the Evaluation of Smokers with Suspect Lung Cancer. Available online: https://www.ncbi.nlm.nih.gov/geo/query/acc.cgi?acc=GSE4115 (accessed on 27 December 2017).
- Oliveros, J. An Interactive Tool for Comparing Lists with Venn’s Diagrams (2007–2015). Available online: http://bioinfogp.cnb.csic.es/tools/venny/index.html (accessed on 21 May 2018).
- Da Wei Huang, B.T.S.; Stephens, R.; Baseler, M.W.; Lane, H.C.; Lempicki, R.A. DAVID gene ID conversion tool. Bioinformation 2008, 2, 428. [Google Scholar] [CrossRef]
- Rosell, R.; Carcereny, E.; Gervais, R.; Vergnenegre, A.; Massuti, B.; Felip, E.; Palmero, R.; Garcia-Gomez, R.; Pallares, C.; Sanchez, J.M.; et al. Erlotinib versus standard chemotherapy as first-line treatment for European patients with advanced EGFR mutation-positive non-small-cell lung cancer (EURTAC): A multicentre, open-label, randomised phase 3 trial. Lancet Oncol. 2012, 13, 239–246. [Google Scholar] [CrossRef]
- Kobayashi, S.; Boggon, T.J.; Dayaram, T.; Jänne, P.A.; Kocher, O.; Meyerson, M.; Johnson, B.E.; Eck, M.J.; Tenen, D.G.; Halmos, B. EGFR mutation and resistance of non–small-cell lung cancer to gefitinib. N. Engl. J. Med. 2005, 352, 786–792. [Google Scholar] [CrossRef] [PubMed]
- Richards, E. Molecular Profiling of Lung Cancer. Ph.D. Thesis, Imperial College London, London, UK, 2013. [Google Scholar]
Figure 1.
The number of genes selected by , , and .

Figure 2.
Venn diagram analysis of the results of , , and .
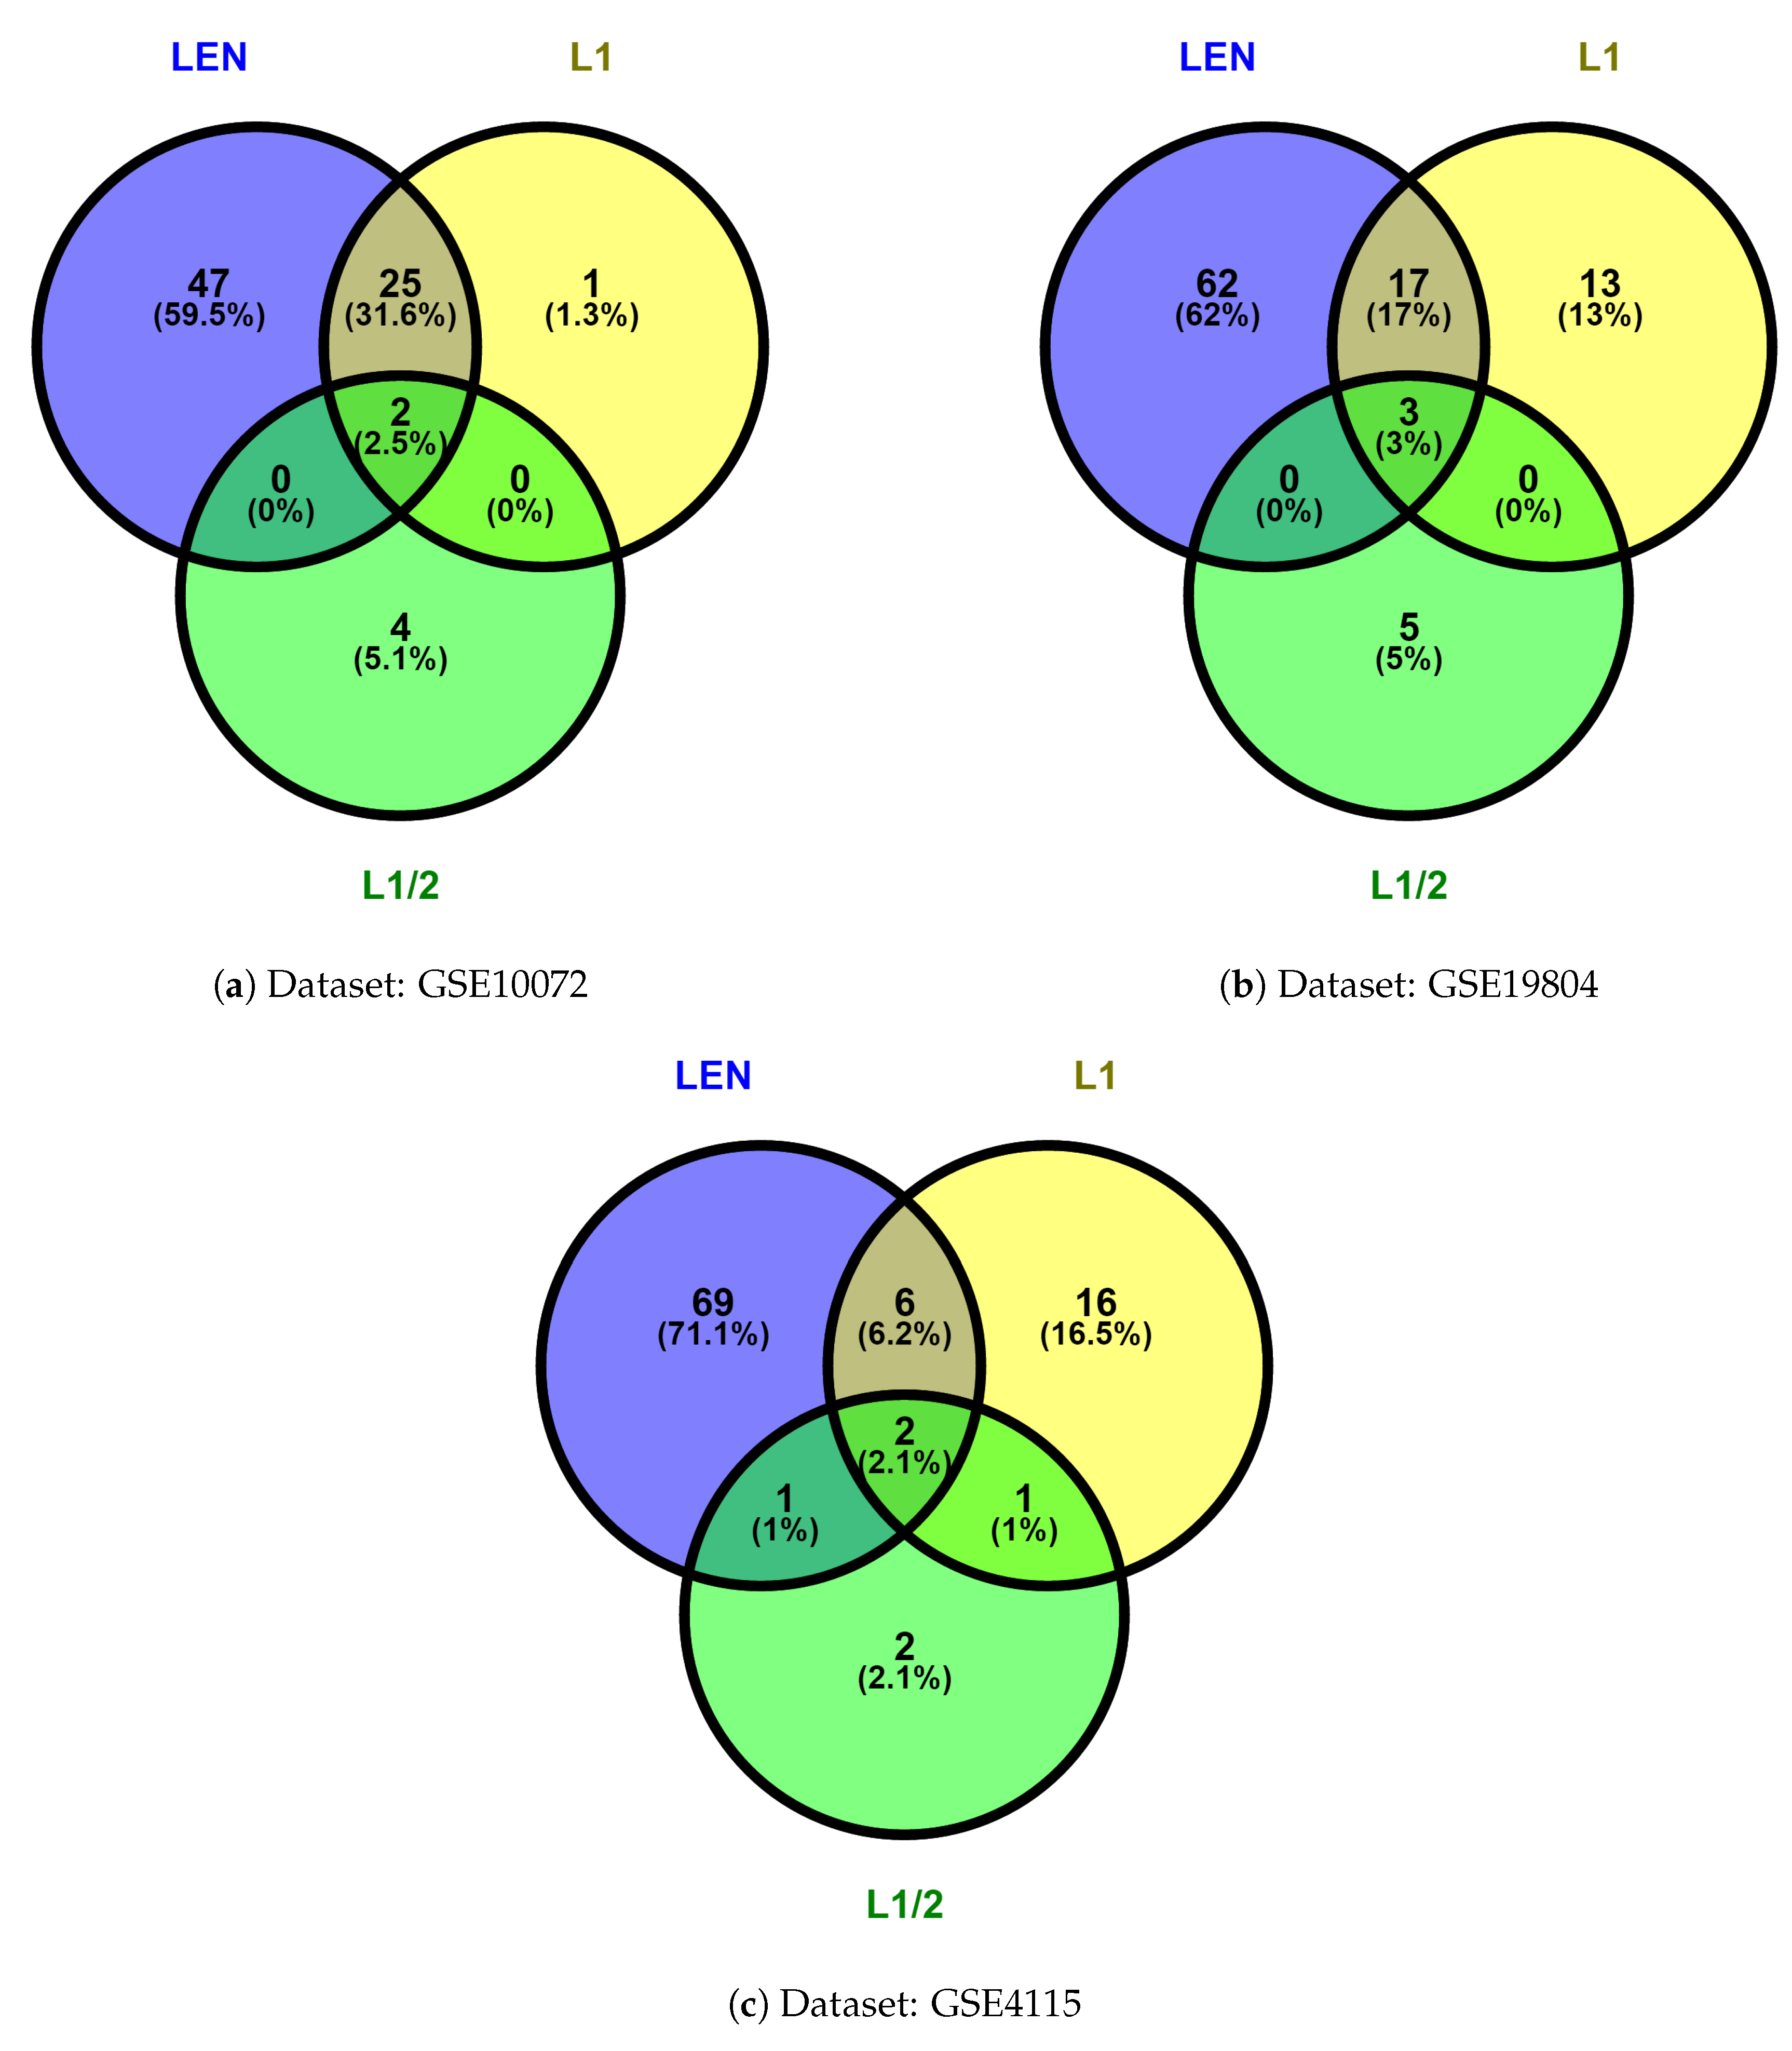
Figure 3.
The box plots of selected genes by for dataset GSE10072.

Figure 4.
The box plots of selected genes by for dataset GSE19804.
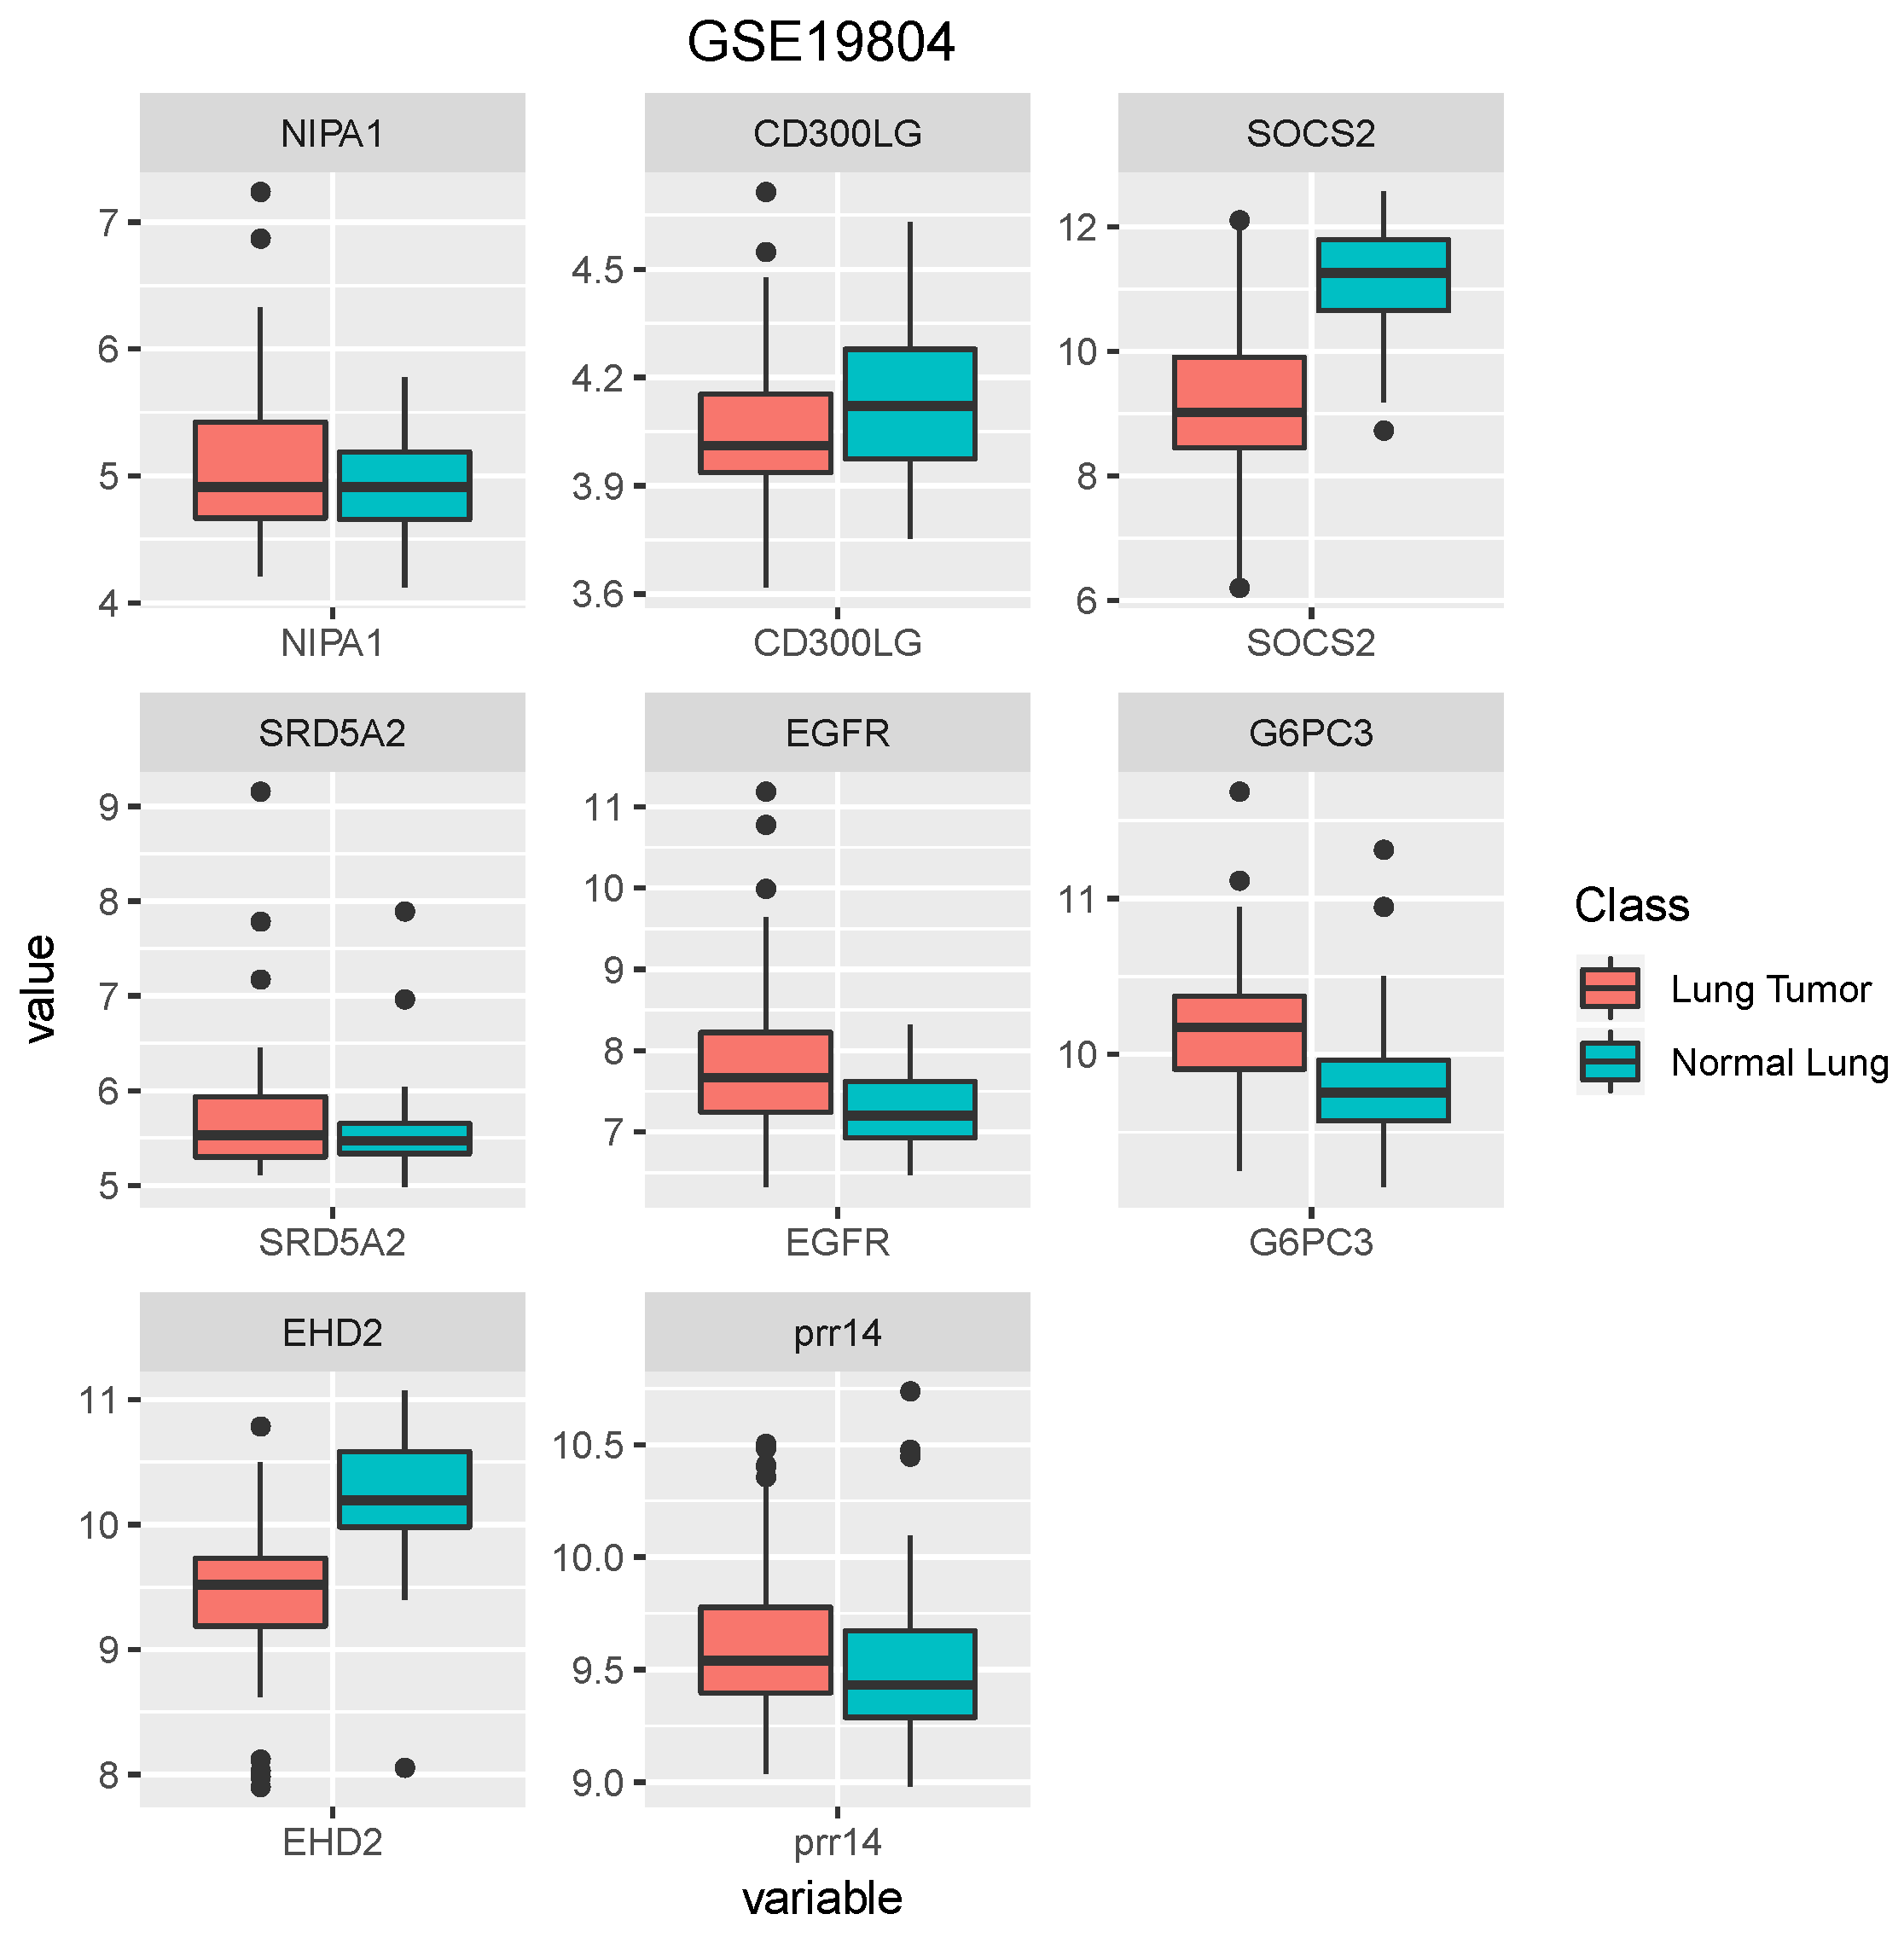
Figure 5.
The box plots of selected genes by for dataset GSE4115.

Table 1.
Three publicly available cancer datasets used in the experiments.
| Datasets | No. of Samples | No. of Genes | Class |
|---|---|---|---|
| GSE10072 | 107 | 22283 | Normal/Tumor |
| GSE19804 | 120 | 54675 | Normal/Tumor |
| GSE4115 | 187 | 22215 | Normal/Tumor |
Table 2.
Detailed information of the three publicly available datasets used in the experiments.
| Datasets | No. of Training (Class 1/Class 2) | No. of Testing (Class 1/Class 2) |
|---|---|---|
| GSE10072 | 75 (35 Normal/40 Tumor) | 32 (14 Normal/18 Tumor) |
| GSE19804 | 84 (46 Normal/38 Tumor) | 36 (14 Normal/22 Tumor) |
| GSE4115 | 131 (67 Normal/64 Tumor) | 56 (31 Normal/25 Tumor) |
Table 3.
Mean results of empirical datasets. The results of our proposed method are given in bold.
| Methods | Datasets | Training Set (5-CV) | Testing Set | ||||
|---|---|---|---|---|---|---|---|
| Sensitivity | Specificity | Accuracy | Sensitivity | Specificity | Accuracy | ||
| GSE10072 | 1.00 | 1.00 | 1.00 | 0.92 | 0.98 | 0.95 | |
| GSE19084 | 1.00 | 0.98 | 0.99 | 0.87 | 0.72 | 0.81 | |
| GSE4115 | 0.83 | 0.97 | 0.91 | 0.77 | 0.74 | 0.73 | |
| Mean | 0.94 | 0.98 | 0.97 | 0.85 | 0.81 | 0.83 | |
| GSE10072 | 0.98 | 1.00 | 0.99 | 0.93 | 0.94 | 0.94 | |
| GSE19084 | 1.00 | 0.98 | 0.99 | 0.90 | 0.68 | 0.81 | |
| GSE4115 | 0.94 | 0.98 | 0.96 | 0.78 | 0.85 | 0.78 | |
| Mean | 0.97 | 0.99 | 0.98 | 0.87 | 0.82 | 0.84 | |
| GSE10072 | 1.00 | 1.00 | 1.00 | 0.94 | 1.00 | 0.97 | |
| GSE19084 | 1.00 | 1.00 | 1.00 | 0.92 | 0.75 | 0.87 | |
| GSE4115 | 0.98 | 0.99 | 0.98 | 0.78 | 0.93 | 0.83 | |
| Mean | 0.99 | 1.00 | 0.99 | 0.88 | 0.89 | 0.89 | |
Table 4.
The genes selected by for different datasets.
| Dataset: GSE10072 | ||
| Prob_ID | Gene Symbol | Gene Name |
| 209074_s_at | FAM107A | family with sequence similarity 107 member A (FAM107A) |
| 200700_s_at | KDELR2 | KDEL endoplasmic reticulum protein retention receptor 2 (KDELR2) |
| 201983_s_at | EGFR | epidermal growth factor receptor (EGFR) |
| 210852_s_at | AASS | aminoadipate-semialdehyde synthase (AASS) |
| 202037_s_at | SFRP1 | secreted frizzled related protein 1 (SFRP1) |
| 203295_s_at | ATP1A2 | ATPase Na+/K+ transporting subunit alpha 2 (ATP1A2) |
| Dataset: GSE19804 | ||
| Prob_ID | Gene Symbol | Gene Name |
| 1555636_at | CD300LG | CD300 molecule like family member g (CD300LG) |
| 206938_at | SRD5A2 | steroid 5 alpha-reductase 2 (SRD5A2) |
| 44654_at | G6PC3 | glucose-6-phosphatase catalytic subunit 3 (G6PC3) |
| 45297_at | EHD2 | EH domain containing 2 (EHD2) |
| 1552696_at | NIPA1 | non-imprinted in Prader–Willi/Angelman syndrome 1 (NIPA1) |
| 45687_at | prr14 | proline-rich 14 (PRR14) |
| 203373_at | SOCS2 | suppressor of cytokine signaling 2 (SOCS2) |
| 210984_x_at | EGFR | epidermal growth factor receptor (EGFR) |
| Dataset: GSE4115 | ||
| Prob_ID | Gene Symbol | Gene Name |
| 205560_at | PCSK5 | pro-protein convertase subtilisin/kexin type 5 (PCSK5) |
| 200003_s_at | MIR680 | microRNA 6805 (MIR6805) |
| 201983_s_at | EGFR | epidermal growth factor receptor (EGFR) |
| 210187_at | FKBP1A | FK506 binding protein 1A (FKBP1A) |
| 205364_at | ACOX2 | acyl-CoA oxidase 2 (ACOX2) |
| 206628_at | SLC5A1 | solute carrier family 5 member 1 (SLC5A1) |
© 2018 by the authors. Licensee MDPI, Basel, Switzerland. This article is an open access article distributed under the terms and conditions of the Creative Commons Attribution (CC BY) license (http://creativecommons.org/licenses/by/4.0/).
Share and Cite
MDPI and ACS Style
Wu, S.; Jiang, H.; Shen, H.; Yang, Z. Gene Selection in Cancer Classification Using Sparse Logistic Regression with L1/2 Regularization. Appl. Sci. 2018, 8, 1569. https://doi.org/10.3390/app8091569
AMA Style
Wu S, Jiang H, Shen H, Yang Z. Gene Selection in Cancer Classification Using Sparse Logistic Regression with L1/2 Regularization. Applied Sciences. 2018; 8(9):1569. https://doi.org/10.3390/app8091569
Chicago/Turabian StyleWu, Shengbing, Hongkun Jiang, Haiwei Shen, and Ziyi Yang. 2018. "Gene Selection in Cancer Classification Using Sparse Logistic Regression with L1/2 Regularization" Applied Sciences 8, no. 9: 1569. https://doi.org/10.3390/app8091569
Note that from the first issue of 2016, this journal uses article numbers instead of page numbers. See further details here.