Optimization of the Antioxidant Potentials of Red Pitaya Peels and Its In Vitro Skin Whitening Properties
by
Ramya Vijayakumar
1, 
Siti Salwa Abd Gani
1,2,*,
Uswatun Hasanah Zaidan
3 and
Mohd Izuan Effendi Halmi
4 1
Halal Products Research Institute, Universiti Putra Malaysia, Putra Infoport, Serdang 43400 UPM, Selangor, Malaysia
2
Department of Agriculture Technology, Faculty of Agriculture, Universiti Putra Malaysia, Serdang 43400 UPM, Selangor, Malaysia
3
Department of Biochemistry, Faculty of Biotechnology and Biomolecular Sciences, Universiti Putra Malaysia, Serdang 43400 UPM, Selangor, Malaysia
4
Department of Land Management, Faculty of Agriculture, Universiti Putra Malaysia, Serdang 43400 UPM, Selangor, Malaysia
*
Author to whom correspondence should be addressed.
Appl. Sci. 2018, 8(9), 1516; https://doi.org/10.3390/app8091516
Submission received: 24 July 2018
/
Revised: 9 August 2018
/
Accepted: 10 August 2018
/
Published: 1 September 2018
(This article belongs to the Section Chemical and Molecular Sciences)
Abstract
:In this study, response surface methodology (RSM) was employed for the optimization of the antioxidant potentials of red pitaya peels using independent variables: temperature (45–65 °C), ethanol concentration (70–90%, v/v) and time (80–120 min) through its responses, which were DPPH scavenging activity, ferric ion reducing antioxidant power (FRAP), and beta-carotene bleaching (BCB) inhibition, respectively. In Vitro anti-tyrosinase and vitamin C content assays were carried out spectrophotometrically to determine the skin whitening efficacy of the optimized red pitaya peel extract. A gas chromatography-mass spectrometry (GC-MS) analysis was employed to identify the chemical constituents present in the optimized extract. The optimized conditions were ethanol 82% (v/v) for 103 min at 56 °C with values of 75.98% for DPPH, 7.45 mM Fe2+/g dry weight for FRAP and 93.29% for BCB respectively. The in vitro anti-tyrosinase and vitamin C content evaluation of the optimized extract showed a good tyrosinase inhibition of 66.29% with IC50 of 24.06 µg/mL while the vitamin C content was 5.45 mg/g of the extract. The GC-MS analysis revealed the presence of thirty phytoconstituents with l-(+)-ascorbic acid 2,6-dihexadecanoate being the most abundant with a peak area of 14.66%. This study evidently suggests the potential of red pitaya peels to be exploited as a natural skin whitening agent in the cosmeceutical and pharmaceutical formulations.
1. Introduction
Pitaya or dragon fruit (Hylocereus spp.) is a climbing vine cactus species which has successfully attained international recognition, both as an ornamental plant and as an economical fruit crop. Its fruit is regarded as the most beautiful one in the Cactaceae family, with a bright red skin studded with green scales and white or red flesh with well dispersed small black seeds. Pitaya originates from the tropical forest regions of Mexico and Central and South America [1]. There are three varieties of pitaya; namely white flesh pitaya with a yellow peel (Selenicereus megalathus), white flesh pitaya with a red peel (Hylocereus undatus) and red flesh pitaya with a red peel (Hylocereus polyrhizus) [2,3]. Red pitaya (Hylocereus polyrhizus) is being extensively cultivated in Malaysia, Thailand, Vietnam, Australia, Taiwan, and some other parts of the world. It is increasingly gaining attention in many countries due to its exotic aesthetic characteristics, high economic potential, and exceptional tolerance to extreme drought [4].
Reactive oxygen species (ROS) are among the most significant factors that intensively contributes to the ultraviolet (UV) radiation induced skin pigmentation [5]. Keratinocytes adjacent to melanocytes produces nitric oxide radicals (NO°) that triggers the increment of the level of melanogenesis factors, namely, tyrosinase and tyrosinase-related protein-1 (TRY-1) [6]. This phenomenon increases the rate of melanogenesis which results in an abnormal production of skin pigments that causes the darkening of the skin that is aesthetically unfavorable. Therefore, several studies have emphasized the importance of phytochemicals with good antioxidant potentials in the regulation of skin pigmentation to curb the effects of ROS. Vitamin C is undoubtedly one of the highly utilized antioxidants for skin depigmentation due to its efficiency in neutralizing the ROS through the radical scavenging process and also for its exceptional tyrosinase enzyme inhibiting properties [7]. Despite the high oral dosage, an active transport mechanism restricts the absorption of vitamin C in the gut and eventually only a limited amount of the drug is absorbed into the system [8]. Thus, the inadequacy of the bioavailability of vitamin C through oral administration encourages the use of topical ascorbic acid in the field of dermatology [9].
If the active ingredients consist of therapeutic values or prophylactic in human subjects, then it is vital to perform a proper extraction to retrieve them [10]. Besides that, an appropriate extraction condition ensures that the valuable endogenous bioactive components are not damaged and the functional potential of the raw materials is well preserved throughout the process [11]. Thus, the optimization of extraction conditions of the red pitaya peels plays an essential role to maximize its antioxidant potentials. More importantly, oxidative stress caused by ROS under antioxidant deprivation is one of the crucial mechanisms that stimulate skin darkening and other dermatological disorders. Therefore, optimizing the antioxidant potentials of the red pitaya peel extract is quintessential in treating or preventing those conditions [12]. Response Surface Methodology (RSM) is a powerful statistical tool with high precision which is widely employed for the optimization of complex processes and extraction technologies as it depicts the complete effects of the variables, evaluates the interactions between multiple parameters, reduces the number of experimental trials, and shortens the trial time.
Phytochemicals isolated from plants possess the ability to provide a substantially unexplored alternative for the invention of new drugs to be utilized in the cosmeceutical and pharmaceutical industries. The incorporation of plant-based bioactive compounds for the formulation of current skin care products is continually being highlighted due to the possible side-effects that might be posed by the usage of synthetic active ingredients. In addition, massive quantities of solid wastes produced from red pitaya fruits every year by the food and beverage industries might contain an appreciable amount of chemical constituents and their disposal also leads to severe environmental issues. Moreover, there is a rather significant scarcity of appropriate feasibility studies, especially on the exploitation of the wastes such as in the case of red pitaya peels and consequently, their utilization is still in its infancy. To the best of our knowledge, there are no previous works that have reported on the skin whitening potential of RSM optimized red pitaya peel extract. In the present study, we evaluated for the first time, the skin whitening properties of the red pitaya peel extract obtained via RSM optimized conditions based on the anti-tyrosinase and vitamin C content assays. Furthermore, the optimized red pitaya peel extract was also subjected to GC-MS and FT-IR analyses.
2. Materials and Methods
2.1. Materials and Reagents
Freshly harvested red pitaya fruits (H. polyrhizus) were purchased from a fruit plantation located in Sepang, Selangor, Malaysia with a latitude of 2.6875° N and a longitude of 101.7421° E respectively. Only fruits which are uniform in shape, size, and color were selected while rejecting the blemished and diseased fruits. The peels were separated from the pulp and left for sun drying at an ambient air temperature. The dried peels were then ground to a fine powder using a commercial blender (MJ-220BP01A, Guangdong Beauty Life Electrical Appliances Manufacturing Co., Ltd., Jieyang, China). The powdered sample was carefully packed in an airtight polyethylene bag and stored in the dark at room temperature for further experiments. All the solvents and chemical reagents used in this study were of an analytical grade and purchased fromSigma-Aldrich (M) Sdn. Bhd (Subang Jaya, Malaysia).
2.2. Extraction of Red Pitaya Peels
Approximately 20 g of powdered red pitaya peels were added to 200 mL of extraction solvent and then refluxed as per the RSM experimental conditions that followed the parameters combinations provided by Central Composite Rotatable Design (CCRD). The experimental ranges for the independent variables were selected as the temperature in the range of 45–65 °C, ethanol concentration in the range of 70–90% (v/v), and extraction time in the range of 80–120 min. The pH was not included as one of the parameters since it could affect the reproducibility of the antioxidant potentials obtained from plant sources (Khoo et al., 2013). The mixture was then filtered using Whatman No. 1 filter paper and the supernatant was concentrated using a rotatory evaporator (EYELA, N-N series, Tokyo, Japan) at 40 °C. The resulting extracts were kept in the dark under a refrigerated condition until further antioxidant capacity analysis.
2.3. Experimental Design
Three independent variables were studied, namely, extraction temperature (°C), ethanol concentration (%, v/v), and extraction time (min), whereas the response variables were 1,1-Diphenyl-2-picrylhydrazyl (DPPH) radical scavenging activity, ferric ion reducing antioxidant power (FRAP), and beta-carotene bleaching (BCB) inhibition respectively. The range and the levels of the experimental variables used in the coded and uncoded form are presented in Table 1. The number of experiments was calculated using Equation (1):
where N is the total number of experiments, k is an independent variable number, and n0 is the replicate number at the central points, which resulted in an experimental design of 20 points. The central values (zero level) chosen for the experimental design were an extraction temperature of 55 °C, an ethanol concentration of 80% (v/v), and an extraction time of 100 min. The data were fitted to a second-order polynomial regression model, expressed by Equation (2):
where Y is the response of the independent variable, while A0, Ai, Aii, and Aij are the regression coefficients for intercept, linear, quadratic, and interaction effect terms, respectively. Xj and Xi are the encoded independent variables (i ≠ j).
N = 2ᵏ (factorial points) + 2k (axial points) + n0 (central points)
2.4. Analytical Procedure for Optimization Process
2.4.1. 1,1-Diphenyl-2-picrylhydrazyl (DPPH) Radical Scavenging Assay
The DPPH radical scavenging activity of red pitaya peels was determined according to the method adapted from Kong et al. [13] with some modifications. Briefly, 50 µL of the extract of the compound was added to 195 µL of freshly prepared ethanolic DPPH solution. The mixture was incubated in the dark for 30 min and then the absorbance was measured at 515 nm on a Microplate Reader (Spectra Max Plus 384, Molecular Devices Co., Ltd., San Jose, CA, USA). A standard curve of ascorbic acid was prepared to be compared with all the other samples and the results were expressed as a percentage of scavenging activity using the following relation:
where Acontrol is the absorbance of the control and Asample is the absorbance of the sample.
DPPH scavenging activity (%) = (Acontrol − Asample)/Acontrol × 100%
2.4.2. Ferric Reducing Antioxidant Power (FRAP) Assay
The FRAP assay was done according to the method suggested by Benzie and Strain [14] with some modifications. The stock solutions included 300 mM acetate buffer with pH 3.6 (3.1 g C2H3NaO2∙3H2O and 16 mL C2H4O2), 10 mM 2,4,6-tripyridyl-s-triazine (TPTZ) solution in 40 mM HCl, and 20 mM FeCl3∙6H2O solution. The working reagent was freshly prepared on the day of analysis by mixing 25 mL of acetate buffer, 2.5 mL of TPTZ solution, and 2.5 mL of FeCl3∙6H2O solution. A total of 150 µL of the extract was allowed to react with 2850 µL of the FRAP solution in a dark condition for 30 min at 37 °C. The absorbance of the sample was measured in comparison to a blank at a wavelength of 590 nm using a microplate reader. The calibration curve was prepared using the standard solution of FeSO4∙7H2O and the results were expressed as mM Fe2+/g dry weight.
2.4.3. Beta-Carotene Bleaching (BCB) Assay
The BCB assay was conducted according to the methods adapted from Juntachote and Berghofer [15] with minor modifications. The stock solution of beta-carotene (β-carotene) and linoleic acid was initially prepared by dissolving 2 mg of β-carotene in 100 µL of chloroform. The β-carotene was added to 0.2 mL of linoleic acid and 2 mL of Tween 20 emulsifier in a flask and mixed together. The chloroform was removed from the mixture using a rotary vacuum evaporator. Then, 50 mL of oxygenated distilled water was added to the flask and the mixture was immediately stirred vigorously. A total of 20 µL of the extract was added to 200 µL emulsion. After mixing, the absorbance of the samples was measured at 460 nm at an initial time (t = 0) against a blank. The samples were then incubated in the dark for 180 min at 50 °C. The absorbance after 180 min was measured using a microplate reader. The antioxidant activity was expressed as the percentage of BCB inhibition and calculated using the following equations:
where In is a natural log, a is the initial absorbance at time 0, b is the absorbance at time 180 min, and t is the total time.
Degradation rate (DR) of β-carotene = In (a/b)/t
BCB inhibition (%) = (DRcontrol − DRsample)/DRcontrol × 100%
2.5. Statistical Analysis
The experimental design and the regression analysis of the experimental data exploited Design-Expert 7.0.0 (Trial version, Stat-Ease Inc., Minneapolis, MN, USA). Analysis of variance (ANOVA) was used in order to evaluate the statistic significances of the model, lack of fit of the model and also the regression terms. The goodness-of-fit of the regression model was evaluated by the coefficient of determination (R2), Fischer’s F-test at a probability (p) of 0.001, 0.01, or 0.05 was used to determine the second-order model equation and lack of fit. In order to maximize the antioxidant activities by DPPH, FRAP, and BCB assays, the response optimizer was applied using the desirability function [16].
2.6. Gas Chromatography-Mass Spectrometry (GC-MS) Analysis of the Optimized Red Pitaya Peel Extract
The GC-MS analysis of the optimized red pitaya peel extract was performed using GC-MS-QP 2010 (SHIMADZU, Kyoto, Japan) equipped with electron impact (EI) mode (ionizing potential-70 eV) as well as a capillary column (ZB-5 ms) (length = 30 m × diameter 0.25 mm, film thickness = 0.25 μm) packed with 5% phenyl dimethyl silicone. The ion source temperature was maintained at 240 °C helium was utilized as the carrier gas with 99.99% purity. The samples were injected at a split ratio of 2:0 and a flow rate of 3.0 mL/min. The mass spectra were taken at 70 eV with a scan fragments from 45 to 1000 Da and the total MS running time was 20 min. The compounds were identified by computer searches of commercial libraries of the National Institute of Standards and Technology (NIST).
2.7. Fourier Transform Infrared Spectroscopy (FTIR) Analysis of the Optimized Red Pitaya Peel Extract
Firstly, 1.0 mg of the optimized red pitaya peel extract was thoroughly mixed with 100.0 mg of the potassium bromide (KBr) in ratio of 1:100. The mixture was milled to homogenize the mixture. An interferogram for the background correction was determined before the sample analysis. Then, the mixture was compressed to produce thin layer pellets in the form of a disc shape. Next, the disc was placed in a beam of infrared radiation and the sample absorbed the radiation at frequencies corresponding to molecular vibration frequencies. The instrument then measured the spectrum of the scattered radiation relative to the spectrum of the non-absorbing standard (KBr). The infrared spectra was recorded on a FTIR (Agilent Technologies-630 Spectrophotometer System, Santa Clara, CA, USA). All the spectra were run over the range from 280 cm−1 to 4000 cm−1 at room temperature.
2.8. Evaluation of Vitamin C Content and Anti-Tyrosinase Activity of the Optimized Red Pitaya Peel Extract
The optimized red pitaya peel extract obtained based on the optimum extraction conditions was subjected to further analyses to determine its skin whitening properties.
2.8.1. Vitamin C Content Assay
The vitamin C content of the optimized red pitaya peel extract was determined according to the method of Lillian et al. [17]. The dried ethanolic extract (100 mg) was extracted with 10 mL of 1% metaphosphoric acid for 45 min at room temperature and filtered through Whatman No. 4 filter paper. The filtrate was mixed with 9 mL of 2,6-dichlorophenolindophenol, and the absorbance was measured within 30 min at 515 nm against a blank. The content of vitamin C was calculated from a calibration curve of authentic l-ascorbic acid (0.02–0.10 mg/mL). The results were expressed as mg /g of the extract.
2.8.2. Anti-Tyrosinase Assay
The tyrosinase inhibitory activity of the optimized red pitaya peel extract was determined spectrophotometrically with the degree of inhibition of the mushroom tyrosinase-catalyzed oxidation of l-DOPA as described by Chiari et al. [18] with slight modifications. The extract was diluted (1000 µg/mL) using ethanol and 20 µL of the diluted solution was pipetted into a 96-well microplate, followed by the addition of a 138 µL phosphate buffer solution (PBS) and a 2 µL mushroom tyrosinase solution (2687 U/mg solid, 9.31 mg tyrosinase) in PBS. The reaction mixture was then incubated at 37 °C for 90 min, and subsequently, 40 µL of l-DOPA (2.5 mM in PBS) was added to the mixture. The absorbance was measured at 490 nm for 20 min. Kojic acid was used as a positive control and tested for comparison. The anti-tyrosinase activity of the optimized red pitaya peel extract was expressed in terms of percentage of inhibition and the fifty percent inhibitory concentration was evaluated using a probit analysis:
where is the absorbance of the control and is the absorbance of the sample extract.
3. Result and Discussion
3.1. Fitting the Models
In this study, the lower and upper values for the factors chosen were set at +alpha (+α = 1.682) and −alpha (−α = 1.682) respectively and therefore all the factor levels were selected within the desired limits. The experimental and predicted values for all the three different responses (DPPH, FRAP, and BCB) under various combinations of extraction conditions are given in Table 2. The results showed that the antioxidant activities of the red pitaya peels for the DPPH, FRAP, and BCB assays ranged from 62.12 to 77.45%, 6.05 to 7.38 mM Fe2+/g dry weight, and 78.18 to 93.47%, respectively, for the samples treated under extraction conditions as specified in Table 1.
In order to fit the response function and experimental data to the second-order polynomial, the linearity and quadratic effect of the independent variables, their interactions, and their regression coefficients on the response variables were evaluated from variance analysis ANOVA as given in Table 3. The coefficient of determination, R2, for the regressed model predicting the antioxidant activities for the DPPH, FRAP, and BCB assays were 0.9992, 0.9993, and 0.9994, respectively, suggesting a good fit as the values were close to 1. Thus, the predicted second-order polynomial models defined the real behavior of the system very well. The absence of lack of fit (p > 0.05) for all the responses also strengthened the accuracy of the models. The predicted model of the DPPH, FRAP, and BCB assays were obtained from the following second-order polynomial equations:
YDPPH = 76.17 − 1.02A + 1.23B + 1.48C − 2.06AB − 2.87AC + 0.35BC − 1.47A2 − 3.70B2 − 2.66C2
YFRAP = 7.35 + 0.10A − 0.025B + 0.059C + 0.051AB − 0.14AC − 0.032BC − 0.32A2 − 0.30B2 − 0.35C2
YBCB = 92.31 + 1.58A + 1.52B + 2.22C + 1.72AB + 1.74AC + 2.04BC − 3.47A2 - 3.25B2 − 2.90C2
The adjusted R2 for the responses of the DPPH, FRAP, and BCB assays were 0.9986, 0.9986, and 0.9989, respectively, and these values were also relatively close to their corresponding R2 value. In addition, high values of adjusted R2 also advocated for the significance of the model for all the responses. The coefficient of variation for the DPPH, FRAP, and BCB assays were 0.26, 0.26, and 0.22. These small values of CV also revealed that the experimental results obtained were accurate and reliable with a high reproducibility.
3.2. Analysis of Response Surface
3.2.1. 1,1-Diphenyl-2-picrylhydrazyl (DPPH) Scavenging Activity
Figure 1a revealed a rapid increase in the scavenging activity with an increase in temperature and time from 45–55 °C and 80–100 min, respectively. The elevation of temperature induces a vigorous interaction between the red pitaya peels and the solvent, which aids in softening of the plant tissues. The weakened cell wall integrity subsequently enhances the release of the tightly bound antioxidant compounds [19]. Longer durations of extraction also contributes to a significant decrease of antioxidant compounds since oxidation tend to polymerize into insoluble compounds [20]. The scavenging activity also showed an increase with increasing ethanol concentration and temperature from 70–80% (v/v) and 45–55 °C respectively as shown in Figure 1b. Solvent polarity plays a vital role in the extraction of antioxidant compounds as certain phytochemicals exhibit limited solubility in water because of their hydrophobic characteristics, which depend on the functional groups attached to them. In Figure 1c, the maximum scavenging activity was achieved with 80–100 min and ethanol concentration of 70–80% (v/v). The scavenging activity started to decrease with the longer extraction time and this might have caused by oxidation and/or destruction of the antioxidant compounds by endogenous enzymes [21].
3.2.2. Ferric Ion Antioxidant Reducing Power (FRAP)
When the ethanol concentration was fixed at 80% (v/v), the reducing power increased with the increasing temperature and time up to 55 °C and 100 min, which then started to declined slowly as the temperature and time increased up to 65 °C and 120 min as shown in Figure 2a. Although a high temperature mobilizes antioxidant compounds up to a certain limit, it also promotes the possible concurrent decomposition of antioxidants which were already mobilized at lower temperatures [22]. At constant time, the maximum reducing power of the red pitaya peels was attained at around 55–57 °C and at an ethanol concentration of 75–80% (v/v), respectively (Figure 2b). As shown in Figure 2c, the reducing power was observed to be positively influenced by the synergism between the ethanol concentration and extraction time. This is probably due to the increased solubility of plant-derived antioxidants in the mixture of ethanol and water which compensates for their polarity very well as compared to mono-solvent systems [23]. The red pitaya peel extract displayed a maximum reducing power of 7.38 mM Fe2+/g DW at an ethanol concentration of 80% (v/v) for a duration of 100 min. The increments of ethanol concentration and extraction time beyond the threshold level displayed a decrease in the reducing power.
3.2.3. Beta-Carotene Bleaching (BCB) Inhibition
In Figure 3a, it can be observed that a high percentage of BCB inhibition was achieved at 55–65 °C and 100–120 min respectively. The diffusion of bioactive compounds from the plant cell into the extracting agent takes place at a faster speed with increased mobility caused by increasing temperature. An increase in the BCB inhibition could be significantly achieved by increasing the extraction temperature (Figure 3b). The inhibition also increased with the ethanol concentration from 70–80% (v/v) and started to decline beyond this range. This suggests that the incubation in a warm solvent to prevent the degradation of targeted antioxidant compounds and the appropriate polarity of the extraction solvent are both equally crucial to obtain maximum results. Figure 3c shows the BCB inhibition increased rapidly with an increase in extraction time and ethanol concentration from 80–100 min and 70–80% (v/v), respectively, and declined beyond this point.
3.3. Optimization of Extraction Parameters
The Design Expert 7.0.0 software was used to get the optimum extraction conditions to maximize the antioxidant potentials of the red pitaya peel extract via the DPPH, FRAP, and BCB assays respectively. When constraint in the range was selected, the optimum conditions obtained were 56.39 °C, 82.22% (v/v) and 103.55 min with the desirability of 90.5% that gave 76.17%, 7.34 mM/g, and 93.15% for the DPPH, FRAP, and BCB assays respectively. Since it is practically difficult to maintain the recommended conditions during processing, some deviations are expected. Therefore, the optimum conditions were targeted as 56 °C, 82% (v/v), and 103 min with a desirability of 93.9% that gave 76.29%, 7.36 mM/g, and 93.04% for the DPPH, FRAP, and BCB assays, respectively.
3.4. Verification of Predictive Model
All the experiments were conducted to verify the variations in the values of the antioxidant potentials of the red pitaya peel extract based on the optimum conditions obtained from the target constraint. The experimental values for the DPPH, FRAP, and BCB assays were 75.98%, 7.45 mM/g, and 93.29% respectively. The experimental values for the three responses based on these optimum conditions were found to be very close to the predicted values. This indicates a high fit degree between the experimental values and the predicted values from the regression model. Therefore, response surface modeling is a reliable method which could be applied effectively to predict the optimum extraction conditions to maximize the antioxidant potentials of the red pitaya peel extract. The optimized extract was further analyzed to determine its suitability as an active ingredient for skin whitening purposes.
3.5. Gas Chromatography-Mass Spectrometry (GC-MS) Analysis of the Optimized Red Pitaya Peel Extract
In this study, the identification of the chemical constituents was performed by comparing the GC-MS recorded mass spectra with the standard mass spectra from the National Institute of Standards and Technology (NIST) MS spectral library. From the analysis, thirty compounds were identified following a comparison with the spectral library (Figure 4). The GC-MS analysis of the optimized red pitaya peel extract consisting of the chemical constituents, retention time, and their relative percentages are shown in Table 4.
From the spectra obtained, l-(+)-ascorbic acid 2,6-dihexadecanoate, which is a fat-soluble vitamin C, was the major phyto-constituent available at retention time (RT) 12.410 with a peak area of 14.66% followed by 9-octadecenoic acid (Z) methyl ester (11.36%), N-hexadecanoic acid methyl ester (10.50%), cyclopentacycloheptene (9.96%), 1-tetradecene (8.89%), 1-hexadecene (8.82%), oleic acid (6.17%), lauric acid methyl ester (4.93%), benzenemethanol (3.17%), linoleic acid (3.07%), octadecanoic acid (2.69%), and others. Octadecanoic acid and phenol, 2,4-bis (1,1-dimethylethyl) had been previously reported in the methanol extract of red pitaya fruit [24]. The compounds 1-nonadecene, N-hexadecanoic acid methyl ester, and oleic acid were present in the supercritical carbon dioxide extracts of red pitaya peels [25].
The phytochemical screening of the optimized red pitaya peel extract revealed the presence of chemical constituents that possess diverse biological activities. Different forms of vitamin C such as l-(+)-ascorbic acid 2,6-dihexadecanoate play a vital role as the protecting agents that shield the human skin from free radicals mediated complications. Besides, phenol, 2,4-bis(1,1-dimethylethyl) [26], 1-hexadecene [27], N-hexadecanoic acid methyl ester [28], and 9-octadecenoic acid (Z) methyl ester [29], which were among the most abundant phytochemicals in the optimized red pitaya peel extract, have also been reported to exhibit an excellent antioxidant properties. Myristic acid, which is classified as a saturated fatty acid—found naturally in animals and vegetables—is being extensively incorporated in the clinical applications for its good antifungal and antibacterial properties [30].
3.6. Fourier Transform Infrared Spectroscopy (FT-IR) Analysis of the Optimized Red Pitaya Peel Extract
The FT-IR spectrum for the optimized red pitaya peel extract was presented in Figure 5. The band in the region of 3360.04 cm−1 is due to the hydroxyl stretching vibration. The band in the region of 2926.96 cm−1 is due to the C-H stretching vibration in CH2 and the band at 1708.35 cm−1 is the absorption of the C=O stretching vibration. The band of 1457.35 cm−1 was the characteristic absorption of CH3. The characteristic absorptions at 1379.50 cm−1, 1289.49 cm−1, 1191.67 cm−1, and 1030.89 cm−1 in the FT-IR spectrum were indicative of the C-O-C linkages, whereas the absorption at 757.30 cm−1 also indicated the presence of a linked palmitic acid in the l-(+)-ascorbic acid 2,6-dihexadecanoate.
3.7. Evaluation of the Skin Whitening Properties of the Optimized Red Pitaya Peel Extract
3.7.1. Vitamin C Content
From the results gained in this study, the vitamin C content of the optimized red pitaya peel extract was calculated using the standard curve equation y = 0.4947x + 1.1635, R2 = 0.9955. The vitamin C content found in the optimized red pitaya peel extract was 5.45 mg/g extract, which can be considered as a relatively significant amount. It is also an interesting finding since previous works reported the vitamin C content in the edible pitaya pulp itself was 7–11 mg for 100 g of fresh weight [31], whereas, for the pitaya seeds, it was found to be 0.36 mg/g dry weight [32]. Besides, Kristanto et al. [33] previously reported that the vitamin C content in pitaya fruits ranges from 8–9 mg for 100 g of the extract.
Vitamin C is the most abundant natural antioxidant in the human skin, and it is a part of the complex group of enzymatic and non-enzymatic antioxidants that coexist to shield the skin from deleterious effects caused by the harmful ROS in the surroundings [34]. Vitamin C functions to scavenge most of the ROS by oxidizing ascorbate to monodehydroascorbate and then to dehydroascorbate, which helps in controlling irregular skin pigmentation induced by the oxidative stress. Another principal criterion that makes vitamin C an effective skin whitening agent is its ability to break important steps of melanogenesis without being toxic to the melanocyte. Generally, the mode of action of vitamin C in the human body is by reducing the oxidized dopaquinone, disrupting the oxidation of 5,6-dihydroxyindole-2-carboxylic acid (DHICA), and as well by interacting with the copper ions at the active site of tyrosinase, which eventually leads to the interruption of melanin synthesis [35]. For that reason, vitamin C greatly slows down the melanin synthesis, which controls the formation of dark spots on the face resulting from pregnancy, consumption of birth control pills, and due to the natural process of aging.
Known as a powerful antioxidant drug which is commercially used in dermatology, vitamin C and its derivatives also play a vital role in the metabolism of the skin cells, making it one of the most widely used active ingredients in cosmetic product development. The enzymatic activity of prolyl hydroxylase, which hydroxylates prolyl residues in procollagen and in elastin in the skin requires vitamin C as its cofactor [36]. It also prevents skin cancer by reducing the skin damage from the cellular level. Apart from this, it works to stimulate the collagen production to make the skin firmer, tighter and in certain cases, it gets rid of the wrinkles. Therefore, the addition of vitamin C in the cosmetic formulations will help the skin to metabolize by exfoliating and repairing itself as well as rejuvenating the collagen fibers to create a healthier looking skin [37]. Thus, an appreciable amount of vitamin C found in the optimized red pitaya peel extract will not only enhance its skin whitening properties, but also boost other anti-aging potentials.
3.7.2. Anti-Tyrosinase Activity
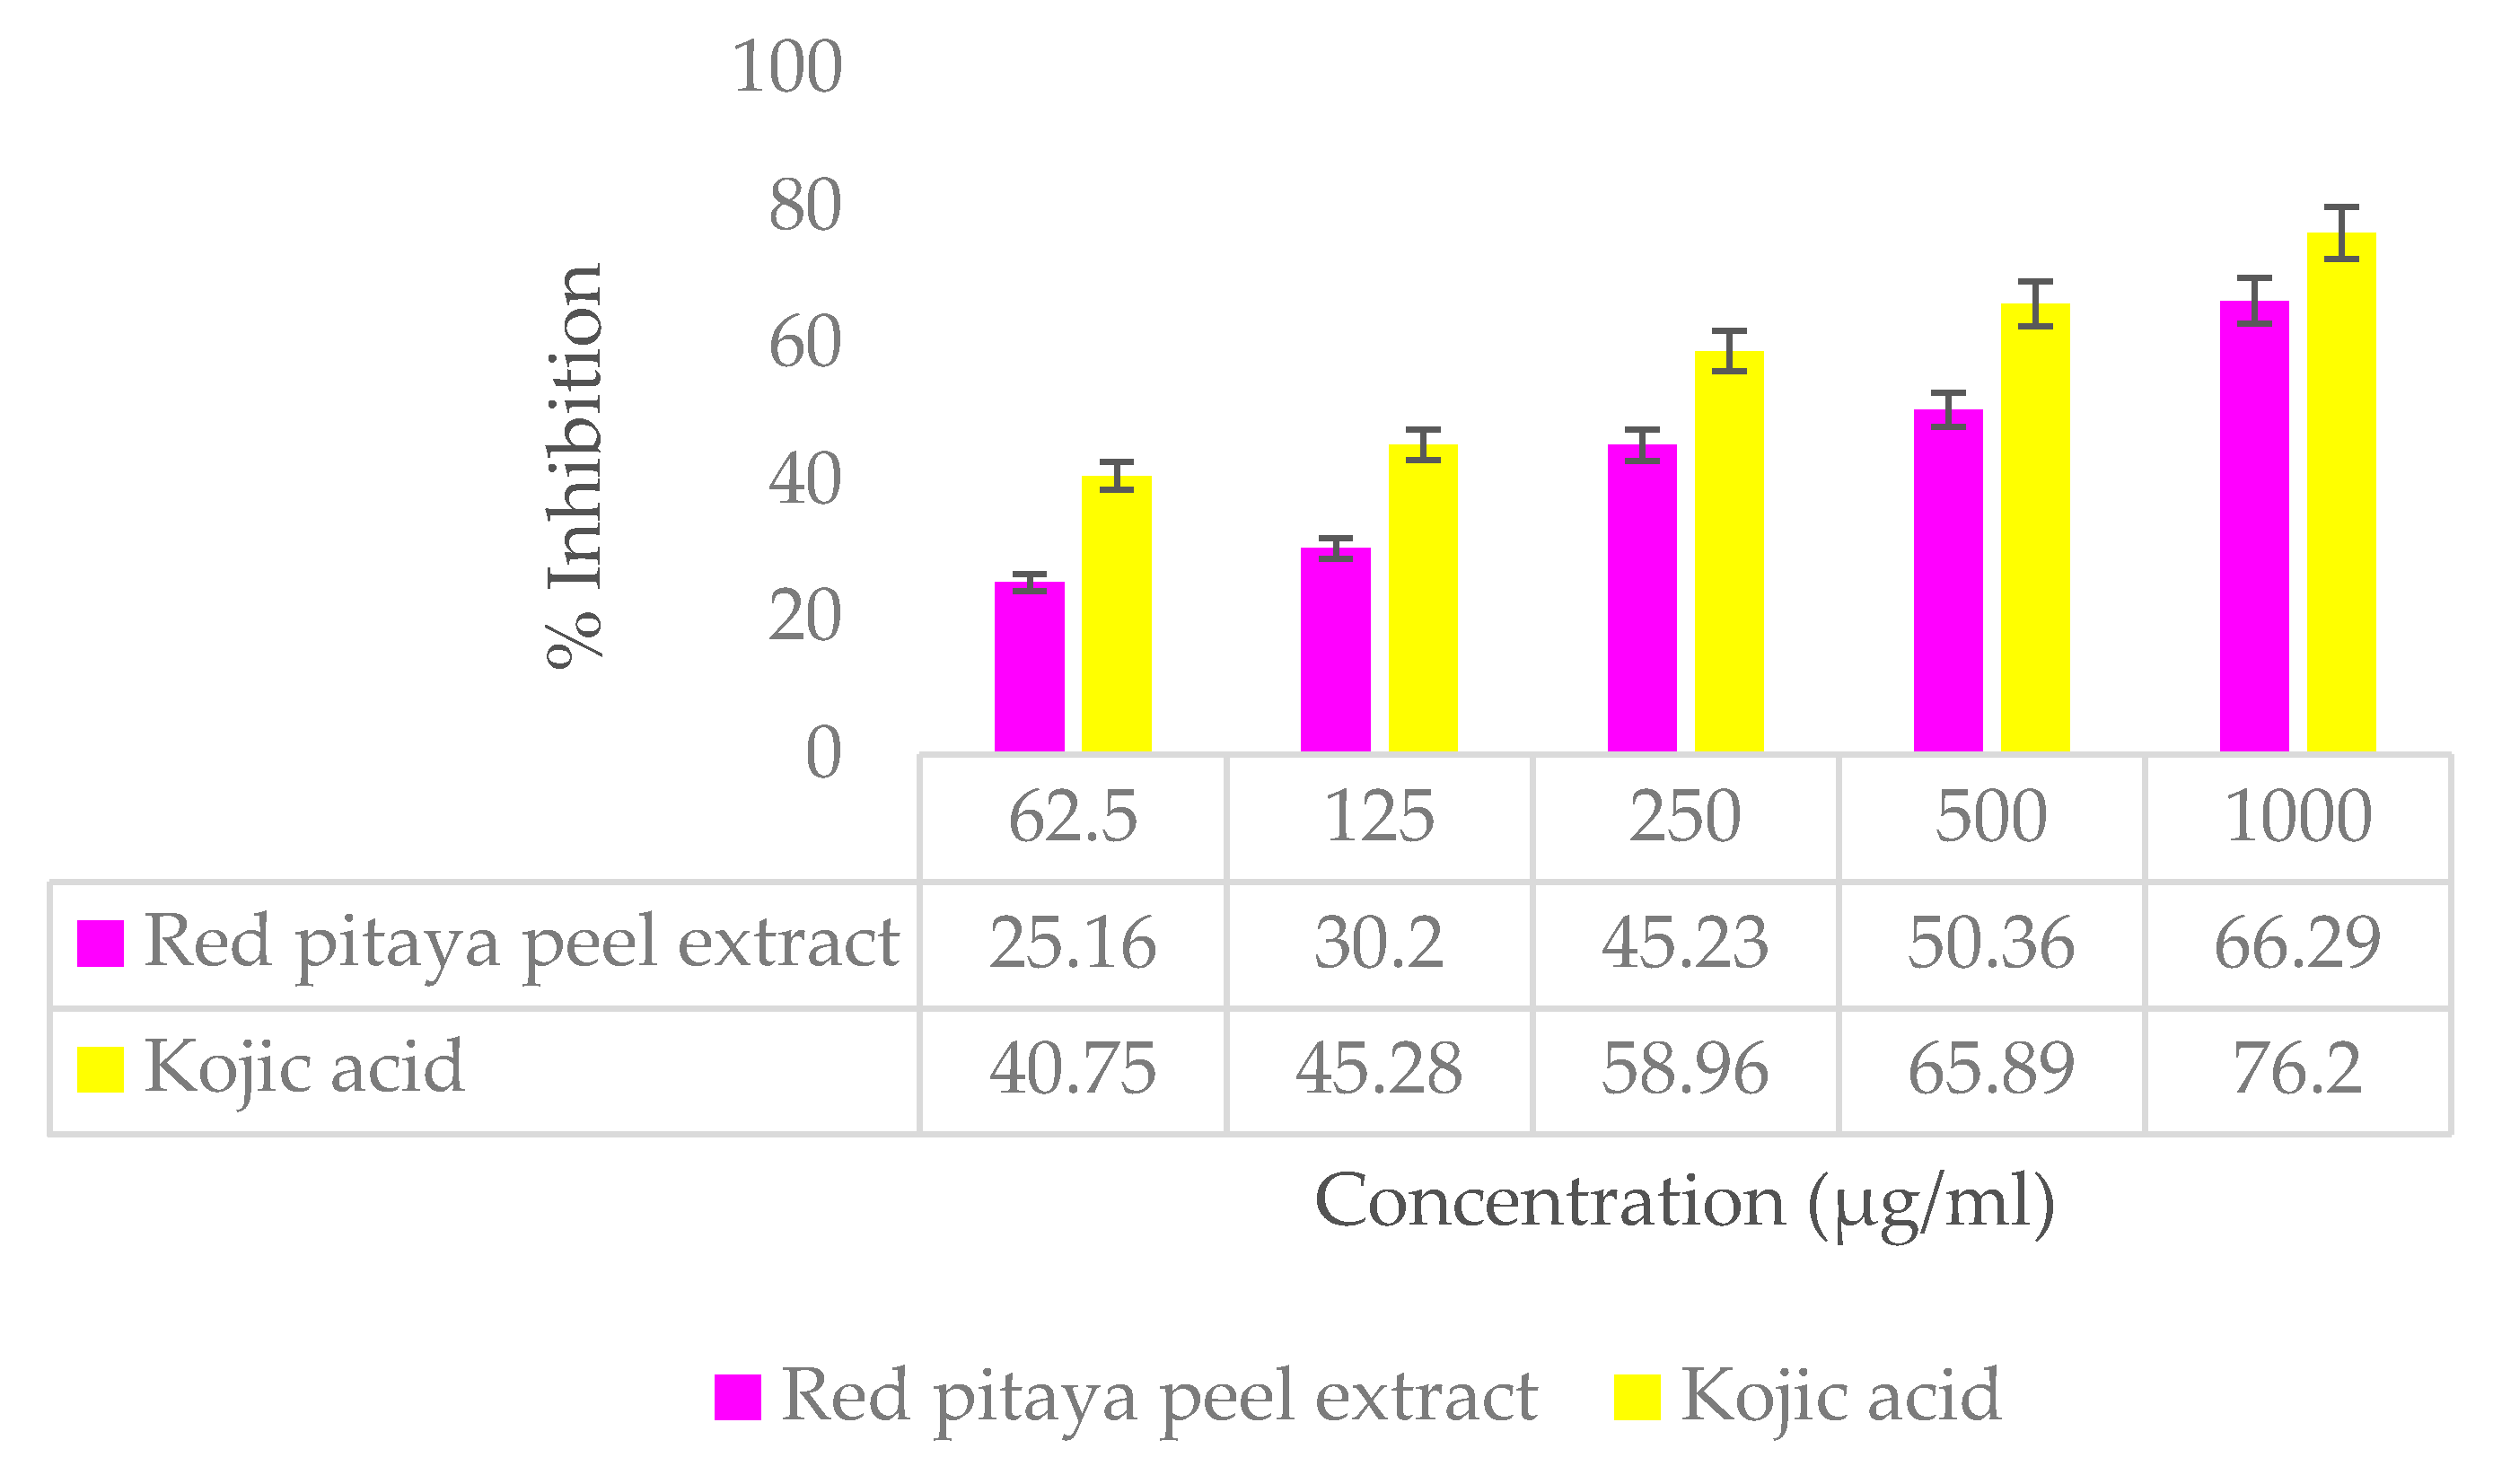
The potential of the optimized red pitaya peel extract to aid in skin whitening was measured in terms of its ability to inhibit the tyrosinase enzyme. The anti-tyrosinase activity assay performed by taking kojic acid as a standard exhibited that the optimized red pitaya peel extract possessed a good tyrosinase inhibition percentage of 66.29%, whereas the standard solution of kojic acid showed an inhibition percentage of 76.20% (Figure 6). The results of anti-tyrosinase activity were classified into four groups: highly active (IC50 ≤ 15.00 mg/mL), moderately active (IC50: 15.01–50.00 mg/mL), weakly active (IC50: 50.01–100.00 mg/mL), and inactive (IC50 > 100.00 mg/mL). The optimized red pitaya peel extract showed moderately active tyrosinase inhibition with IC50 of 24.06 µg/mL, whereas kojic acid showed a high activity against mushroom tyrosinase with IC50 of 12.56 µg/mL. Kojic acid is evidently the stronger inhibitor of tyrosinase enzyme, taking into account it is a single molecule with a specific function whereas the optimized red pitaya peel extract is a mixture of various types of phytochemicals with different functionalities. The absorbance values recorded at 490 nm for 20 min also showed a decrease as the melanin synthesis was disrupted by the presence of bioactive compounds with tyrosinase inhibiting properties.
The good tyrosinase inhibition property shown by the optimized red pitaya peel extract might be contributed by the presence of l-(+)-ascorbic acid 2,6-dihexadecanoate, or also known as ascorbyl dipalmitate, which was found in the highest percentage in this optimized extract. Ascorbyl dipalmitate is produced from the condensation of the hydroxy groups of l-ascorbic acid with two molecules of palmitic acid and it is a fat-soluble form of vitamin C [38]. In fact, fat-soluble vitamin C such as ascorbyl palmitate and ascorbyl dipalmitate are often preferred to be incorporated in the formulation of products, targeting topical administrations since they exhibit a much-improved stability than certain water-soluble forms of vitamin C. The dual solubility of ascorbyl dipalmitate resulting from the water-soluble l-ascorbic acid and fat-soluble palmitic acid suggested that this form of vitamin C can penetrate the skin, as well as the thin cell membranes at a higher efficiency to deliver better results [39].
Depigmenting agents fall into two important categories, whereby one acts by imposing toxic effects to the melanocytes while the other will disrupt the pivotal steps of the melanogenesis process. As for vitamin C, it breaks the continuity of the melanin synthesis process by interacting with the copper ions situated at the tyrosinase-binding site. This impairment to the active site of tyrosinase eventually hinders its proper functioning. As a consequence, the formation of melanin will start to decline and this will boost skin lightening effects [9,40,41]. Apart from this, benzaldehyde identified from the optimized red pitaya peel extract also enhances its anti-tyrosinase property. Several studies in the past decade confirmed that both benzaldehyde and benzoate derivatives isolated from plants have been identified as potential tyrosinase inhibitors, including benzaldehyde, benzoic acid, anisic acid, anisaldehyde, cinnamic acid, and methoxycinnamic acid from the roots of Pulsatilla cernua [42], 4-substituted benzaldehyde from cumin [43], and 2-hydroxy-4-methoxybenzaldehyde from the roots of Mondia whitei [44]. Furthermore, linoleic acid and oleic acid detected in the extract also possess tyrosinase inhibiting properties as unsaturated fatty acids are capable of suppressing tyrosinase activity and melanogenesis [35]. While keeping the messenger ribonucleic acid (mRNA) at a constant level, linoleic acid decreases the tyrosinase activity in the melanocytes. Fatty acids function efficiently to target the enzyme tyrosinase without causing any apparent changes in the TYRP-1 and TYRP-2 protein levels, and this alters the tyrosinase protein content in the hyperactive melanocytes as the enzymes are subjected to degradation following a physiologic proteasome-dependent mechanism [45]. Linoleic acid also regulates the skin pigmentation via epidermal turnover stimulation and subsequently increases the melanin pigment desquamation from the epidermis [46]. Previous works to study the skin whitening potentials of unsaturated fatty acids on UV-induced hyperpigmentation of brown guinea pig skin displayed an excellent skin lightening properties. This phenomenon could be explained by the ability of the double bonds of fatty acids to be easily peroxidized, which, when associated with an epidermal turnover increase, correlates with an in vivo melanogenesis inhibitory effect [42,47].
Although tyrosinase inhibitors are being widely incorporated in the production of cosmetic products to promote skin lightening, many of them do not fulfill the clinical efficacy standards and cause adverse side-effects that might harm the consumers [48]. This situation creates a market demand for plant-derived active ingredients to serve as skin-whitening agents. In addition to antioxidants such as vitamin C, the presence of other active constituents such as aromatic acid, aromatic aldehyde, or polyphenol in plants also contribute significantly to their anti-tyrosinase inhibition activity due to the respective hydrophobic parts that play a role as competitive inhibitors in the synthesis of melanin [49].
4. Conclusions
This study emphasized that the RSM optimization of extraction conditions is an essential step to obtain red pitaya peel extract with high antioxidant potentials, which also eventually yielded a functional fraction with a combination of good anti-tyrosinase activity, significant vitamin C content, and other valuable bioactive compounds. The results strongly exhibit the prospect of the optimized red pitaya peel extract being incorporated in the topical cosmeceutical and pharmaceutical formulations as a natural skin lightening agent to improve the skin tone and texture. The replacement of synthetic skin whitening agents with plant-derived ones will surely minimize the risk of various skin disorders brought about by the artificial active ingredients in commercial cosmetic products to a much greater extent. Not only that, but the waste loads at the processing plant can be greatly reduced through the utilization of new or modified processing techniques or the in-plant treatment and reuse of these agricultural wastes. If this approach is successfully perceived, consumers’ demand for nature-based skin whitening products will be practicable and also be a driving force for the industries to accomplish a lower-waste agribusiness [50]. Further works focusing on the anti-wrinkle and photoprotective properties of the optimized red pitaya peel extract, as well as the application studies are in progress to make it a more effective one.
Author Contributions
All authors contributed significantly to this work and are in agreement with the content of the manuscript. Conceptualization, S.S.A.G.; Data curation, R.V. and S.S.A.G.; Formal analysis, R.V.; Investigation, R.V.; Resources, U.H.Z. and M.I.E.H.; Software, U.H.Z. and M.I.E.H.; Supervision, S.S.A.G. and U.H.Z.; Validation, R.V.; Writing—original draft, R.V.; Writing—review & editing, S.S.A.G., U.H.Z. and M.I.E.H. All authors read the manuscript and approved the final version.
Funding
This work was financially supported by the Geran Putra Berimpak of Universiti Putra Malaysia (grant No. 9550700) within the project: “The evaluation of functional cosmetic properties exhibited by the underutilized pitaya peels for the formulation of skin care product”.
Acknowledgments
Authors would like to acknowledge Laboratory of Halal Science Research, Halal Products Research Institute, Universiti Putra Malaysia for consultation and expertise advice to complete the research work.
Conflicts of Interest
The authors declare no conflict of interest.
Abbreviations
| RSM | Response surface methodology |
| DPPH | 1,1-Diphenyl-2-picrylhydrazyl |
| BCB | Beta-carotene bleaching |
| FRAP | Ferric ion reducing antioxidant power |
| GC-MS | Gas chromatography-mass spectrometry |
| FT-IR | Fourier Transform Infrared Spectroscopy |
| g | Gram |
| mg | Milligram |
| min | Minute |
| mL | Milliliter |
| mM | Millimolar |
| μL | Microliter |
| nm | Nanometer |
| PBS | Phosphate buffer saline |
| h | Hour |
| DOPA | 3,4-hydroxyphenylalanine |
| TRYP-1 | Tyrosinase-related protein-1 |
| TRYP-2 | Tyrosinase-related protein-2 |
| ROS | Reactive oxygen species |
| UV | ultraviolet |
| NO° | Nitric oxide radicals |
| TPTZ | 2,4,6-tripyridyl-s-triazine |
| β-carotene | Beta-carotene |
| ANOVA | Analysis of variance |
| R2 | Coefficient of determination |
| p | Probability |
| CV | Coefficient of variation |
| DHICA | 5,6-dihydroxyindole-2-carboxylic acid |
| mRNA | Messenger ribonucleic acid |
| EI | Electron impact. |
References
- Nerd, A.; Mizrahi, Y. Reproductive biology of cactus fruit crops. Hortic. Rev. 1997, 18, 321–346. [Google Scholar]
- Nerd, A.; Sitrita, Y.; Kaushika, R.A.; Mizrahi, Y. High summer temperatures inhibit flowering in vine pitaya crops (Hylocereus spp.). Sci. Hortic. 2002, 96, 343–350. [Google Scholar] [CrossRef]
- Hoa, T.T.; Clark, C.J.; Wadddell, B.C.; Woolf, A.B. Postharvest quality of dragon fruit (Hylocereus undatus) following disinfesting hot air treatments. Postharvest Biol. Technol. 2006, 41, 62–69. [Google Scholar] [CrossRef]
- Khalili, M.A.; Norhayati, A.H.; Rokiah, M.Y.; Asmah, R.; Muskinah, M.S.; Manaf, A.A. Hypocholesterolemic effect of red pitaya (Hylocereus sp.) on hypercholesterolemia induced rats. Int. Food Res. J. 2009, 16, 431–440. [Google Scholar]
- De Jager, T.L.; Cockrell, A.E.; Du Plessis, S.S. Ultraviolet Light Induced Generation of Reactive Oxygen Species. In Ultraviolet Light in Human Health, Diseases and Environment. Advances in Experimental Medicine and Biology; Ahmad, S., Ed.; Springer: Cham, Switzerland, 2017; Volume 996, pp. 15–23. [Google Scholar]
- Sasaki, M.; Horikoshi, T.; Uchiwa, H.; Miyachi, Y. Up-regulation of tyrosinase gene by nitric oxide in human melanocytes. Pigment Cell Res. 2000, 13, 248–252. [Google Scholar] [CrossRef] [PubMed]
- Shahidi, F.; Zhong, Y. Novel antioxidants in food quality preservation and health promotion. Eur. J. Lipid Sci. Technol. 2010, 112, 930–940. [Google Scholar] [CrossRef]
- Farris, P. Topical vitamin C: A useful agent for treating photoaging and other dermatologic conditions. Dermatol. Surg. 2005, 31, 814–818. [Google Scholar] [CrossRef] [PubMed]
- Matsuda, S.; Shibayama, H.; Hisama, M.; Ohtsuki, M.; Iwaki, M. Inhibitory effects of novel ascorbic derivative VCP-IS-2Na on melanogenesis. Chem. Pharm. Bull. 2008, 56, 292–297. [Google Scholar] [CrossRef] [PubMed]
- Liyana-Pathirana, C.M.; Shahidi, F. Optimization of extraction of phenolic compounds from wheat using response surface methodology. Food Chem. 2005, 93, 47–56. [Google Scholar] [CrossRef]
- Zhao, C.F.; Li, S.; Li, S.J.; Song, G.H.; Yu, L.J.; Zhang, H. Extraction optimization approach to improve accessibility of functional fraction based on combination of total polyphenol, chromatographic profiling and antioxidant activity evaluation: Pyracantha fortuneana fruit as an example. J. Funct. Foods 2013, 5, 715–728. [Google Scholar] [CrossRef]
- Singh, R.P.; Agarwal, R. Cosmeceuticals and silibinin. Clin. Dermatol. 2009, 27, 479–484. [Google Scholar] [CrossRef] [PubMed] [Green Version]
- Kong, K.W.; Mat Junit, S.; Aminudin, N.; Ismail, A.; Abdul Aziz, A. Antioxidant activities and polyphenolics from the shoots of Barringtonia racemosa (L.) Spreng in a polar to apolar medium system. Food Chem. 2012, 134, 324–332. [Google Scholar] [CrossRef]
- Benzie, I.F.F.; Strain, J.J. The ferric reducing ability of plasma (FRAP) as a measure of “antioxidant power”: The FRAP assay. Anal. Biochem. 1999, 239, 70–76. [Google Scholar] [CrossRef] [PubMed]
- Juntachote, T.; Berghofer, E. Antioxidative properties and stability of ethanolic extracts of Holy basil and Galangal. Food Chem. 2005, 92, 193–202. [Google Scholar] [CrossRef]
- Mang, D.Y.; Abdou, A.B.; Njintang, N.Y. Application of desirability-function and RSM to optimize antioxidant properties of mucuna milk. J. Food Meas. Charact. 2015, 4, 495–507. [Google Scholar] [CrossRef]
- Lillian, B.; Maria-João, F.; Bruno, Q.; Ferreira, I.C.F.R.F.; Paula, B. Total phenols, ascorbic acid, B-carotene and lycopene in Portuguese wild edible mushrooms and their antioxidant activities. Food Chem. 2007, 103, 413–419. [Google Scholar]
- Chiari, M.E.; Joray, M.B.; Ruiz, G.; Palacios, S.M.; Carpinella, M.C. Tyrosinase inhibitory activity of native plants from central Argentina: Isolation of an active principle from Lithraea molleoides. Food Chem. 2010, 120, 10–14. [Google Scholar] [CrossRef]
- Spigno, G.; Tramelli, L.; De Faveri, D.M. Effects of extraction time, temperature and solvent on concentration and antioxidant activity of grape marc phenolics. J. Food Eng. 2007, 81, 200–208. [Google Scholar] [CrossRef]
- Chirinos, R.; Rogez, H.; Campos, D.; Pedreschi, R.; Larondelle, Y. Optimization of extraction conditions of antioxidant phenolic compounds from mashua (Tropaeolum tuberosum Ruíz & Pavón) tubers. Sep. Purif. Technol. 2007, 55, 217–225. [Google Scholar]
- Kuljarachanan, T.; Devahastin, S.; Chiewchan, N. Evolution of antioxidant compounds in lime residues during drying. Food Chem. 2009, 113, 944–949. [Google Scholar] [CrossRef]
- Zakaria, S.M.; Kamal, S.M.M.; Harun, M.R.; Omar, R.; Siajam, S.I. Subcritical water technology for extraction of phenolic compounds from Chlorella sp. microalgae and assessment on its antioxidant activity. Molecules 2017, 22, 1105. [Google Scholar] [CrossRef] [PubMed]
- Jayaprakasha, G.K.; Girennavar, B.; Patil, B.S. Radical scavenging activities of Rio red grapefruits and sour orange fruit extracts in different in vitro model systems. Bioresour. Technol. 2008, 99, 4484–4494. [Google Scholar] [CrossRef] [PubMed]
- Hor, S.Y.; Ahmad, M.; Farsi, E.; Yam, M.F.; Hashim, M.A.; Lim, C.P.; Sadikun, A.; Asmawi, M.Z. Safety assessment of methanol extract of red dragon fruit (Hylocereus polyrhizus): Acute and subchronic toxicity studies. Regul. Toxicol. Pharmacol. 2012, 63, 106–114. [Google Scholar] [CrossRef] [PubMed]
- Luo, H.; Cai, Y.; Peng, Z.; Liu, T.; Yang, S. Chemical composition and in vitro evaluation of the cytotoxic and antioxidant activities of supercritical carbon dioxide extracts of pitaya (dragon fruit) peel. Chem. Cent. J. 2014, 8, 1. [Google Scholar] [CrossRef] [PubMed]
- Ajayi, G.O.; Olagunju, J.A.; Ademuyiwa, O.; Martins, O.C. Gas chromatography–mass spectrometry analysis and phytochemical screening of ethanolic root extract of Plumbago zeylanica Linn. J. Med. Plants Res. 2011, 5, 1756–1761. [Google Scholar]
- Mou, Y.; Meng, J.; Fu, X.; Wang, X.; Tian, J.; Wang, M.; Peng, Y.; Zhou, L. Antimicrobial and antioxidant activities and effect of 1-hexadecene addition on palmarumycin C2 and C3 yields in liquid culture of endophytic fungus Berkleasmium sp. Dzf12. Molecules 2013, 18, 15587–15599. [Google Scholar] [CrossRef] [PubMed]
- Kumar, S.R.; Sivakumar, T.; Arulmozhi, K.T.; Mythili, N. Gas chromatography-mass spectroscopy analysis evaluation of bioactive phytochemicals of commercial green teas (Camellia sinensis) of India. Asian J. Pharm. Clin. Res. 2015, 8, 278–282. [Google Scholar]
- Syeda, F.A.; Choudahry, M.I. Gas chromatography mass spectrometry (GC-MS) analysis of petroleum ether extract (oil) and bioassays of crude extract of Iris germanica. Int J. Genet. Mol. Biol. 2011, 3, 95–100. [Google Scholar]
- McGaw, L.J.; Jäger, A.K.; Van Staden, J. Isolation of antibacterial fatty acids from Schotia brachypetala. Fitoterapia 2002, 73, 431–433. [Google Scholar] [CrossRef]
- Le Bellec, F.; Vaillant, F.; Imbert, E. Pitahaya (Hylocereus spp.): A new fruit crop, a market with a future. Fruits 2006, 61, 237–250. [Google Scholar] [CrossRef]
- Adnan, L.; Azizah Osman, A.; Abdul Hamid, A. Antioxidant activity of different extracts of red pitaya (Hylocereus polyrhizus) seed. Int. J. Food Prop. 2011, 14, 1171–1181. [Google Scholar] [CrossRef]
- Kristanto, D. Dragon Fruit Cultivation in Pots and in the Garden; Penebar Swadaya: Jakarta, Indonesia, 2003. [Google Scholar]
- Telang, P.S. Vitamin C in dermatology. Indian Dermatol. Online J. 2013, 4, 143–146. [Google Scholar] [CrossRef] [PubMed]
- Lee, H.S. Tyrosinase inhibitors of Pulsatilla cernua root-derived materials. J. Agric. Food Chem. 2002, 50, 1400–1403. [Google Scholar] [CrossRef] [PubMed]
- Hinek, A.; Kim, H.J.; Wang, Y.; Wang, A.; Mitts, T.F. Sodium l-ascorbate enhances elastic fibers deposition by fibroblasts from normal and pathologic human skin. J. Dermatol. Sci. 2014, 75, 173–182. [Google Scholar] [CrossRef] [PubMed]
- The Dermatology Review. l-ascorbic Acid. 2015. Available online: http://www.thedermreview.com/l-ascorbic-acid-acid/ (accessed on 1 February 2017).
- Ross, D. Ascorbate 6-palmitate protects human erythrocytes from oxidative damage. Free Radic. Biol. Med. 1999, 26, 81–89. [Google Scholar] [CrossRef]
- Austria, R. Stability of vitamin C derivatives in solution and in topical formulations. J. Pharm. Biomed. Anal. 1997, 15, 795–801. [Google Scholar] [CrossRef]
- Draelos, Z.D. Skin lightening preparations and the hydroquinone controversy. Dermatol. Ther. 2007, 20, 308–313. [Google Scholar] [CrossRef] [PubMed]
- Inui, S.; Itami, S. Perifollicular pigment is the first target for Ascorbyl2 phosphate6palmitate. J. Dermatol. 2007, 34, 221–223. [Google Scholar] [CrossRef] [PubMed]
- Farris, P.K. Cosmeceutical vitamins: Vitamin, C. In Procedures in Cosmetic Dermatology Series: Cosmeceuticals; Draelos, Z., Ed.; Elsevier: Philadelphia, PA, USA, 2005; pp. 51–56. [Google Scholar]
- Jiménez, M.; Chazarra, S.; Escribano, J.; Cabanes, J.; García-Carmona, F. Competitive inhibition of mushroom tyrosinase by 4-substituted benzaldehydes. J. Agric. Food Chem. 2001, 49, 4060–4063. [Google Scholar] [CrossRef] [PubMed]
- Kubo, I.; Kinst-Hori, I. 2-Hydroxy-4-methoxy benzaldehyde: A potent tyrosinase inhibitor from African medicinal plants. Planta Med. 1999, 65, 19–22. [Google Scholar] [CrossRef] [PubMed]
- Ando, H.; Funasaka, Y.; Oka, M.; Ohashi, A.; Furumura, M.; Matsunaga, J.; Matsunaga, N.; Hearing, V.; Ichihashi, M. Possible involvement of proteolytic degradation of tyrosinase in the regulatory effect of fatty acids on melanogenesis. J. Lipid Res. 1999, 40, 1312–1316. [Google Scholar] [PubMed]
- Halaban, R.; Cheng, E.; Zhang, Y.; Moellmann, G.; Hanlon, D.; Michalak, M.; Setaluri, V.; Hebert, D. Aberrant retention of tyrosinase in the endoplasmic reticulum mediates accelerated degradation of the enzyme and contributes to the differentiated phenotype of a melanotic melanoma cells. Proc. Natl. Acad. Sci. USA 1997, 94, 6210–6215. [Google Scholar] [CrossRef] [PubMed]
- Ando, H.; Ryu, A.; Hashimoto, A.; Oka, M.; Ichihashi, M. Linoleic acid and α-linolenic acid lightens ultraviolet-induced hyperpigmentation of the skin. Arch. Dermatol. Res. 1998, 290, 375–381. [Google Scholar] [CrossRef] [PubMed]
- Casañola-Martin, G.M.; Marrero-Ponce, Y.; Hassan, M.T. Dragon method for finding novel tyrosinase inhibitors: Biosilico identification and experimental in vitro assays. Eur. J. Med. Chem. 2007, 42, 1370–1381. [Google Scholar] [CrossRef] [PubMed]
- Kamkaen, N.; Mulsri, N.; Treesak, C. Screening of some tropical vegetables for anti-tyrosinase activity. Thai Pharm. Health Sci. J. 2007, 2, 15–19. [Google Scholar]
- Makris, D.P.; Boskou, G.; Andrikopoulos, N.K. Recovery of antioxidant phenolics from white vinification solid by-products employing water/ethanol mixtures. Bioresour. Technol. 2007, 98, 2963–2967. [Google Scholar] [CrossRef] [PubMed]
Figure 1.
The response surface (3D) and contour plots showing the effect of extraction temperature and time (a); temperature and ethanol concentration (b); extraction time and ethanol concentration (c) on the DPPH scavenging activity of the red pitaya peels.
Figure 1.
The response surface (3D) and contour plots showing the effect of extraction temperature and time (a); temperature and ethanol concentration (b); extraction time and ethanol concentration (c) on the DPPH scavenging activity of the red pitaya peels.
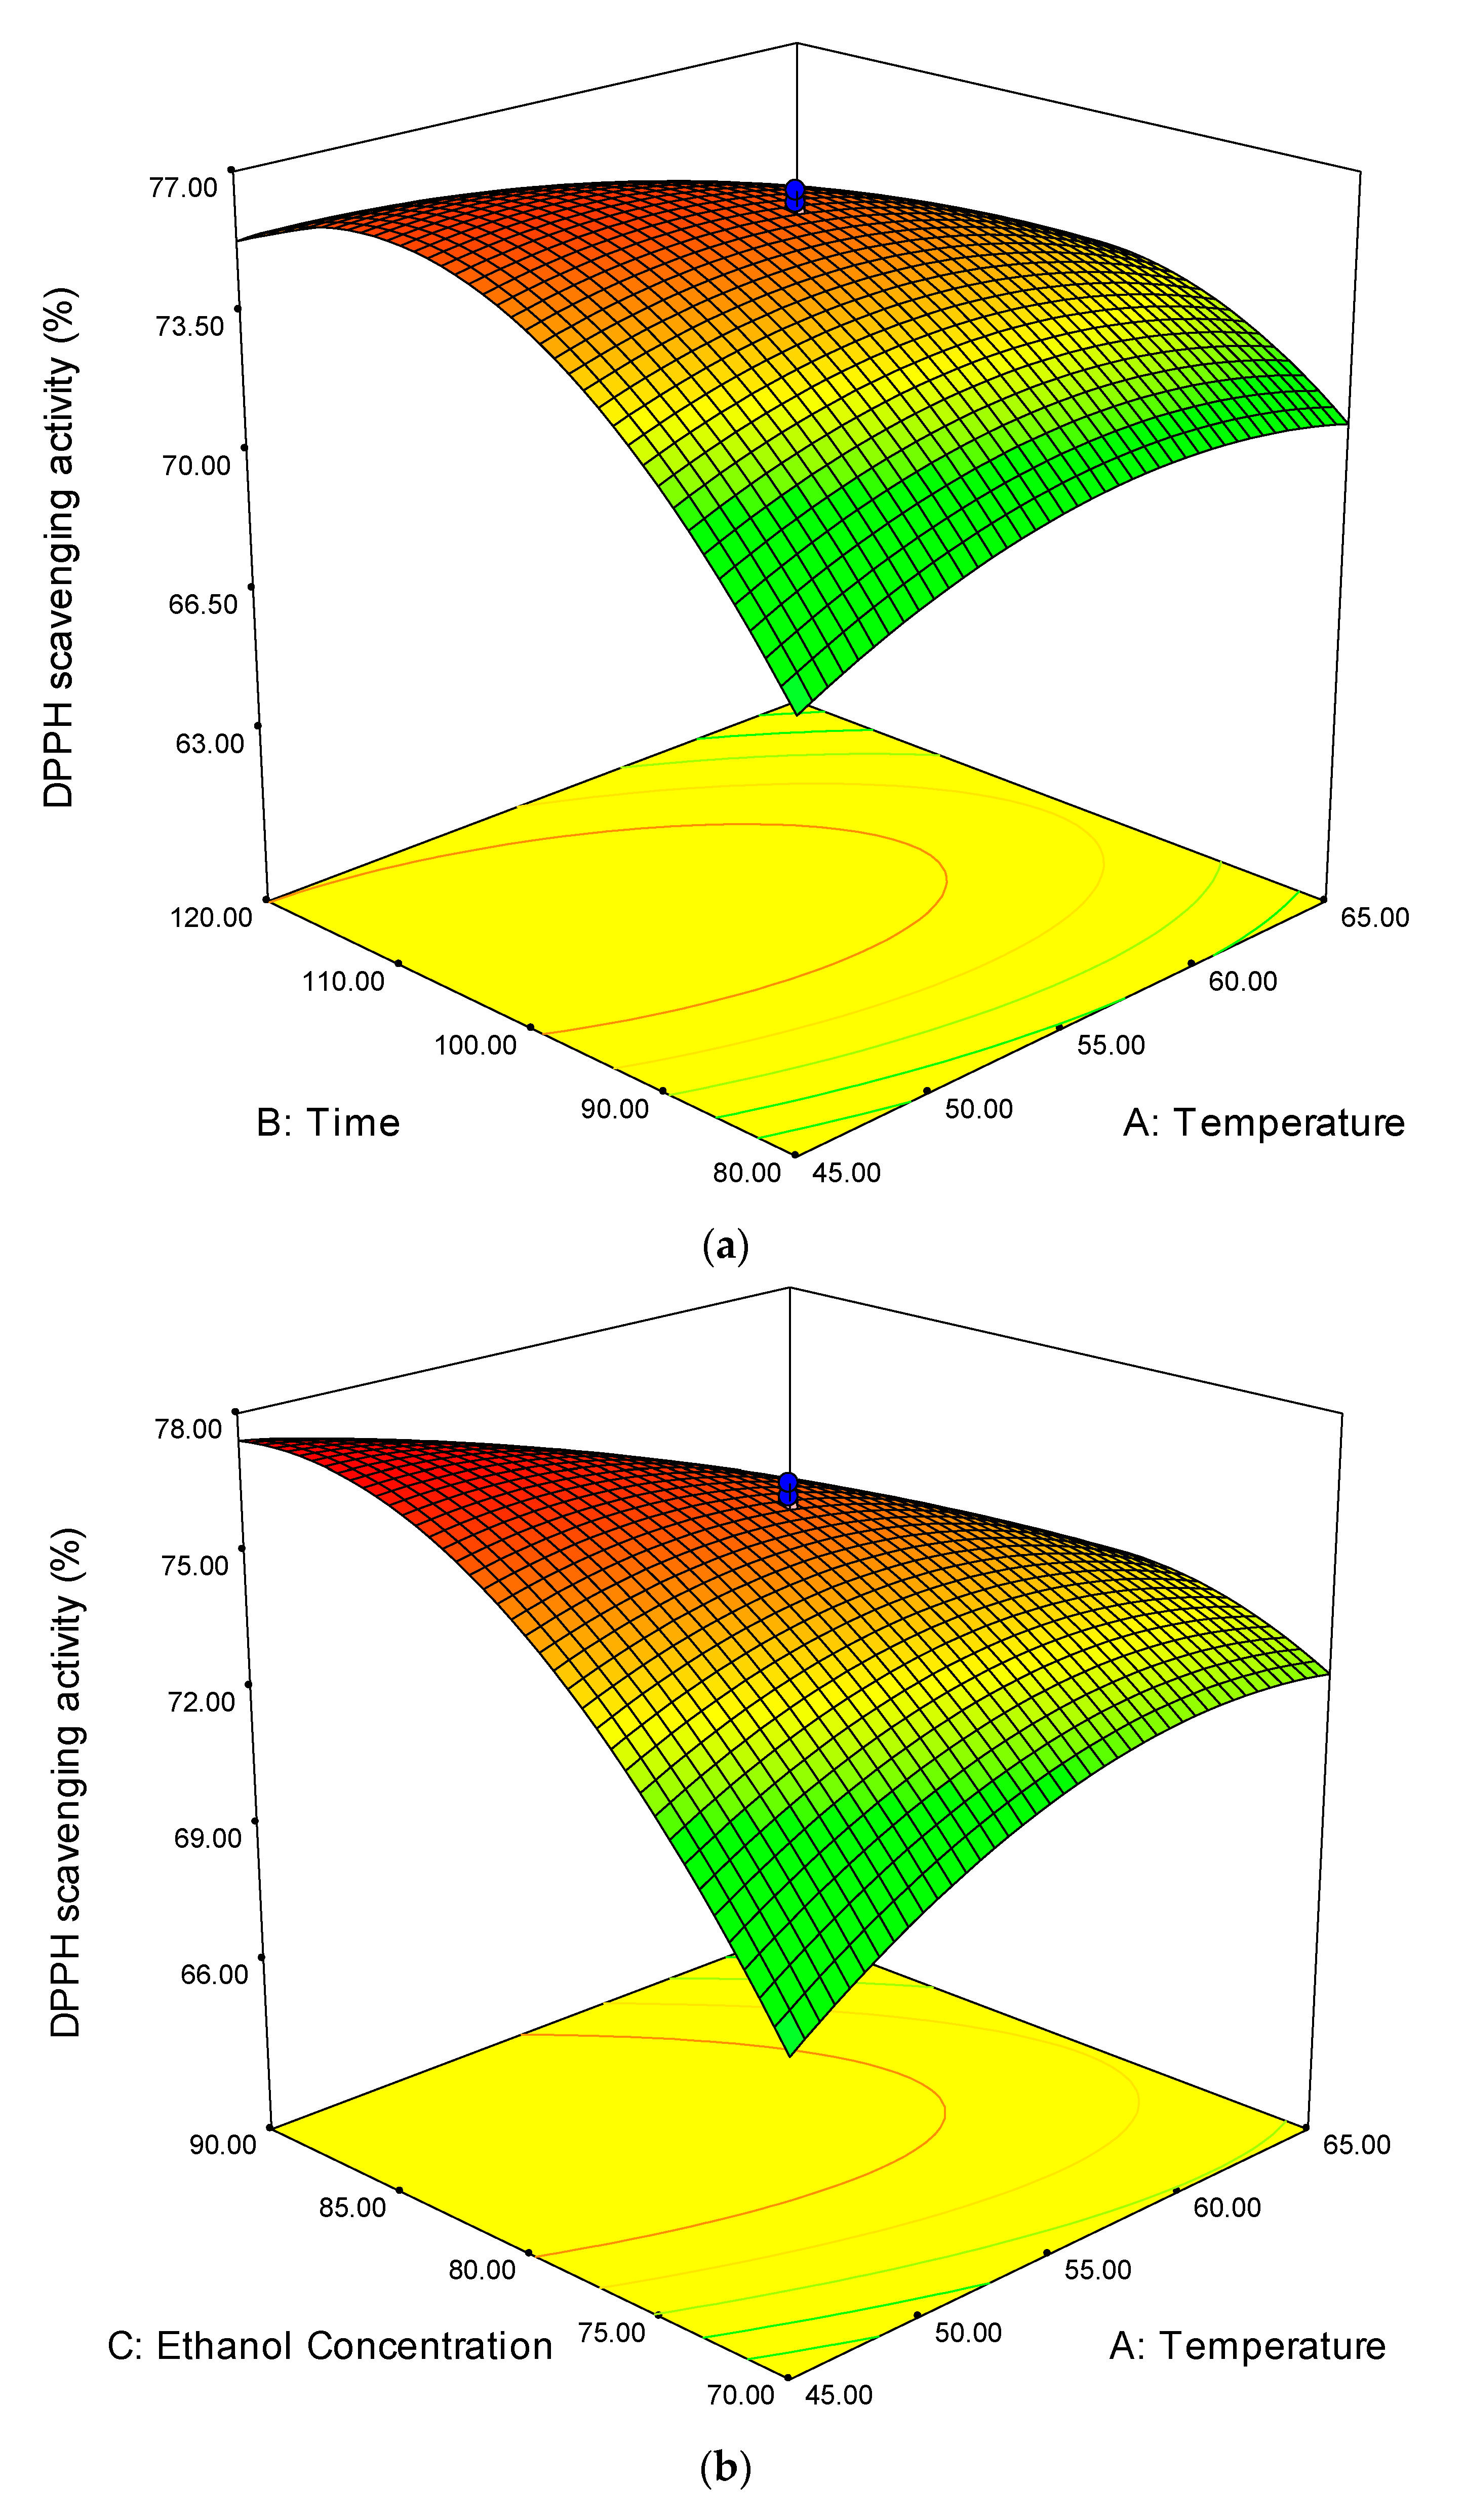
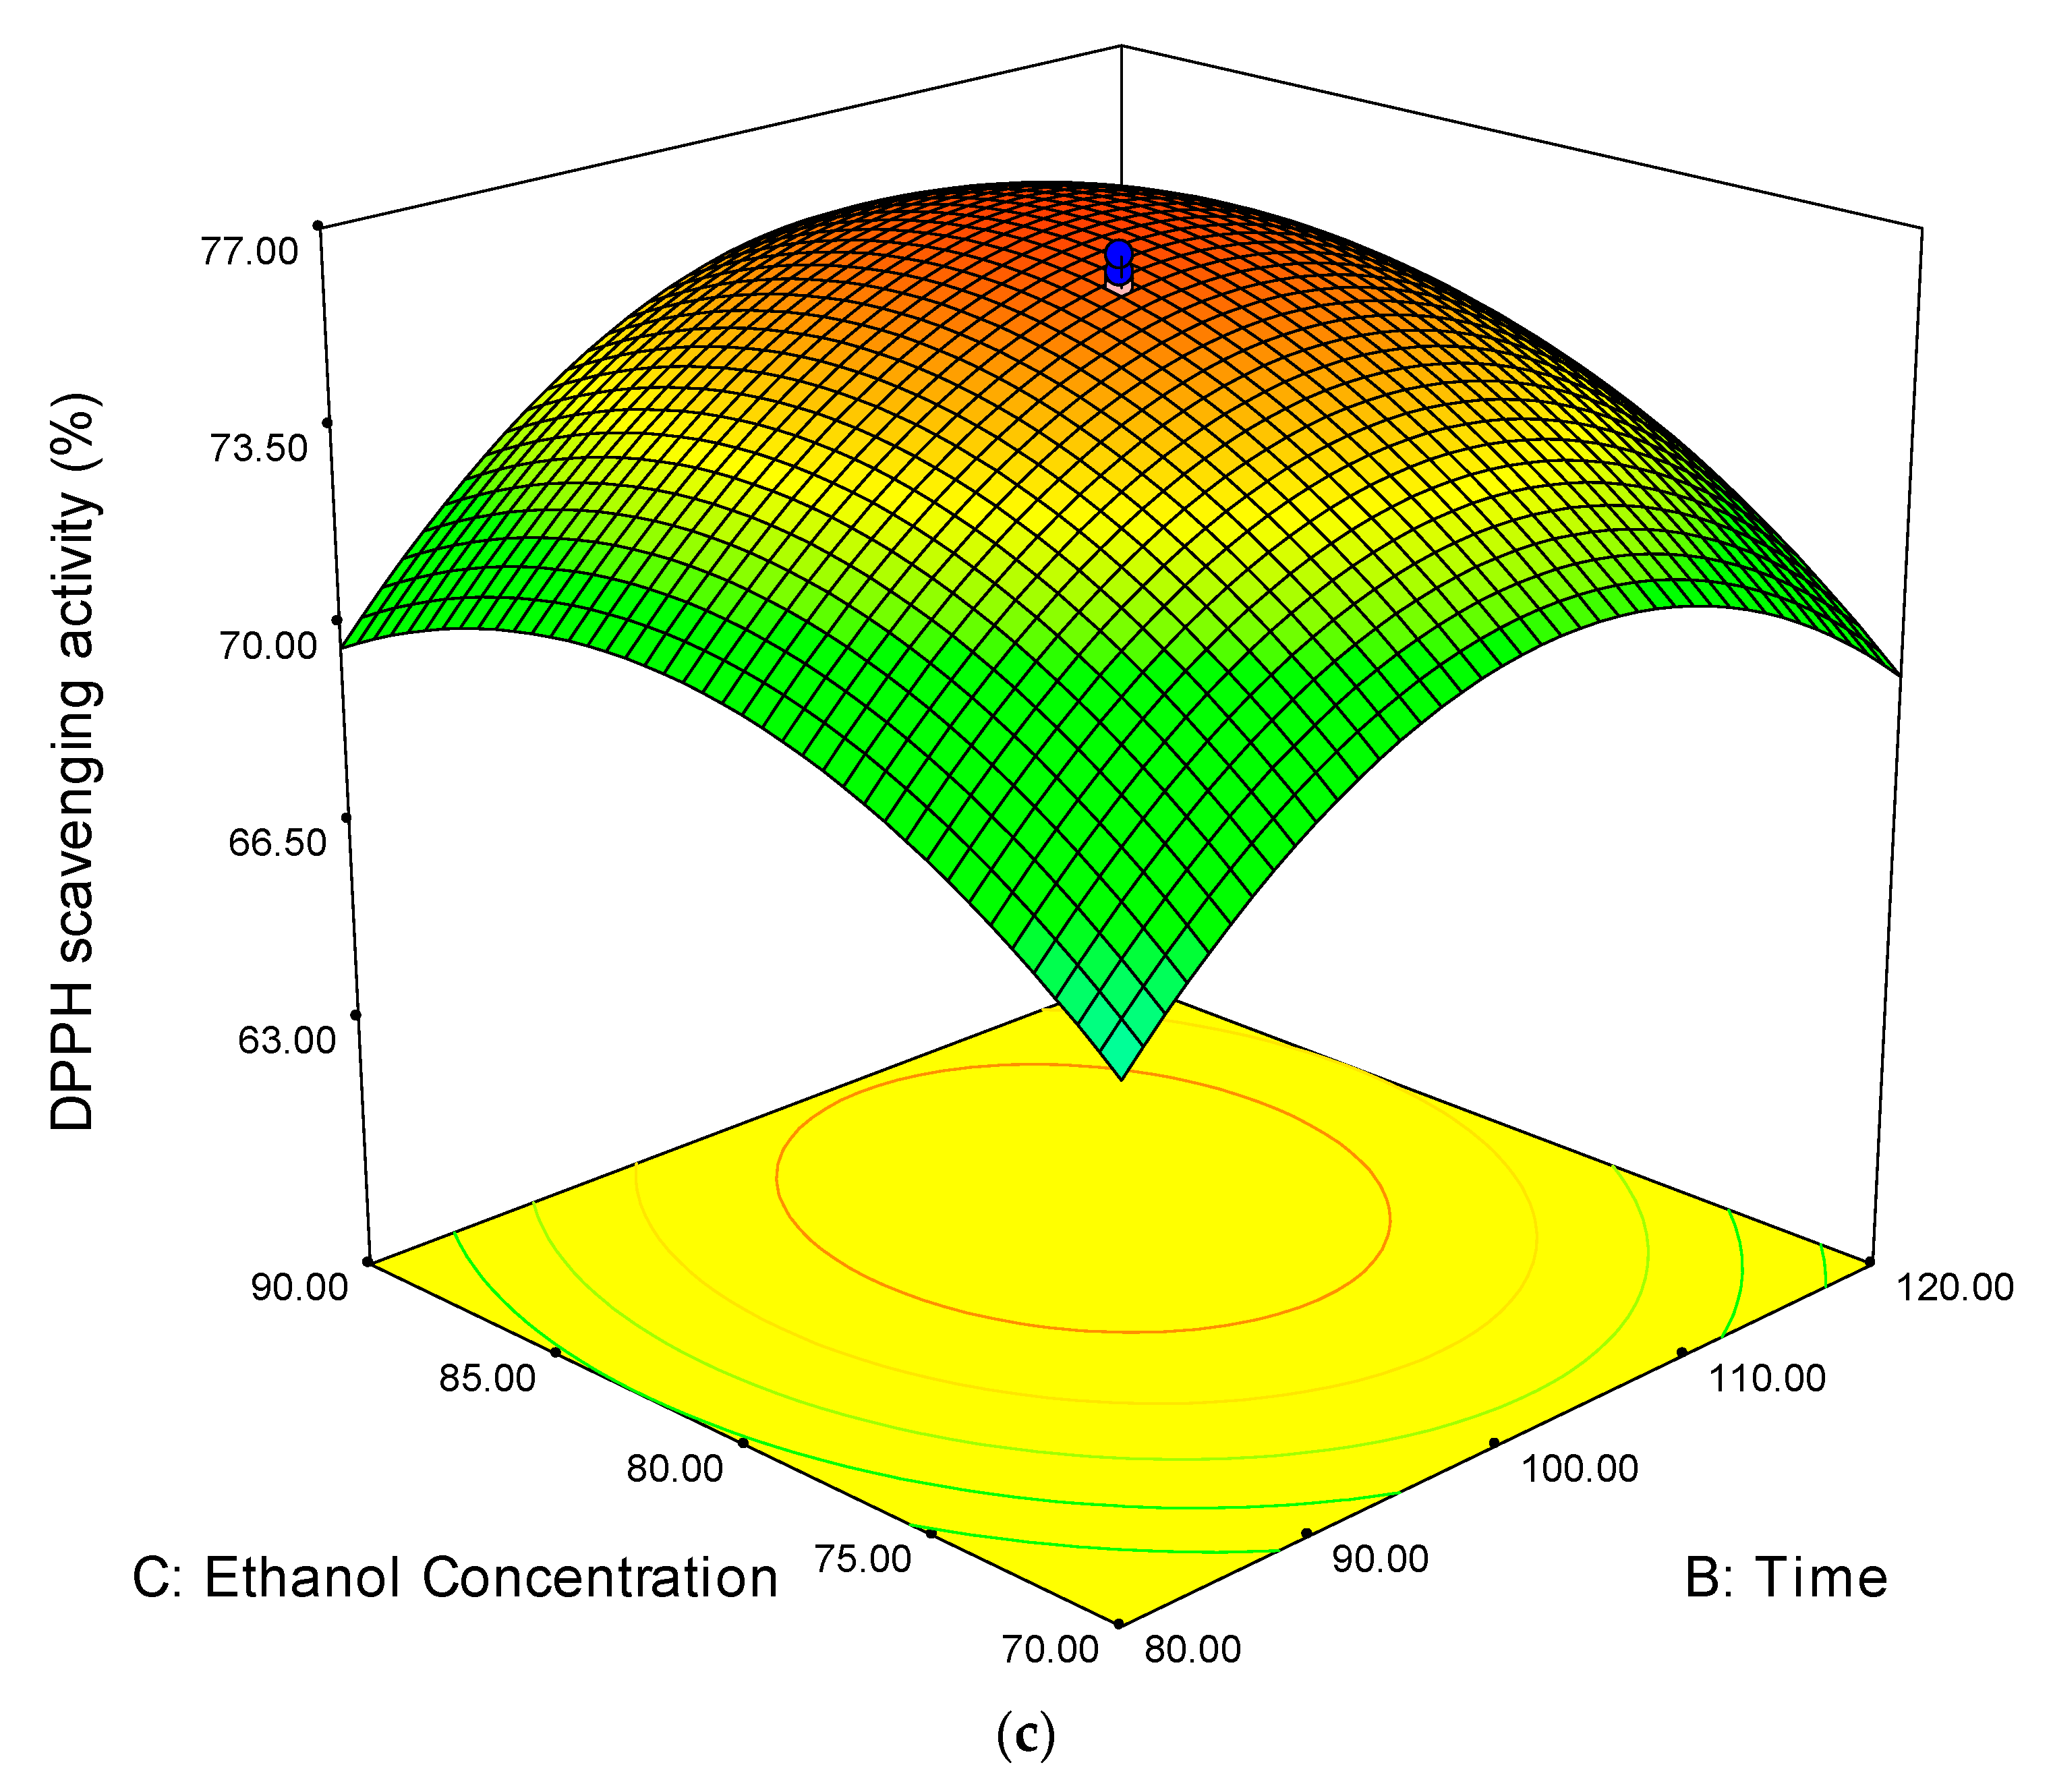
Figure 2.
The response surface (3D) and contour plots showing the effect of extraction temperature and time (a); temperature and ethanol concentration (b); extraction time and ethanol concentration (c) on the ferric reducing antioxidant power of the red pitaya peels.
Figure 2.
The response surface (3D) and contour plots showing the effect of extraction temperature and time (a); temperature and ethanol concentration (b); extraction time and ethanol concentration (c) on the ferric reducing antioxidant power of the red pitaya peels.
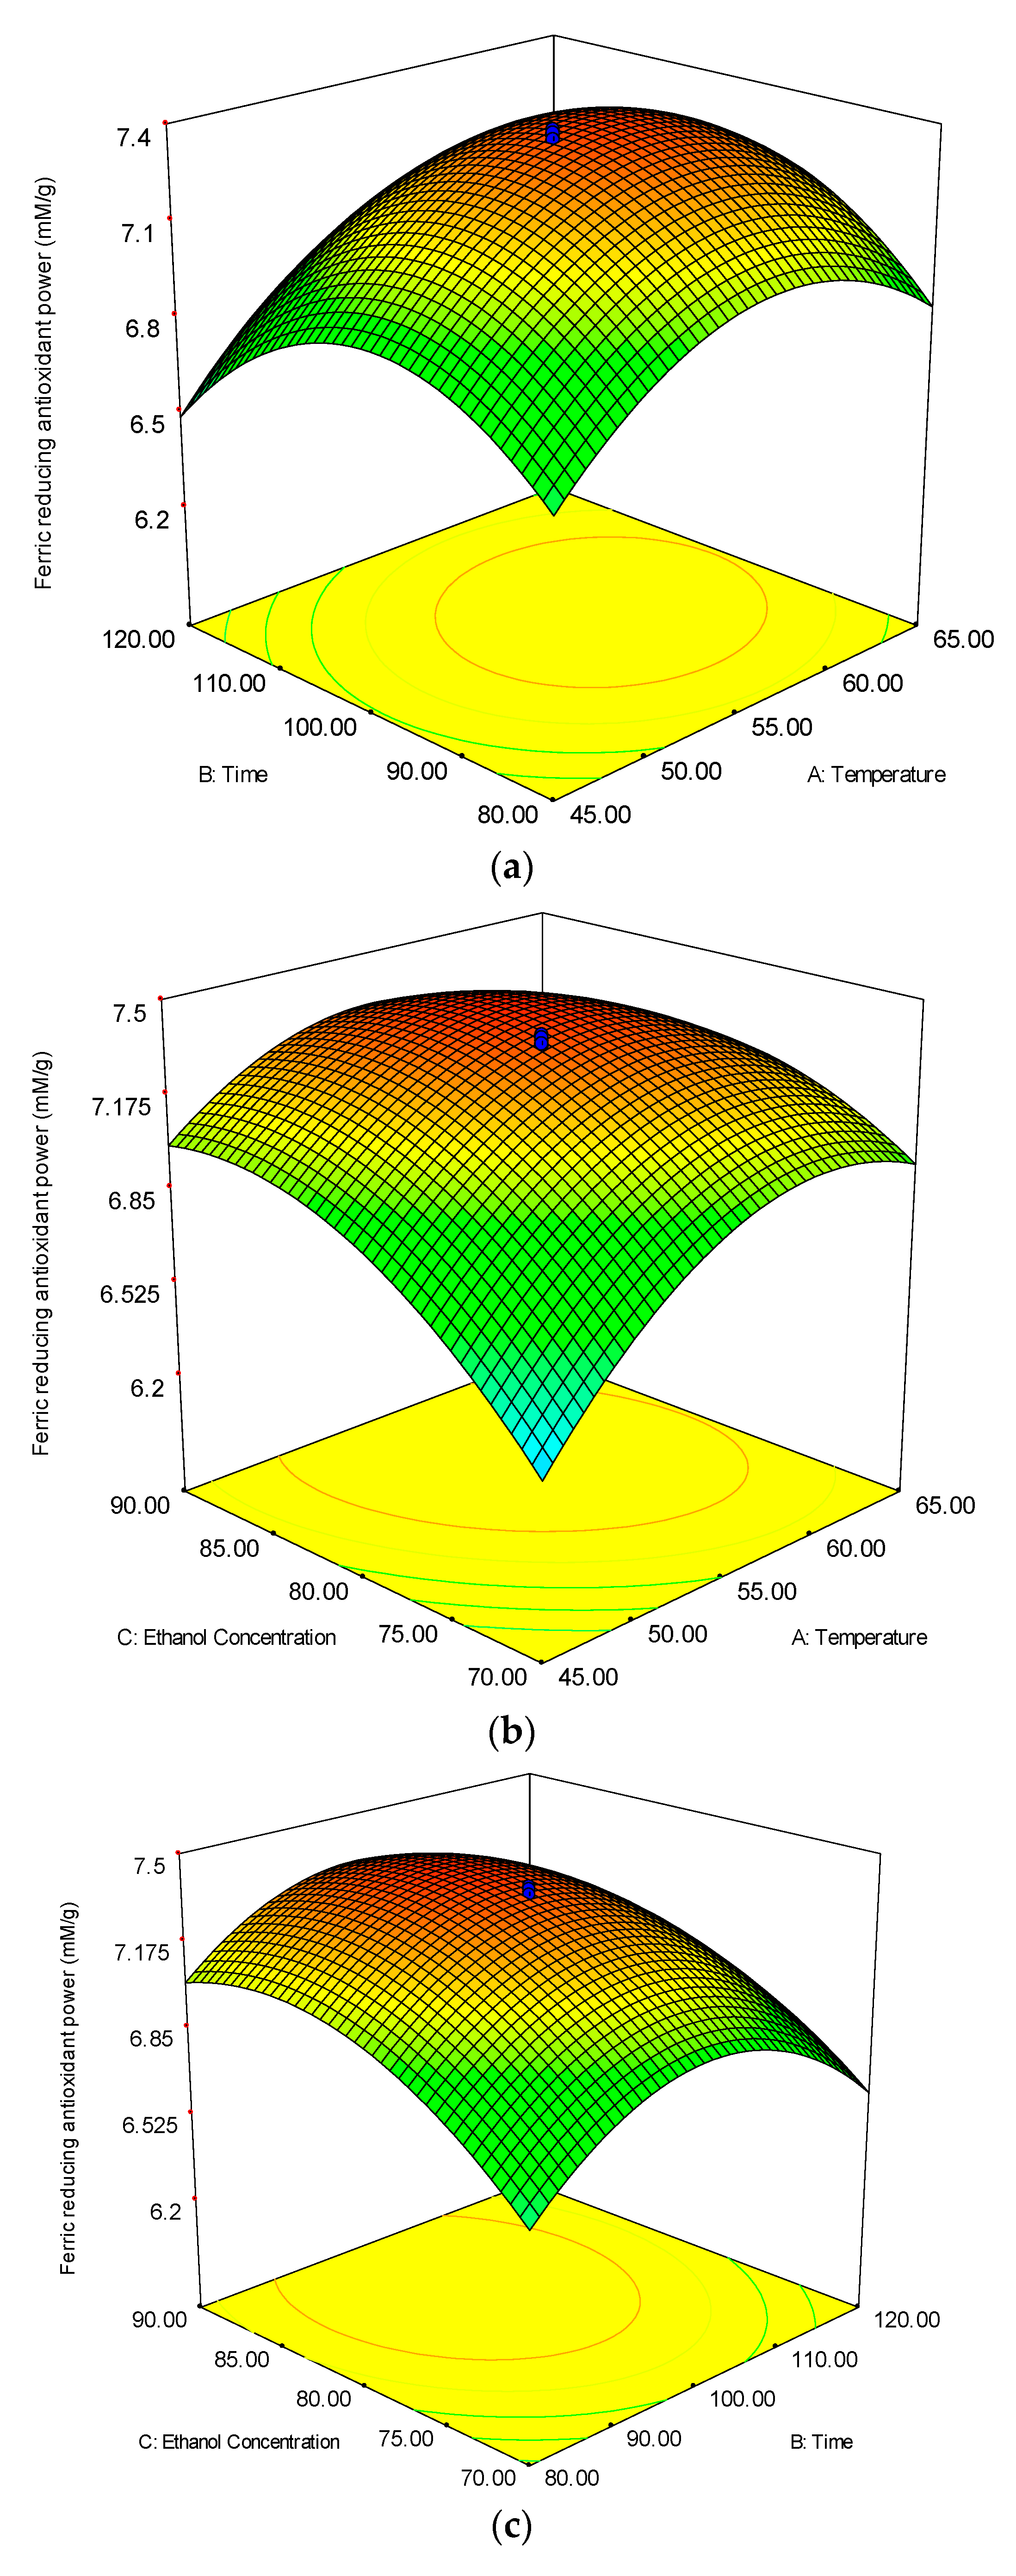
Figure 3.
The response surface (3D) and contour plots showing the effect of extraction temperature and time (a); temperature and ethanol concentration (b) extraction time and ethanol concentration (c) on the β-carotene bleaching inhibition of the red pitaya peels.
Figure 3.
The response surface (3D) and contour plots showing the effect of extraction temperature and time (a); temperature and ethanol concentration (b) extraction time and ethanol concentration (c) on the β-carotene bleaching inhibition of the red pitaya peels.
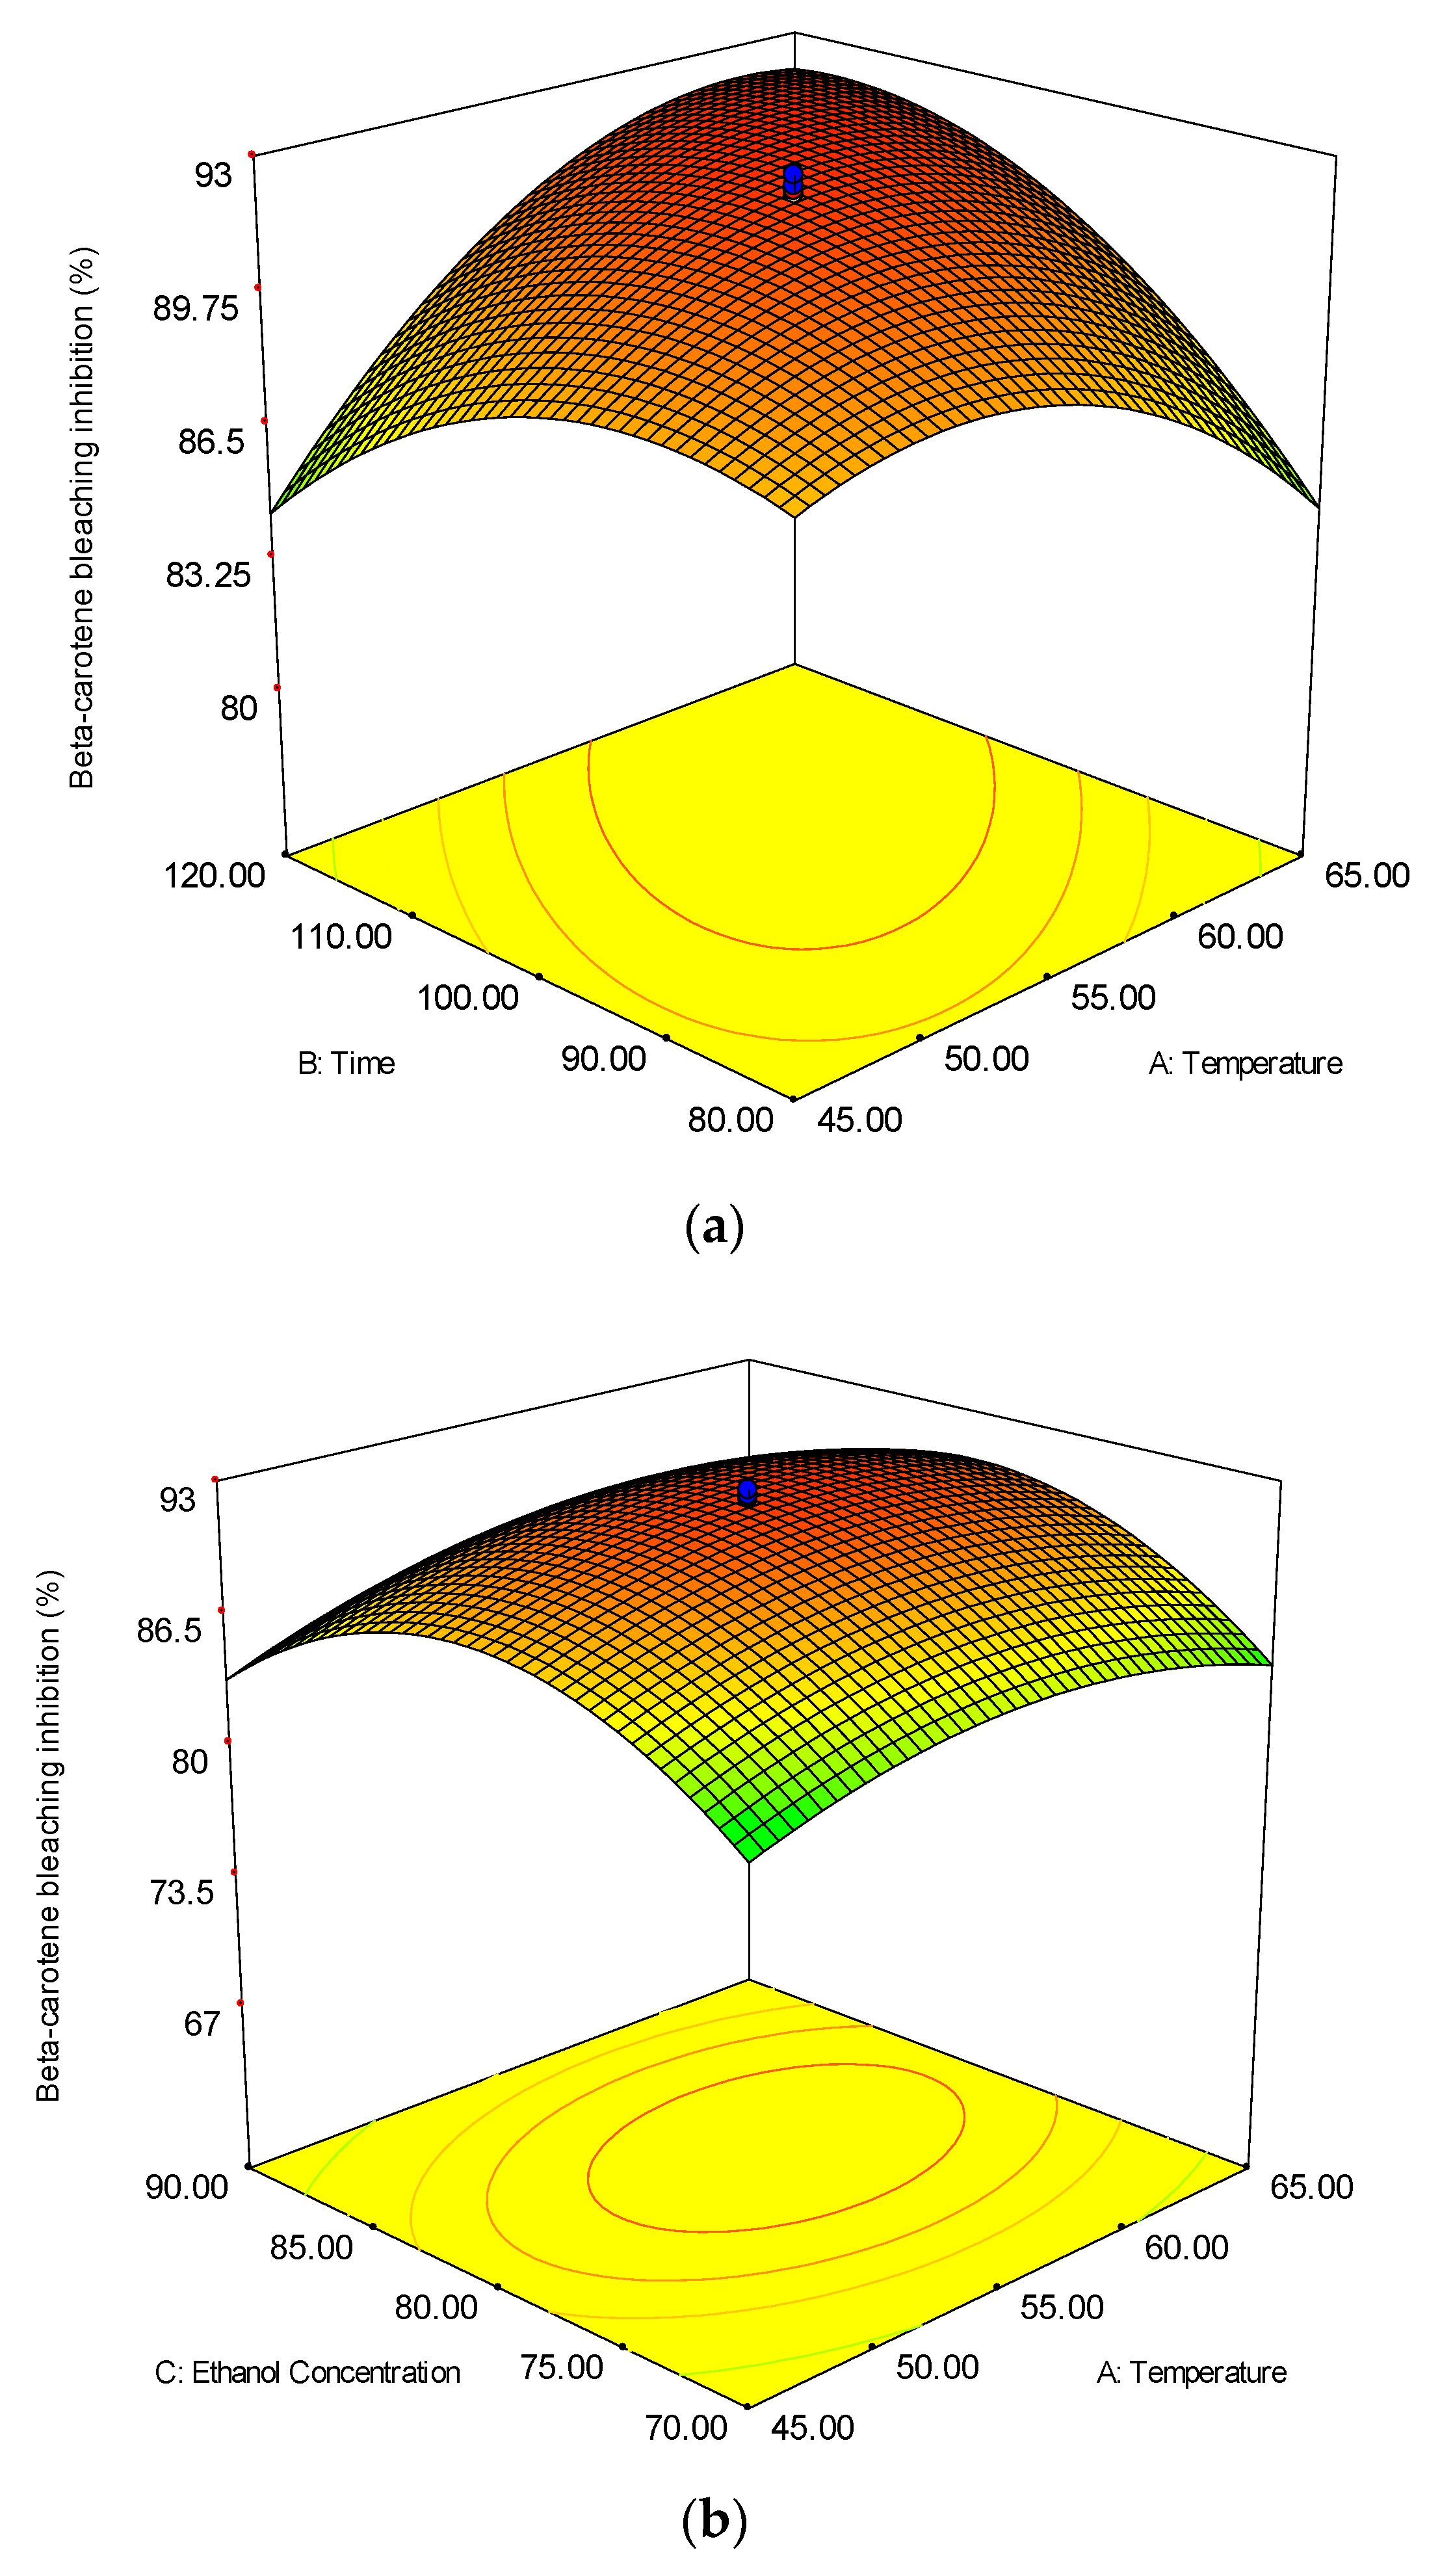
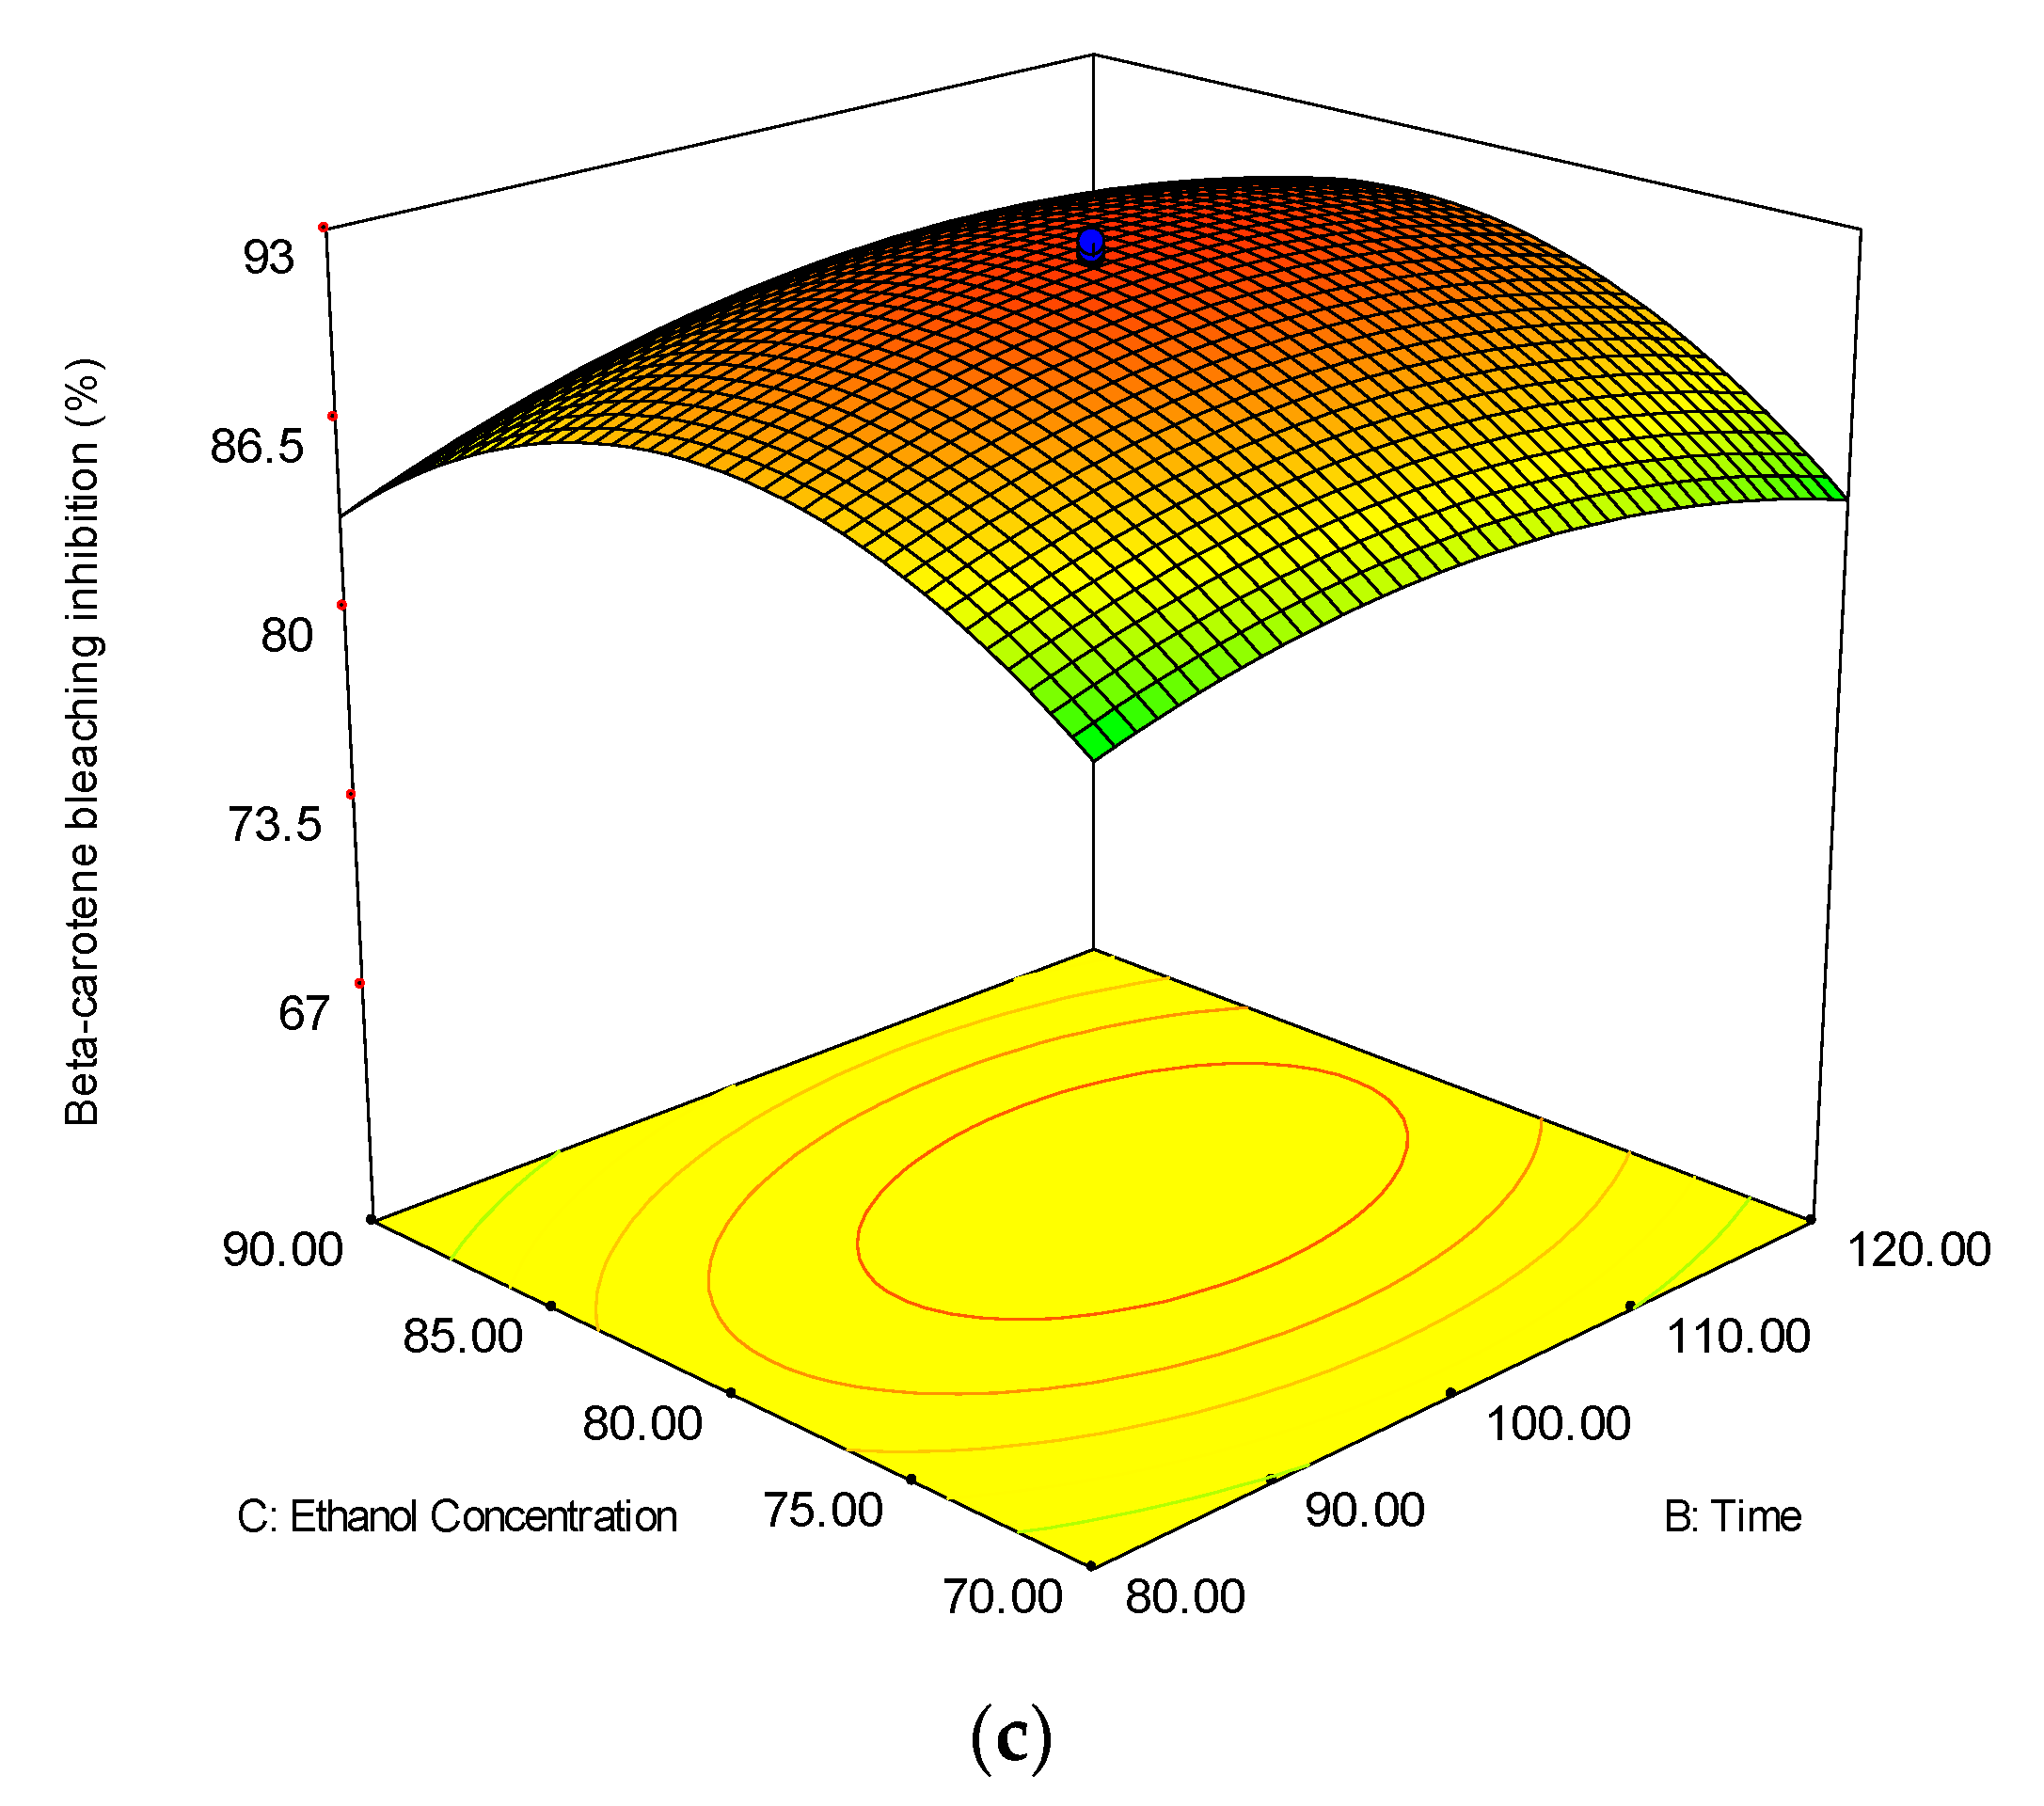
Figure 4.
The GC-MS chromatogram of the optimized red pitaya peel extract.

Figure 5.
The FT-IR spectrum of the optimized red pitaya peel extract.
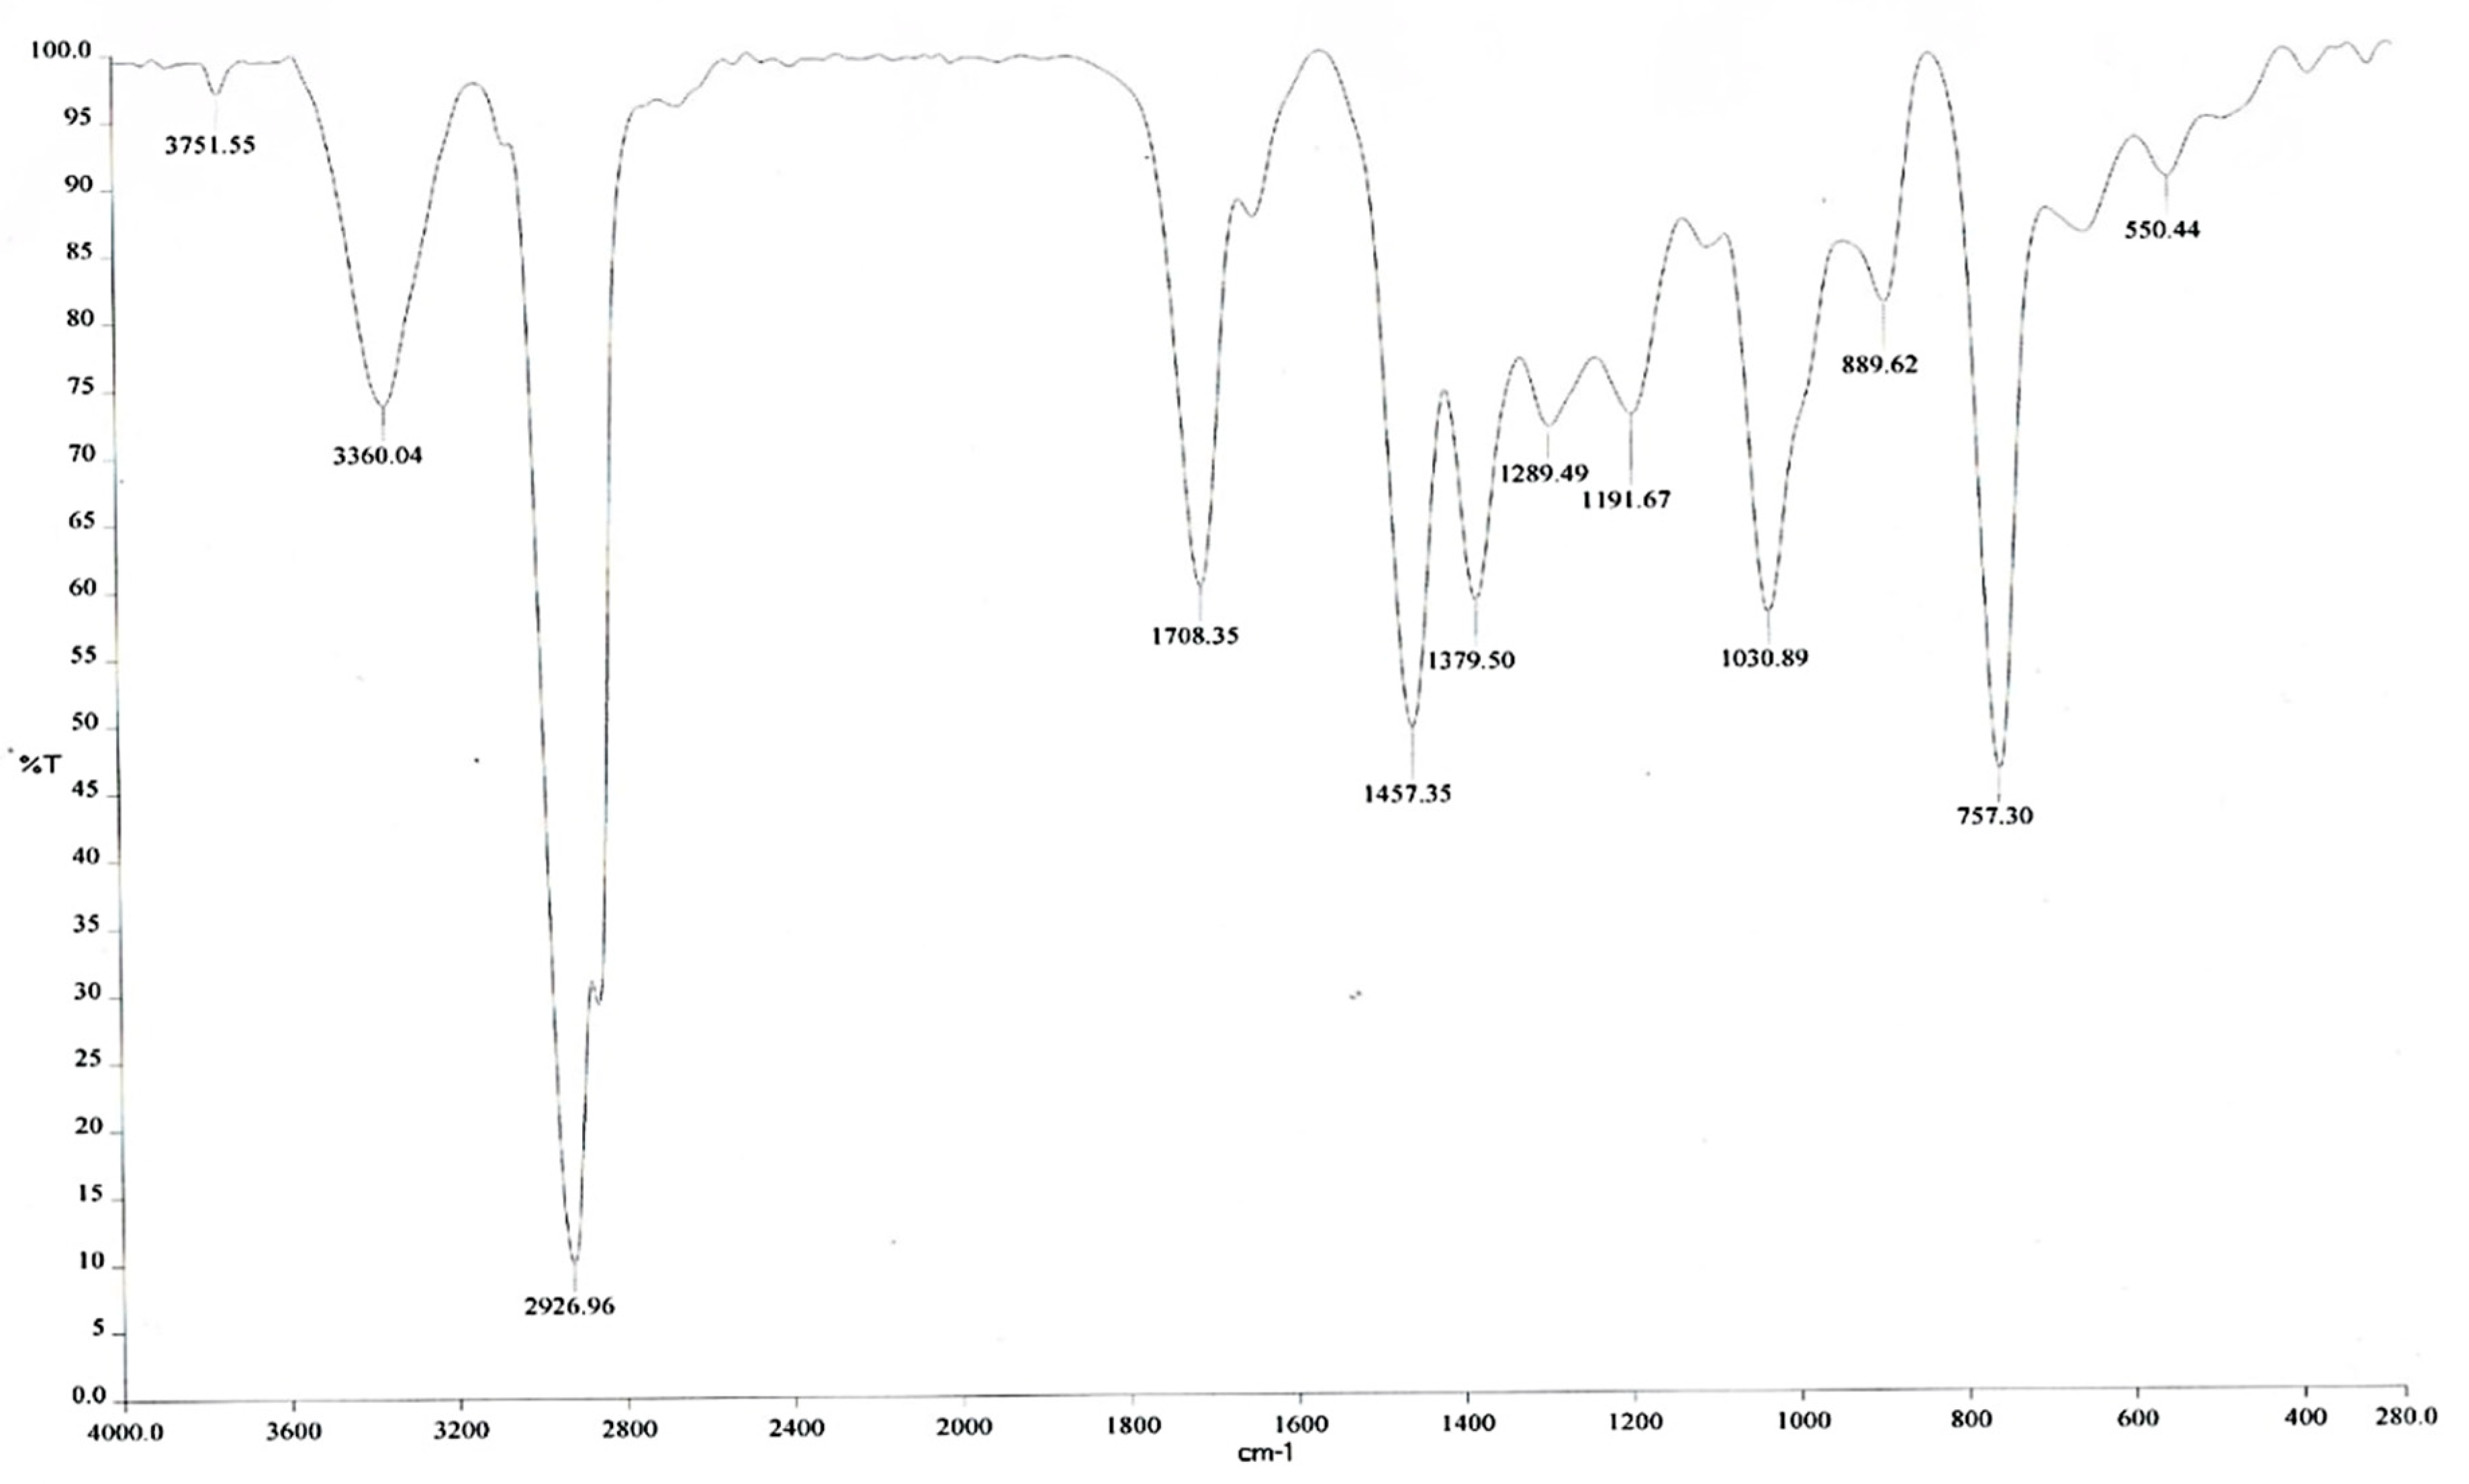
Figure 6.
The percentage of tyrosinase inhibition of the optimized red pitaya peel extract (62.5–1000 µg/mL) and the standard solution of kojic acid.
Figure 6.
The percentage of tyrosinase inhibition of the optimized red pitaya peel extract (62.5–1000 µg/mL) and the standard solution of kojic acid.

Table 1.
The experimental design in coded and uncoded form for the optimization of variables using Central Composite Rotatable Design (CCRD).
Table 1.
The experimental design in coded and uncoded form for the optimization of variables using Central Composite Rotatable Design (CCRD).
| Standard Order | Coded | Uncoded | ||||
|---|---|---|---|---|---|---|
| Ethanol Concentration (%, v/v) | Temperature (°C) | Time (min) | Ethanol Concentration (%, v/v) | Temperature (°C) | Time (min) | |
| 1 | −1.000 | −1.000 | −1.000 | 70.00 | 45.00 | 80.00 |
| 2 | 0.000 | 0.000 | 1.682 | 70.00 | 65.00 | 80.00 |
| 3 | 0.000 | 0.000 | 0.000 | 80.00 | 55.00 | 100.00 |
| 4 | 0.000 | 0.000 | −1.682 | 63.18 | 55.00 | 100.00 |
| 5 | −1.000 | 1.000 | 1.000 | 90.00 | 45.00 | 120.00 |
| 6 | −1.682 | 0.000 | 0.000 | 80.00 | 31.18 | 100.00 |
| 7 | 0.000 | 0.000 | 0.000 | 80.00 | 55.00 | 100.00 |
| 8 | 0.000 | 0.000 | 1.682 | 96.82 | 55.00 | 100.00 |
| 9 | −1.000 | 1.000 | −1.000 | 70.00 | 45.00 | 120.00 |
| 10 | 1.000 | 1.000 | −1.000 | 70.00 | 65.00 | 120.00 |
| 11 | 1.682 | 0.000 | 0.000 | 80.00 | 71.82 | 100.00 |
| 12 | 0.000 | 0.000 | 0.000 | 80.00 | 55.00 | 100.00 |
| 13 | 1.000 | −1.000 | 1.000 | 90.00 | 65.00 | 80.00 |
| 14 | 1.000 | 1.000 | 1.000 | 90.00 | 65.00 | 120.00 |
| 15 | 0.000 | 0.000 | 0.000 | 80.00 | 55.00 | 100.00 |
| 16 | 0.000 | 0.000 | 0.000 | 80.00 | 55.00 | 100.00 |
| 17 | 0.000 | 0.000 | 0.000 | 80.00 | 55.00 | 100.00 |
| 18 | −1.000 | −1.000 | 1.000 | 90.00 | 45.00 | 80.00 |
| 19 | 0.000 | 1.682 | 0.000 | 80.00 | 55.00 | 133.64 |
| 20 | 0.000 | −1.682 | 0.000 | 80.00 | 55.00 | 66.36 |
Table 2.
The experimental and predicted values for the responses of the 1,1-Diphenyl-2-picrylhydrazyl (DPPH), ferric ion reducing antioxidant power (FRAP), and beta-carotene bleaching (BCB) assays under different extraction conditions.
Table 2.
The experimental and predicted values for the responses of the 1,1-Diphenyl-2-picrylhydrazyl (DPPH), ferric ion reducing antioxidant power (FRAP), and beta-carotene bleaching (BCB) assays under different extraction conditions.
| Std. a Order | DPPH b | FRAP c | BCB d | |||
|---|---|---|---|---|---|---|
| Exp. e | Pred. f | Exp. e | Pred. f | Exp. e | Pred. f | |
| 1 | 62.12 | 62.07 | 6.13 | 6.14 | 82.79 | 82.86 |
| 2 | 69.98 | 69.90 | 6.51 | 6.51 | 79.03 | 79.11 |
| 3 | 68.01 | 67.96 | 6.05 | 6.05 | 78.18 | 78.38 |
| 4 | 67.63 | 67.53 | 6.62 | 6.63 | 81.47 | 81.49 |
| 5 | 70.14 | 70.08 | 6.60 | 6.59 | 79.66 | 79.74 |
| 6 | 66.53 | 66.42 | 6.42 | 6.42 | 83.06 | 82.96 |
| 7 | 77.45 | 77.37 | 6.38 | 6.38 | 83.40 | 83.42 |
| 8 | 65.57 | 65.45 | 6.42 | 6.41 | 93.47 | 93.51 |
| 9 | 73.68 | 73.75 | 6.29 | 6.29 | 80.00 | 79.83 |
| 10 | 70.14 | 70.31 | 6.63 | 6.60 | 85.13 | 85.16 |
| 11 | 63.53 | 63.63 | 6.57 | 6.57 | 80.58 | 80.55 |
| 12 | 67.63 | 67.76 | 6.47 | 6.48 | 85.77 | 85.66 |
| 13 | 66.08 | 66.17 | 6.28 | 6.27 | 80.52 | 80.36 |
| 14 | 71.01 | 71.15 | 6.46 | 6.47 | 87.81 | 87.84 |
| 15 | 76.22 | 76.17 | 7.38 | 7.35 | 92.56 | 92.31 |
| 16 | 76.11 | 76.17 | 7.32 | 7.35 | 92.09 | 92.31 |
| 17 | 76.00 | 76.17 | 7.34 | 7.35 | 92.17 | 92.31 |
| 18 | 75.99 | 76.17 | 7.36 | 7.35 | 92.18 | 92.31 |
| 19 | 76.23 | 76.17 | 7.37 | 7.35 | 92.29 | 92.31 |
| 20 | 76.52 | 76.17 | 7.35 | 7.35 | 92.54 | 92.31 |
a Standard run—non randomized; b 1,1-Diphenyl-2-picrylhydrazyl scavenging activity in %; c Ferric ion reducing antioxidant power in mM Fe2+/g DW; d Beta-carotene bleaching inhibition in %; e Experimental value; f Predicted value.
Table 3.
The regression coefficients of the predicted quadratic polynomial models for the responses of the DPPH, FRAP, and BCB assays.
Table 3.
The regression coefficients of the predicted quadratic polynomial models for the responses of the DPPH, FRAP, and BCB assays.
| Source | DPPH | FRAP | BCB | ||||||
|---|---|---|---|---|---|---|---|---|---|
| Mean Square | F-Value | p-Value | Mean Square | F-Value | p-Value | Mean Square | F-Value | p-Value | |
| Model | 50.16 | 1474.51 | <0.0001 | 0.46 | 1486.99 | <0.0001 | 65.39 | 1916.64 | <0.0001 |
| A–Temperature | 14.28 | 419.69 | <0.0001 | 0.14 | 453.82 | <0.0001 | 34.20 | 1002.56 | <0.0001 |
| B–Time | 20.63 | 606.46 | <0.0001 | 8.403 × 10⁻³ | 27.40 | 0.0004 | 31.43 | 921.35 | <0.0001 |
| C–Ethanol concentration | 30.00 | 881.89 | <0.0001 | 0.048 | 155.09 | <0.0001 | 67.61 | 1981.67 | <0.0001 |
| AB | 34.07 | 1001.60 | <0.0001 | 0.021 | 66.84 | <0.0001 | 23.56 | 690.58 | <0.0001 |
| AC | 65.95 | 1938.75 | <0.0001 | 0.15 | 492.19 | <0.0001 | 24.29 | 711.87 | <0.0001 |
| BC | 0.99 | 29.01 | 0.0003 | 8.001 × 10⁻³ | 26.08 | 0.0005 | 33.34 | 977.15 | <0.0001 |
| A2 | 30.96 | 910.14 | <0.0001 | 1.45 | 4733.10 | <0.0001 | 173.51 | 5085.76 | <0.0001 |
| B2 | 197.69 | 5811.29 | <0.0001 | 1.26 | 4097.01 | <0.0001 | 152.63 | 4473.69 | <0.0001 |
| C2 | 101.62 | 2987.23 | <0.0001 | 1.76 | 5723.86 | <0.0001 | 121.45 | 3559.65 | <0.0001 |
| Lack of fit | 0.029 | 0.76 | 0.6137 * | 1.468 × 10⁻³ | 0.31 | 0.8849 * | 0.028 | 0.70 | 0.6468 * |
* p > 0.05, not significant.
Table 4.
The compound composition of red pitaya peel extract by GC-MS as per NIST library.
| No | Name of the Compound | Formula | Retention Time (min) | Peak Area (%) |
|---|---|---|---|---|
| 1. | 1-Nonadecene | C19H38 | 6.841 | 1.40 |
| 2. | 2-Isopropyl-5-methylcyclohexanol | C10H20O | 7.408 | 1.16 |
| 3. | Benzenecarboxylic acid | C7H6O2 | 7.635 | 0.90 |
| 4. | Undecane | C11H24 | 7.682 | 0.47 |
| 5. | 1-Dodecanol | C12H26O | 8.730 | 0.98 |
| 6. | Nonanoic acid | C9H18O2 | 8.978 | 0.29 |
| 7. | Benzenemethanol | C7H8O | 9.124 | 3.17 |
| 8. | 3-Allyl-2-methoxyphenol | C10H12O2 | 9.175 | 0.94 |
| 9. | Tetradecane | C14H30 | 9.813 | 0.76 |
| 10. | Decyltrifluoroacetate | C12H21F3O2 | 9.978 | 0.88 |
| 11. | Phenol, 2,4-bis(1,1-dimethylethyl) | C14H22O | 10.180 | 0.59 |
| 12. | Lauric acid | C12H24O2 | 10.273 | 0.35 |
| 13. | Lauric acid, methyl ester | C13H26O2 | 10.407 | 4.93 |
| 14. | 5-Phenylundecane | C17H28 | 11.170 | 0.77 |
| 15. | Benzophenone | C13H10O | 11.346 | 0.58 |
| 16. | Ethylhexyl benzoate | C15H22O2 | 11.554 | 1.65 |
| 17. | Heptadecane | C17H36 | 11.714 | 1.04 |
| 18. | Myristic acid | C14H28O2 | 11.819 | 0.87 |
| 19. | N-Hexadecanoic acid | C17H34O2 | 12.244 | 10.50 |
| 20. | l-(+)-Ascorbic acid 2,6-dihexadecanoate | C38H68O8 | 12.410 | 14.66 |
| 21. | Benzaldehyde | C7H6O | 12.592 | 0.27 |
| 22. | Pentadecanoic acid | C15H30O2 | 12.758 | 0.27 |
| 23. | 9-Octadecenoic acid (Z) | C19H36O2 | 13.154 | 11.36 |
| 24. | 1-Hexadecene | C16H32 | 13.190 | 8.82 |
| 25. | 1-Tetradecene | C14H28 | 13.376 | 8.89 |
| 26. | Cyclopentacycloheptene | C10H8 | 13.408 | 9.96 |
| 27. | Behenic alcohol | C22H46O | 13.514 | 1.62 |
| 28. | Linoleic acid | C18H32O2 | 13.550 | 3.07 |
| 29. | Oleic acid | C18H34O2 | 14.167 | 6.17 |
| 30. | Octadecanoic acid | C18H36O2 | 15.535 | 2.69 |
© 2018 by the authors. Licensee MDPI, Basel, Switzerland. This article is an open access article distributed under the terms and conditions of the Creative Commons Attribution (CC BY) license (http://creativecommons.org/licenses/by/4.0/).
Share and Cite
MDPI and ACS Style
Vijayakumar, R.; Abd Gani, S.S.; Zaidan, U.H.; Halmi, M.I.E. Optimization of the Antioxidant Potentials of Red Pitaya Peels and Its In Vitro Skin Whitening Properties. Appl. Sci. 2018, 8, 1516. https://doi.org/10.3390/app8091516
AMA Style
Vijayakumar R, Abd Gani SS, Zaidan UH, Halmi MIE. Optimization of the Antioxidant Potentials of Red Pitaya Peels and Its In Vitro Skin Whitening Properties. Applied Sciences. 2018; 8(9):1516. https://doi.org/10.3390/app8091516
Chicago/Turabian StyleVijayakumar, Ramya, Siti Salwa Abd Gani, Uswatun Hasanah Zaidan, and Mohd Izuan Effendi Halmi. 2018. "Optimization of the Antioxidant Potentials of Red Pitaya Peels and Its In Vitro Skin Whitening Properties" Applied Sciences 8, no. 9: 1516. https://doi.org/10.3390/app8091516
Note that from the first issue of 2016, this journal uses article numbers instead of page numbers. See further details here.