Article

A Case Study on the Application of the Steel Tube Slab Structure in Construction of a Subway Station

1
School of Resources & Civil Engineering, Northeastern University, Shenyang 110819, China
2
School of Civil and Environmental Engineering, University of New South Wales, UNSW, Sydney, NSW 2052, Australia
*
Authors to whom correspondence should be addressed.
Appl. Sci. 2018, 8(9), 1437; https://doi.org/10.3390/app8091437
Submission received: 10 July 2018 / Revised: 10 August 2018 / Accepted: 20 August 2018 / Published: 23 August 2018
(This article belongs to the Section Environmental Sciences)

Abstract

:
It is an effective approach to use Steel Tube Slab (STS) structure combined with the Pile-Beam-Arch (PBA) method to construct a large-space underground station. Traditional construction methods cannot meet the requirement of construction because of the complicated soil layers and high building densities in urban areas. The STS method can effectively increase the rigidity of the supporting system by using steel tubes. Firstly, the stress of bolts and steel tubes are investigated in the construction process based on the field monitoring data. Subsequently, FLAC3D is used to establish a three-dimensional model, which is verified based on the in-situ monitoring data; the effect of excavation process on ground settlement, deformation of STS structure and bridge pile are studied by numerical results. Moreover, the key parameters such as welding of flanges and the step length are studied. The results show that the stress of the steel tubes and flanges does not exceed the designed strength during the construction process. Based on the numerical simulation data, it is indicated that the STS structure can be a very effective and dependable measure in controlling and reducing the surface settlement and the existing adjacent buildings. The numerical results can be used to guide the later construction.

1. Introduction

The stress redistribution induced by underground excavations causes soil movements around the excavation face in the earth mass, which is also translated to ground settlement. These soil movements can cause severe damage to adjacent buildings and underground facilities [1,2]. Control of the soil movements due to excavations is of utter importance in subway projects, because they are often planned in the populated areas of cities that are already well developed. Several methods for surface settlement prediction due to underground excavations are currently available including those proposed by Peck, Reilly and Novozhenin [3,4,5].
Underground excavations in urban area have some characteristic features such as large spans, ultra-shallow buried depth, complex environments, and heavy overburdens due to street traffic. Hence, excavation-induced instability and settlement has become a major concern in the design and construction of the new underground excavations [6].
The pipe roofing method evolved from pipe umbrella method adopted in shallow ground cover and poor ground conditions during underground construction. As for this method, steel pipes are jacked to the design location by pipe jacking machines to act as the initial support system. These adjacent pipes are connected together and form a supporting structure, filled with grout or concrete in the inside and outside of the steel pipes before tunnel excavation. The pipe roofing method was firstly to be used to construct an underpass railway in 1971 and a total of six such projects were completed in the next decade [7]. The Antwerp subway station in Belgium was an early engineering feature, constructed by applying pipe roofing method in Europe in 1979 [8,9]. It was first used in America in 1994 for a large shallow covered tunnel [10]. Subsequently, this method is applied to construct highways in Japan, and on the basis of the pipe roofing method, Endless Self-Advancing (ESA) and Front Jacking (FJ) were proposed [11,12]. Meanwhile, the methods were widely applied to certain engineering projects in Singapore and Malaysia [7,13]. A typical engineering project, 923 stations of the Seoul subway line 9 in Korea was constructed by using the pipe roofing method in the complex environments [14,15].
Based on some engineering examples of previous pipe roofing method in China, it was used to build an underpass in Hong Kong in 1984, and the Taipei Songshan airport underpass was constructed using the pipe roofing method in 1989. The pipe roofing method was employed to construct the vehicle tunnel, which passes the Taipei International Airport [16]. The Roof-Box Jacking Method (RBJ) was used for the underpass project of Shanghai Beihong street in 2004. This support structure formed a rectangular section and was made up of 80 steel pipes with a diameter of 0.97 m and longitudinal length of 125 m [17]. By an arc-shaped supporting system, Xinle Yizhi station of Shenyang subway line 2 was constructed by the new roof tubular of method with 19 steel pipes with diameter of approximately 2 m in 2011 [18]. The Gongbei tunnel, as a part of Hongkong-Zhuhai-Macao Bridge project, was constructed a combination technology of curved pipe jacking roof for ground support and ground freezing for waterproof. This pipe roofing structure is composed of 36 steel pipe strings of 1.620 m diameter with a 355–358 mm gap between adjacent strings [19,20].
In term of studies on the working mechanism of the pipe-roofing support systems, these have shown that the maximum bending moment of the steel grid is often much larger than that of the pipe-roofing system in the longitudinal direction [21]. Therefore, to ensure the stability of the pipe-roofing system during excavation, an intensive temporary supporting structure is often required. The tedious and expensive set up of the steel supporting structure is a big disadvantage of the traditional pipe-roofing method. And as for forming an arch structure, the space utilization is lower than the rectangular section.
To overcome the problem associated with supporting system requirements as mentioned above, a new pipe-roofing structure, also known as the Steel Tube Slab (STS) structure, has been proposed [22]. STS design considerably improves the transverse load-carrying capacity of the traditional pipe-roofing system by inclusion of high strength transverse bolts and flange plates between the tubes. Such a system is attractive as it can avoid the use of temporary support during excavation.
In the current study, the application of the proposed method in the design and construction of Northeastern Street station of line 10 of the Shenyang Subway is then thoroughly discussed. Data from monitoring stations in the construction site are presented and compared with the results of the numerical simulations. The effect excavation process on ground settlement, deformation of STS structure and bridge pile are studied; moreover the key parameter such as welding of flanges and the step length are investigated by conducting a suite of numerical simulations.

2. Support Structures in Underground Excavations

Different types of supporting structures have so far been used to control the soil movement during underground excavations. These methods are briefly discussed in the following sections.

2.1. Pile, Beam and Arch (PBA) Method

The concept of the traditional Pile, Beam and Arch (PBA) method is to develop a supporting structure in underground excavations to control soil movements and ground settlements. In this method, as shown in Figure 1, pilot tunnels are first constructed to obtain access for manual-excavation and pile construction. The top of the piles is then attached by a cap beam. The soil is then excavated by bench method to form arches whose ends are braced against the cap beams. The soil is then excavated in a top-down approach and medium level floors are built as necessary. Finally, the bottom floor is constructed after the last layer of the soil is excavated. The PBA method is very effective and has been used in many projects in the past [23,24].

2.2. The Traditional Pipe Roofing Structure

Another approach used for underground supporting system is traditional pipe roofing method. In this technique, adjacent steel tubes are connected by interlock to form the pipe roofing structure, and then temporary supports are established while the soil below the pipe roofing is excavated. Previous applications of this method show that it is effective in reducing surface deformation [25,26]. However, in this technique, adjacent steel tubes are only connected by interlock, resulting in low lateral stiffness of the pipe-roof structure. As a result, other temporary supports must be established to maintain the stability of the whole structure when the soil is excavated, increasing the construction complexity and cost, as shown in Figure 2.

2.3. The Proposed Supporting Structure

In this section, a new technique for underground excavations supporting system is presented. The technique proposed is based on the STS method, however, unlike the traditional pipe roofing method, it is proposed that the adjacent steel tubes are connected by flange plate, bolt and concrete [27], as shown in Figure 3. This will significantly increase the lateral stiffness and bearing capacity of the pipe roofing system. Therefore, the need for other temporary supports during excavation is circumvented, which shortens the construction period, reduces the complexity of the construction and increase the safety during construction. As will be shown in the remainder of this paper, the proposed technique is superior to the standard PBA and the traditional pipe roofing methods, particularly in large span and ultra-shallow underground excavations.
As for this new supporting structure, the authors have comprehensively investigated the performance of the new STS structure and the effect of different parameters on its stiffness and limit load using both numerical and experimental techniques. The results of these investigations will not be repeated here. Interested readers are referred to the authors [22,28,29] for more details.

3. A Case Study of the Application of Proposed Support System

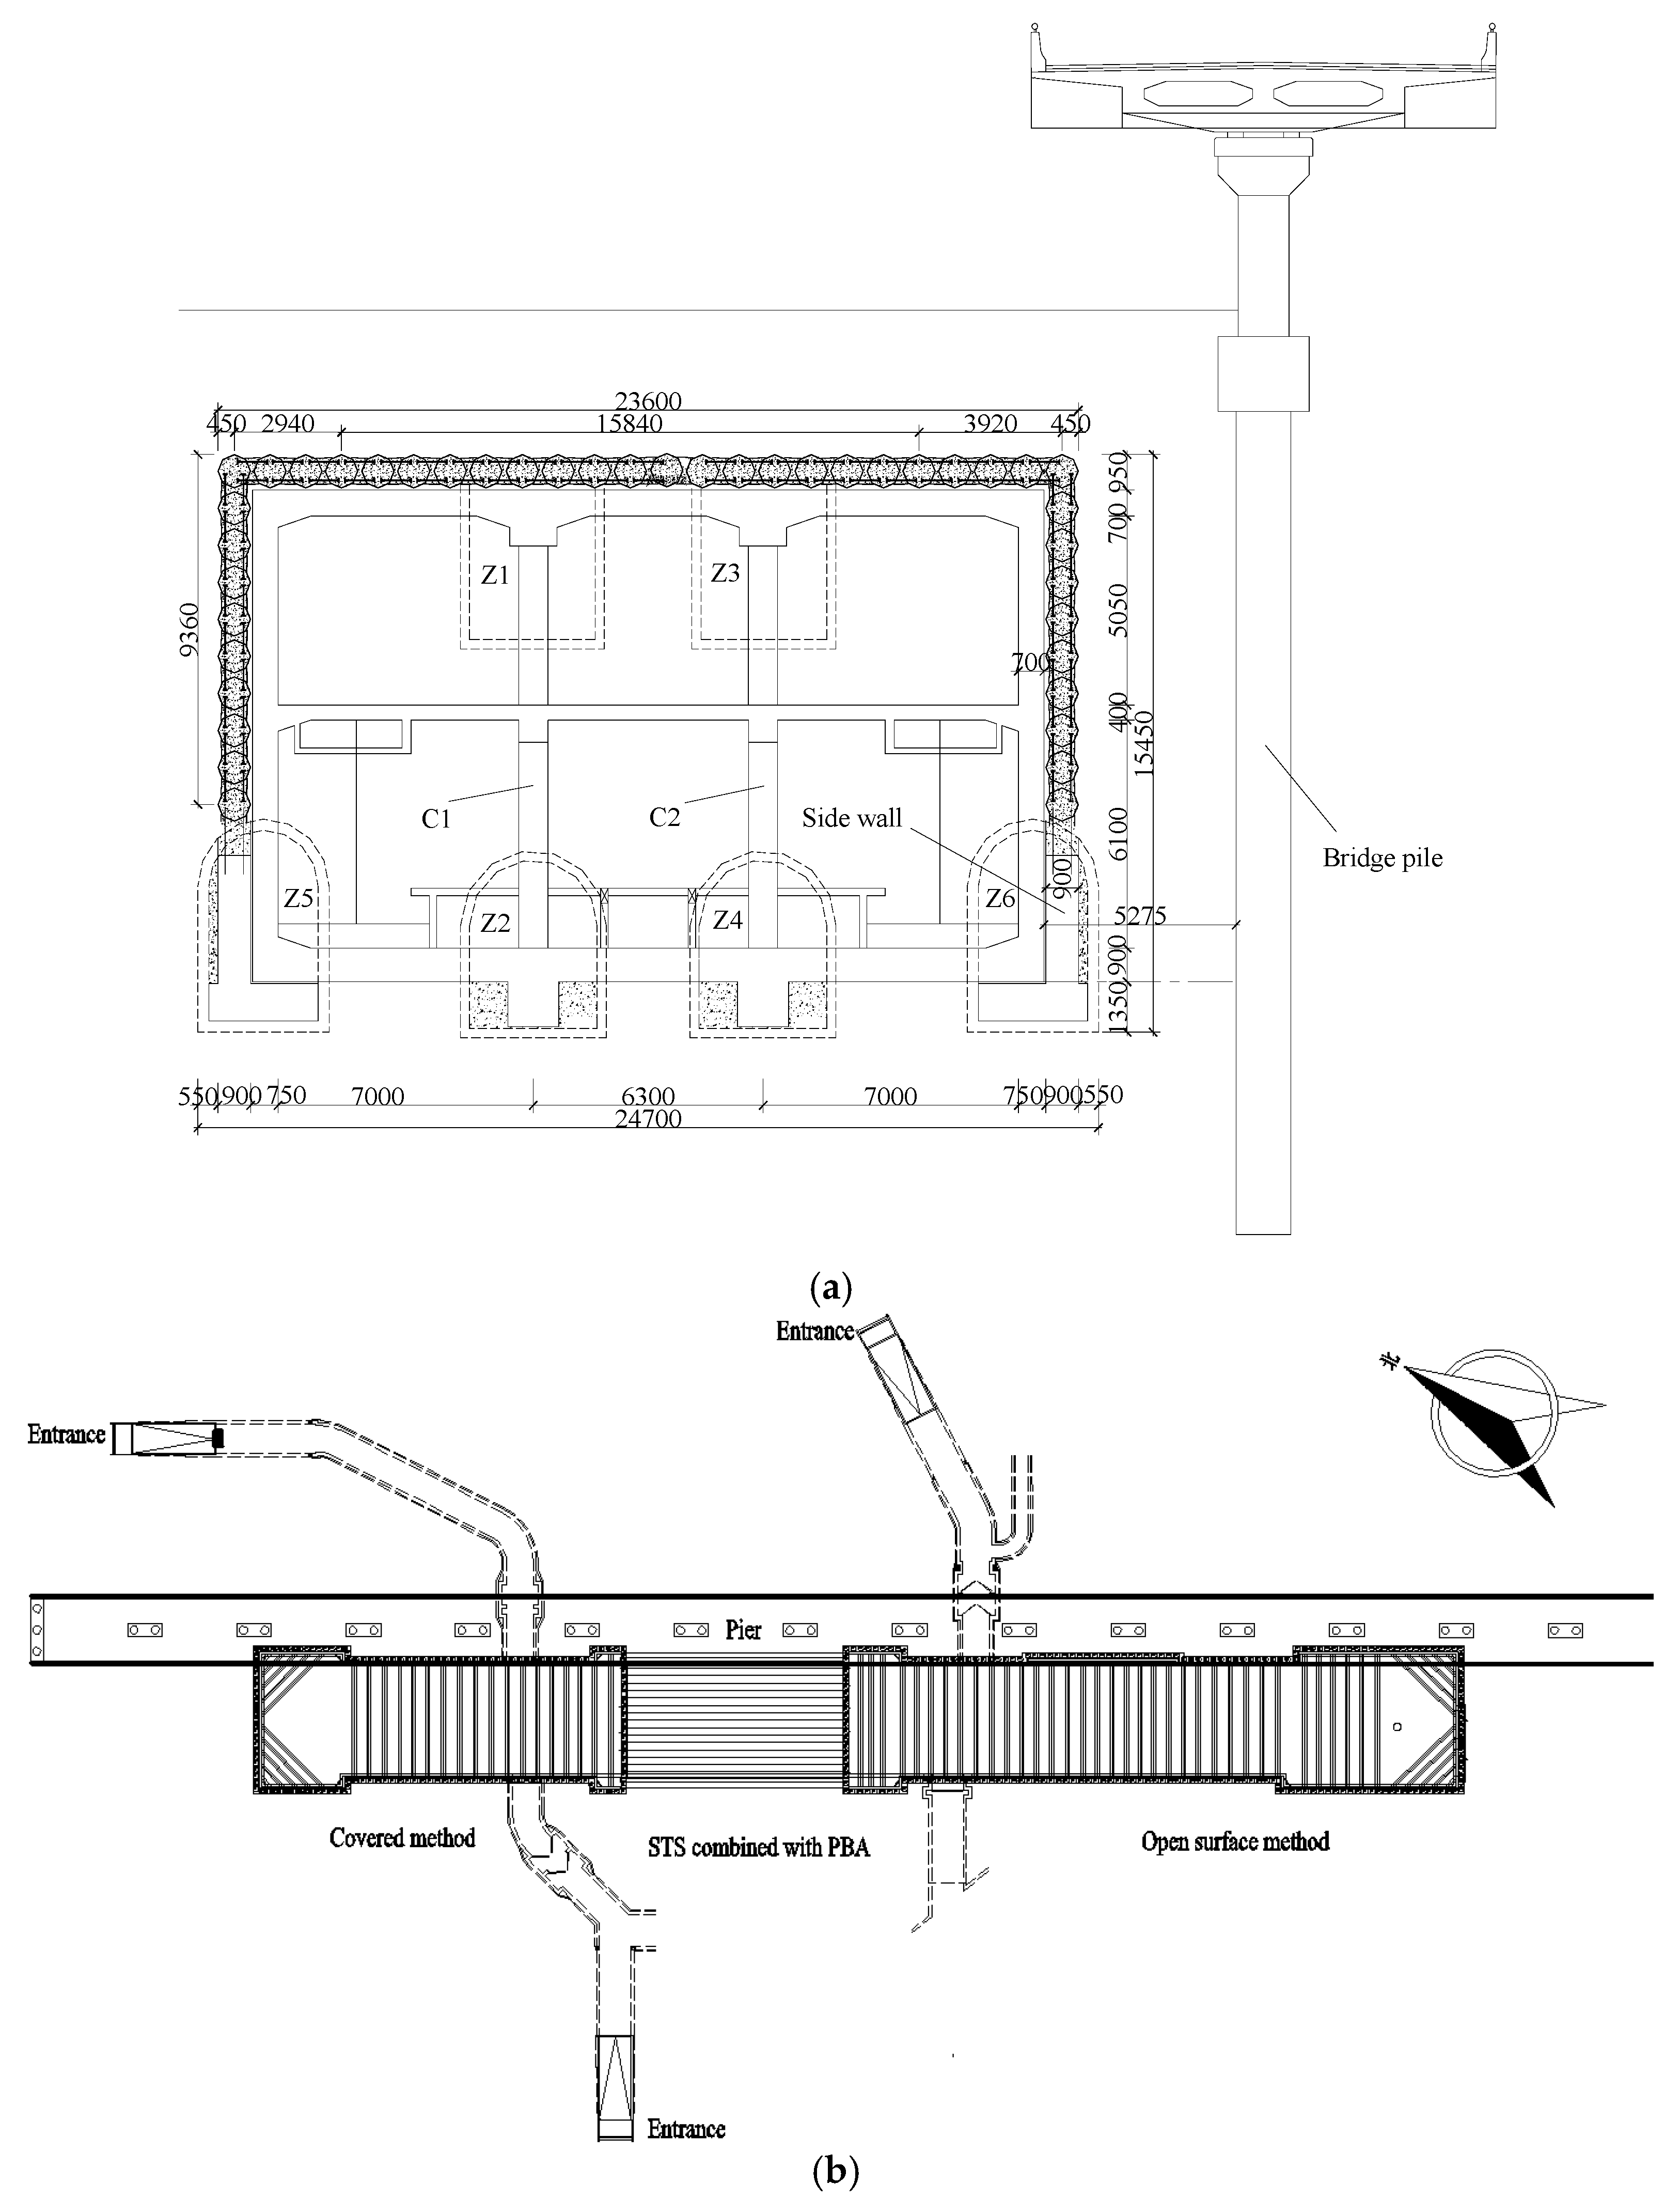
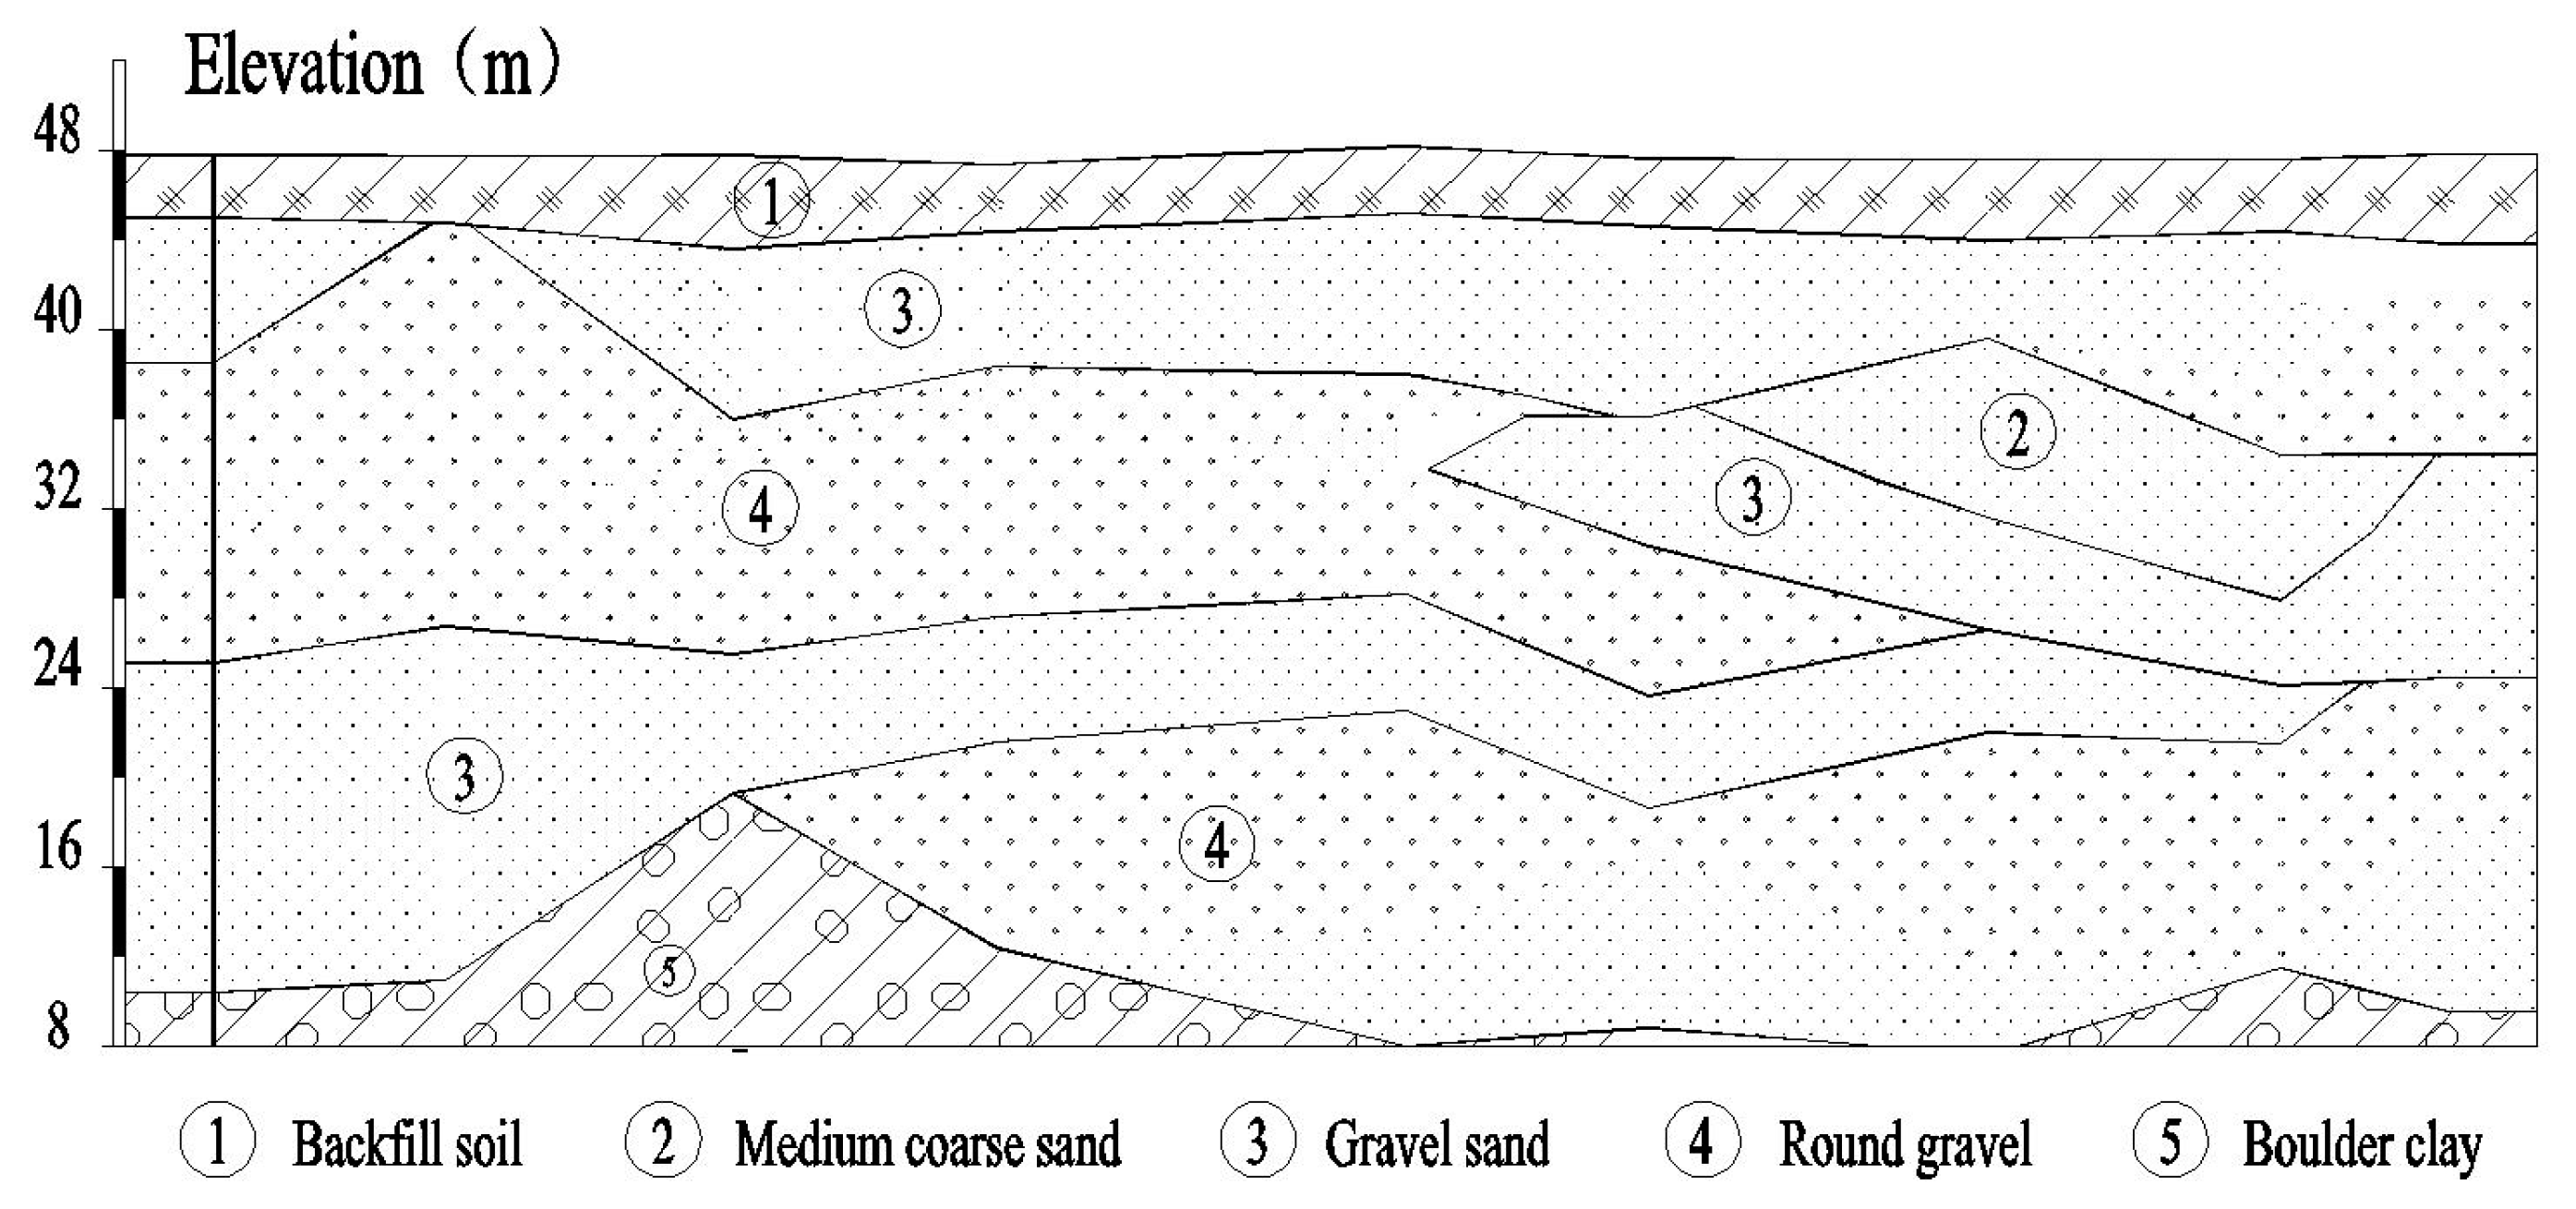
3.1. Engineering Overview

While several stations of the Shenyang subway (line 10) are constructed using the traditional PBA method, for the construction of the Northeastern Street station (located west of the intersection of Beihai street and Northeastern Road) the traditional PBA method could not be used due to the complexity of the existing structures close to the station, and the heavy traffic load that had to be handled during the excavation. As a result, with considerations based on geographical location and geologic situation of the subway station, it was decided to use a combination of STS and PBA methods, as discussed in the previous section, for the design and the construction of the station.
The total length and standard cross section of the subway station is 225.95 m and 24.7 m, respectively. And the buried depth of the bottom floor of the platform layer is approximate 17.5 m, with an overburden layer of about 3.4 m thick. For the construction, the station is divided into three sections: north of the station for which covered excavation is used; south of the station for which open surface method is adopted; and the middle section of the station for which a combination of STS and PBA methods is adopted due to the intensity of the surrounding structures and heavy surface traffic load. The length of the southern, middle, and the northern segments of the station are 68.65 m, 114.4 m, 42.9 m, respectively. The engineering details of the Northeastern Street station is shown in Figure 4.
The soil stratigraphy at the station location was determined from geological and geotechnical investigations. Accordingly, the soil deposit can be divided into five layers based on the mechanical properties and formation lithology, as shown in Figure 5. And depth of the water table is from 5.2 m to 14.9 m in the construction area. In order to get the strength parameters of sandy soils, a series of super heavy Dynamic cone Penetration test (DPSH) were performed, as shown in Table 1.

3.2. Structural Elements

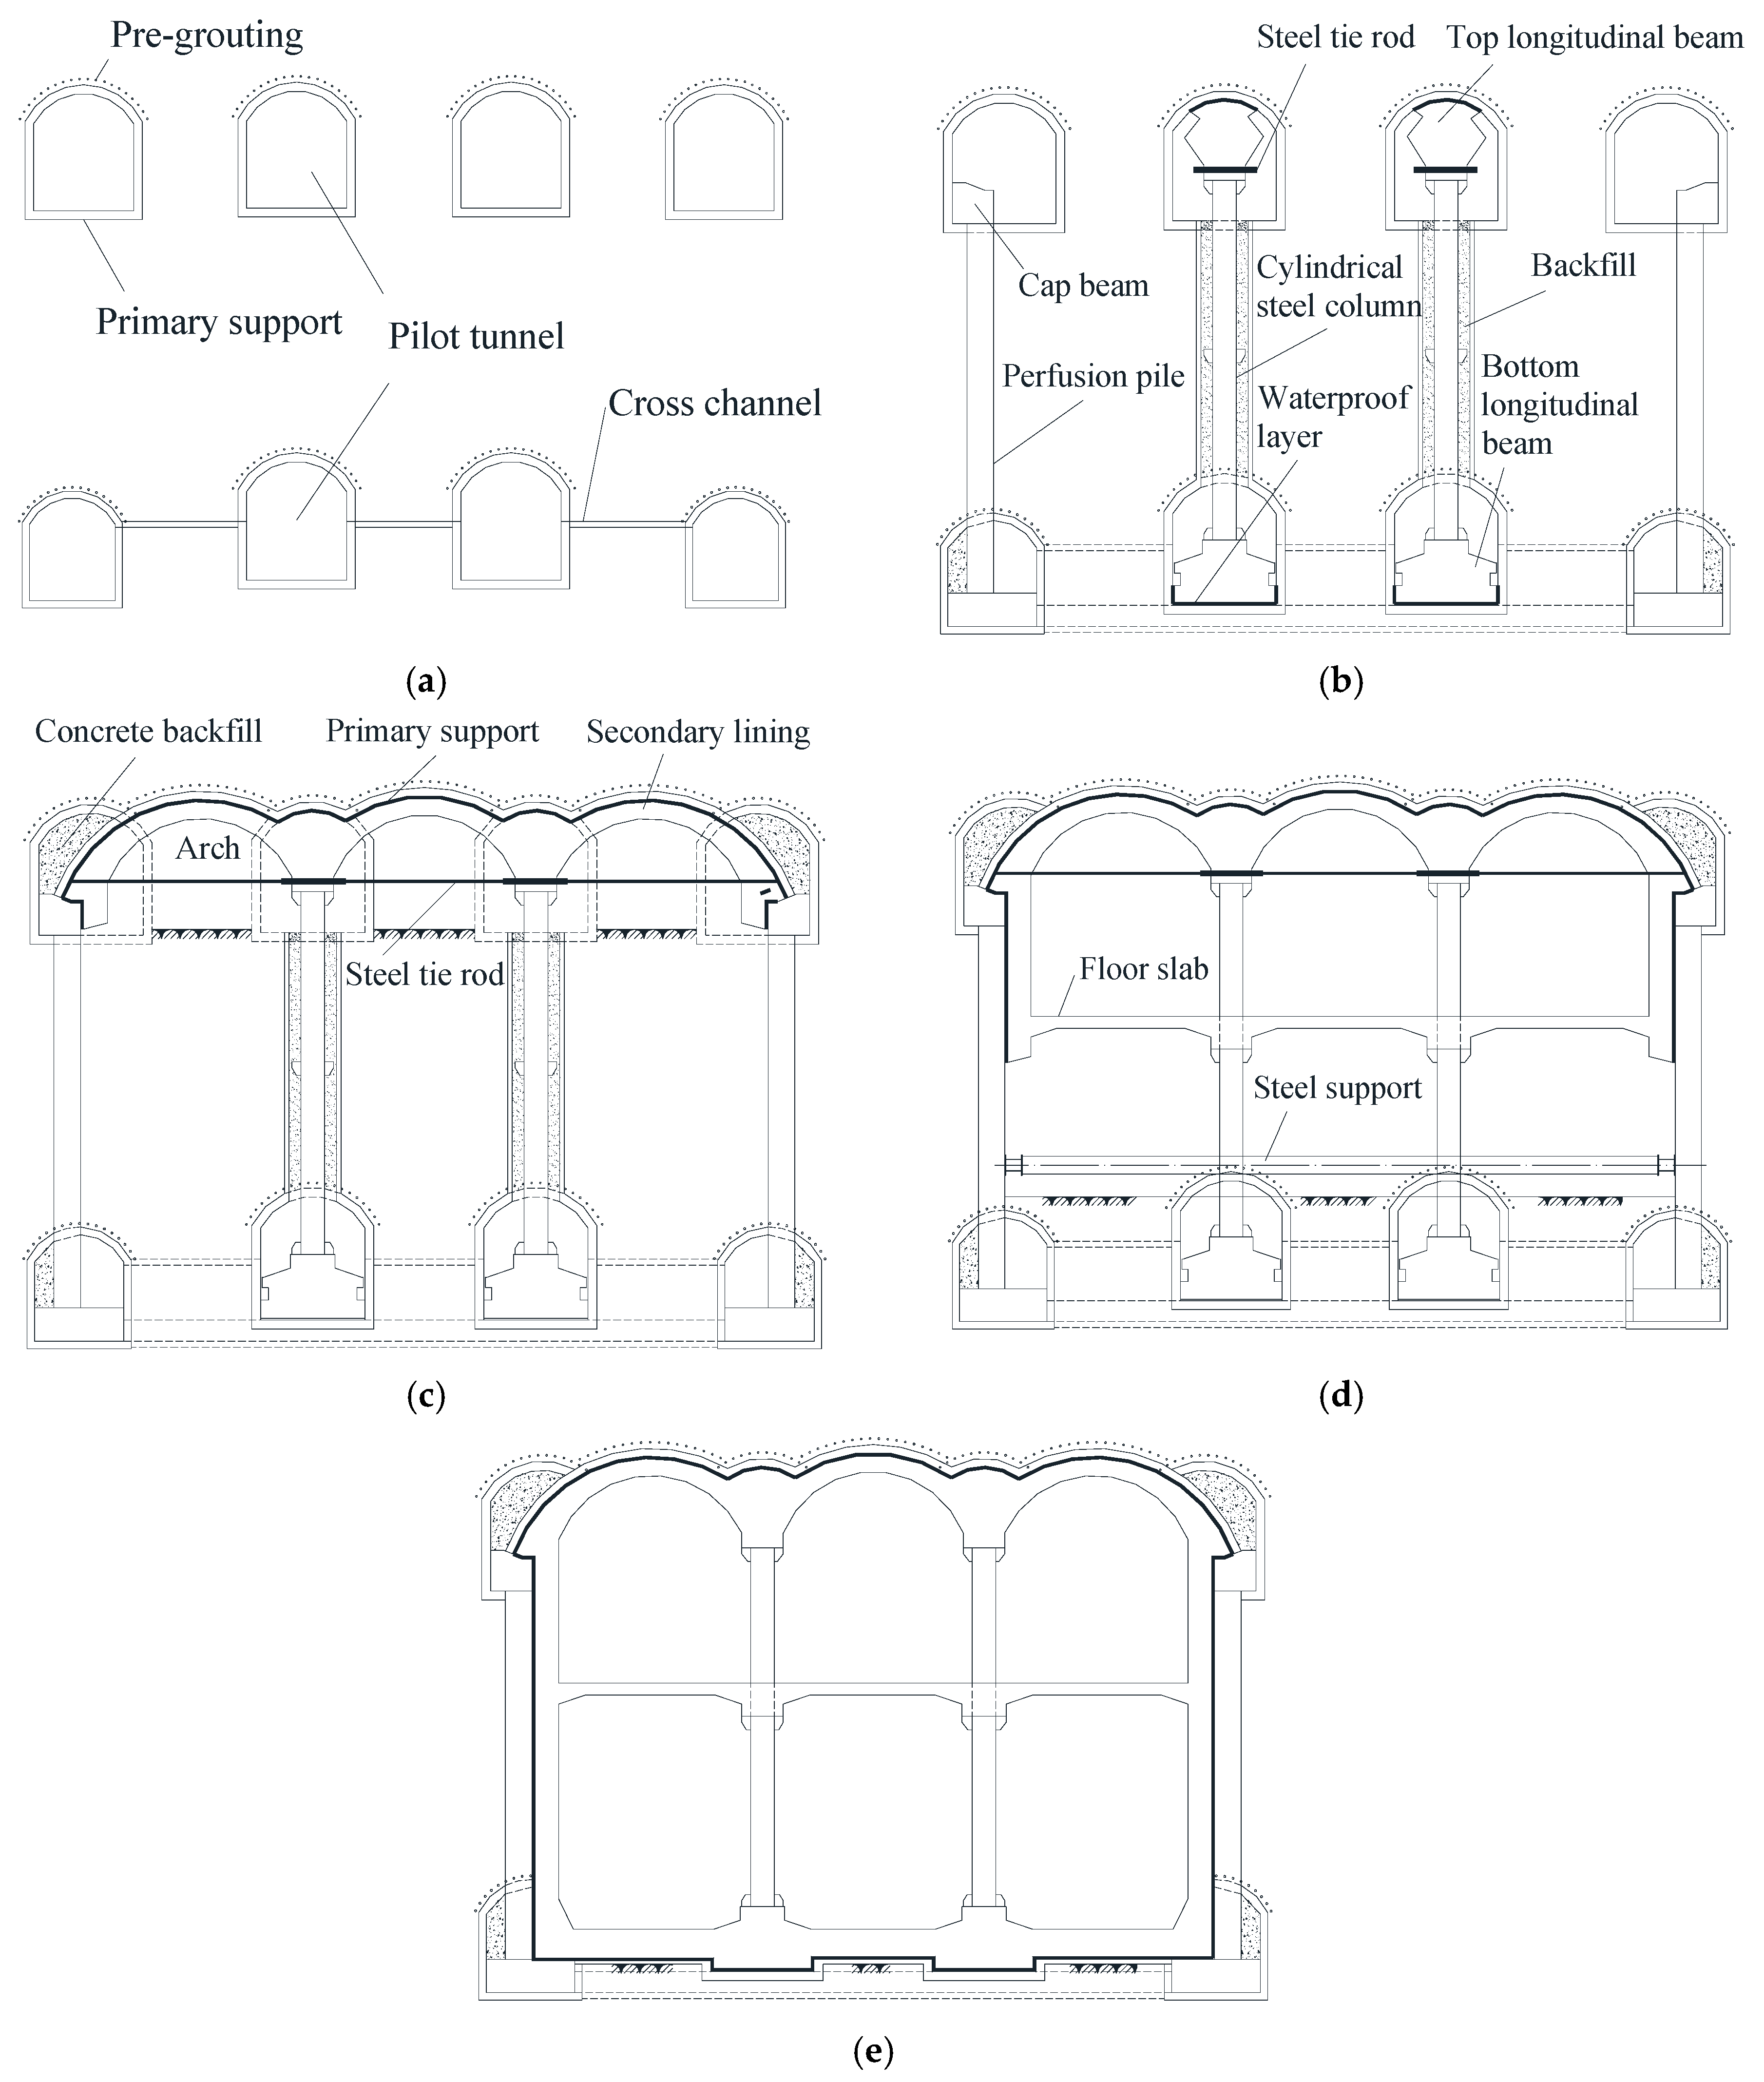
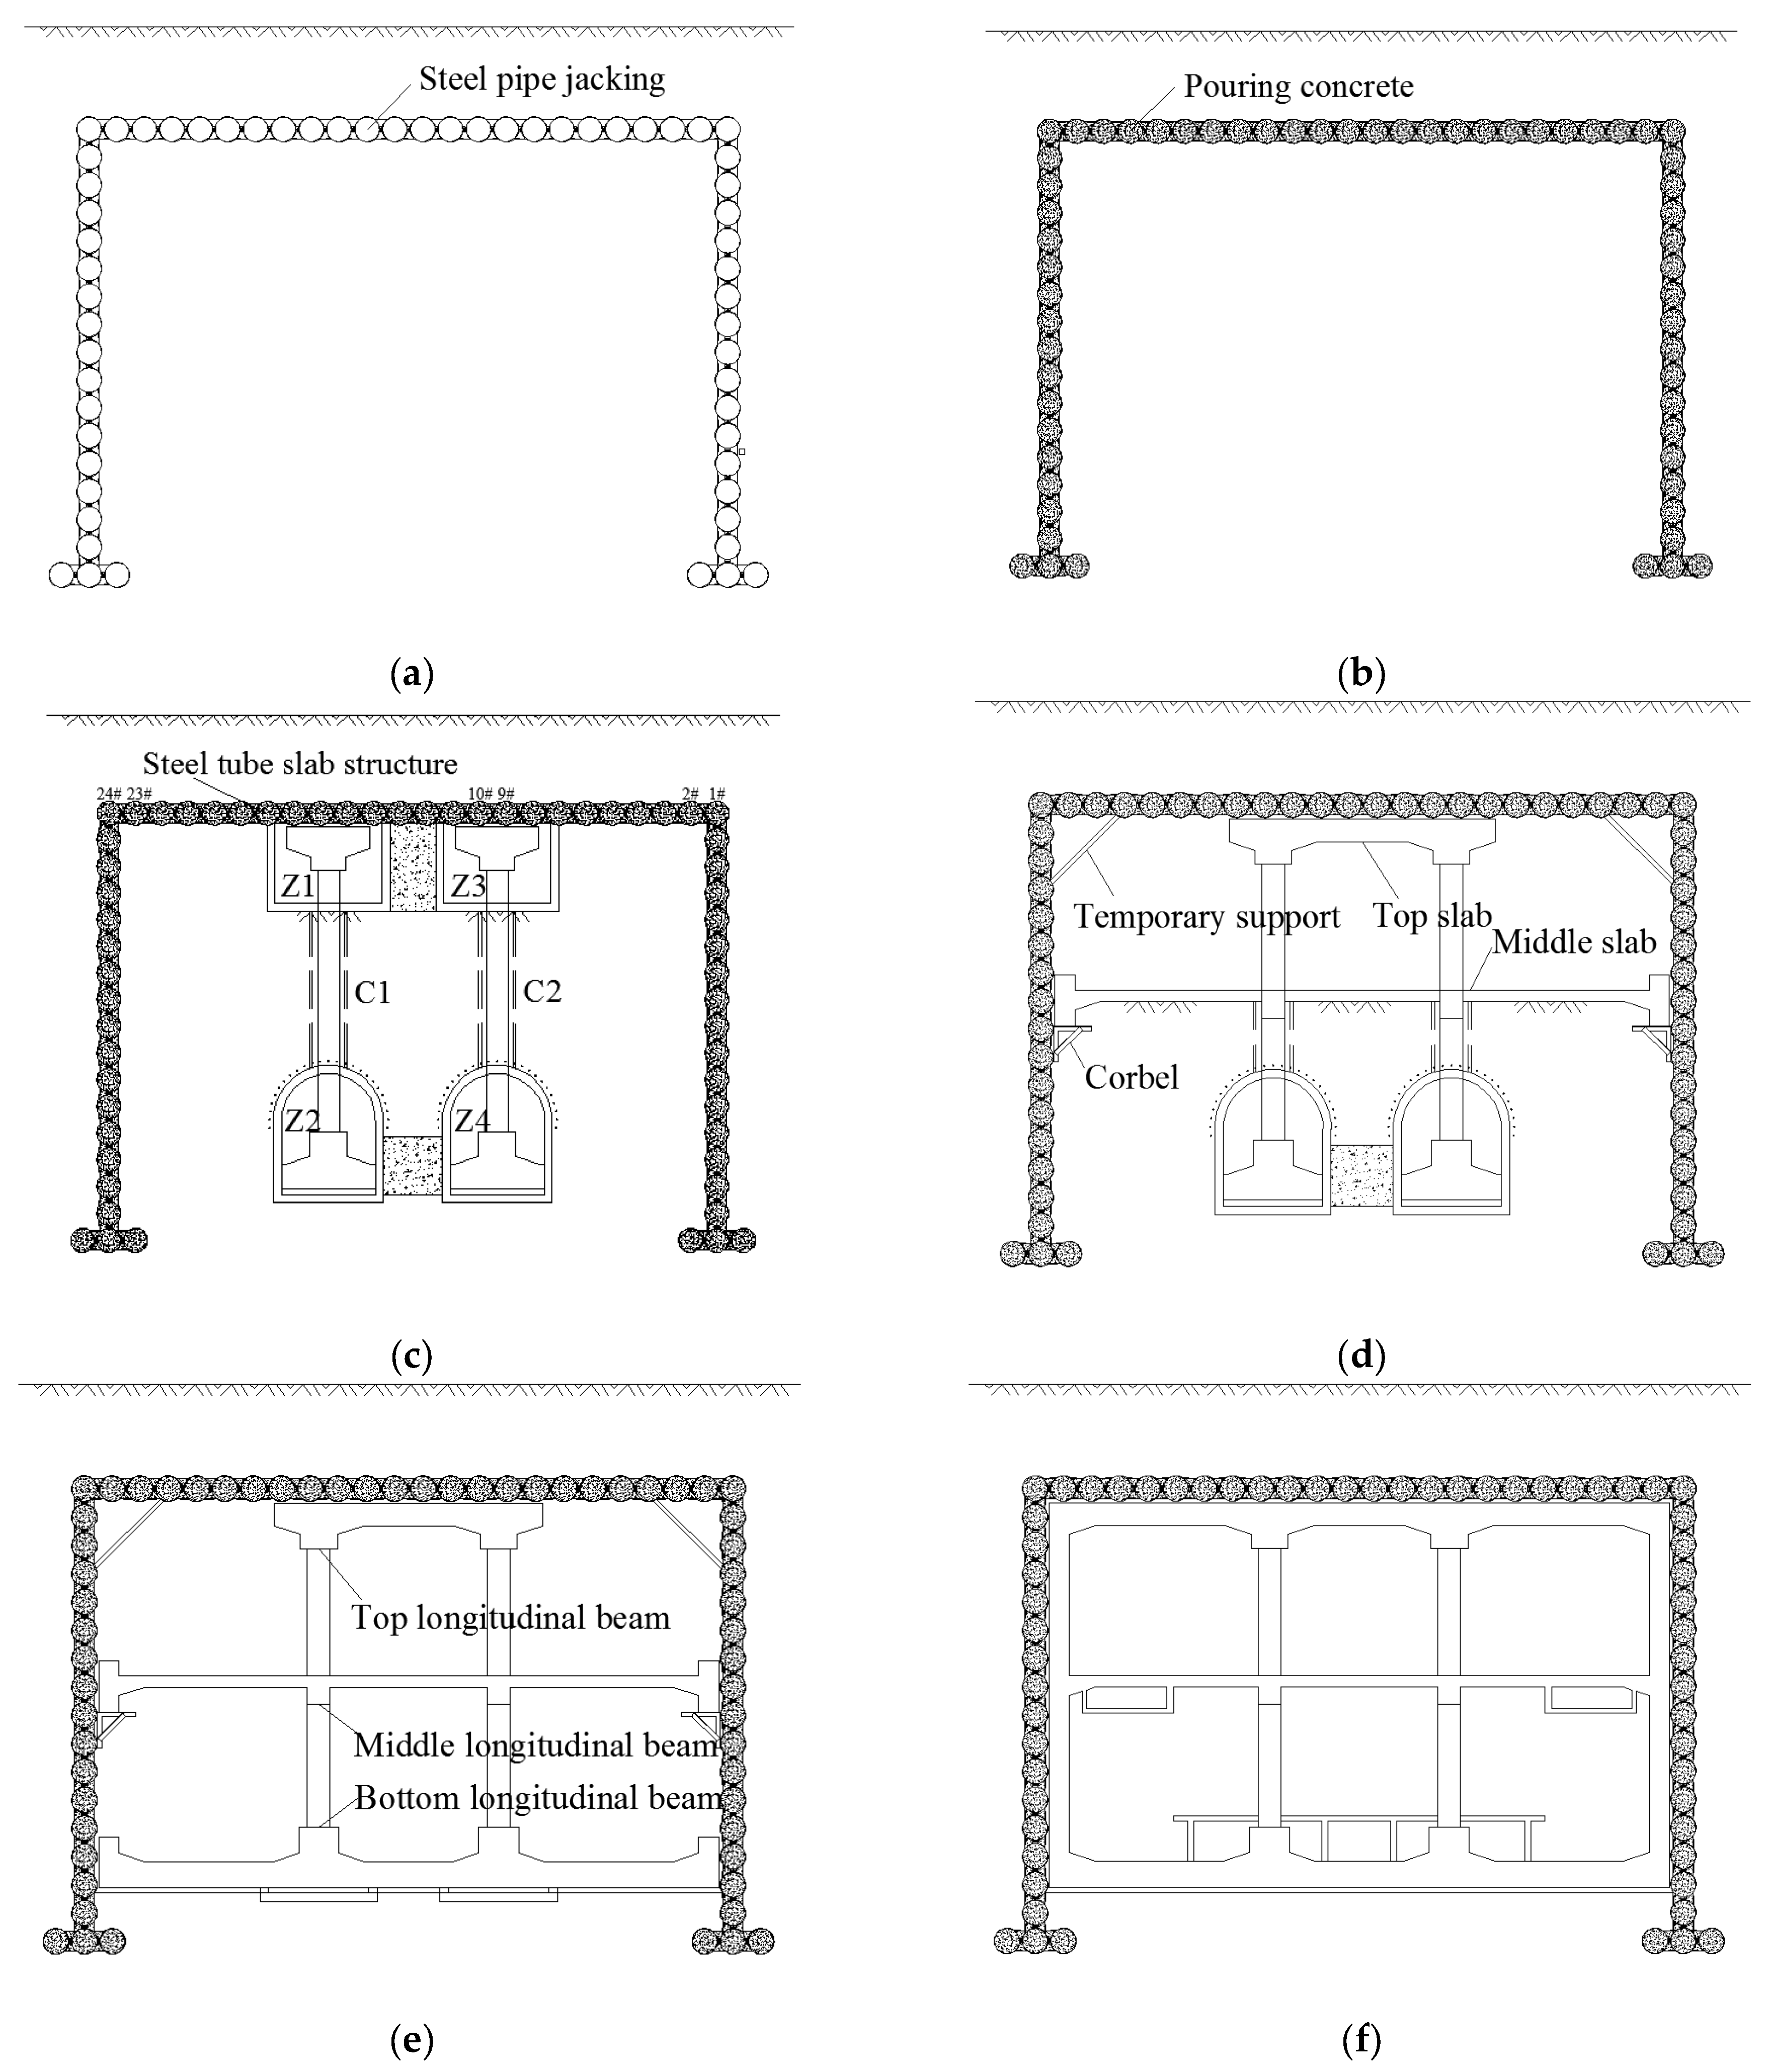
3.2.1. Construction Process of the Support Structure

Several steps are involved in the construction of the proposed supporting structure based on combination of STS and PBA methods. These steps are demonstrated in details in Figure 6.
(1) The steel tubes are pushed into the soil by the jacking machine, and then the soil inside the steel tubes are extracted using horizontal directional drilling (Figure 6a).
(2) Lateral connecting bolts are installed between adjacent steel tubes by artificial operations. Blocking plate at both ends of the steel tubes are then installed, and concrete is poured through grouting holes on the blocking plates (Figure 6b).
(3) The top pilot tunnels (Z1) and bottom pilot tunnel (Z2) are then excavated, respectively. Then the cylindrical steel column (C1) is constructed. Then do the right parts (Z3, Z4 and C2) (Figure 6c).
(4) The inter grid of the top pilot tunnels is removed, and the waterproof layer at the top and the middle floor slab are constructed. When the strength of the floor slab reaches to the 80% of the design strength, the soil above the middle floor slab is excavated for the whole cross section of the station, followed by the construction of the middle longitudinal beams and side walls (Figure 6d).
(5) When the strength of the middle floor slabs and side walls of the station hall reach up to 80% of the design values, the soil from the middle span to the bottom slab is excavated. Followed by the construction of the waterproof layer and the bottom slab (Figure 6e).
(6) The rest of side walls and waterproof layers of top slabs are constructed to complete the construction of the subway station (Figure 6).
The characteristics of this construction method combining STS and PBA methods are as follows:
(1) The support structure can be designed to have adequate bearing capacity to provide support for the overburden pressure when soil below the structure is excavated. So other temporary supports may not be required resulting in a flexibility of the method and potential for wide applications.
(2) Not only can the proposed supporting system effectively control the soil surface deformation, but also the intensive temporary supports during excavation stage can be avoided owing to support provided by the cylindrical columns involved in the proposed technique.
(3) The proposed method results in a rectangular cross section for the excavated area, which increases the utilization of the underground space compared to the traditional arch formation.

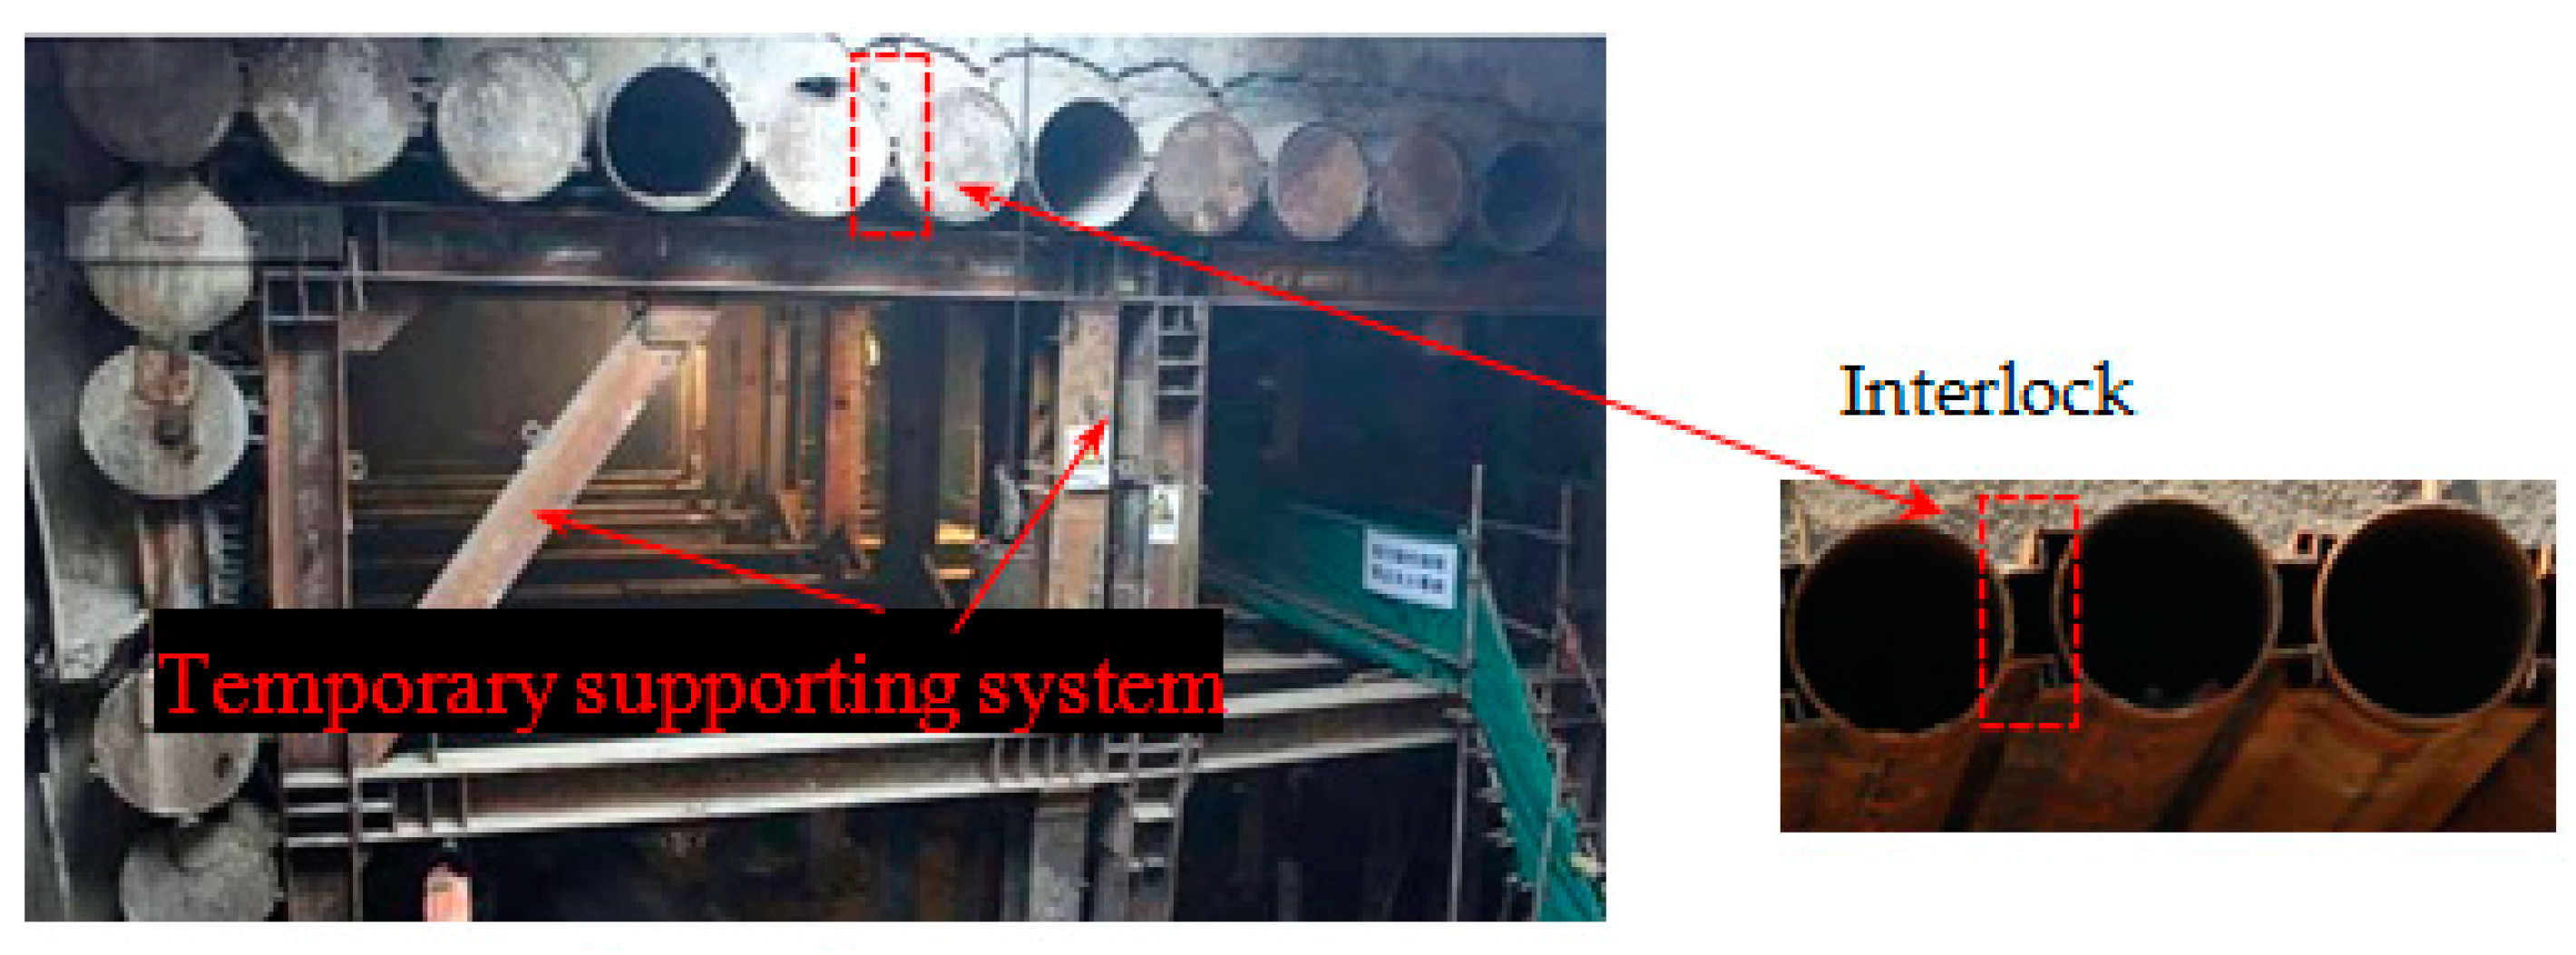
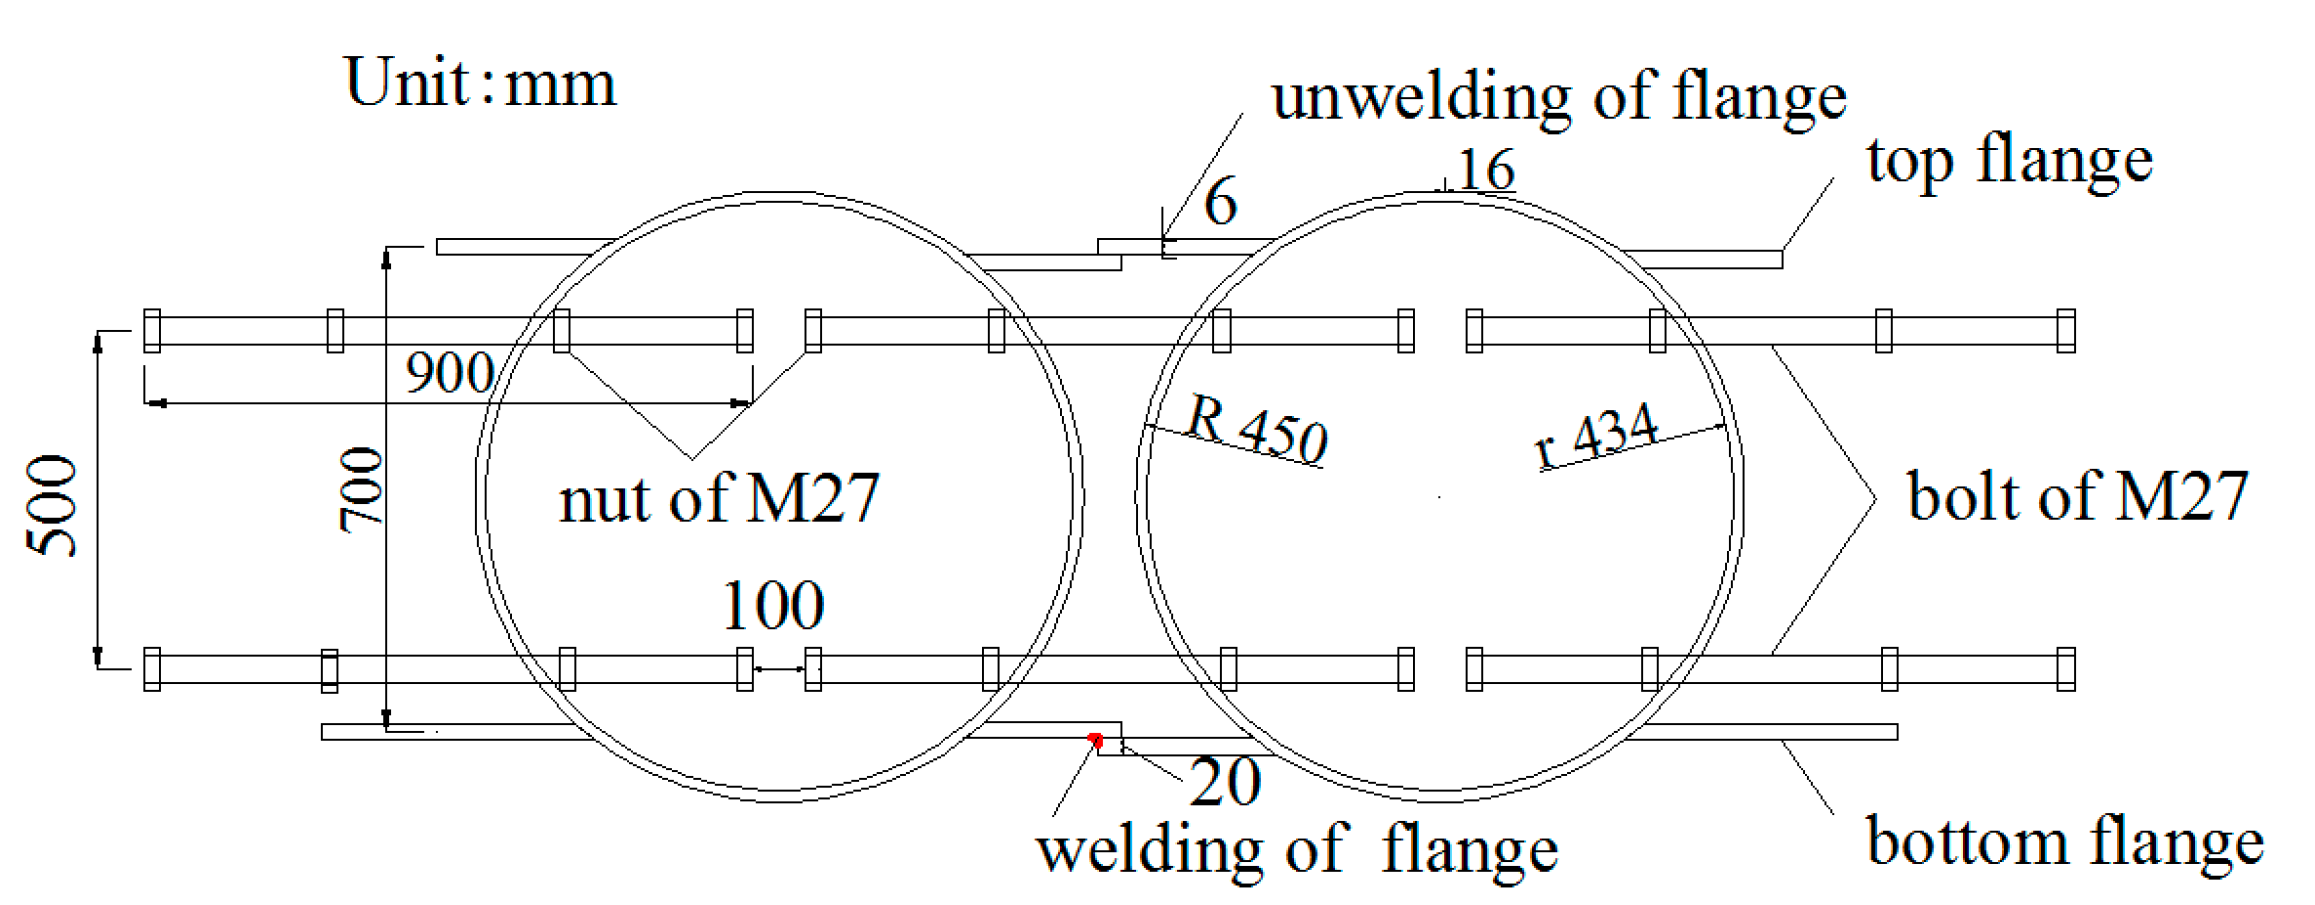
3.2.2. Connection of Adjacent Steel Tube

For the Northeastern Street station, the design specifications required the outer diameter and the thickness of the steel tubes of 0.9 m and 16 mm, respectively, and the center distance between two adjacent steel tubes of 1.0 m. Adjacent steel tubes are connected by horizontal straight bolts with a diameter of 32.0 mm, bottom flanges with a width of 200 mm and a thickness of 22 mm, and concrete with a strength grade of C30. There are two rows of horizontal bolts (top and bottom) which are 0.15 m apart in the longitudinal direction. The adjacent overlapped flanges are welded, and concrete is poured in the steel tubes, and in the space between them. Connection of adjacent steel tubes is shown in Figure 7.

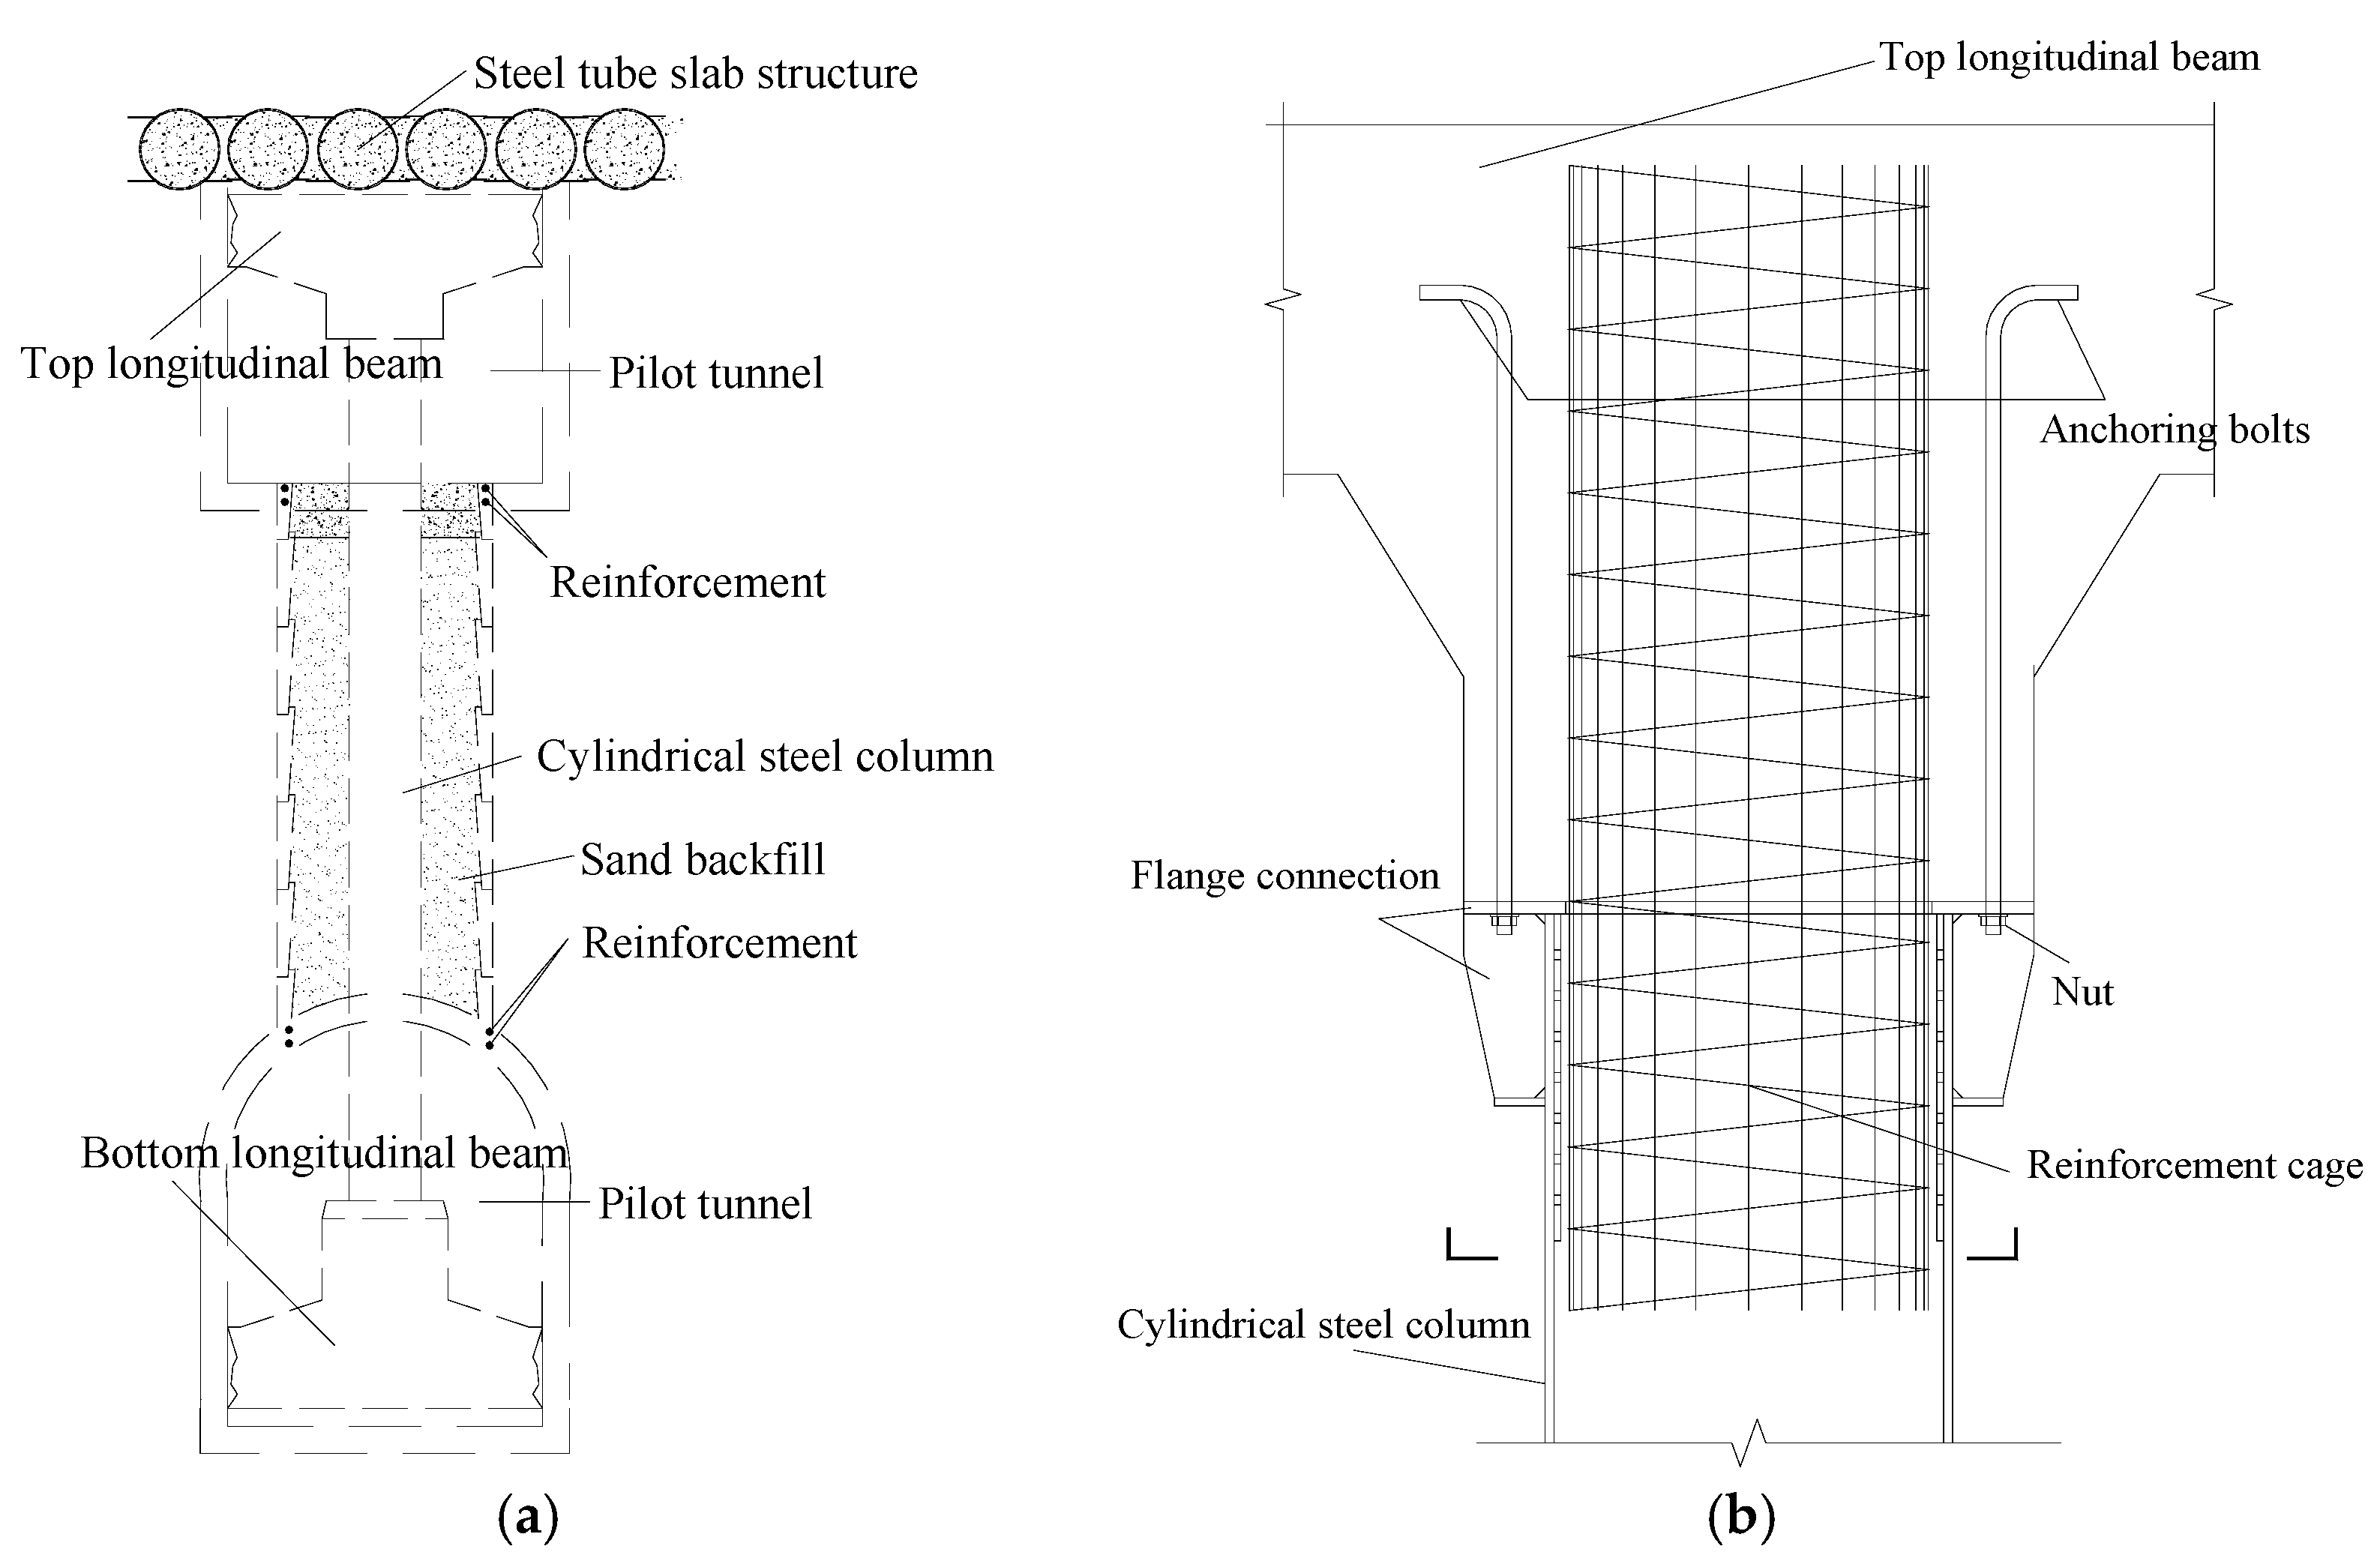
3.2.3. Connection between Cylindrical Steel Columns and Longitudinal Beams

The bottom and top longitudinal beams are made of C40 concrete, which are directly poured in place, in connection with the cylindrical steel columns. Sand is poured into the space between the cylindrical steel columns and the surrounding soil to increase the stability of the cylindrical steel columns (see Figure 8a). The cylindrical steel columns and longitudinal beams are connected by a reinforcement cage, which is adopted in the cylindrical columns. Furthermore, flanges are used to provide further strength in the connection between longitudinal beam and cylindrical column, as shown in Figure 8b. Besides, anchoring bolts are lengthened and bent at the ends to increase anchorage force.

4. In-Situ Monitoring

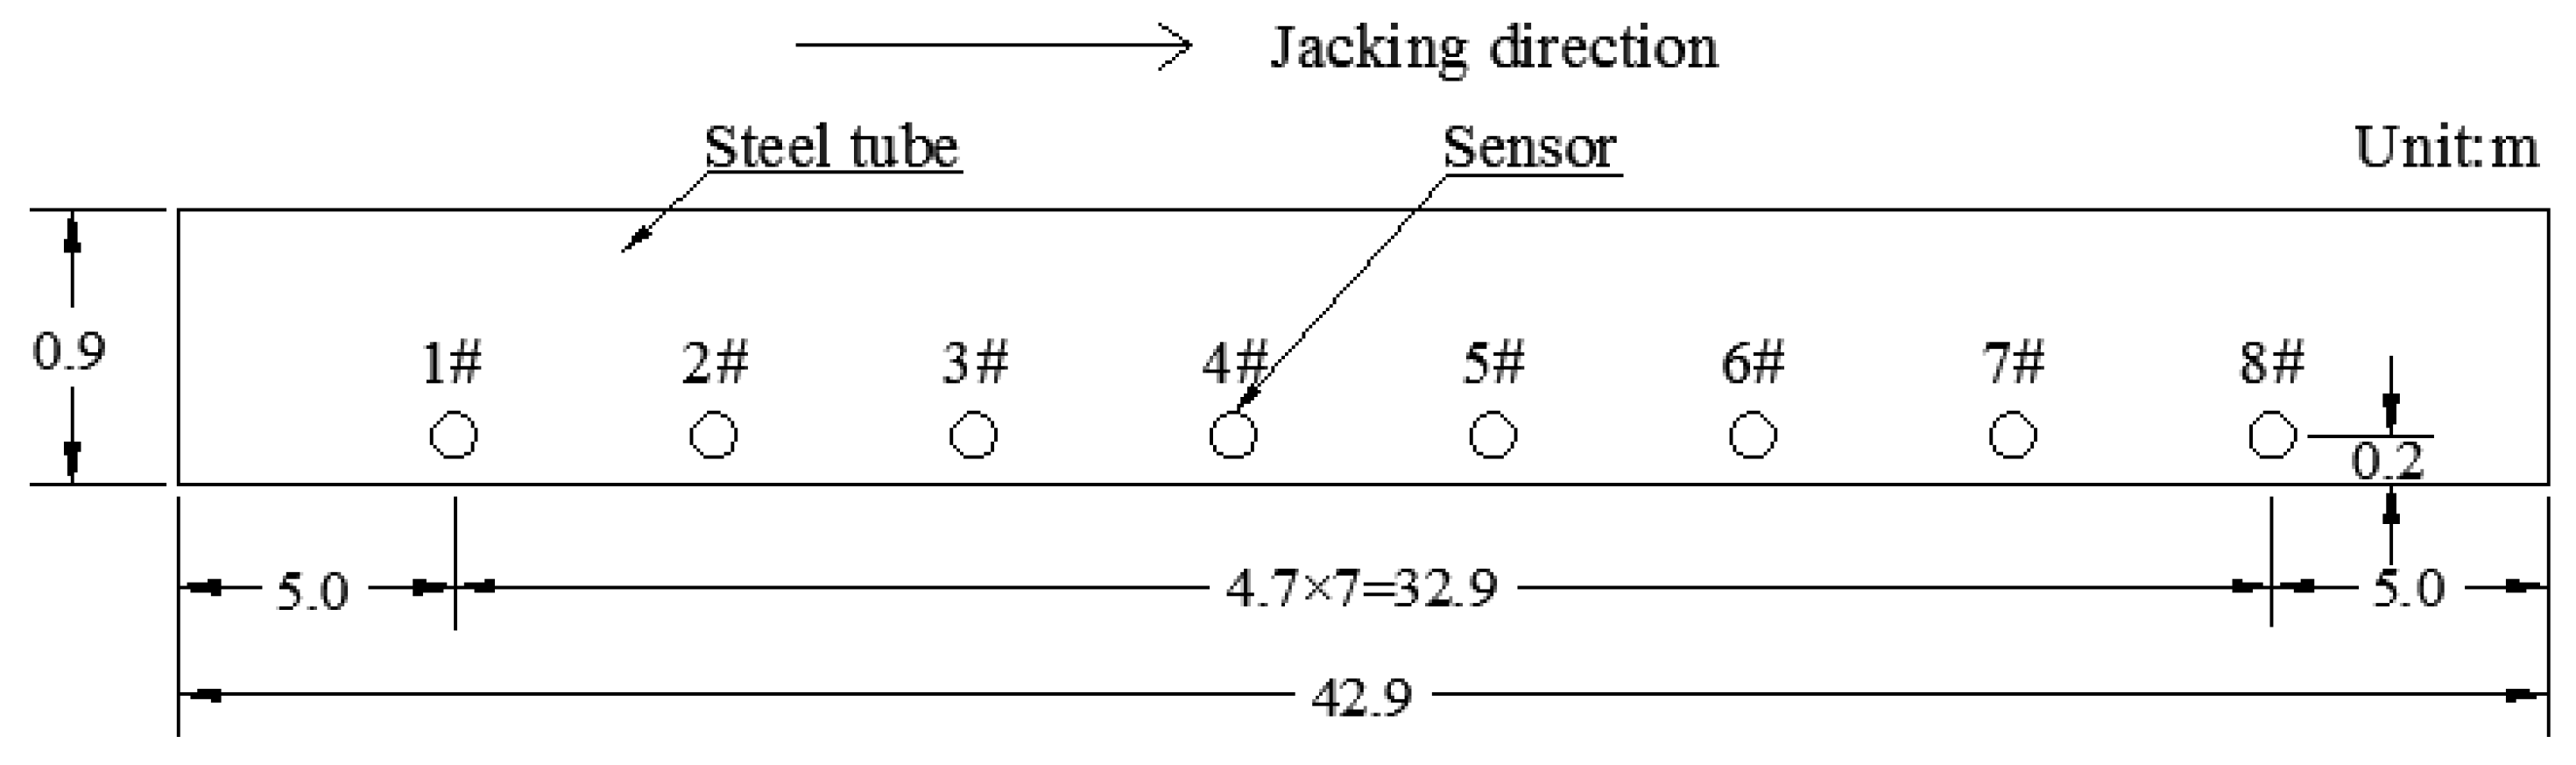
4.1. Strain of Steel Tube

4.1.1. Monitoring Scheme

JTM-V5000c strain meter made by Jiangsu gold civil construction group, China were used to monitor strain of steel tubes. The working range of the sensors is from 1200 με to 800 με, with the accuracy of 0.1 με. The dates were collected by a digital auto-reading instrument of DH3816N made by Donghua instrument group, China, and the stress values are calculated by the existing computing parameters. The installation of strain meter is shown in Figure 9.
Considering circumferential strain meters merely measure the chord length corresponding to a circular arc of inner wall of steel tubes, in order to analyze the measurement error of circumferential strain, the feasibility and accuracy of monitoring schedule is investigated. Based on the installation in Figure 10, the chord length and in corresponding to ach length are D and l, respectively, and central angle and the inner radius are 2α and r. In the jacking stage, the strain of chord length is εD, and the circumferential deformation and strain are Δl and εr. So, the relative error is calculated based on the Formula 1 [30].
α = arcsin ( D / 2 r ) l = 2 r arcsin ( D / 2 ) ε r = Δ l   l = 2 r arcsin [ D ( 1 + ε D ) / 2 r ] 2 r arcsin ( D / 2 r ) 1 ξ = ε r ε D ε D × 100 %
Based on the results of in-situ monitoring results, the monitoring values are within the limits of safety values. Applying the length of strain meter, inner diameter of steel tube and the monitoring value of strain meter to the Formula (1), the relative error between the linear strain monitored by strain meter and the circumferential strain of steel tube is 0.215%, and it is permitted. It is therefore reasonable for the installation to monitor the circumferential stain.
In order to study the force behavior and the force differences between different jacking distance in the jacking construction, the two monitoring sections A and B are arranged in Steel tube 5#, and the distance from the initial end are 9 m and 15 m, respectively. Four monitoring points are prepared in every section, and each point is installed two strain meters, one longitudinal direction and one circumferential direction. The point above the steel tube is defined as 1#, and the others point are defined as 2#, 3# and 4# according to a clockwise direction, as shown in Figure 11.

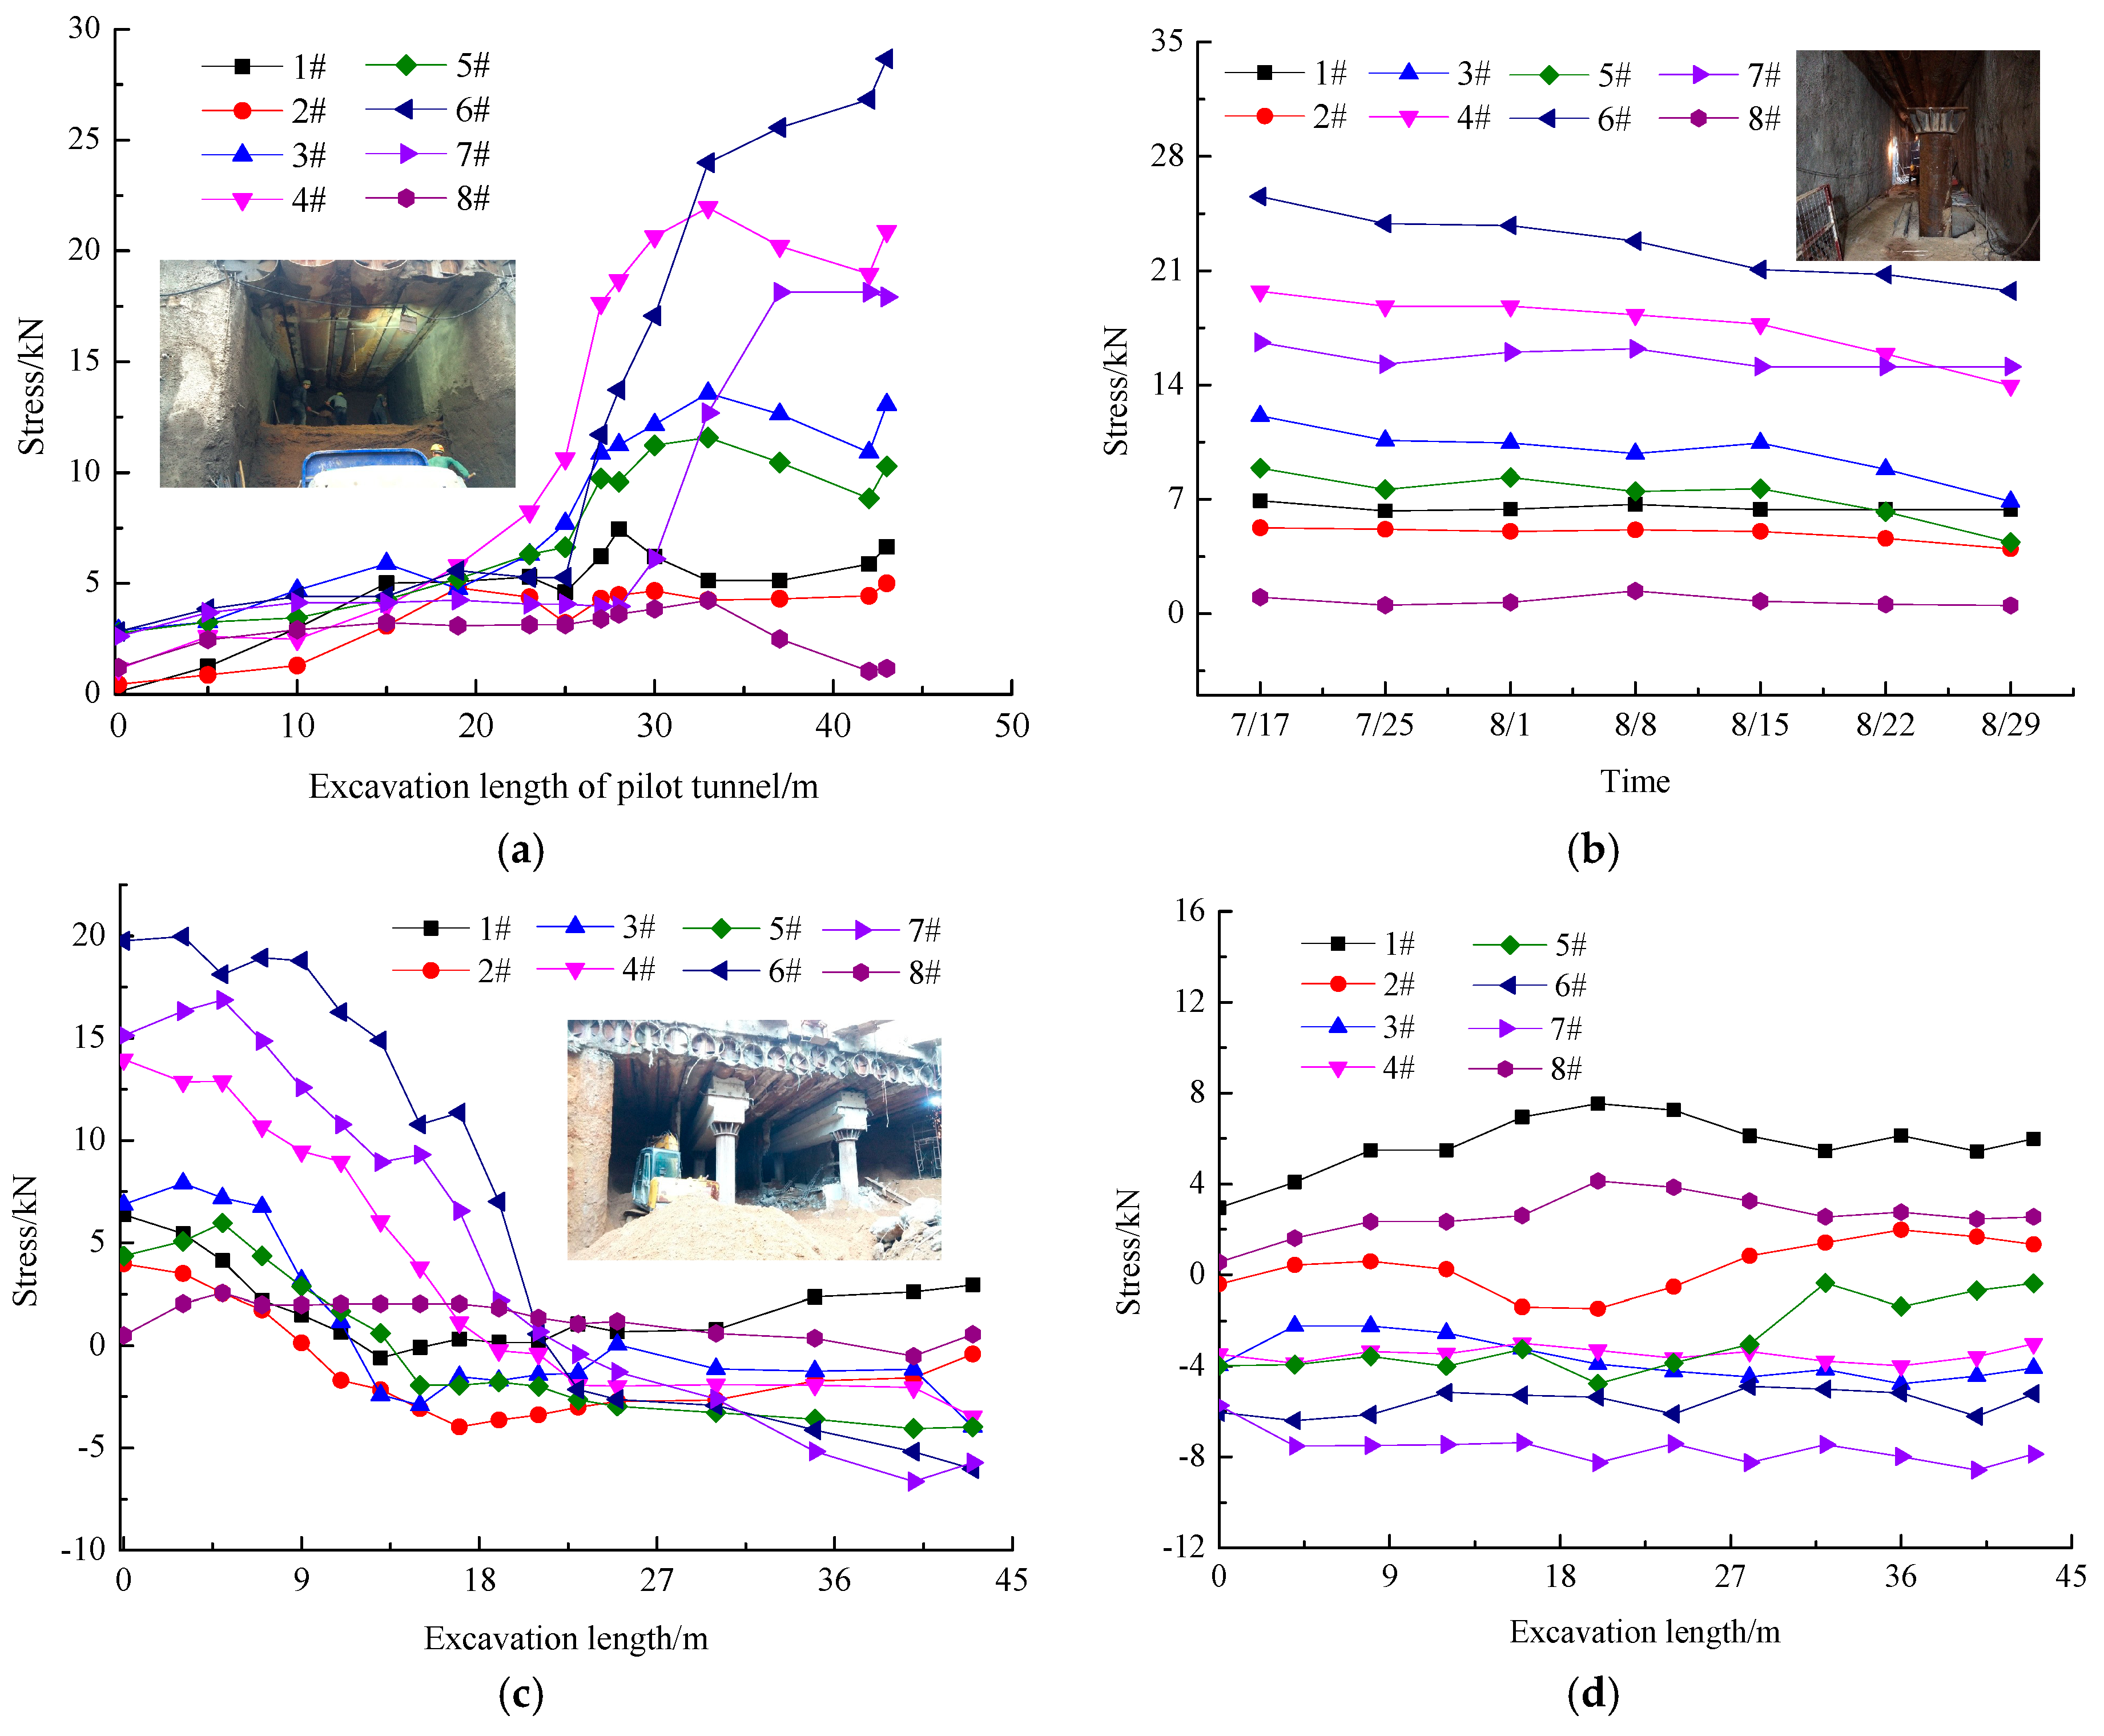
4.1.2. Relationship between Stress and Jacking Distance

Based on the monitoring results, the strain of steel tube is elastic in the jacking stage. So the relationship between the stress and strain is defined in the elasticity stage based on the Hooke law, as shown in Formula (2) [31].
ε x = 1 E [ σ x ν ( σ y + σ z ) ] ε y = 1 E [ σ y ν ( σ x + σ z ) ] ε z = 1 E [ σ z ν ( σ x + σ y ) ]
However, the force mechanism is attributed to plane stress problem, σz = 0, as shown in Formula (3) [31].
ε x = 1 E ( σ x ν σ y ) ε y = 1 E ( σ y ν σ x )
The formula can be transformed into another form, as shown in Formula (4)
σ x = 1 1 ν 2   ( ε x + μ ε y ) σ y = 1 1 ν 2 ( ε y + μ ε x )
where, E is the elasticity modulus of steel tube; νis the poisson ratio; σx, σy and σz are the longitudinal strain, the circumferential strain and the radius strain, respectively.
Based on the in-situ monitoring data, the longitudinal and circumferential stain (εx and εy) is obtained, and the stress values with the two direction are required using Formula (4).
The longitudinal and circumferential stress are shown in Figure 12 and Figure 13, along with the increase of the jacking distance in the construction stage. Based on the monitoring results, the stress trend of section A is similar to section B. The results are thus analyzed according to section A. As point 3 is damaged in the construction stage, it is not analyzed.

Longitudinal Stress of Steel Tube at Section A

The longitudinal stress is shown in Figure 12. From the figure, the left and right side is the compressive stress, and the inner side is larger than the outer side because the steel tube turns right, which leads to compressive stress concentration at right side. Although the bottom of the steel tube performs the tensile strain, but the final longitudinal stress is tensile stress, this is because it is less than the circumferential stress and affected by Poisson effect. Therefore, the longitudinal stress is controlled by the lacking of force in the horizontal direction.

Circumferential Stress of Steel Tube at Section A
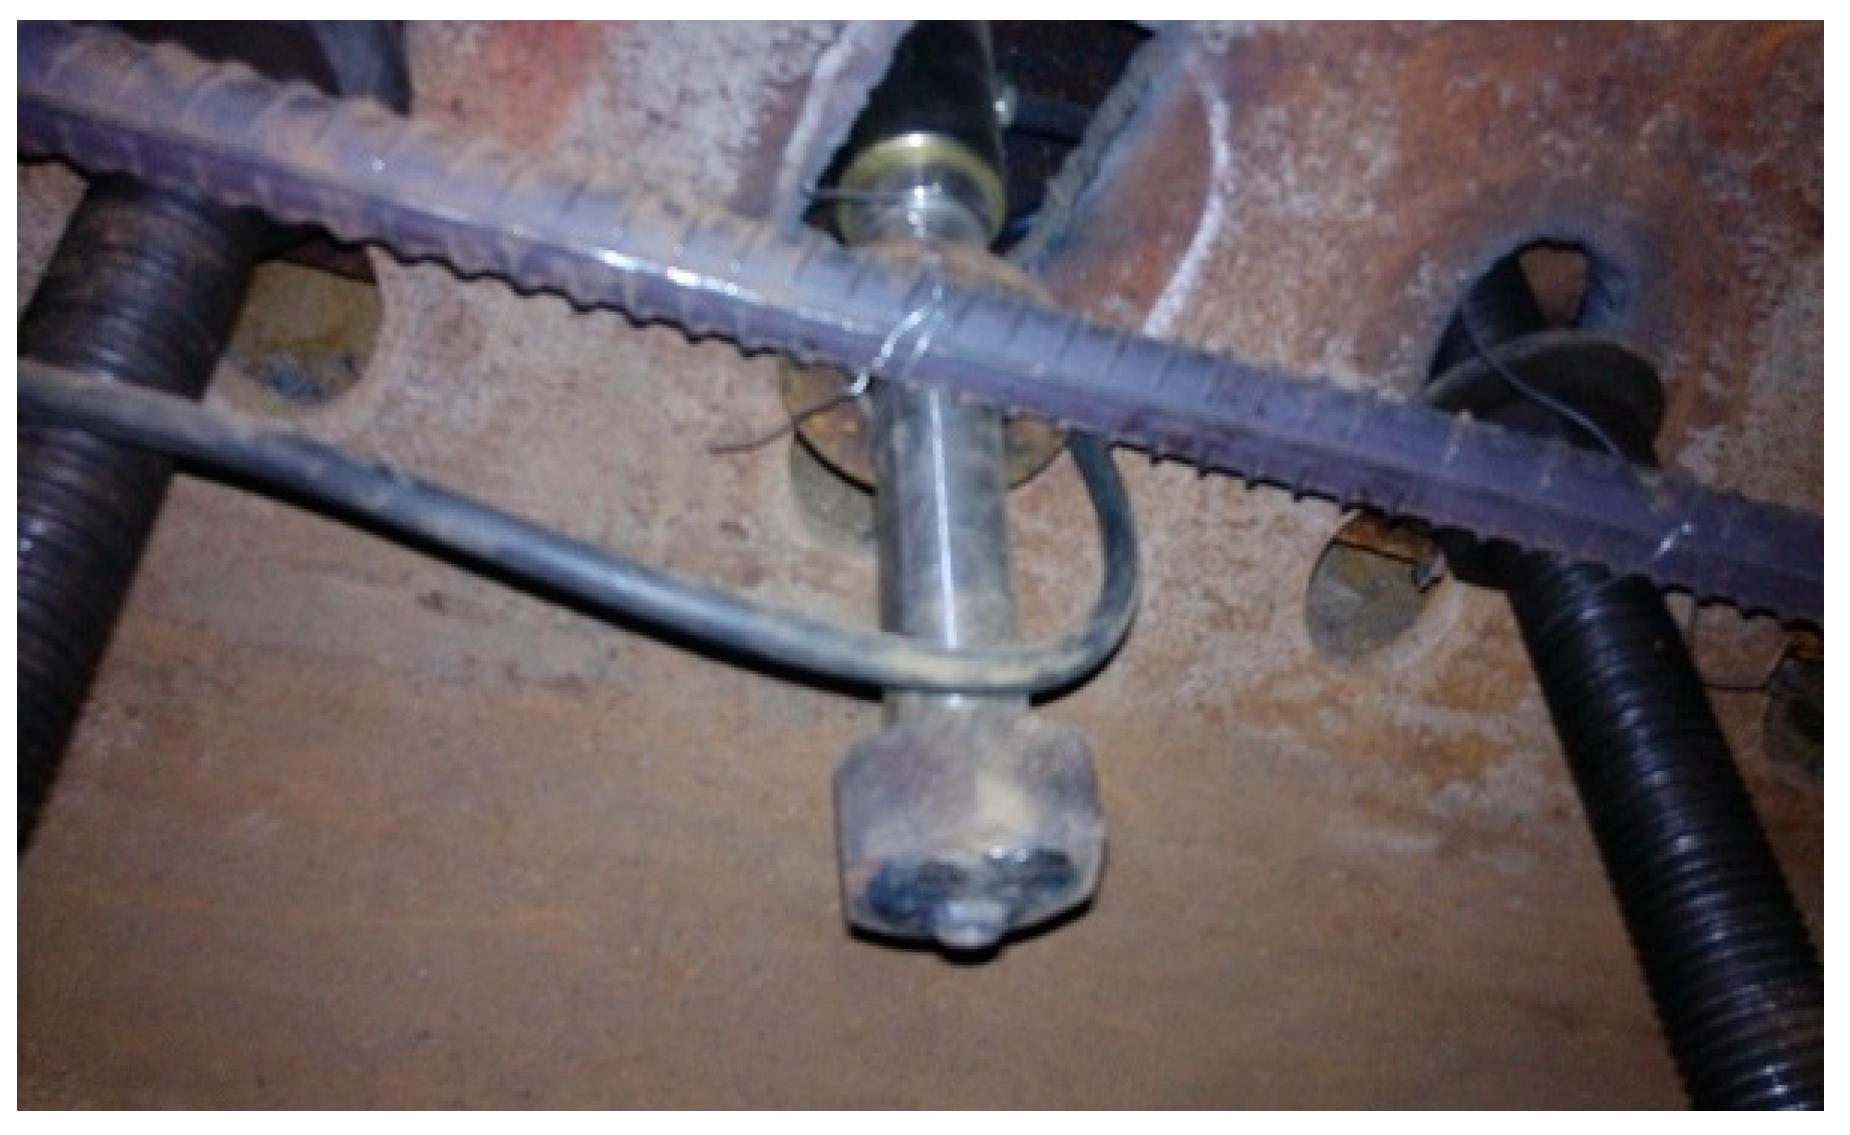
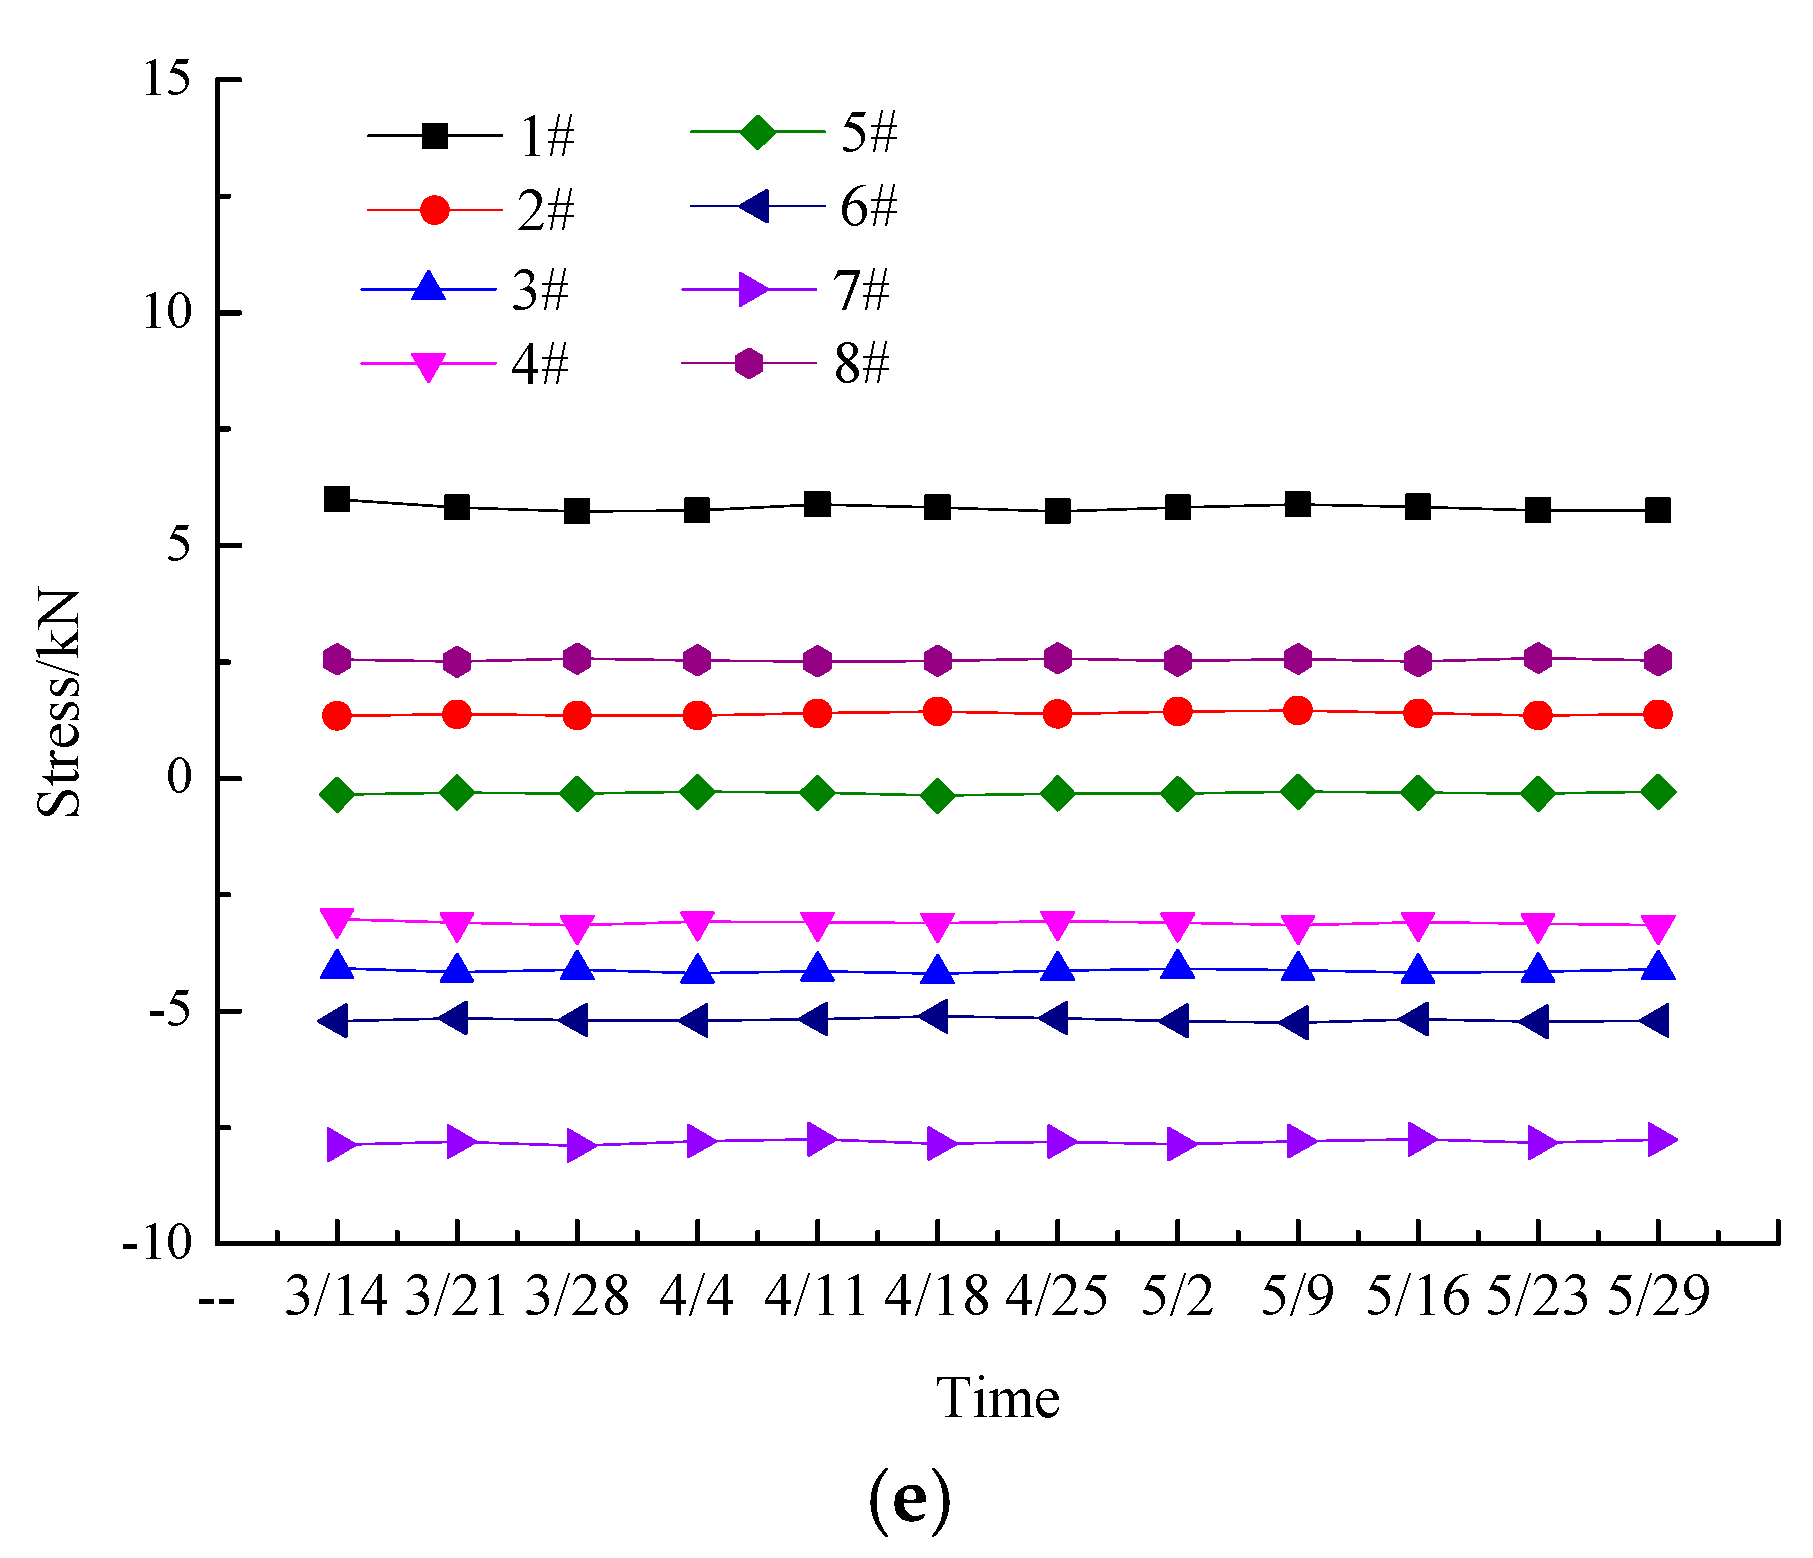
The circumferential stress is shown in Figure 13. As it is indicated that the bottom of the steel tube reflects the tensile stress, the left and right side is the compressive stress. Moreover, the value of the left and right side is less than the bottom, and the inner side is larger the outer side. This is because the circumferential tensile strain is larger than the longitudinal compressive strain, which decrease the influences of longitudinal compressive deformation. As for the inner stress is larger than the outer side, this is because the outer resistance of soil is usually larger than the inner side, and the right pressure decreases the compression deformation, which lead to the decrease of the compressive stress.

4.2. Stress of Bolt

4.2.1. Monitoring Scheme

Since the proposed STS method had not been applied to construct a shallow buried subway station before, stress monitoring for the bolts connecting adjacent steel tubes was planned for the support structure to gain confidence in the theoretical and practical aspects of the design and performance. According to the previous experimental research about STS structure, when failure is going to happen for the component beams, the bolts are also damaged simultaneously [32]. So the construction risk can be predicted by the bolts of field observation.
JTM-V1000 vibrating strings (2014, Jiangsu Gold Civil Construction Group, Changzhou, China) were used to monitor Stress in the bolts connecting adjacent steel tubes. The working range of the strings is from −100 MPa to 200 MPa, with the accuracy of 0.1 MPa. The dates were collected by a digital auto-reading instrument of GPC-3 type made by Dandong three of instrument group, China. The monitoring point were selected based on the potential risk areas, as shown in Figure 14. The initial readings of the strings were recorded prior to the removal of the soil beneath the STS structure.
Considering Tube 9 and Tube 10 are over the top pilot tunnel (Z3), and are located in one of the most disadvantage region in the pilot construction stage, as shown in Figure 3. So 8 monitoring sensors were installed between Tube 9 and Tube 10 to investigate mechanical behavior of the bolts inside steel tubes when the soil was excavated. Each monitoring section was arranged with two force sensors to verify the correctness of the data. The detail of the installation of the monitoring sensors is shown in Figure 15.

4.2.2. Analysis of Monitoring Results

The stress on the bolts connecting Tube 9 and Tube 10 were monitored during the construction sequence of the station. The stresses recorded in the eight monitoring sensors at different construction stages are shown in Figure 16. The following observations can be made at different construction stages:
(1) Pilot tunnels construction: The bolts started going in tension as the excavation started, and the tensile stresses gradually increased along with the soil excavation. When the pilot tunnels were excavated at the distance of 15m, the tensile stress of about 5 kN was recorded in the monitoring point 4#. The tensile stress in the bolts began to increase rapidly when the pilot tunnels were excavated further, and the peak value of 28.9 kN was recorded when the tunnel excavation reached to its final distance of 43.5 m.
As seen in Figure 16, with the tunnel excavation, the monitoring values increase gradually, and the increment shows up an increasingly large trend. The reasons were as follows: (a) The influence of steel pipe jacking in accuracy in the pre-construction stage. According to the construction records, the deviation of the early 25-m is smaller than the rest distance in the steel pipe jacking stage, which caused the quality of flange welding in the last half was inferior to the first half. So the main stress was borne by bolts in the last half of the whole support system; (b) The influence of construction progress. The excavation period of the early 25-m is less slow than the rest distance in excavation soil below STS structure, which causes the ground disturbance to be smaller.
(2) Beam-column supporting system construction: As the bottom longitudinal beam, cylindrical steel column and top longitudinal beam located inside the pilot tunnel are built, respectively. Tensile stresses in the bolts gradually reduced at this stage. The reason is that part of the overburden load is carried by the column, which releases some of the stress in the bolts.
(3) Construction of the station hall: The stresses in the bolts decreased during this stage, and even changed from tension to compression. The monitoring location produced negative moment along with soil excavation, and it happened because the stiffness of the STS structure supported by the steel columns was higher than the stiffness of the rest, so the settlement of the structure was larger on the sides compared to the supporting section.
(4) Construction of the platform layer and the later stage: stresses in the bolts remained almost constant during this stage because the whole supporting system had already reached equilibrium.

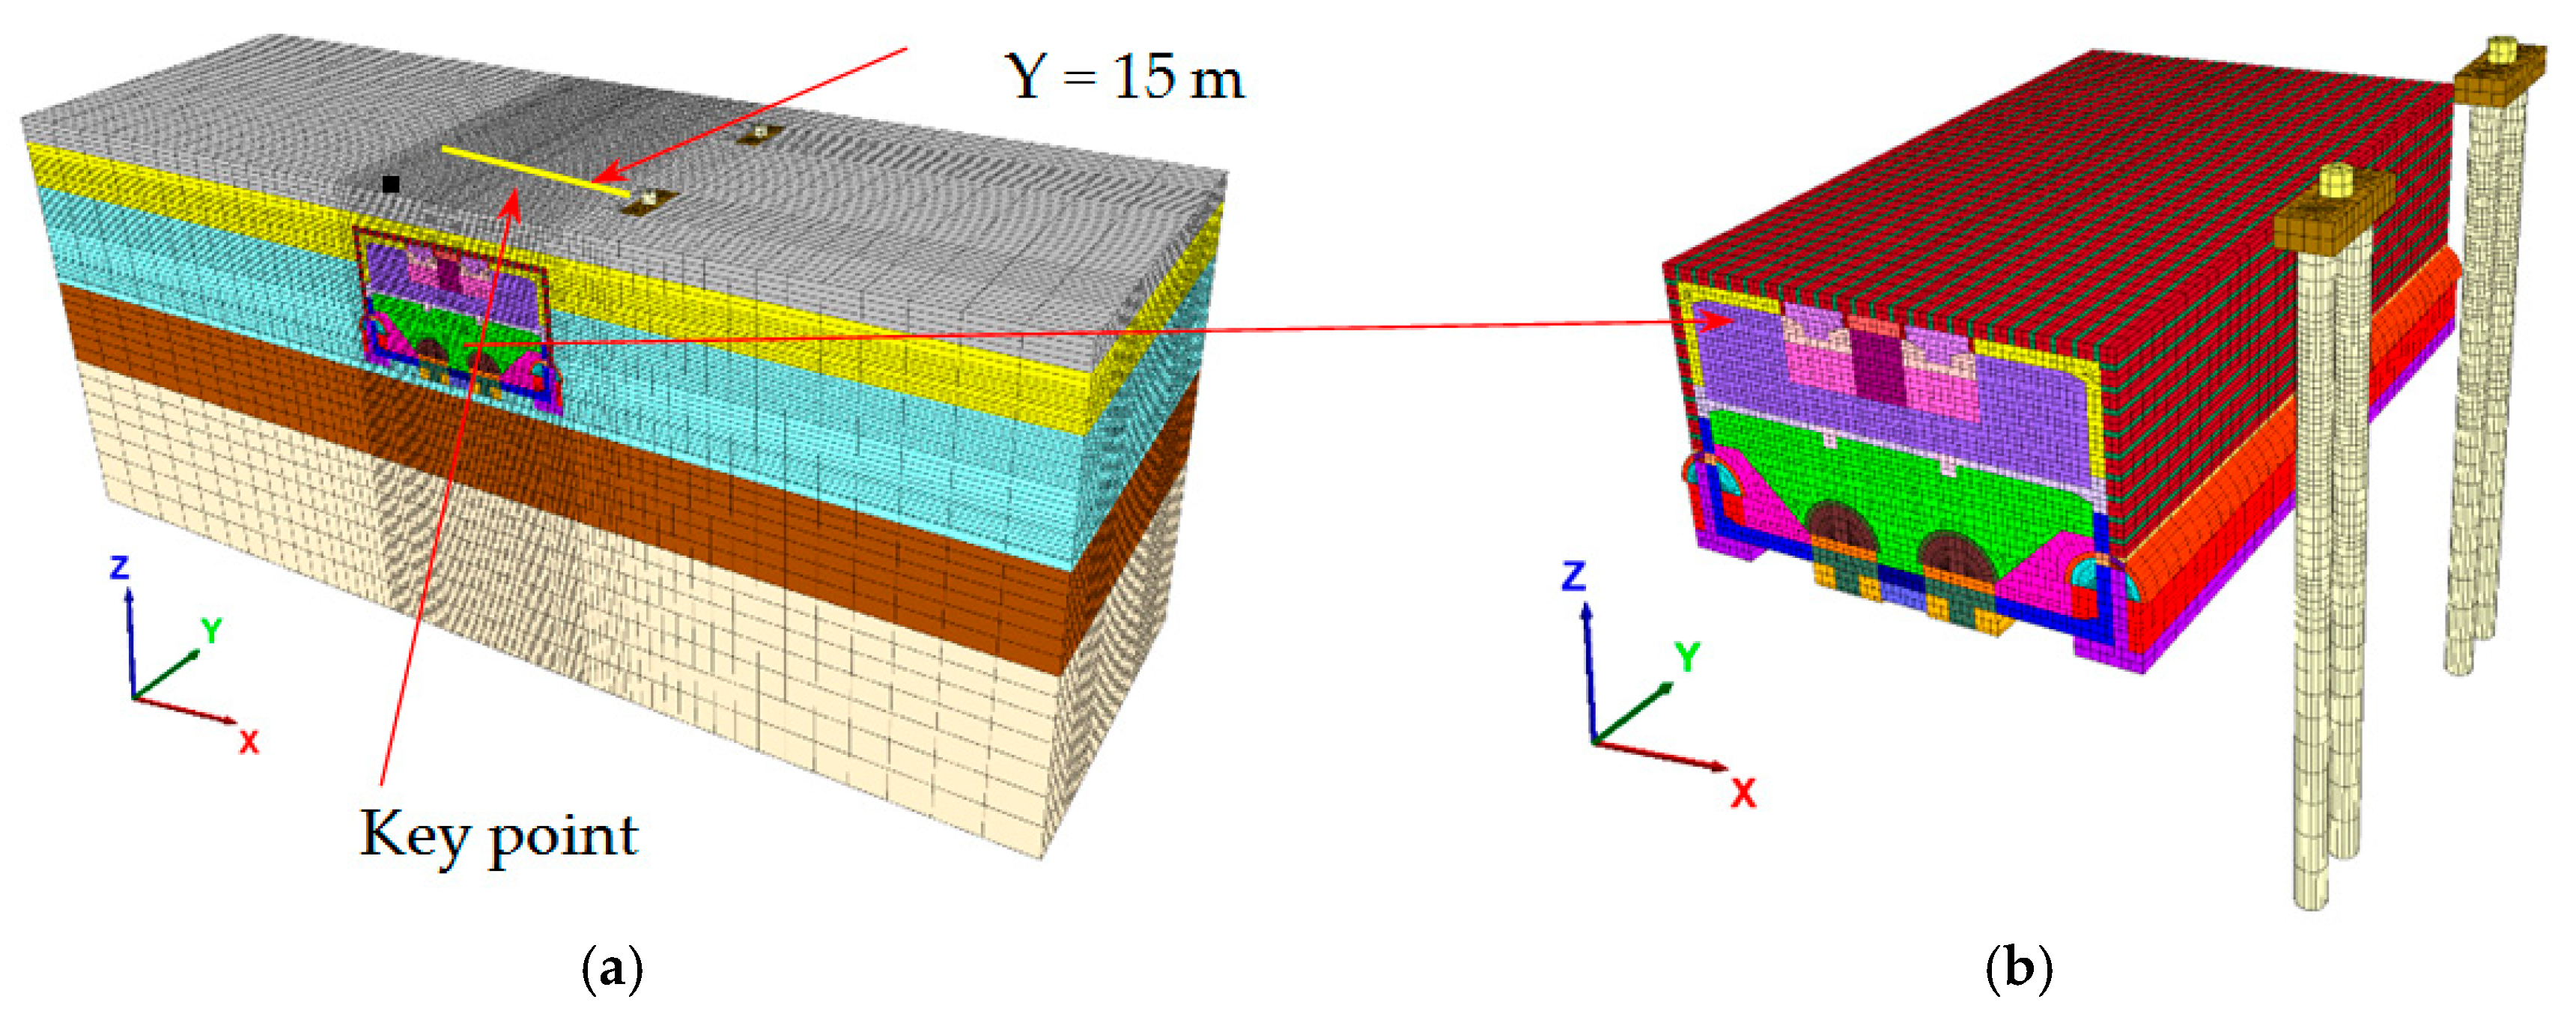
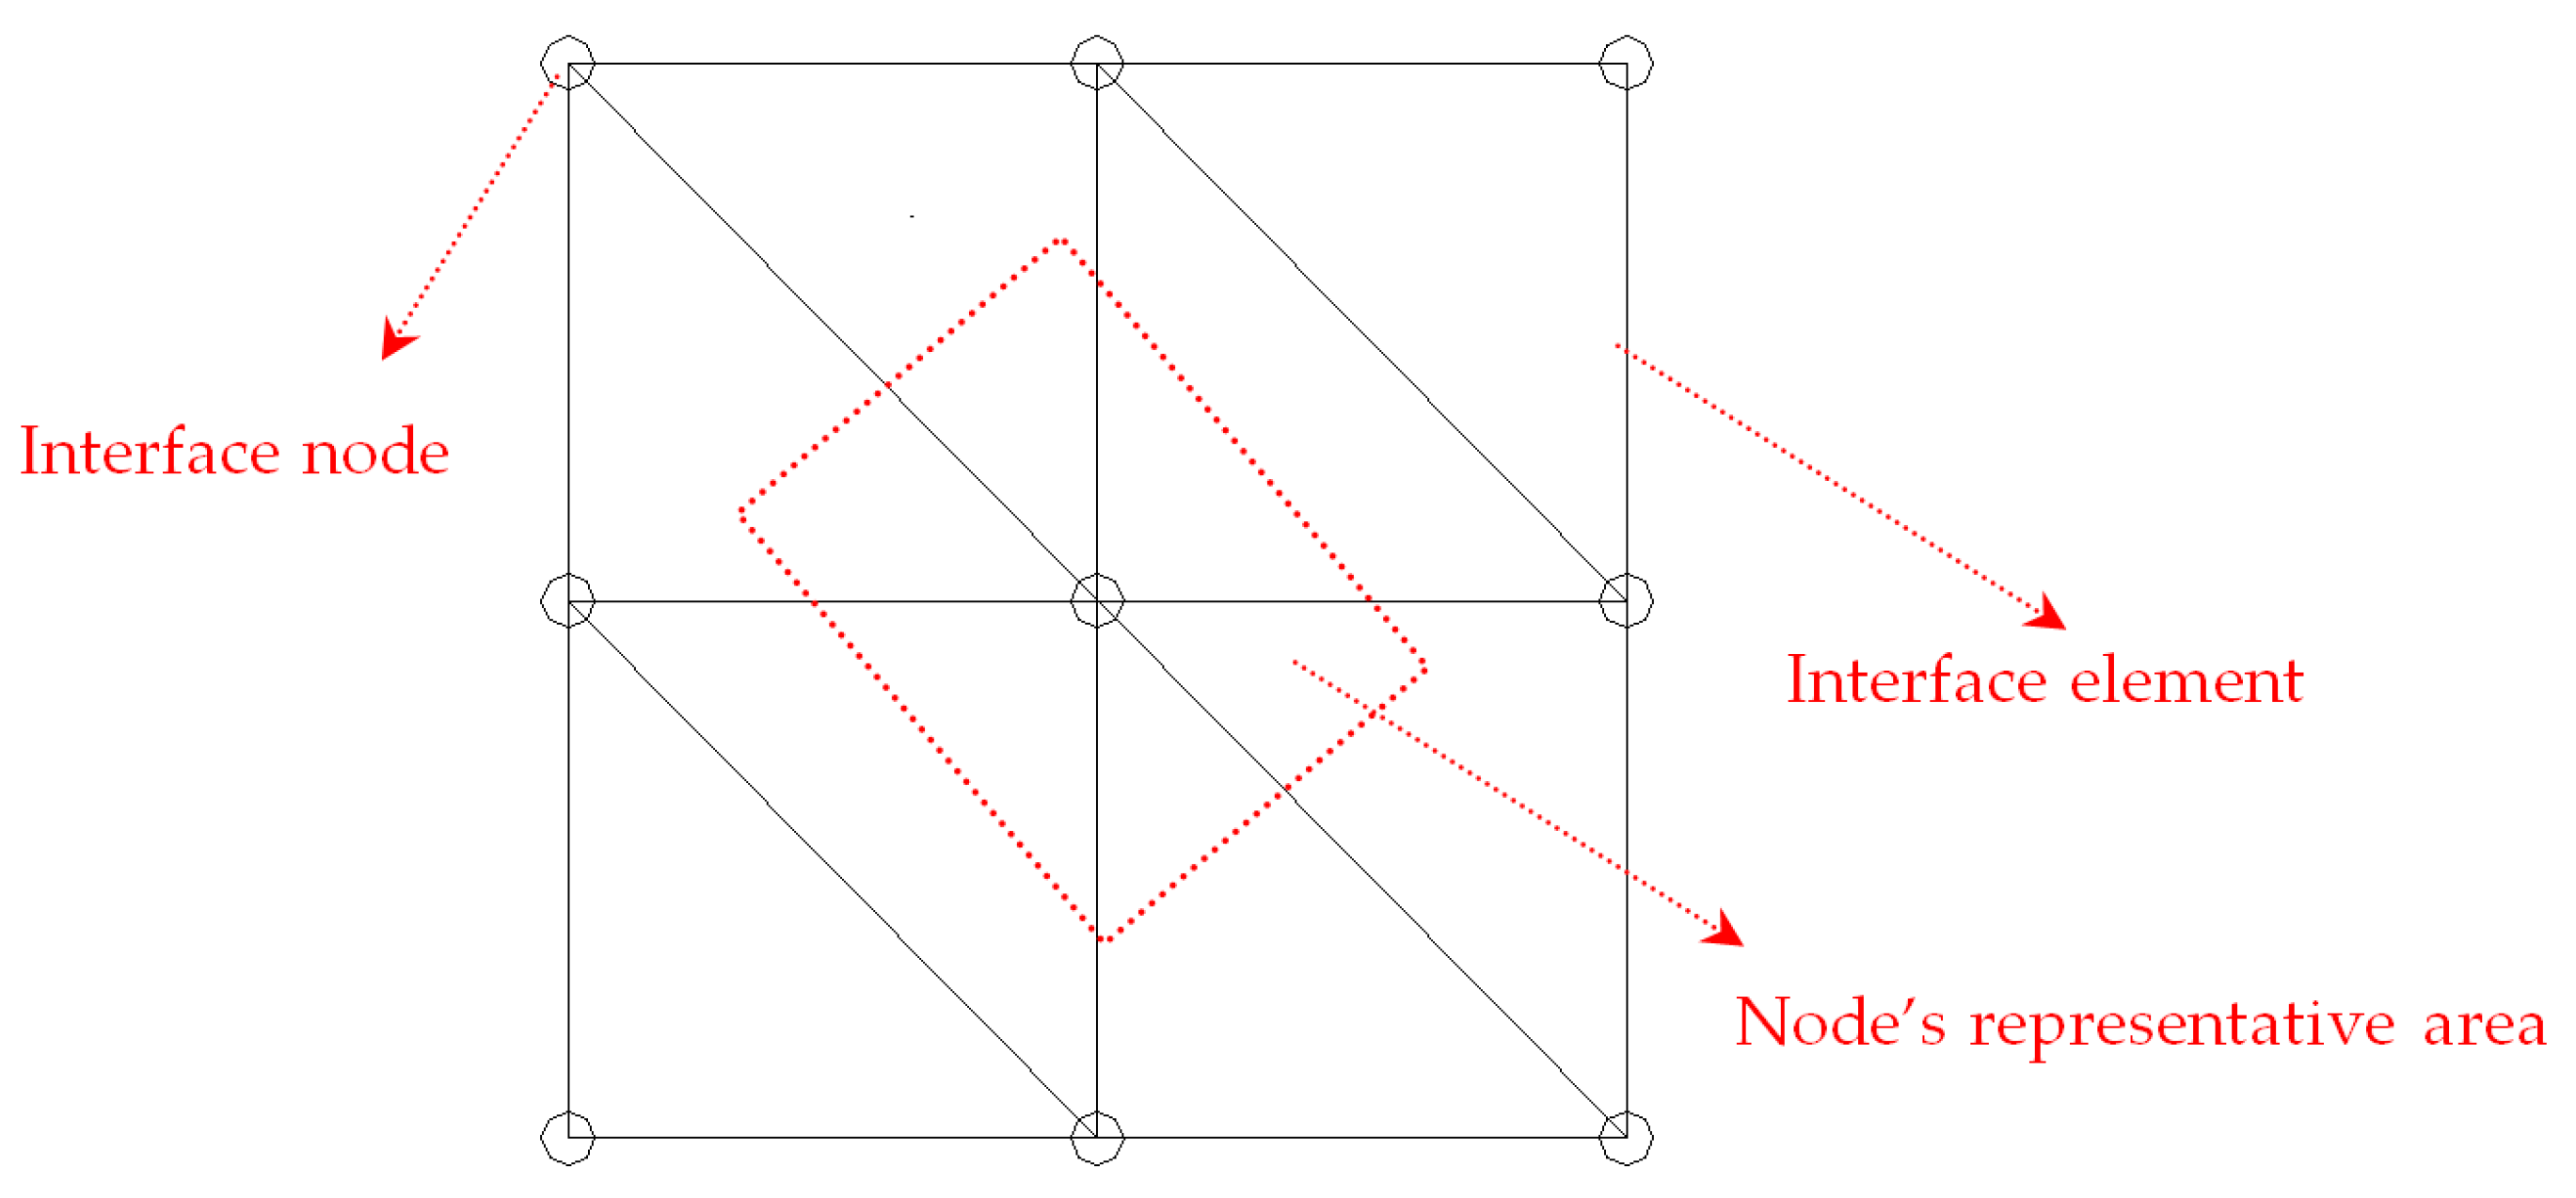
5. Numerical Modeling

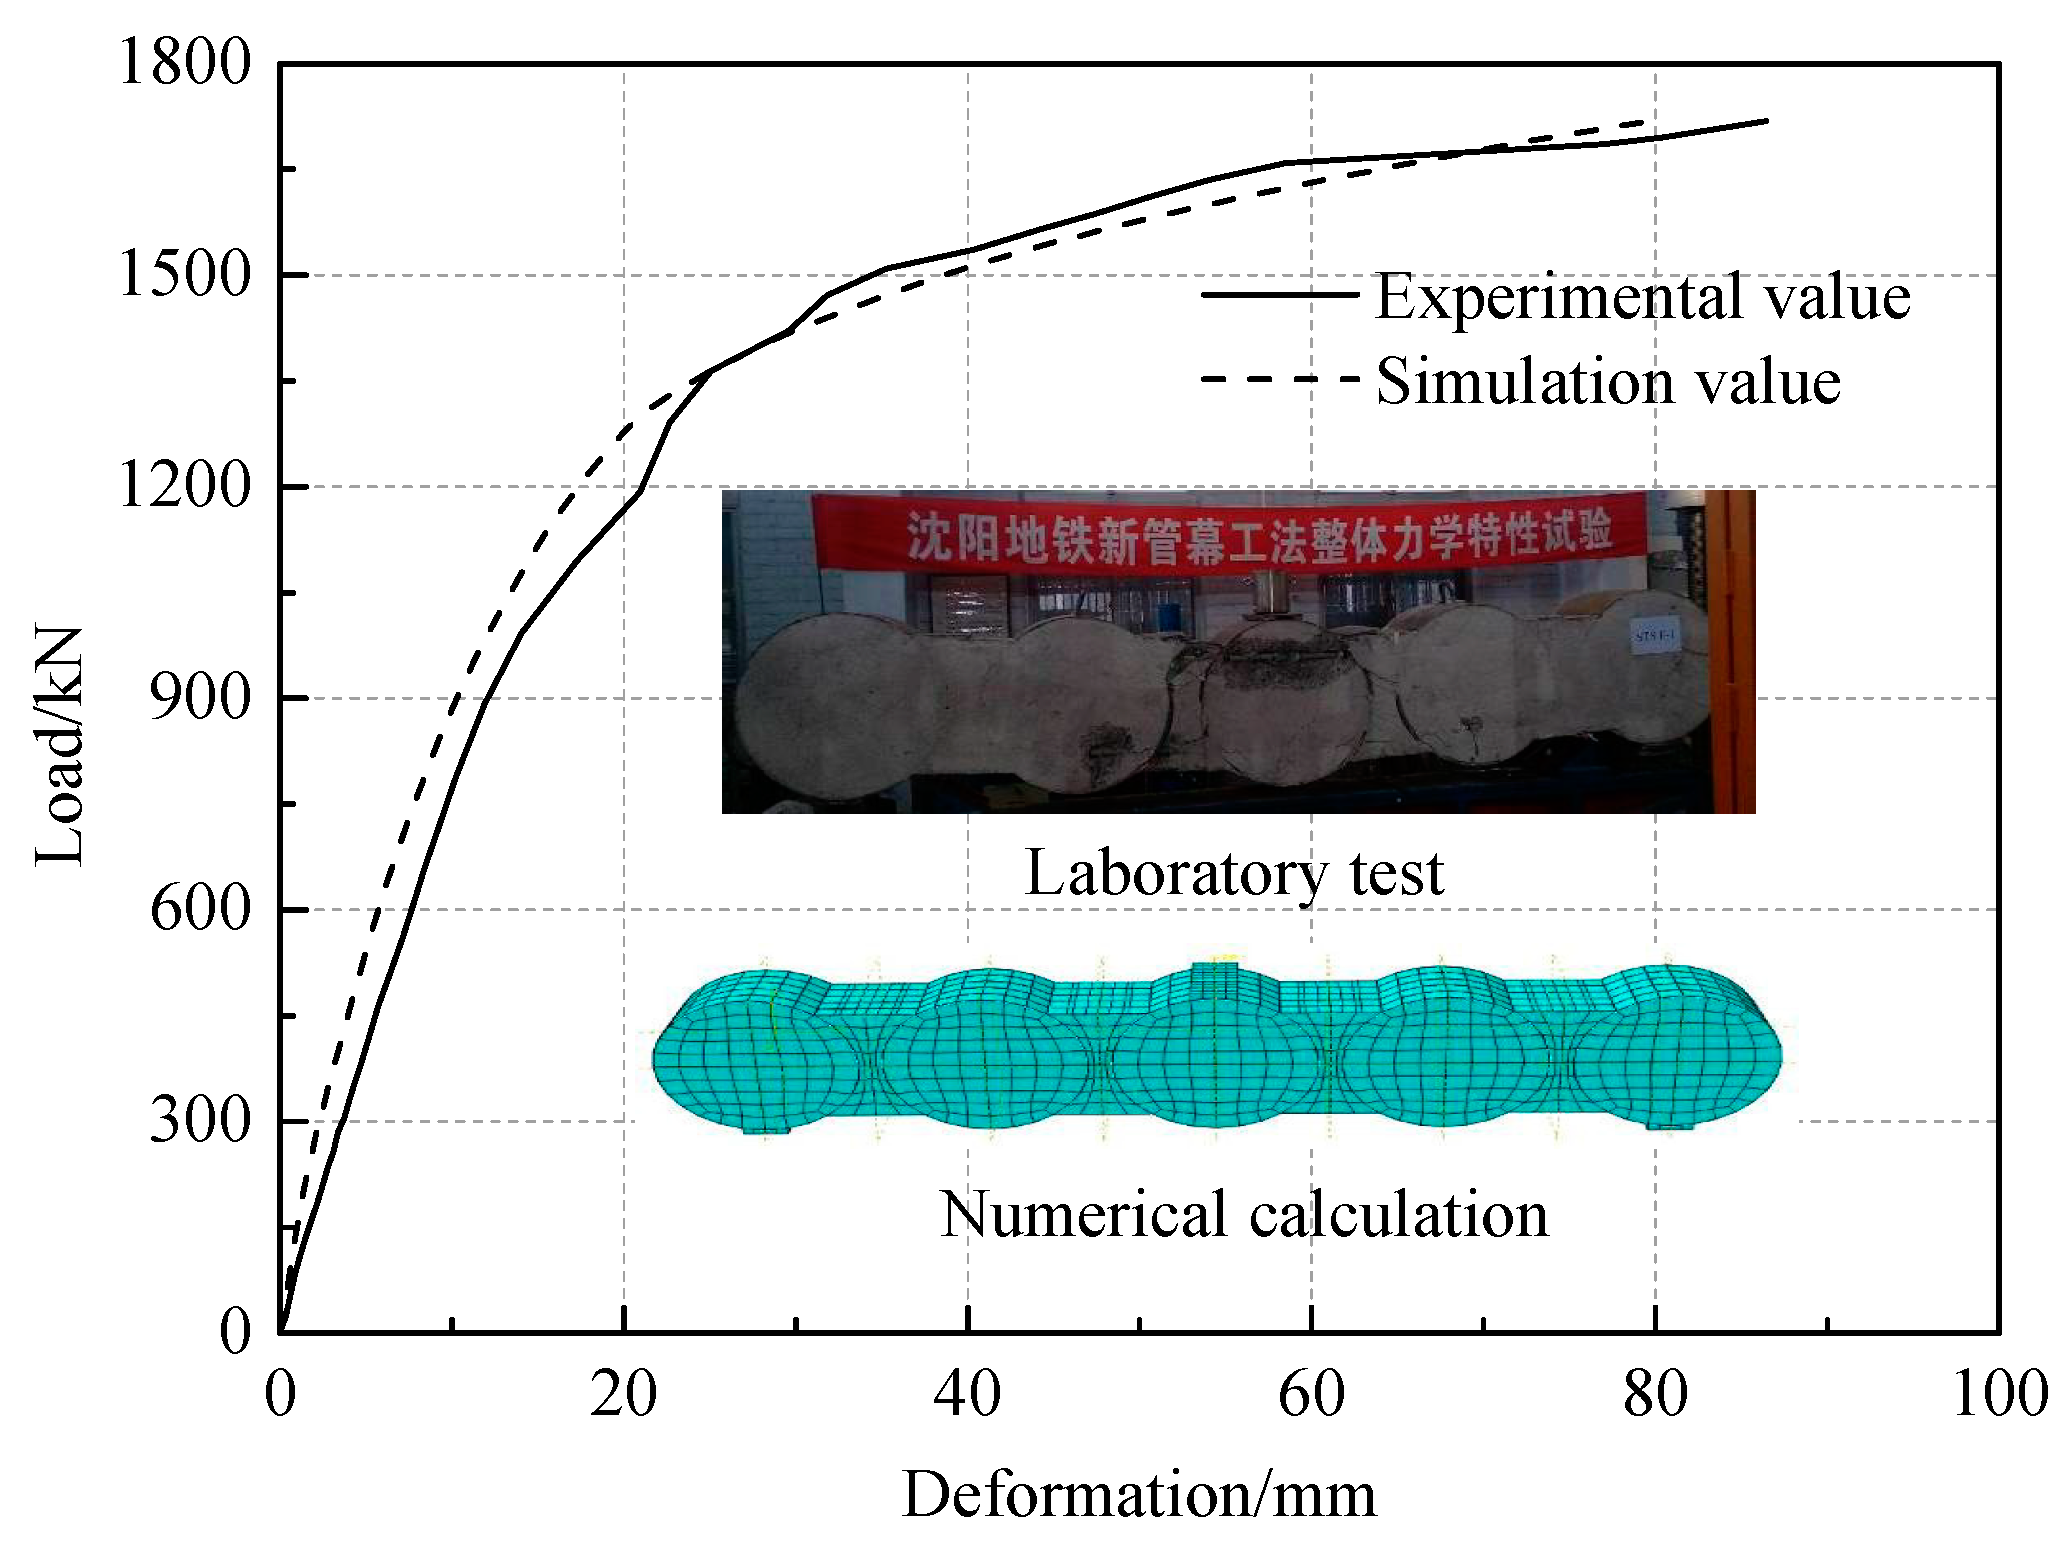
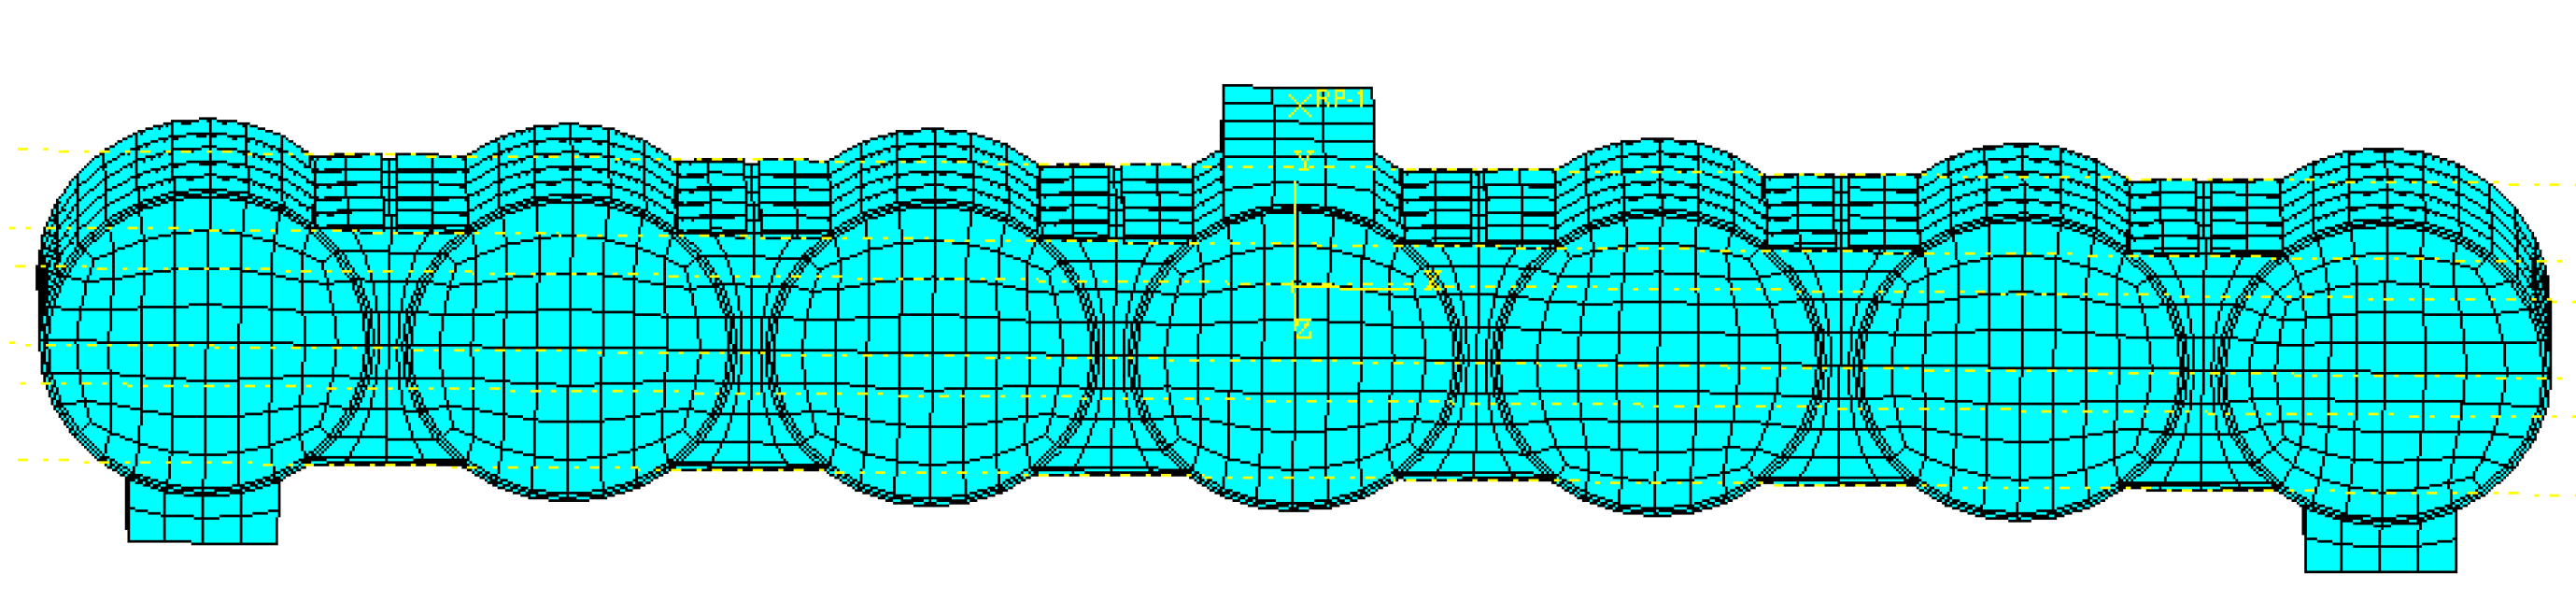
5.1. Simplification of STS Structure

Considering the complexity of the STS structure, accounting for all its components in a numerical model is extremely complicated and greatly increases computational expense. To avoid this problem, an equivalent structure with a similar behavior is first established for the use in the subsequent numerical simulations.
In order to obtain the mechanical behavior of the STS beam, a full-scale laboratory test is performed by the authors [33]. It was observed that the beam failed in flexure. In the early stage of the load application, the specimen was in an elastic state and no cracking was observed. Cracking started to occur along the interface between the steel tubes and the concrete in the mid-span at the level of about 7% of the measured peak load. As the applied load was increased, more flexural cracks appeared within both the pure bending and shear regions of the beam and the existing cracks were propagated toward the loading points with increasing width. The yielding of the bottom flange and connecting bolts began at the level of about 86% of the recorded peak load. During the loading, the crack propagation of the beam occurred slowly due to the constraining effect of the steel tube and flange plate. The flexural failure of the beam was initiated by the yielding of the bottom flange followed by the sudden rupture of the bottom flange and bolts, with crushing of the concrete. The cracks were developed mainly along the interface between the tubes and concrete in the region between the tubes. Several cracks were also formed along the interface between the tubes and the core concrete inside the tubes because of the tensile effect of the flange plate on the tubes.
Based on the full-scale laboratory test a general load-deformation behavior of an STS beam can be established. The comparison results between the laboratory and numerical calculation were shown in Figure 17, the trend of laboratory test was familiar with numerical calculation. It indicates that element, interaction and stress-strain applied the model were valid.
According to the construction schedule, the maximum free surface of the subway station are 7 steel tubes, considering the influence size-effect on calculation results. The model was established to study the effect welding of flange on bearing capacity (see Figure 18). Due to the STS structure being in the elastics stage in the construction of subway station, and according to the deflection formula of simply-supported beam [34], the equivalent stiffness of welding of bottom flange and no welding of bottom flange were 1.91 × 10⁸ N·m2 and 1.05 × 10⁸ N·m2, respectively (see Figure 19).
Simplification model of the STS structure was divided into two materials (material 1 and material 2) to simulate the weak part of adjacent steel tubes, as shown in Figure 20. Not only can it ensure the whole stiffness of STS structure, but also retain the characteristics of STS structure. Considering the longitudinal direction of STS structure has a high stiffness, the longitudinal stiffness of material 1 is equivalent to longitudinal stiffness of concrete filled steel tube, and the stiffness is 92 GPa according to Formula (5). Considering the effect of the steel tube with the hole on the whole stiffness, the stiffness was reduced to 70%, that is 65 GPa [35].
E I = E s I s + E c I c  
where, E—the equivalent stiffness, I—the equivalent moment of inertia; Es—the stiffness of steel tube, Is—the moment of inertia of steel tube; Ec—the stiffness of concrete, Ic—the moment of inertia of concrete.
The seven models considered different elastic modulus of material 2 were established to obtain load-deformation curve of the models by exerting concentrated load of 500 kN, and the simplified model occur elastics deformation from Figure 21. The equivalent lateral stiffness of the seven models was calculated by load-deformation curve, and the relationship between elastic modulus of material 2 and the lateral stiffness of the simplified model was shown Figure 22. So when the bottom flange was welded, the elastic modulus of the material 2 is 2.3 GPa, and when the bottom flange was not welded, the elastic modulus of the material 2 is 1.21 GPa.

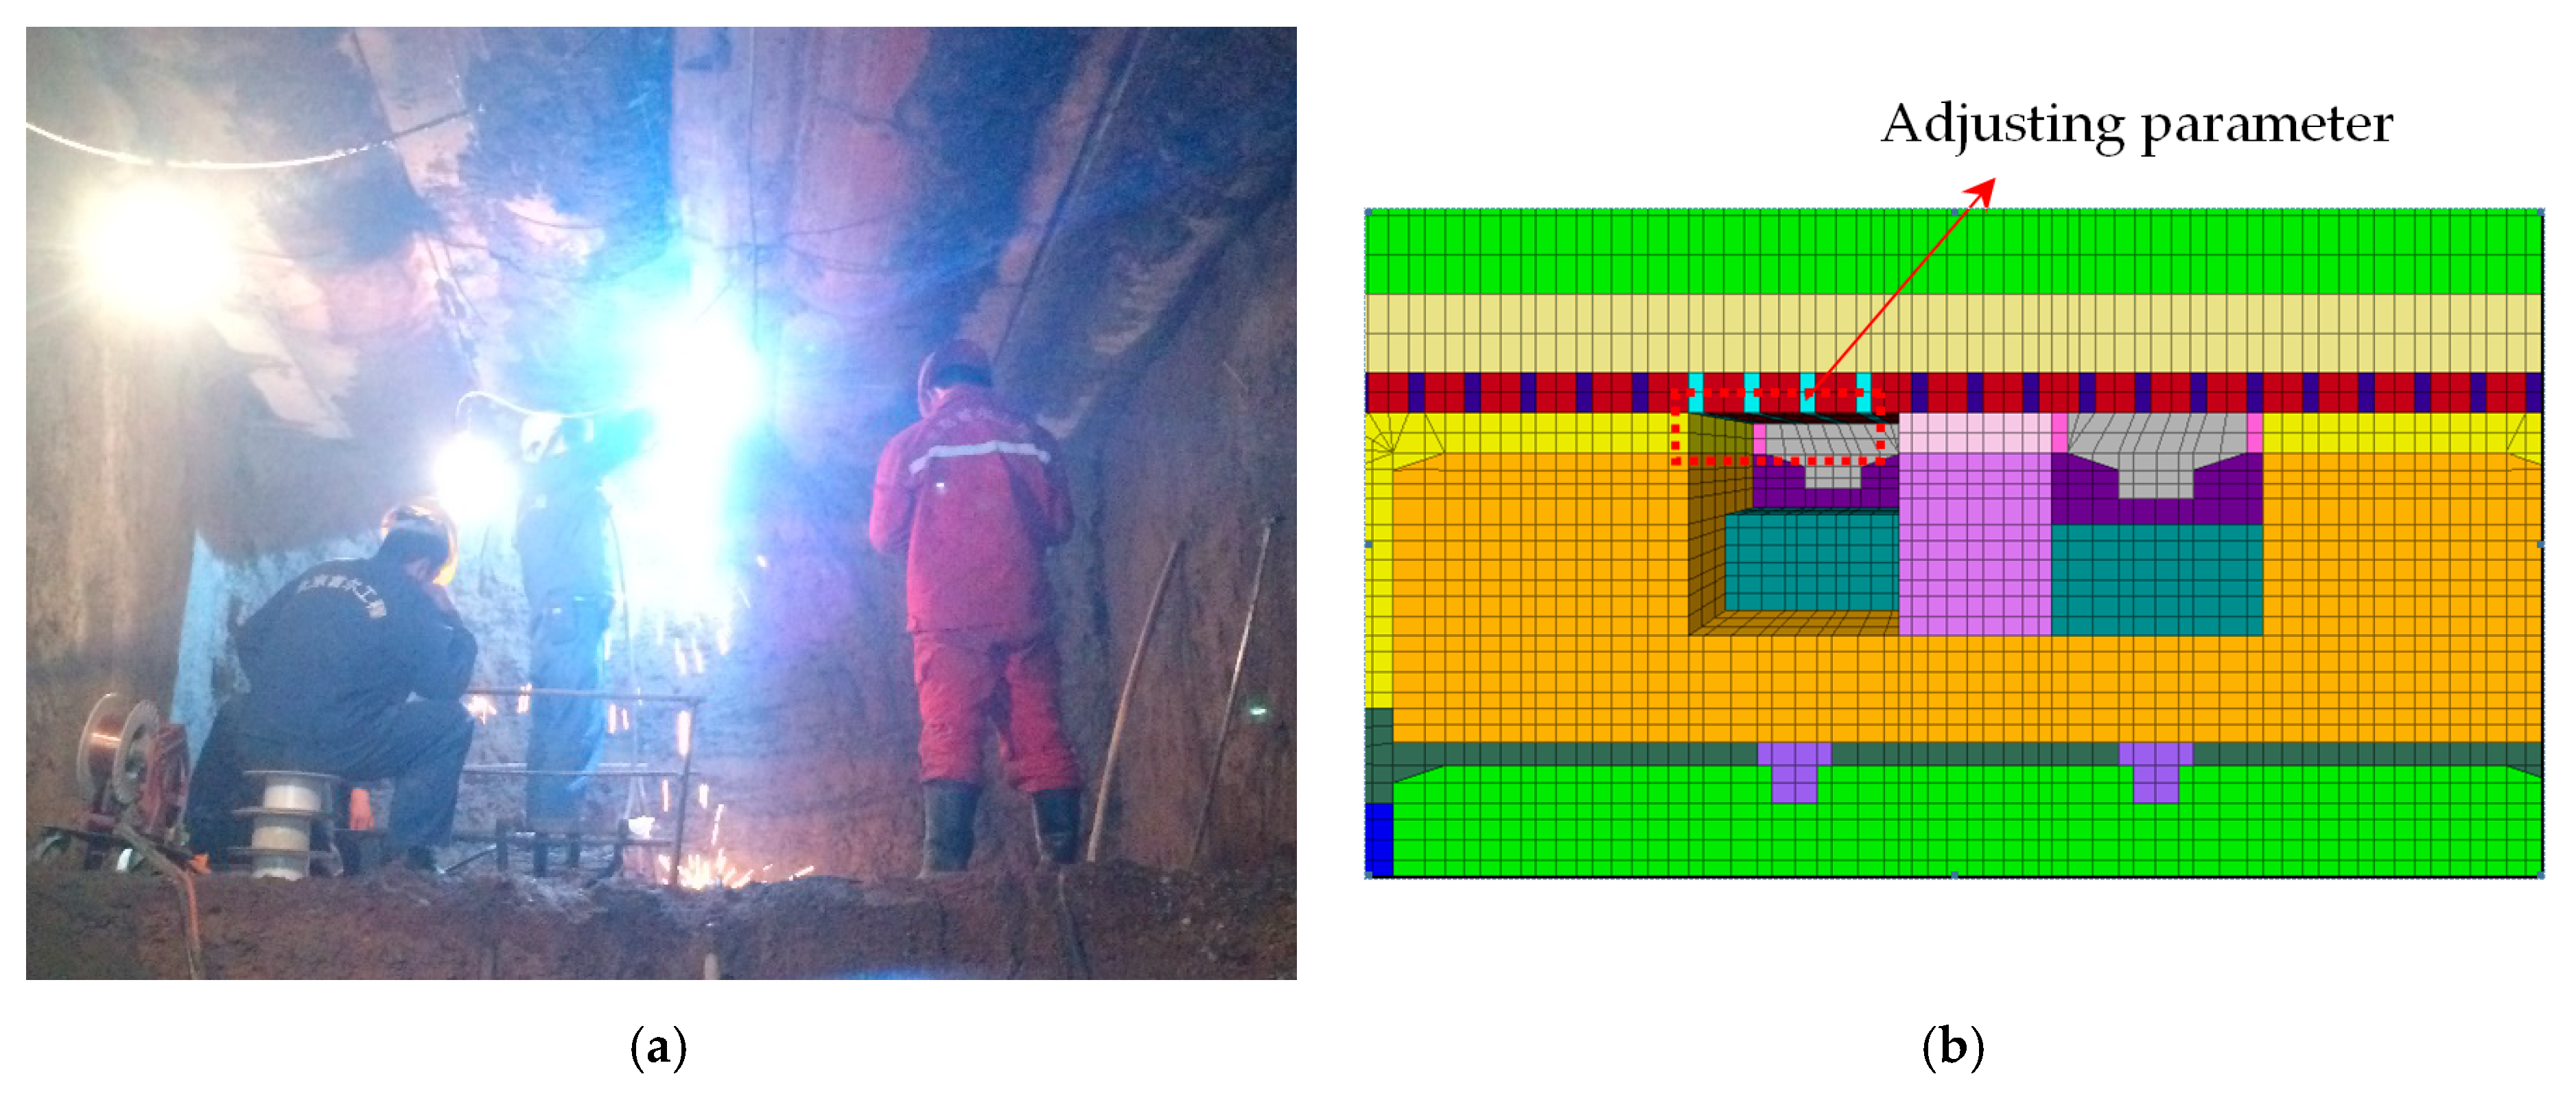
5.2. Model and Material Properties

A large span underground subway station with relatively limited size has three-dimensional characteristics. Therefore, to numerically study the general performance of the suggested support system, a full three-dimensional model of the station construction was established using FLAC3D 5.0 software (2012, Itasca Consulting Group, Minneapolis MN, USA). The dimension of the numerical model was selected 120 m × 39 m × 50 m to include most of the soil affected by the excavation, as shown in Figure 23. The bottom boundary of the model was entirely fixed in the whole directions. The horizontal displacements were fixed in the left and wright sides, while vertical movements were free. The top boundary was free to move in all directions. A surcharge of 20 kPa was applied on the top surface to simulate surface loads [36]. The diameter of the cylindrical steel columns is 0.8 m, the distance between cylindrical steel columns is 8.5 m, the length of the feet-lock bolt is 2.5 m, and the distance between the feet-lock bolts is 1.0 m in the model, in accordance to the real structure.
Beam and pile elements are adopted to simulate the temporary steel supports and feet-lock bolt, respectively. Different materials were assigned to the different soil layers and different components of the STS structure as seen in Figure 20b. Line and shell elements were used to simulate the cylindrical steel column and the primary lining, respectively. In total, 315,055 zones and 323,540 nodes were used, meanwhile the maximum element size is 6 m × 4 m × 1 m, and the minimum element size is 0.25 m × 0.25 m × 1 m. For simplicity, the Mohr–Coulomb model was adopted to define the behavior of the natural and improved soil in the numerical analyses, the parameters of soil were shown in Table 2. The cohesions and friction angles of sandy soils were obtained according to the recommended relationship between the strength parameter and DPSH value from the scientific references. Besides, in the Shenyang area, the cohesions (c) are usually negligible based on engineering experience and some scientific references. But for the numerical simulation software, c = 0 may cause some options performing hardly, even calculation non-convergence. Therefore, the cohesions of sandy soils are generally assumed to be 1 kPa in the numerical analysis [37,38,39]. STS structure elements, primary lining, beam and columns are deemed to have a liner-elastic behavior. Material properties used for the numerical simulations are listed in Table 3.
As for the initial condition, the initial stress field of the soil is generated by balancing the gravity of the soil. In the initial stage of the model calculation, and the initial displacement is reset to zero. Meanwhile, based on the construction experience of Shenyang and the relevant research, it is proved that dewatering has little influence on soil deformation. So hydrostatic or geostatic condition is generally ignored.
The interface elements are used to simulate the interaction between soil and structure, and the interface elements are comprised of a series of the triangular elements contained three nodes, as is shown in Figure 24. The normal and shear constitutive equation of interfaces elements are as follows [40]:
F n ( t + Δ t   ) = k n μ n A + σ n A
F s i   ( t + Δ t ) = F s i ( t ) + k s Δ μ s i ( t + 0.5 Δ t ) A + σ s i A
where, Fn(t+Δt) is the normal at time (t + Δt); Fsi(t+Δt) is the shear force vector at time (t + Δt); μn is the absolute normal penetration of the interface node into the target face; μsi is the incremental relative shear displacement vector; σn is the additional normal stress added due to interface stress initialization; σsi is the additional shear stress added due to interface stress initialization; ks is shear stiffness, kn is normal stiffness, and A is representative area associated with the interface node.
The absolute normal penetration of interface surfaces and contact nodes and shear relative velocity are calculated in every step. Subsequently, they are substituted into the constitutive equations of interface elements to obtain normal stress vector and shear stress vector.

5.3. Results of the Numerical Study and Discussion

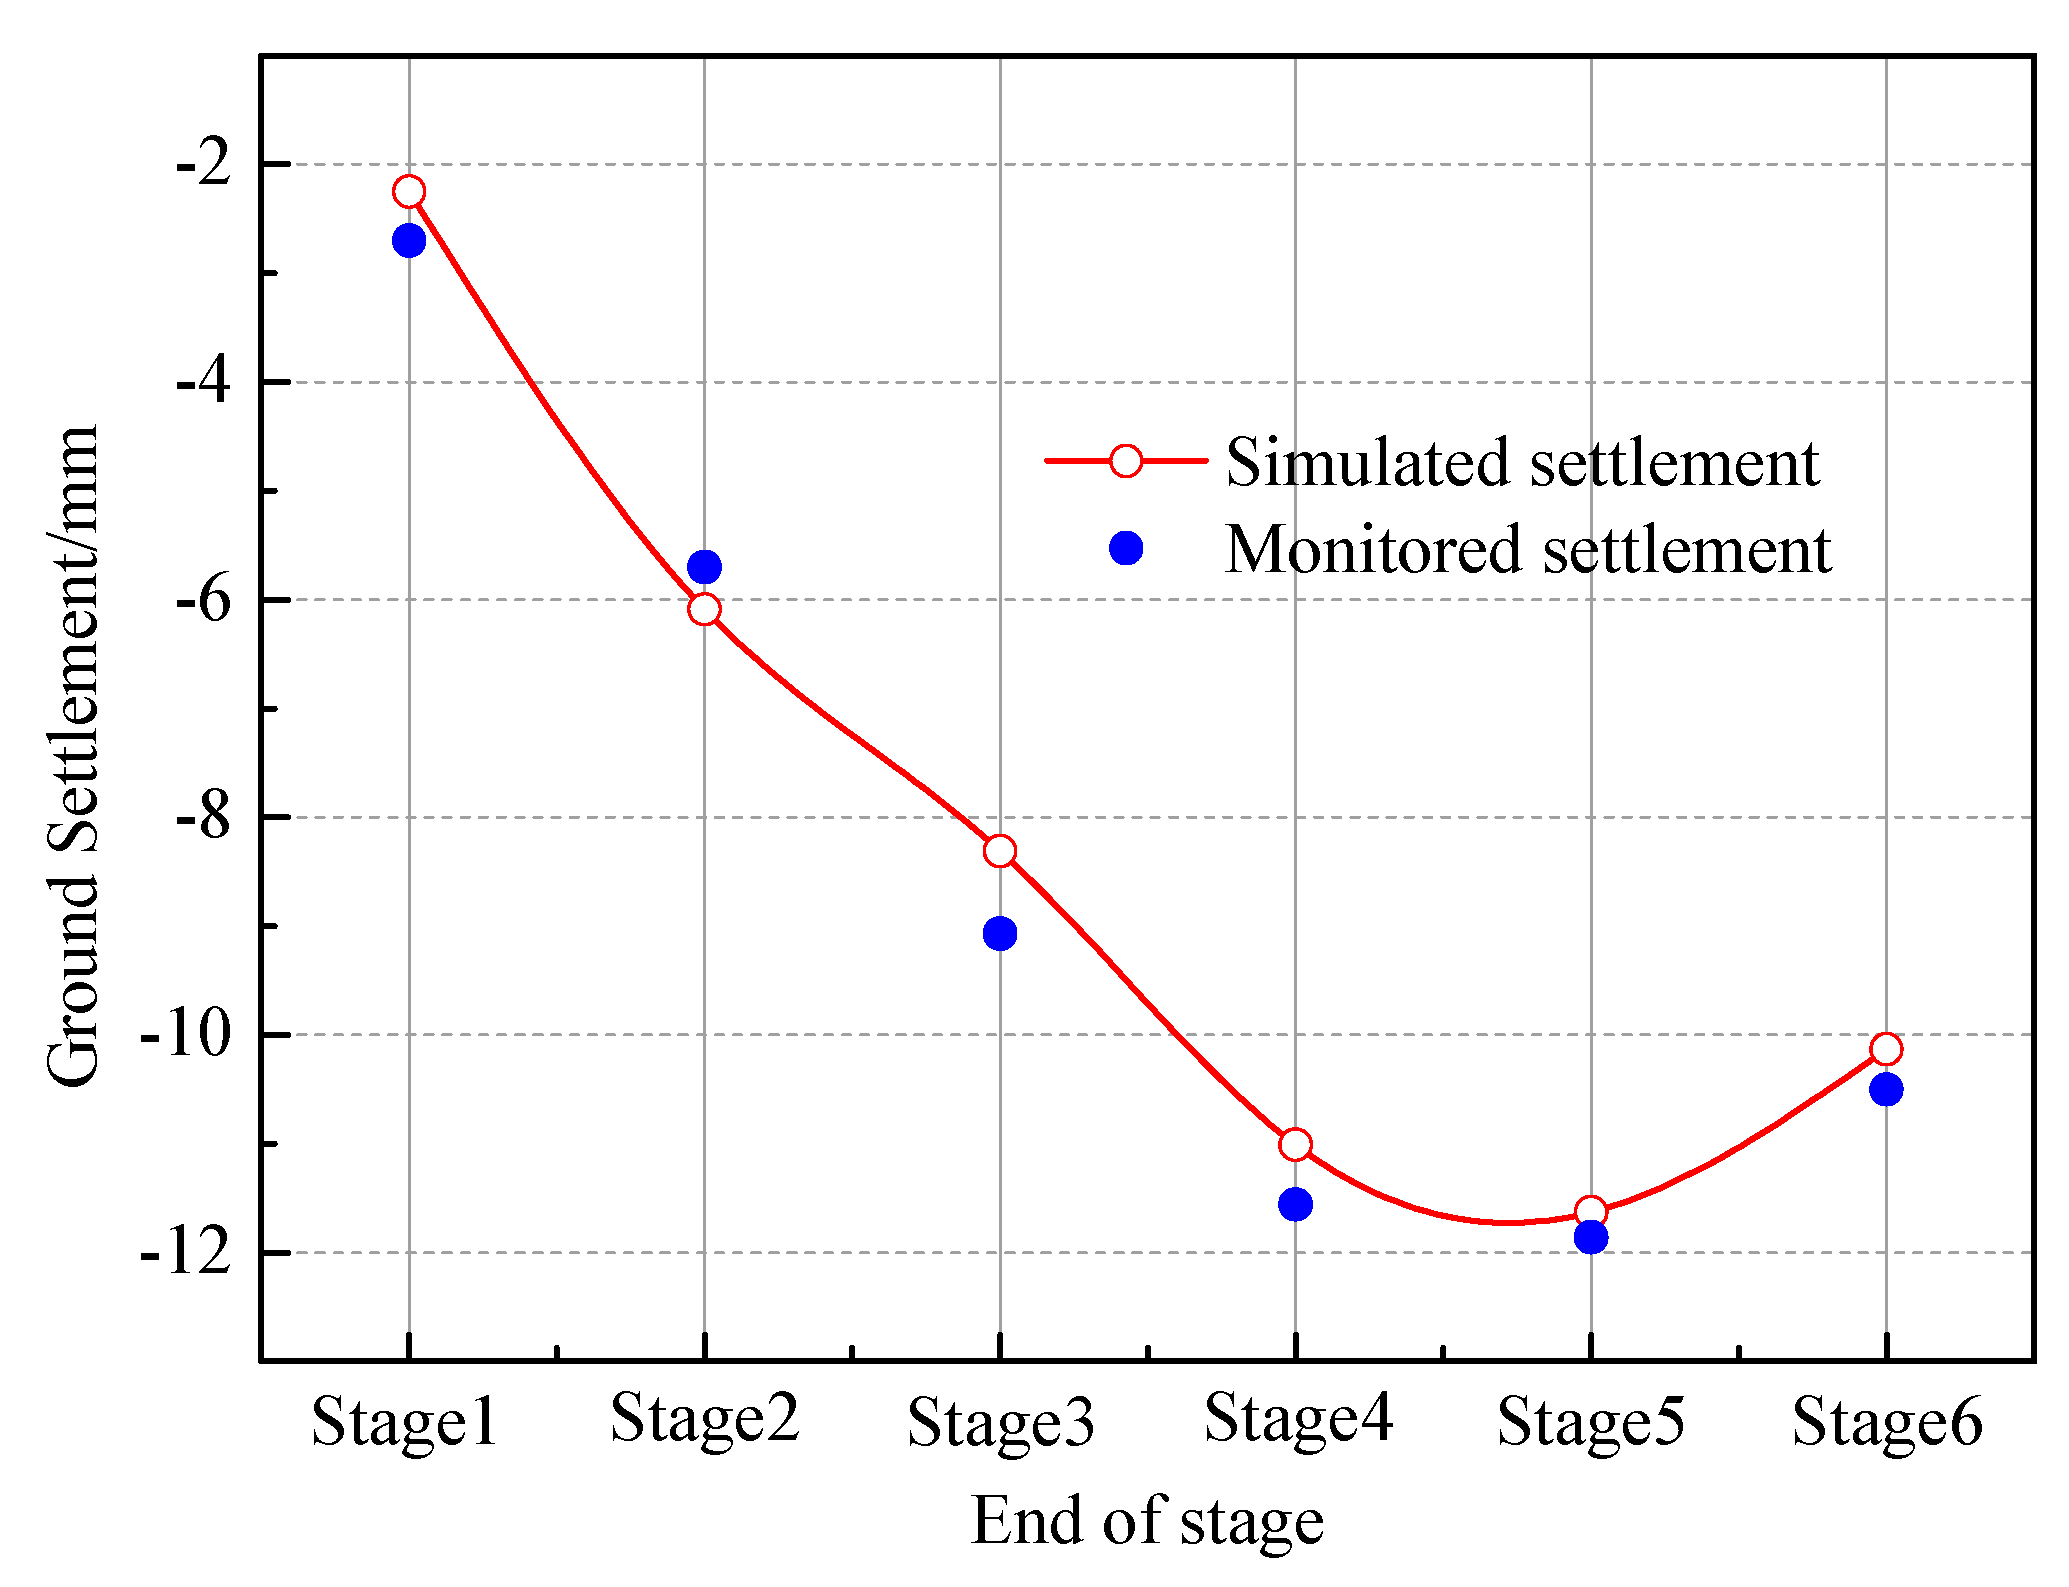
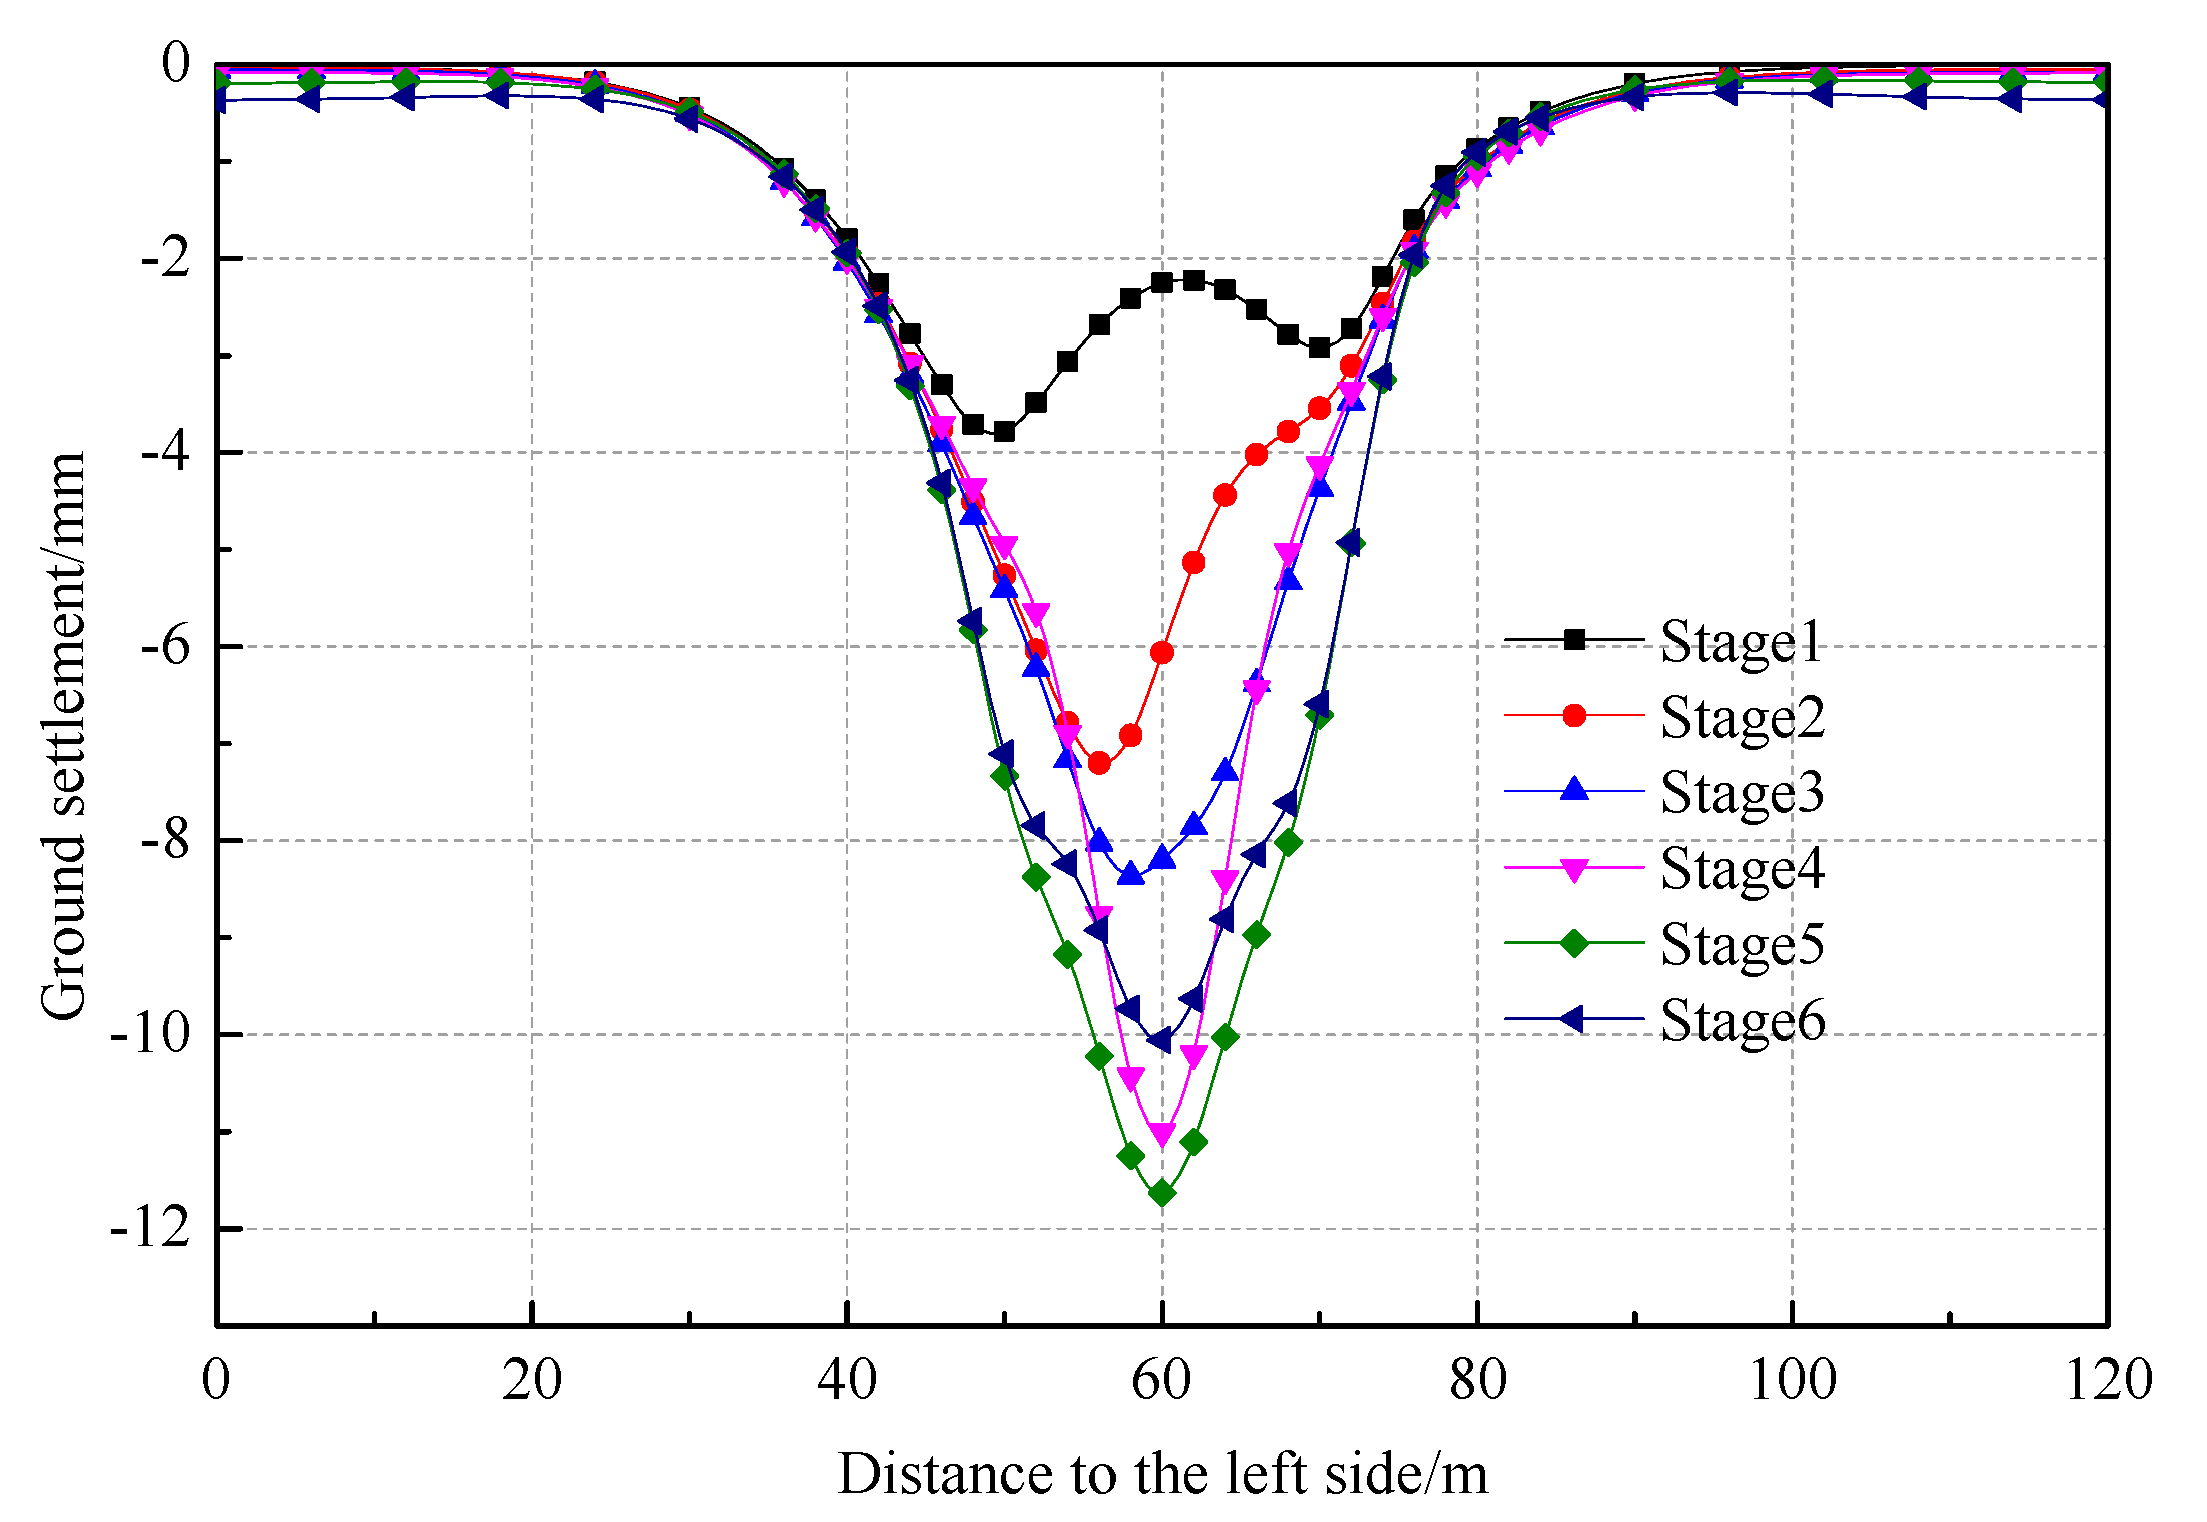
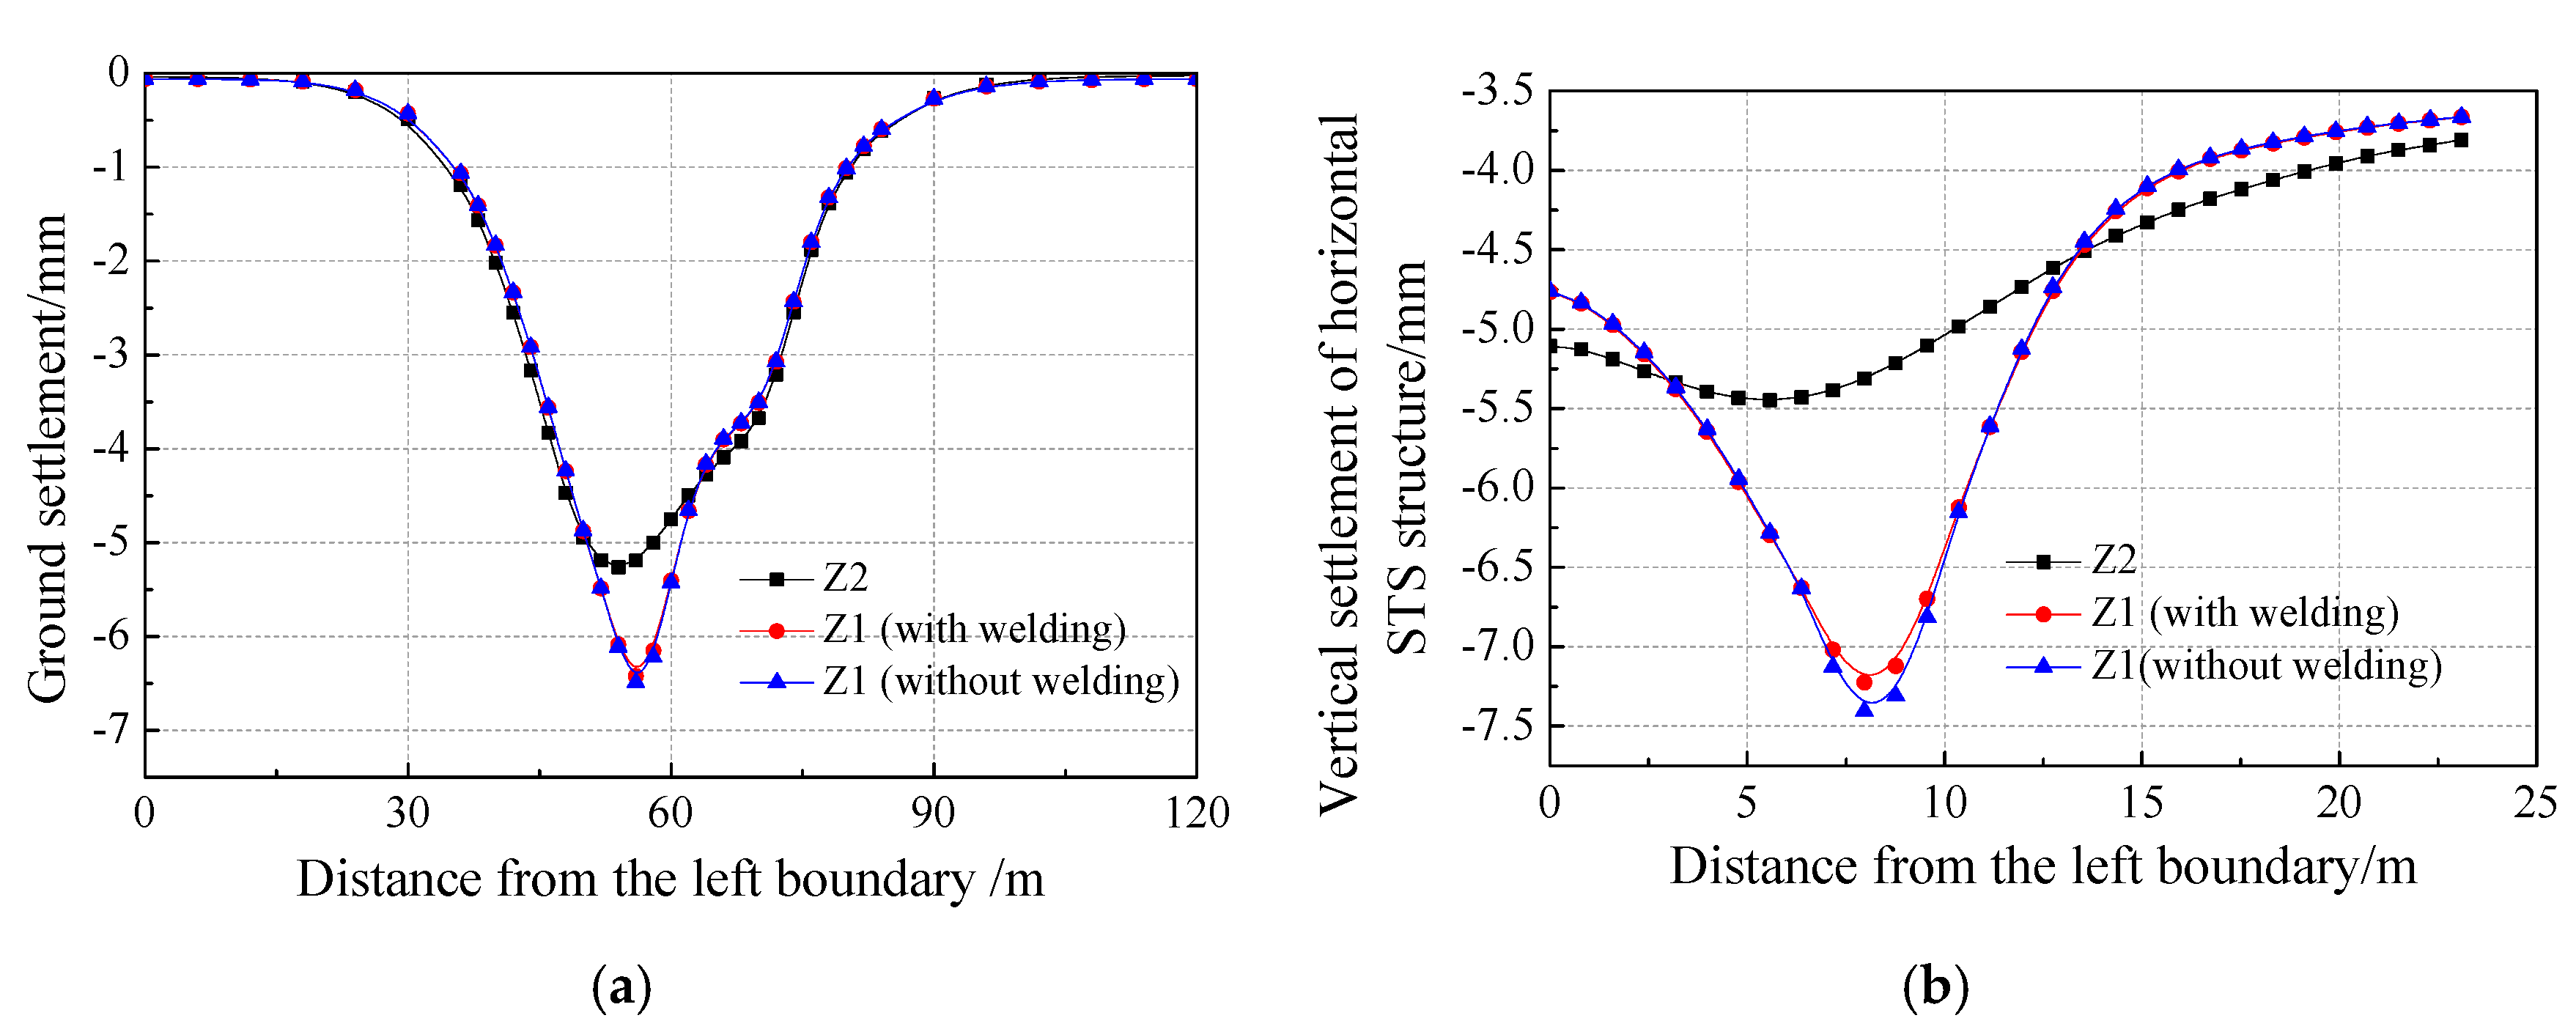
5.3.1. Surface Settlement

In accordance with the construction sequence of Northeastern Road subway station, the whole construction simulation was divided into 6 stages, as follows:
(1)
Stage 1: Construction of the side pilot tunnels Z5 and Z6;
(2)
Stage 2: Construction of the pilot tunnels Z1 and Z2 and cylindrical steel column C1;
(3)
Stage 3: Construction of the pilot tunnels Z3 and Z4 and cylindrical steel column C2;
(4)
Stage 4: Construction of the top plate at mid-span;
(5)
Stage 5: Construction of the station hall;
(6)
Stage 6: Construction of the platform layer.
The soil excavation was simulated in the subway construction stage, which causes stress redistribution of in the surrounding soil and surface settlement. A key point on the centerline of the cross-section, which is 15 m away from the initial excavation section was selected as the typical monitoring point, and the behavior of surface settlement is studied in the construction procedure. Comparison of surface settlements from in-situ monitoring and the numerical simulations is shown in Figure 24. As can be seen from the figure, the maximum ground settlement recorded in the site is around 12 mm occurred at the end of stage 5 of the construction. The ground uplift of 1.5 mm was observed after the platform layer is constructed mainly due to the heave of the soil under the supporting structure. Figure 25 shows a reasonable agreement between the field data and the numerical simulations given the complexity of the nature of the problem.
Based on the finite difference model (FDM) of the construction, the ground settlement profile at the end of each construction stage was obtained, as shown in Figure 26. The following observations can be made:
End of stage 1: The maximum monitored ground settlement is 2.2 mm, which accounts for around 20% of the maximum total ground settlement. Soil disturbance due to the construction of the side pilot tunnels are clearly seen.
End of stage 2: The total ground settlement is increased to 6.1 mm accounting for 33% of the maximum ground settlement. The maximum ground settlement is 2.5 mm due to the excavation of pilot tunnel Z2 and is 0.65 mm due to the excavation of pilot tunnel Z1. The maximum ground settlement increases 0.7 mm due to the construction of column C1 and excavation of soils surrounding it. The ground settlement due to the construction of pilot tunnel Z2 accounts for 65% of the ground settlement of this stage, indicating that the excavation of lower pilot tunnels results in a considerable portion of the ground settlement when STS pipe-roofing supporting system is used. The initial lining acts as supporting points for pipe-roof structure, which reduces the span of horizontal pipe-roofing system during the excavation of upper pilot tunnels. The large stiffness of the STS support system prevents large ground settlements.
End of stage 3: The cumulative ground settlement is 8.3 mm. The ground settlement increases 2.2 mm at this stage which accounts for around 20% of the maximum ground settlement. The contribution to the final ground settlement reduces in this stage compared to stage 2, most probably because the left side of supporting system is already complete and settled during the construction of stage 3, which reduces the effective lateral span of the pipe-roofing system, therefore increasing its rigidity, resulting in less ground settlement.
End of stage 4: The cumulative ground settlement is 11 mm. The ground settlement increases 2.7 mm in this stage, which accounts for 23% of the maximum ground settlement. The vertical loading is transferred to the beam and pile system due to the removal of the linings on the pilot tunnels, which is the cause of the settlement in this stage.
End of stage 5: The cumulative ground settlement is 11.6 mm, and the ground settlement increases 0.52 mm which accounts for 5.16% of the maximum ground settlement. The whole force bearing system is completed in this step, thus, the construction of the station hall has a little impact on total ground settlement.
End of stage 6: The ground heaves 1.5 mm because it occurs stress release after soil located in the platform layer is excavated and induces the behave of the supporting system and reflects to surface.

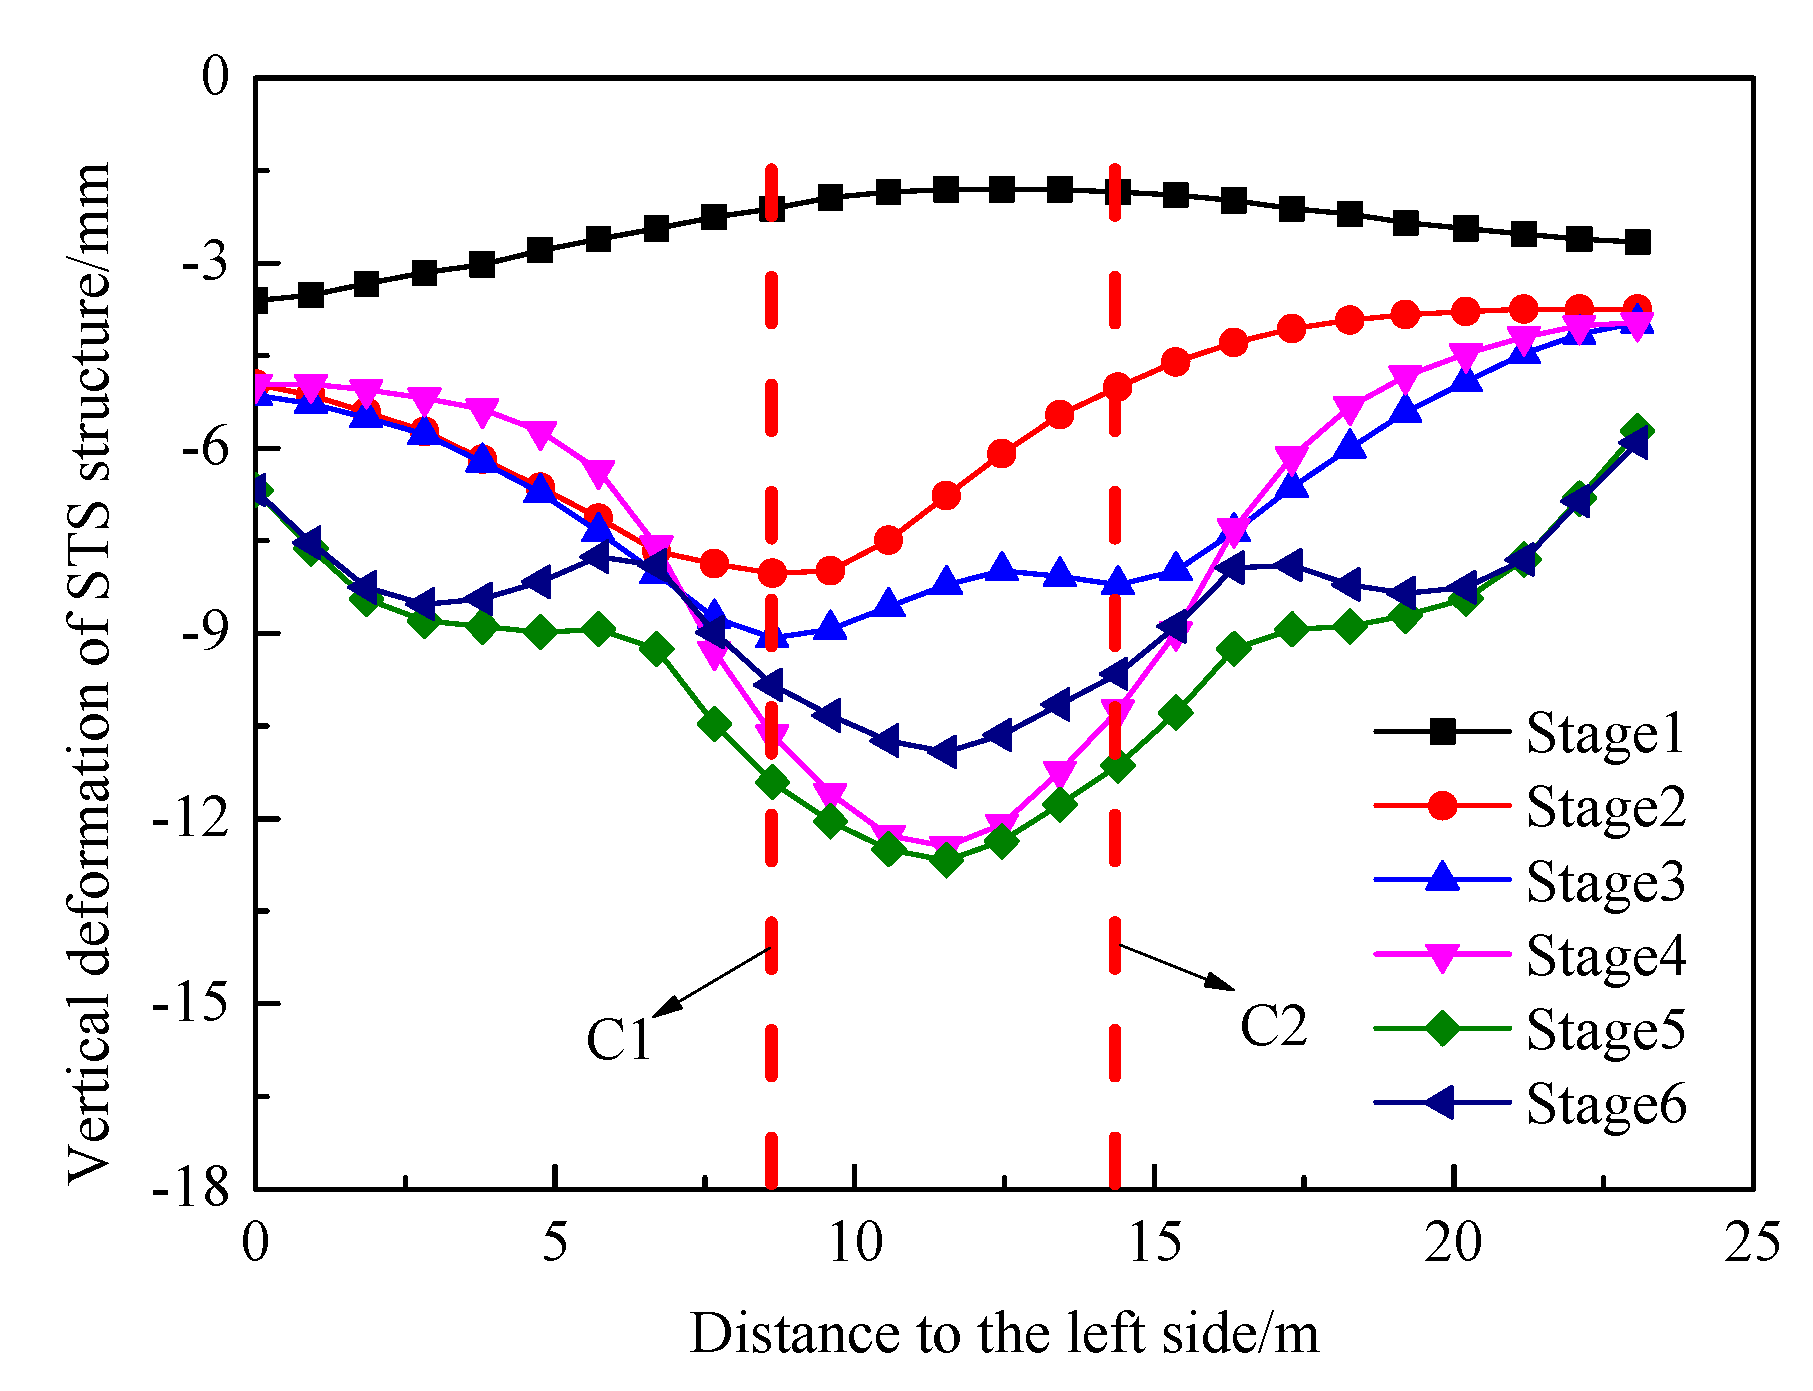
5.3.2. Deformation of the STS Structure

The stability of the STS structure directly influences the safety of the whole construction. Therefore, deformation of the STS structure in different excavation stages is discussed in the following.

Vertical Deformation of the Horizontal Section of the STS Structure

The deformation profile of the horizontal section of the STS structure is shown in Figure 27. Initial ground deformation is incurred by the excavation of the side tunnels (Z5 and Z6), and the deformation is larger at the ends of the horizontal section of the STS structure. The STS structure above pilot tunnel Z1 shows the largest deformation of about 5.9 mm. This is because the STS structure is unsupported along the whole span prior to the construction of column C1, resulting in a comparably large deflection in the STS structure when tunnel Z1 is completed.
The largest deformation of the STS structure is at the top of pilot tunnel Z3 with a deformation of about 3.3 mm during the construction of pilot tunnel Z3, Z4 and steel column C2. The deflection in the STS structure after stage 3 of the construction is not as pronounced as stage 2, given that the structure is now partly supported by column C1, as discussed previously. The largest deflection in the STS structure, which is 12.7 mm, happens when the soil is excavated, and the station hall is constructed.

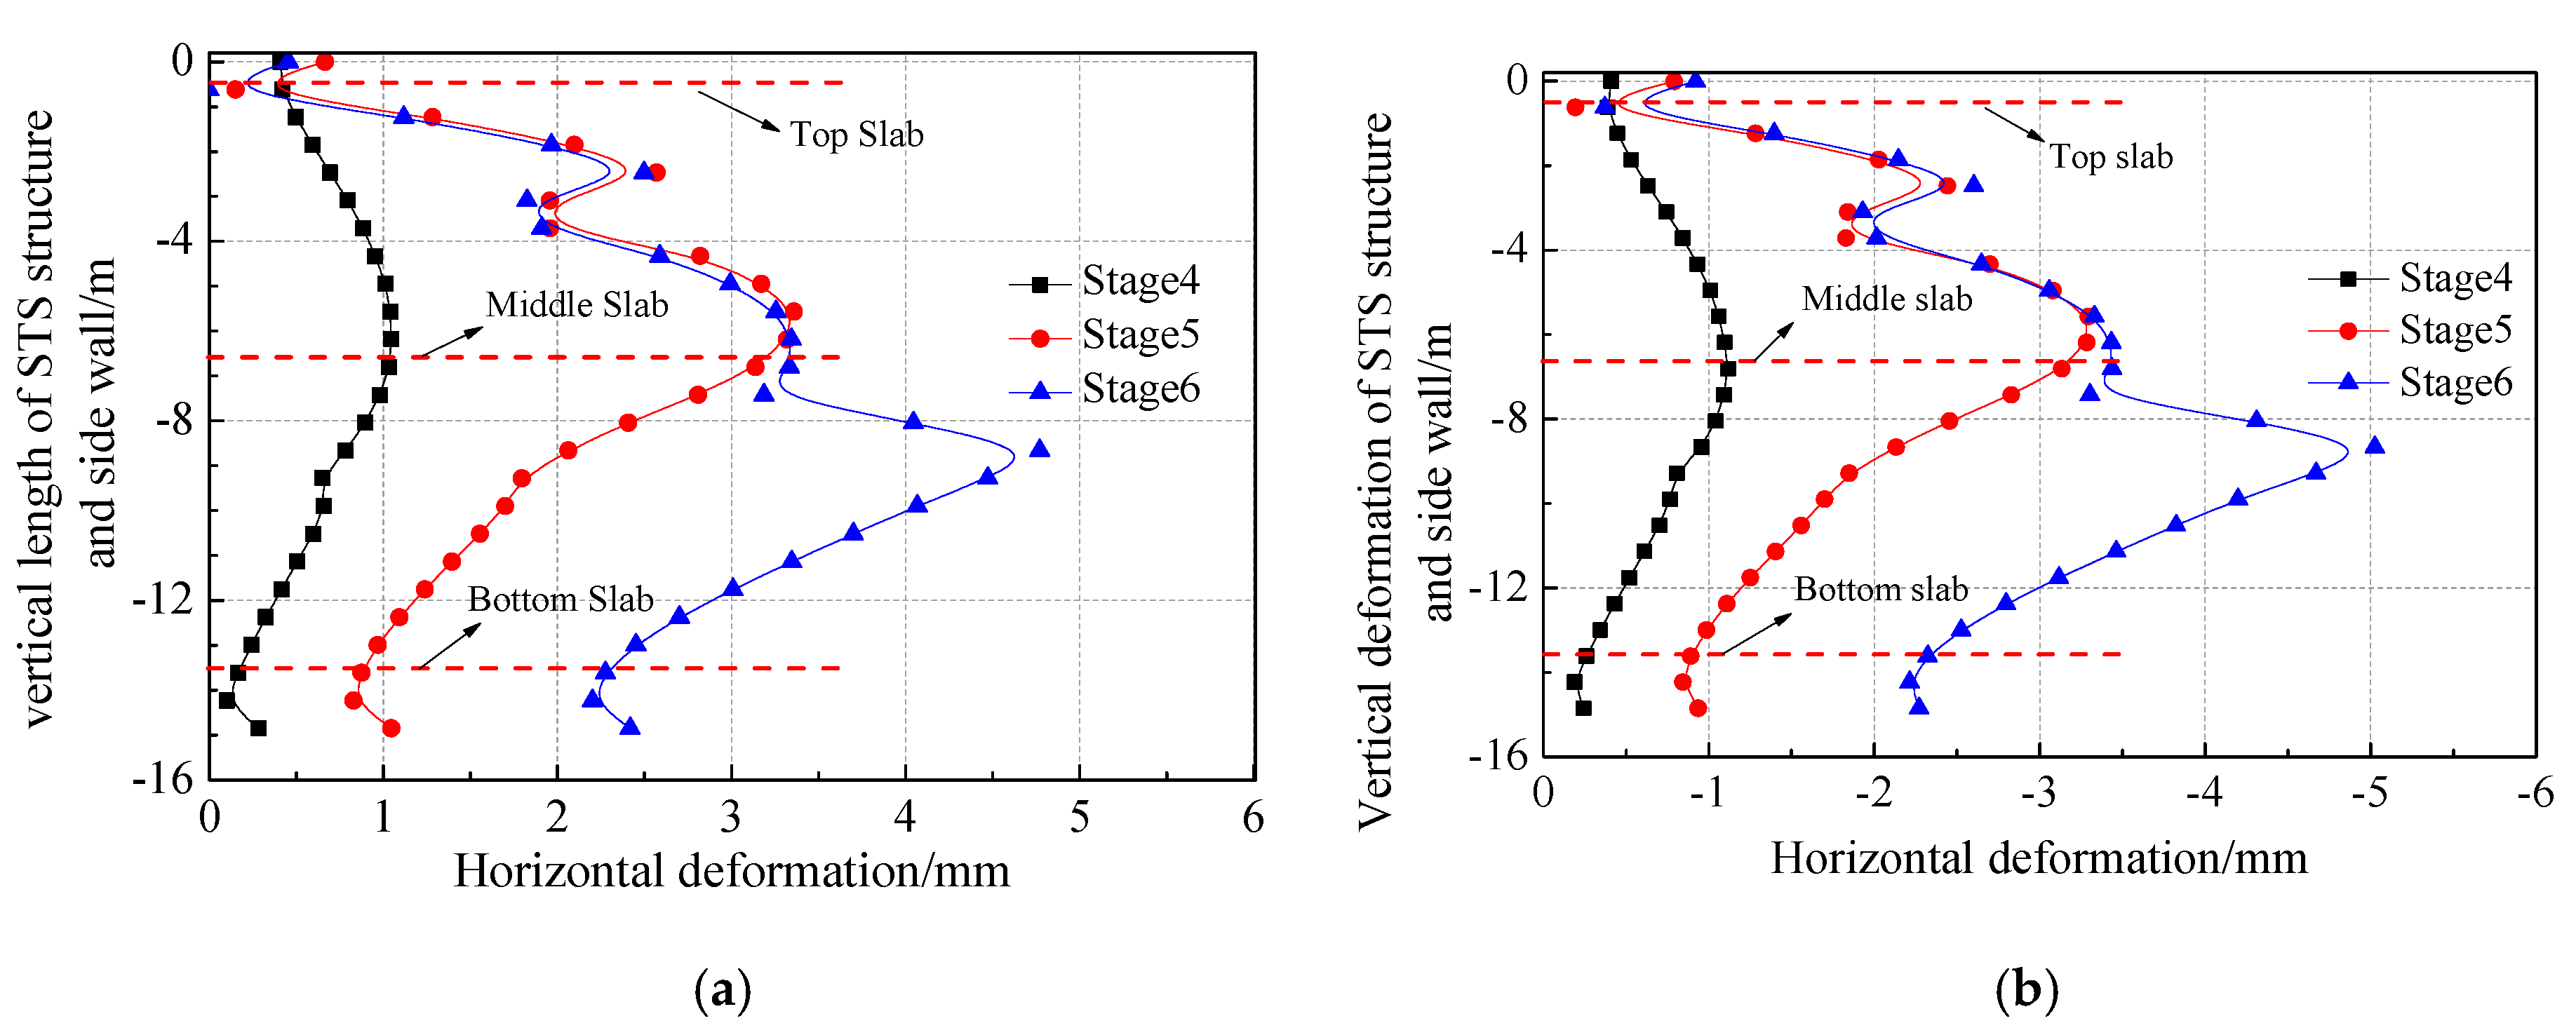
Horizontal Deformation of the Vertical Section of the STS Structure and the Side Walls

Figure 28 shows the horizontal deformation of the vertical section of the STS structure and the side walls at y = 15 m. The deformation profiles for both the right and left sections are almost identical, however, the right section shows slightly more deformation due to unsymmetrical nature of the construction sequence. The largest deformation of around 5 mm appears at the intersection of the right vertical section of the STS structure and the right-side wall, where a weak joint may have resulted in the large deformation. The largest horizontal deformation of the bottom of the side walls is 2.4 mm. After construction of the station hall, the largest deformation of STS structure is 3.4 mm, which occurs at the temporary braces. The three steps excavation is applied during the construction of the station hall, and when the first step is excavated the temporary braces were not installed in time, which may cause a large releasing of stress.

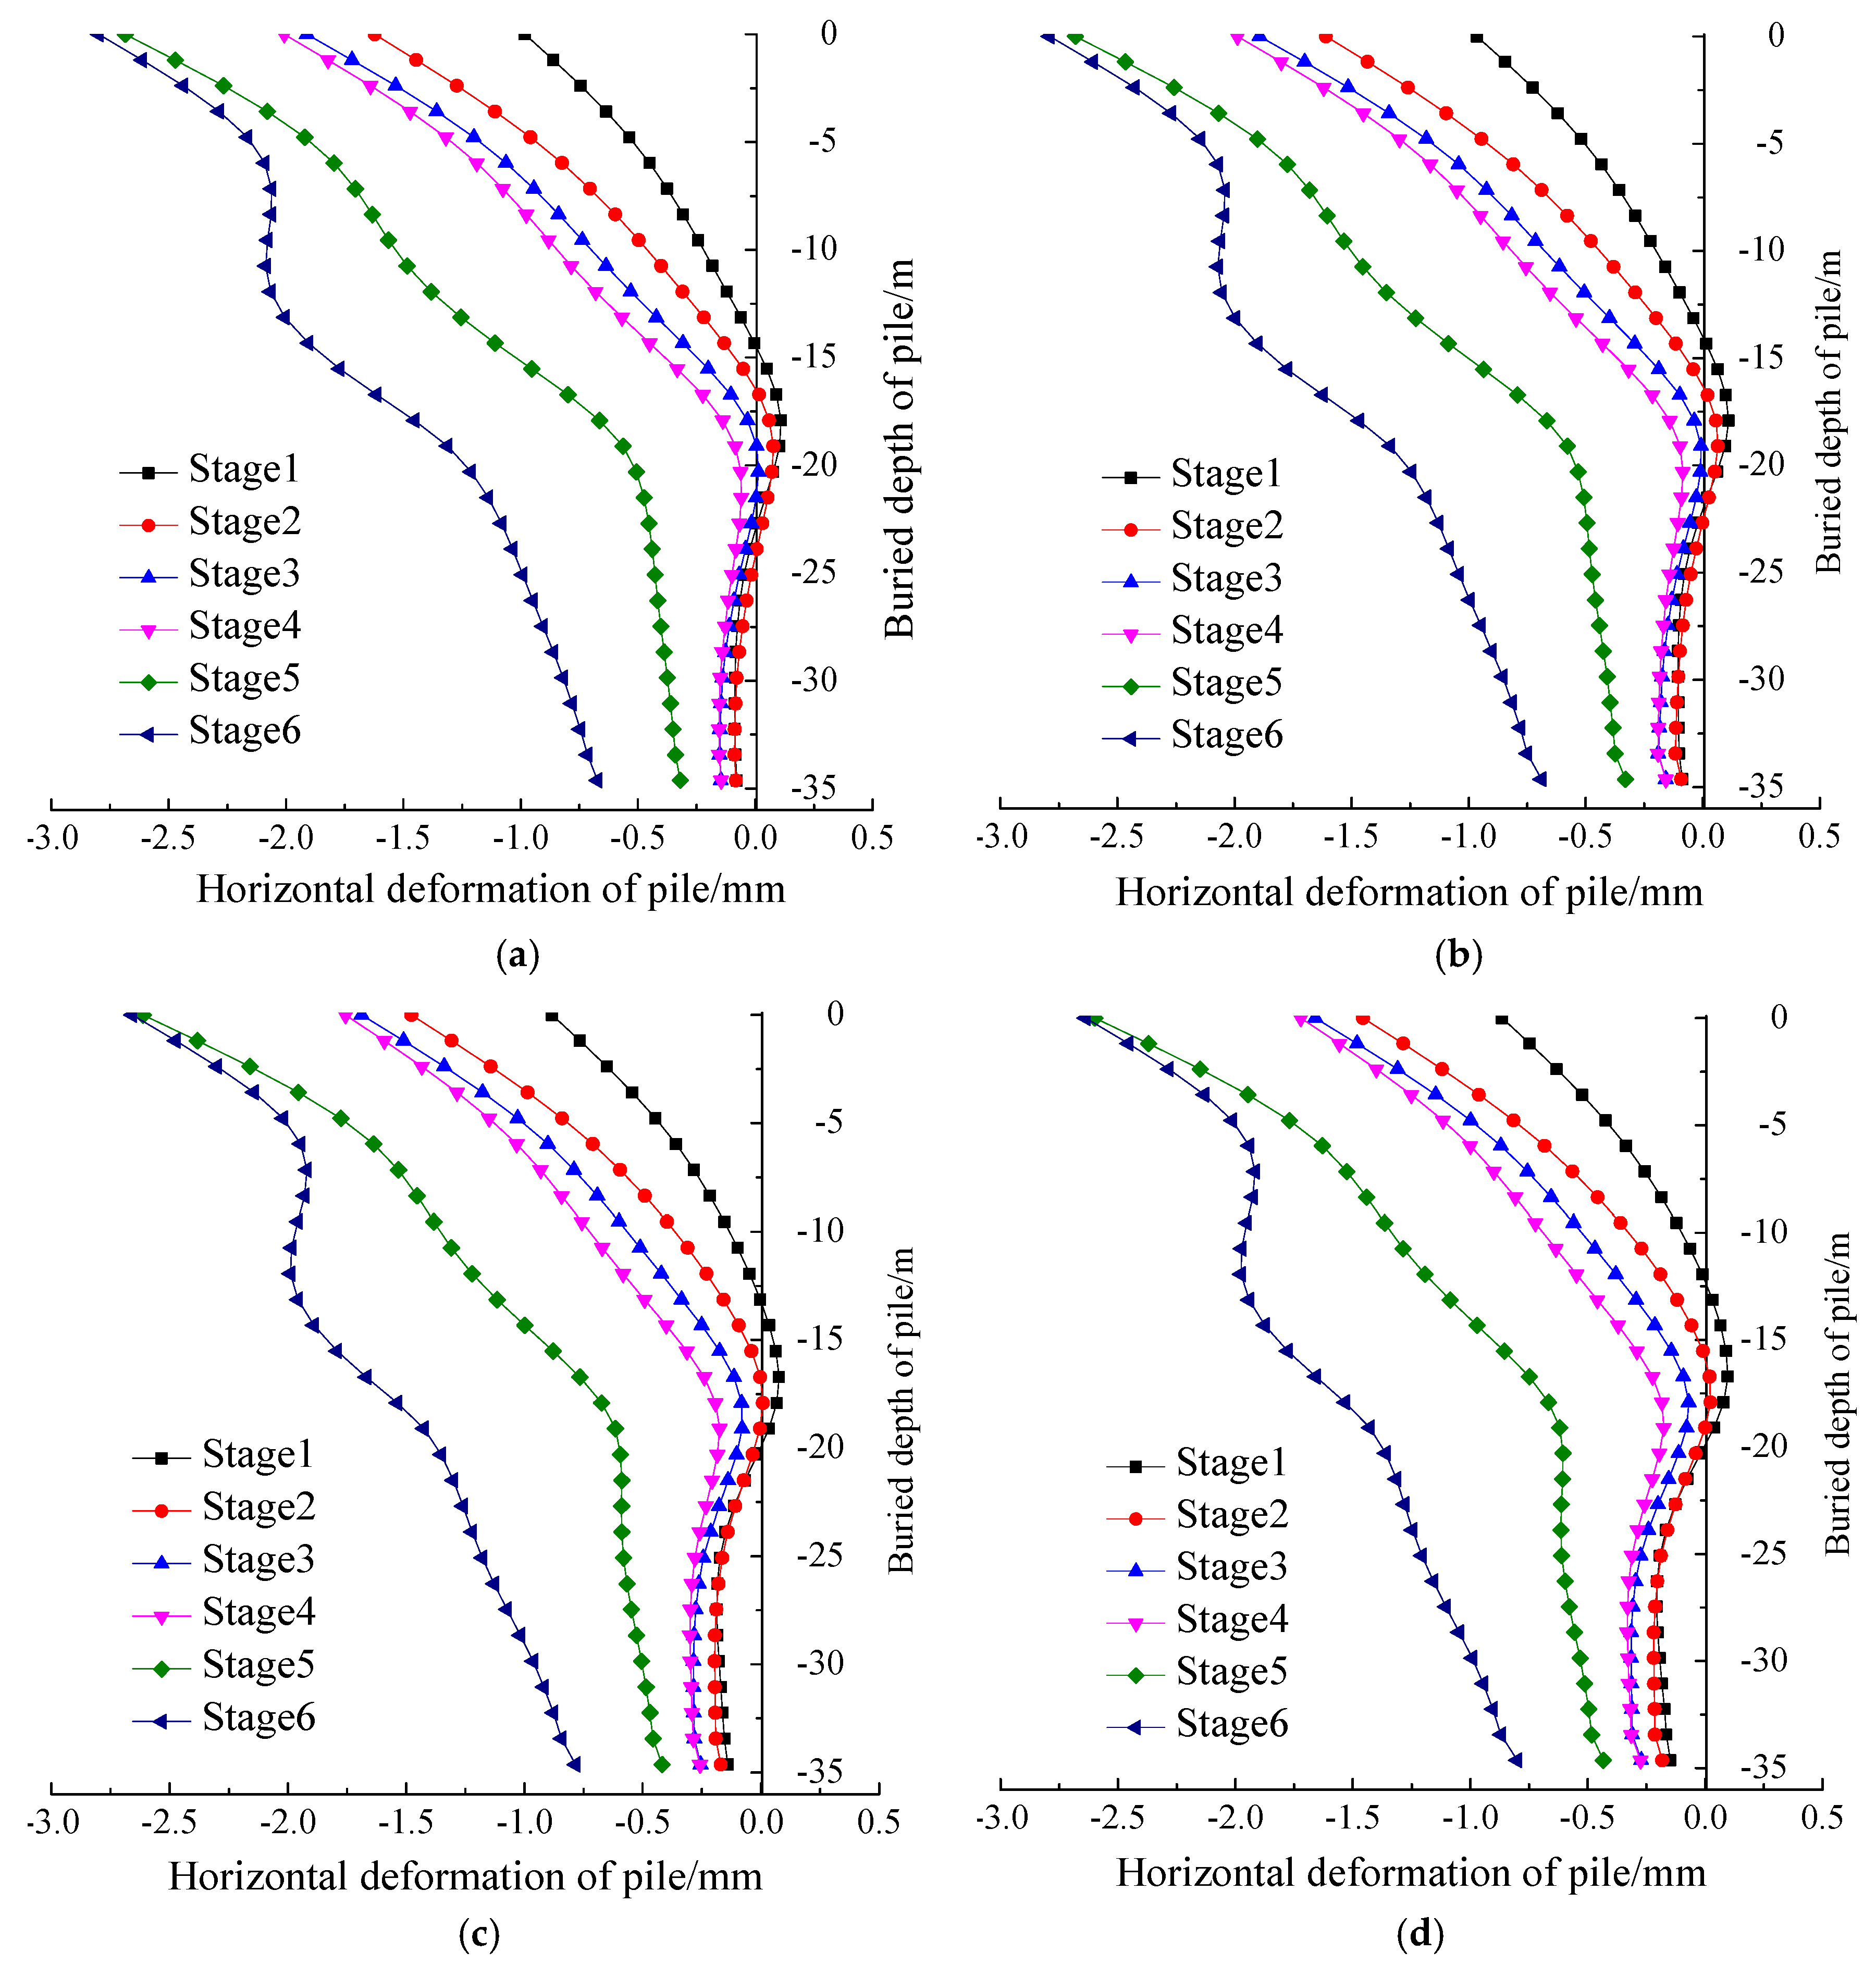
5.3.3. Horizontal Deformation of Bridge Piles

As shown in Figure 29, the horizontal deformation profile for all four bridge piles are almost the same, which indicates that it is not sensitive for time effect of construction compared to surface settlement, and showing a maximum deformation of around 3 mm. The support provide by the vertical sections of the STS system largely decreases the impact of construction on bridge piles. The largest horizontal deformation occurs at the top of the piles (around 3 mm), and the horizontal displacements at the bottom of the piles are almost negligible. The horizontal displacement of the bottom half of the bridge piles mainly occurs in the last two stages of the construction.

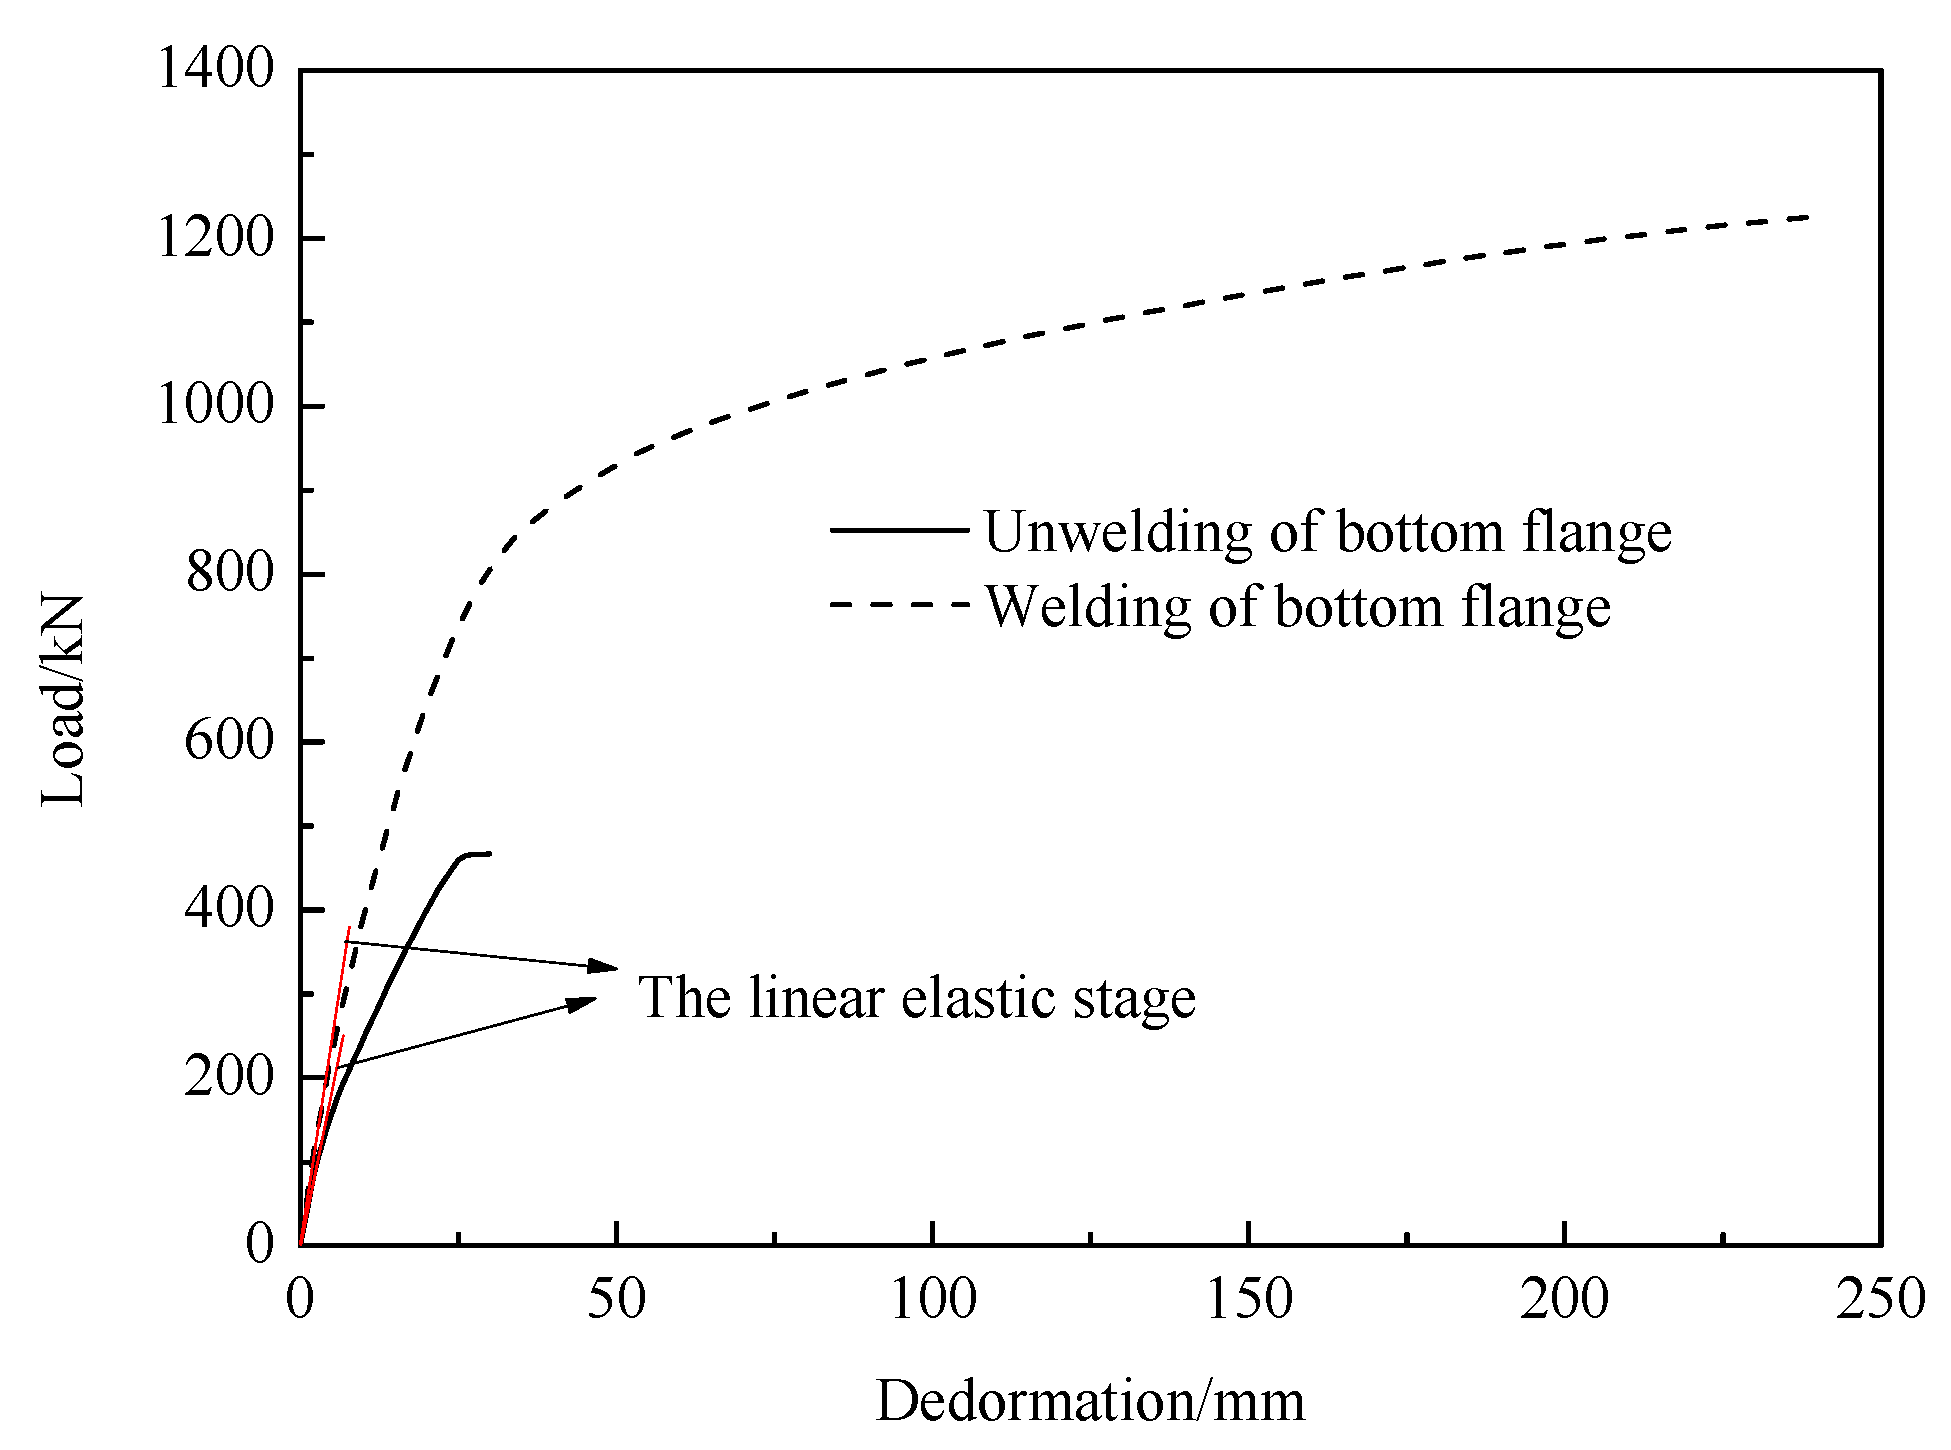
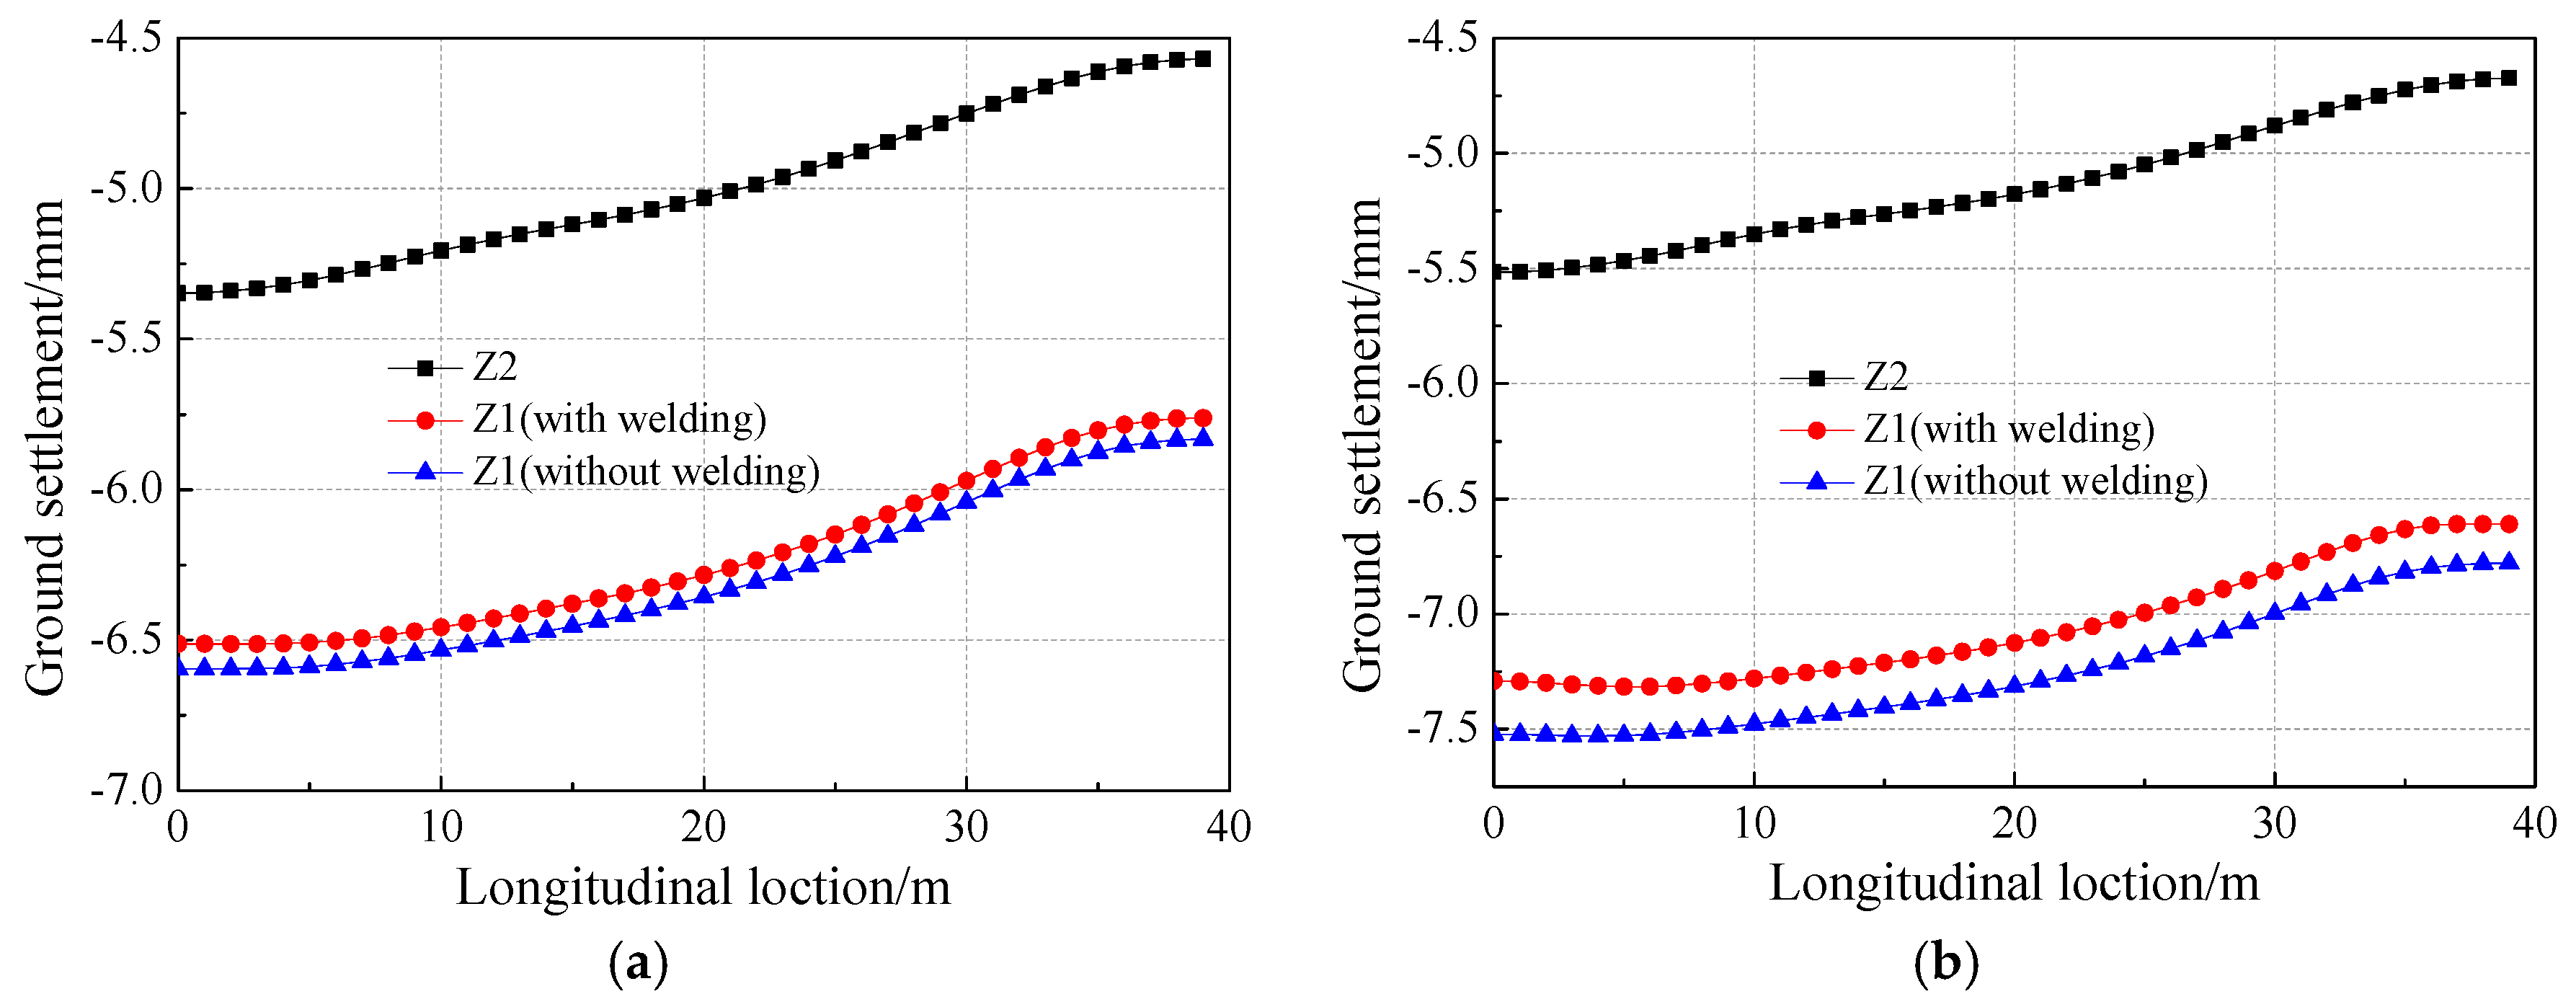
5.3.4. Effect of Welding of the Flange Plates in the STS Structure on Ground Settlement.

In their previous study, the authors have shown the importance of bottom flanges welding on the performance of STS structures through extensive experimental work [18,19]. In the construction of the Northwest Street station, the flanges at the free face of the STS structure were welded timely after soil excavation as shown in Figure 30a. In this section, the effect of the welding of the flanges are investigated on the performance of the STS structure in the station construction using the numerical simulations. As discussed before and shown in Figure 30b, the STS structure is simulated as a composite of two different materials. The STS structure with or without welding of the flanges can be simulated by appropriately adjusting the material properties of the composite system as discussed earlier in the paper. The impact of welding of the flanges in the STS system on the ground displacement is studied by simulating different welding conditions for the upper left pilot tunnel (Z1).
The settlement profile for the crown of Z1 and Z2 tunnels, and after the bottom (Z2) is completed, the ground with and without welding of the flanges are shown in Figure 31 and Figure 32 for the section at y = 15 m. The ground settlement above the pilot tunnel Z1 increases around 1.3 mm with the welding of flanges during the excavation, and the ground settlement increases 1.35 mm without welding of the flange, increasing 5.47%. The crown settlement of the pilot tunnel Z1 also shows only a slight decrease (from 2.1 mm to 1.9 mm) when flanges are welded. It can be concluded that the welding of flanges during the excavation of the upper pilot tunnel Z1 has little impact on the settlement of the whole structure.

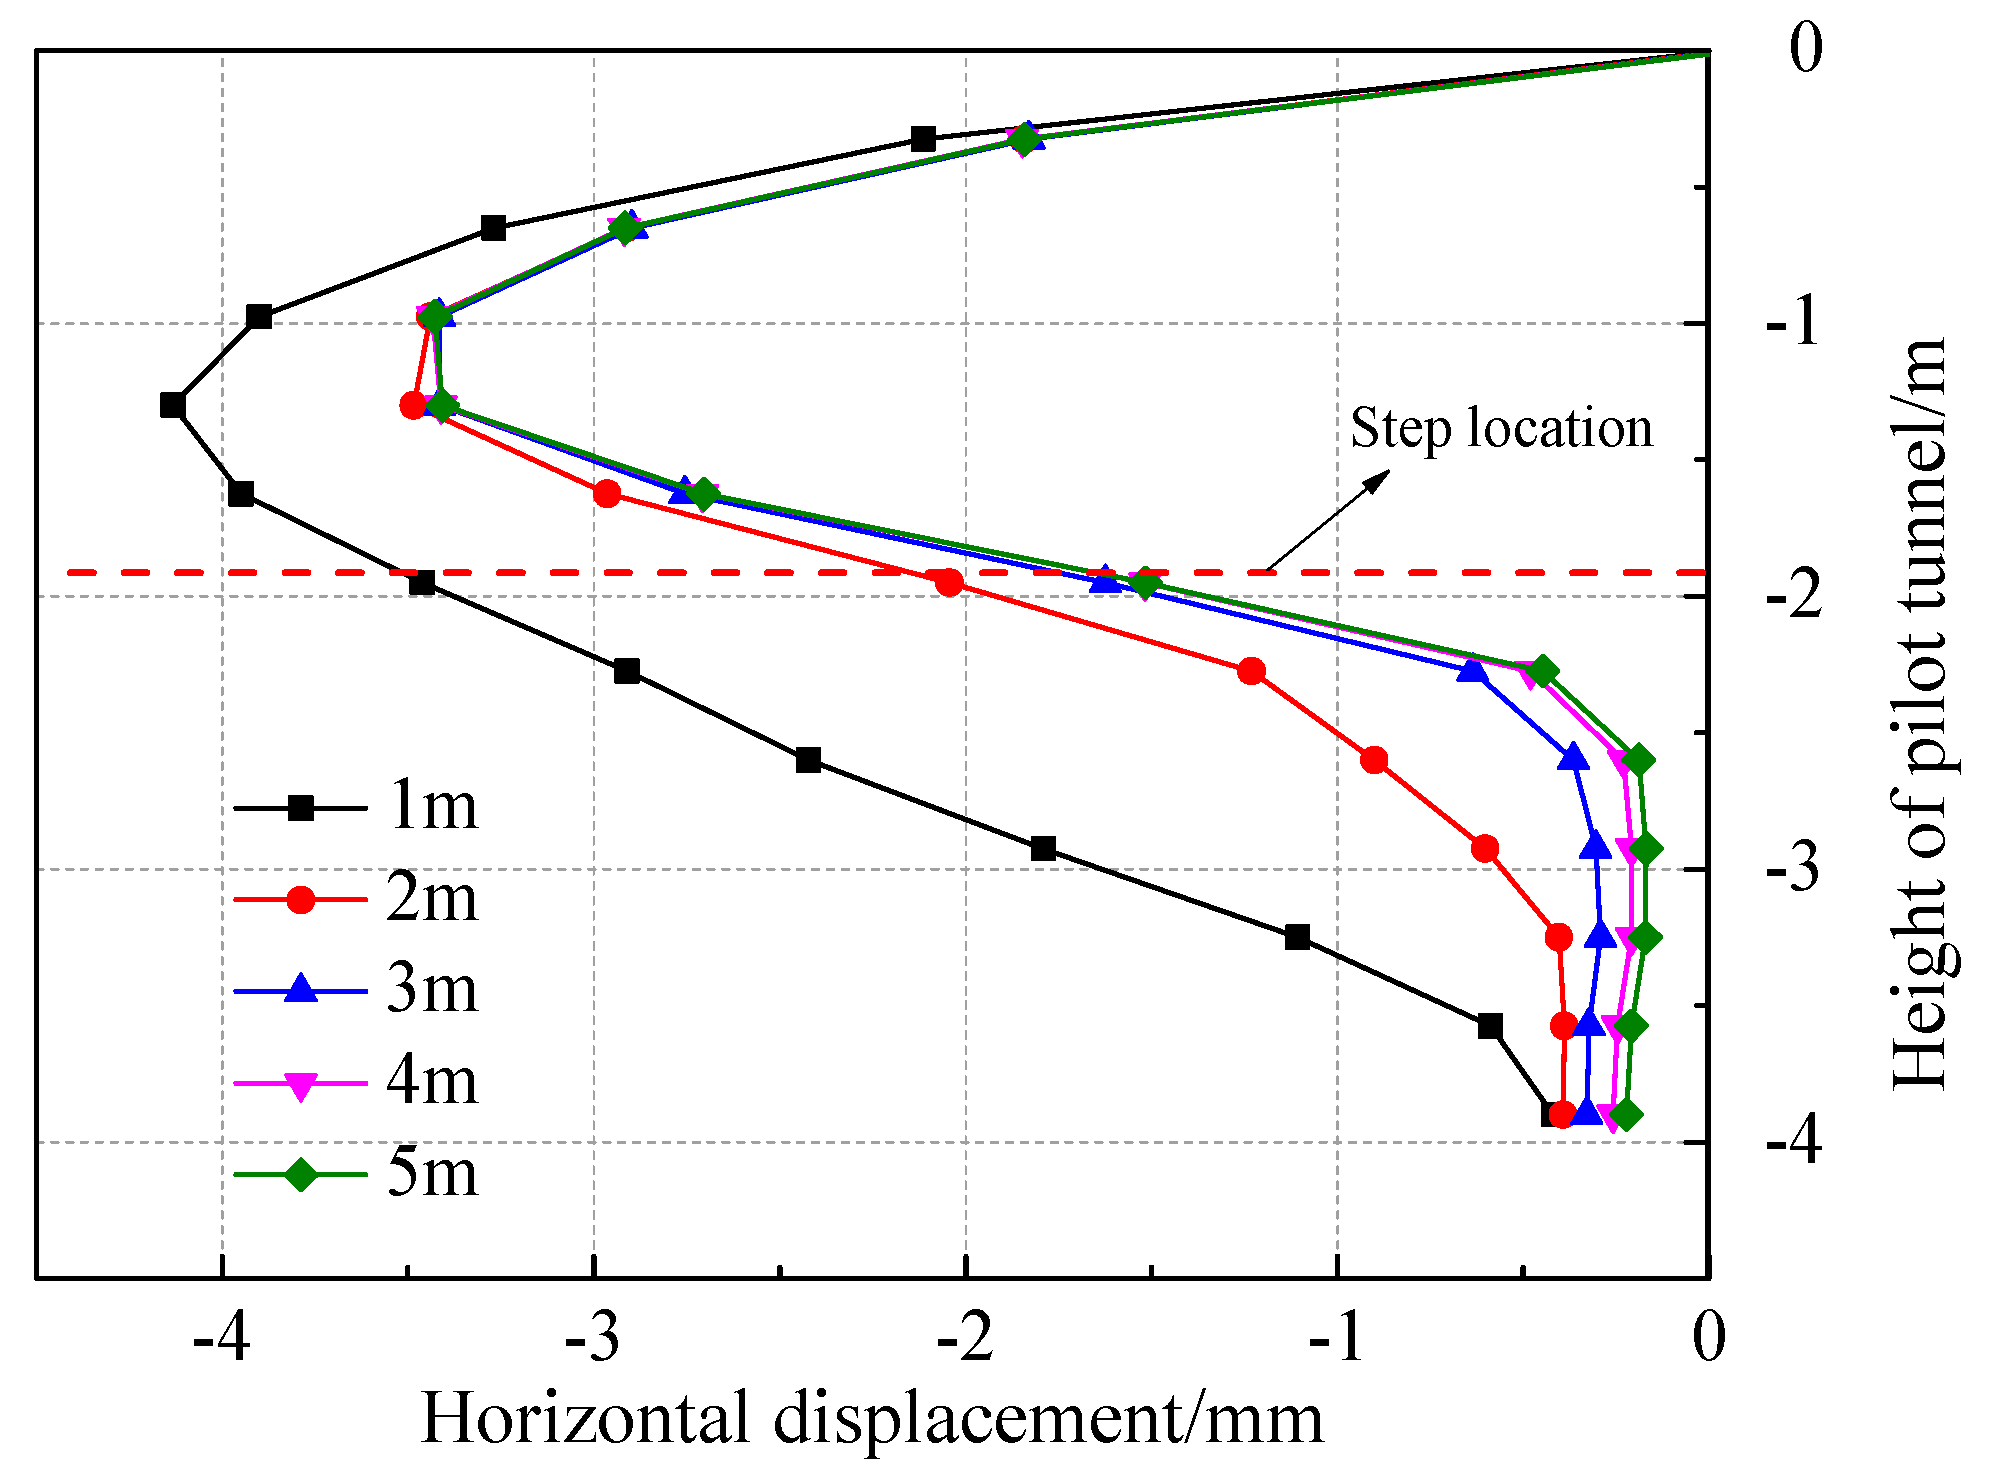
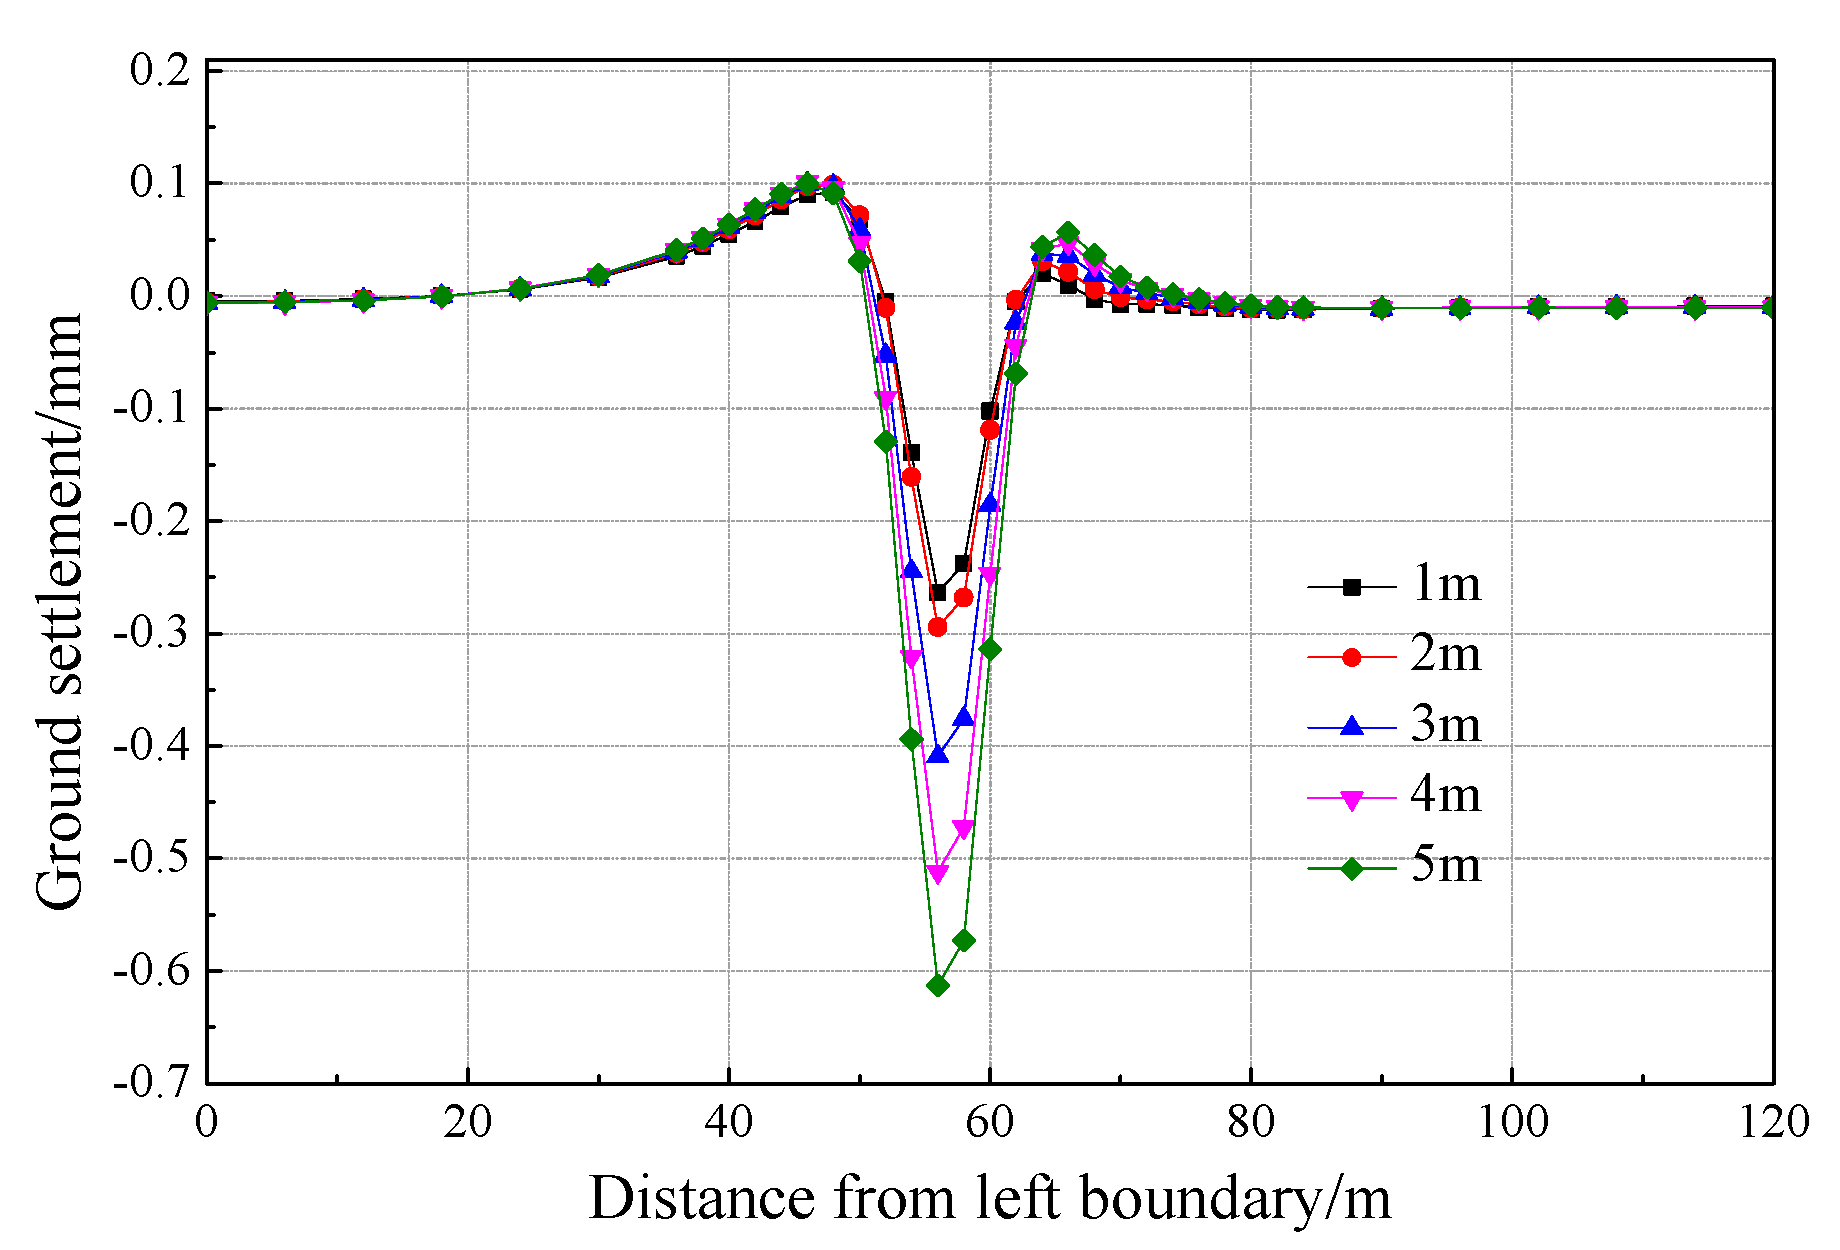
5.3.5. Impact of the Step Length in the Construction of the Pilot Tunnels

Different step lengths of 1 m, 2 m, 3 m, 4 m and 5 m were selected to investigate the impact of the excavation step length on the stability of the excavation face, and also on the final surface settlement and crown settlement. The height of each step is half of the pilot tunnel diameter.
(1) Stability analysis of excavation face
The stability of the excavation face must be considered in tunnel construction. Pilot construction supported by STS structure is different from other arching excavation face. Considering the bottom tunnel pilots (Z1 and Z3) satisfy the symmetry, the tunnel pilot (Z1) is listed as an example to investigate the stability of top pilot tunnel in this section.
The horizontal displacement of the excavation face in the pilot tunnel Z1 is shown in Figure 33. When the step length is 3 m, the maximum horizontal displacement is 3.4 mm which occurs slightly lower than the center of the upper step section. The displacements decrease gradually with the increase of step length. When the step length is larger than 3 m, the step length has a little effect on the displacement of the excavation face. The numerical results indicate that sliding between upper and lower steps may happen when the step length is less than 3 m. The numerical results highlight the importance of adopting an appropriate step length in the stability of the excavation face. Based on the results of the numerical analysis, it seems that one tunnel diameter, which is 3 m in the case of this simulation, is appropriate for this purpose. Although larger step lengths will also have similar face displacements, they may result in larger ground settlement due to the delay they cause in installation of the initial supports of the tunnel.
(2) Ground Settlement
Monitoring points were installed on the crown of the pilot tunnel Z1 in longitudinal direction at y = 20 m in order to investigate the impact of step length on ground settlement.
In this section, the effect of different step lengths on the ground settlement and crown settlement at cross section with y = 20 m is investigated through the numerical simulations, and the ground settlement profile and crown settlement profile are showed in Figure 34 and Figure 35.
As seen from Figure 33 and Figure 34, the step length has great influence on the ground and tunnel crown settlement above the excavation face. The ground settlement increases with the increase of step length. This is because when the step length is large, it is hard to effectively control the settlement because the ring supports can only be installed when both steps of the excavation are completed. The small local heaves observed in the ground settlement profiles are mainly due to the negative moment created at the end of the horizontal section of the STS system due to settlements of the middle section of the STS system. As shown in Figure 35, larger stage length can cause more crown settlement, appropriate step length must be selected so that the support rings can be quickly installed and the ground settlements can be controlled.

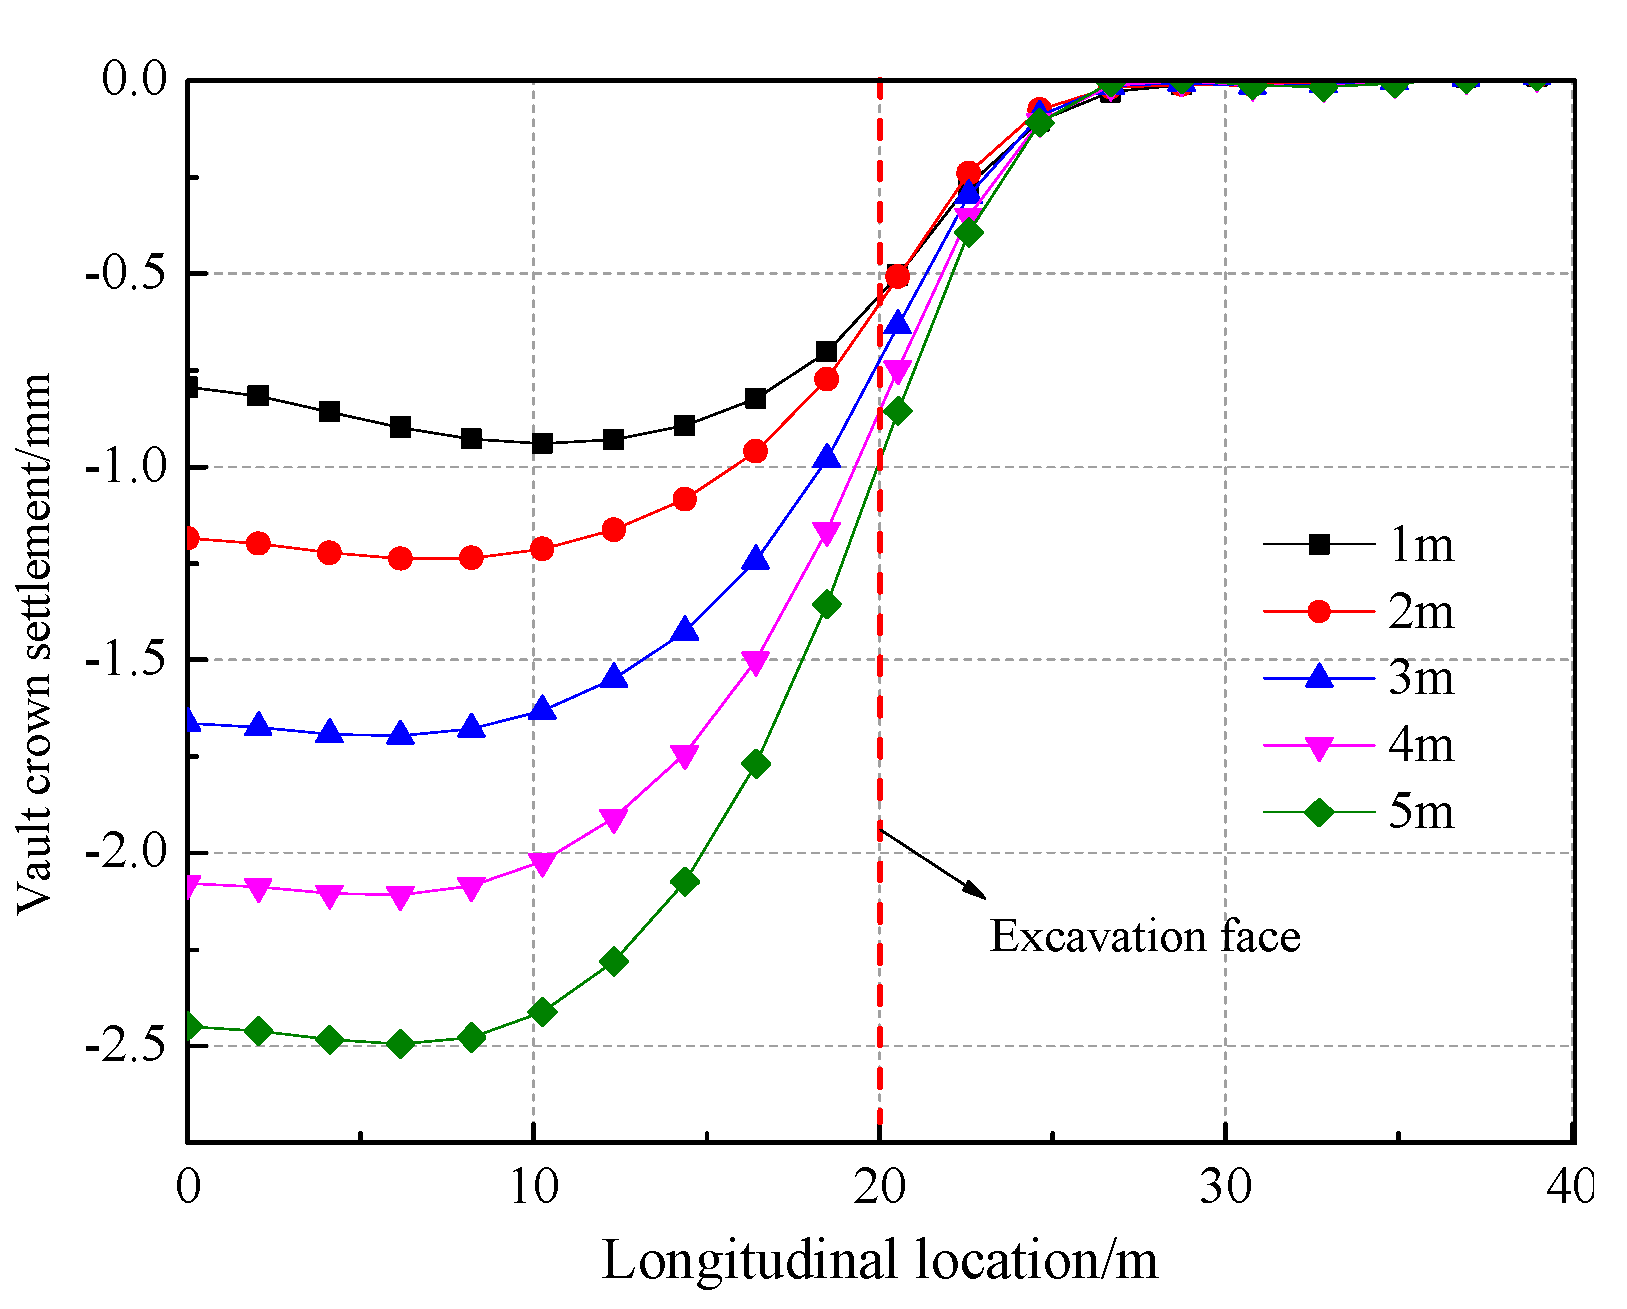
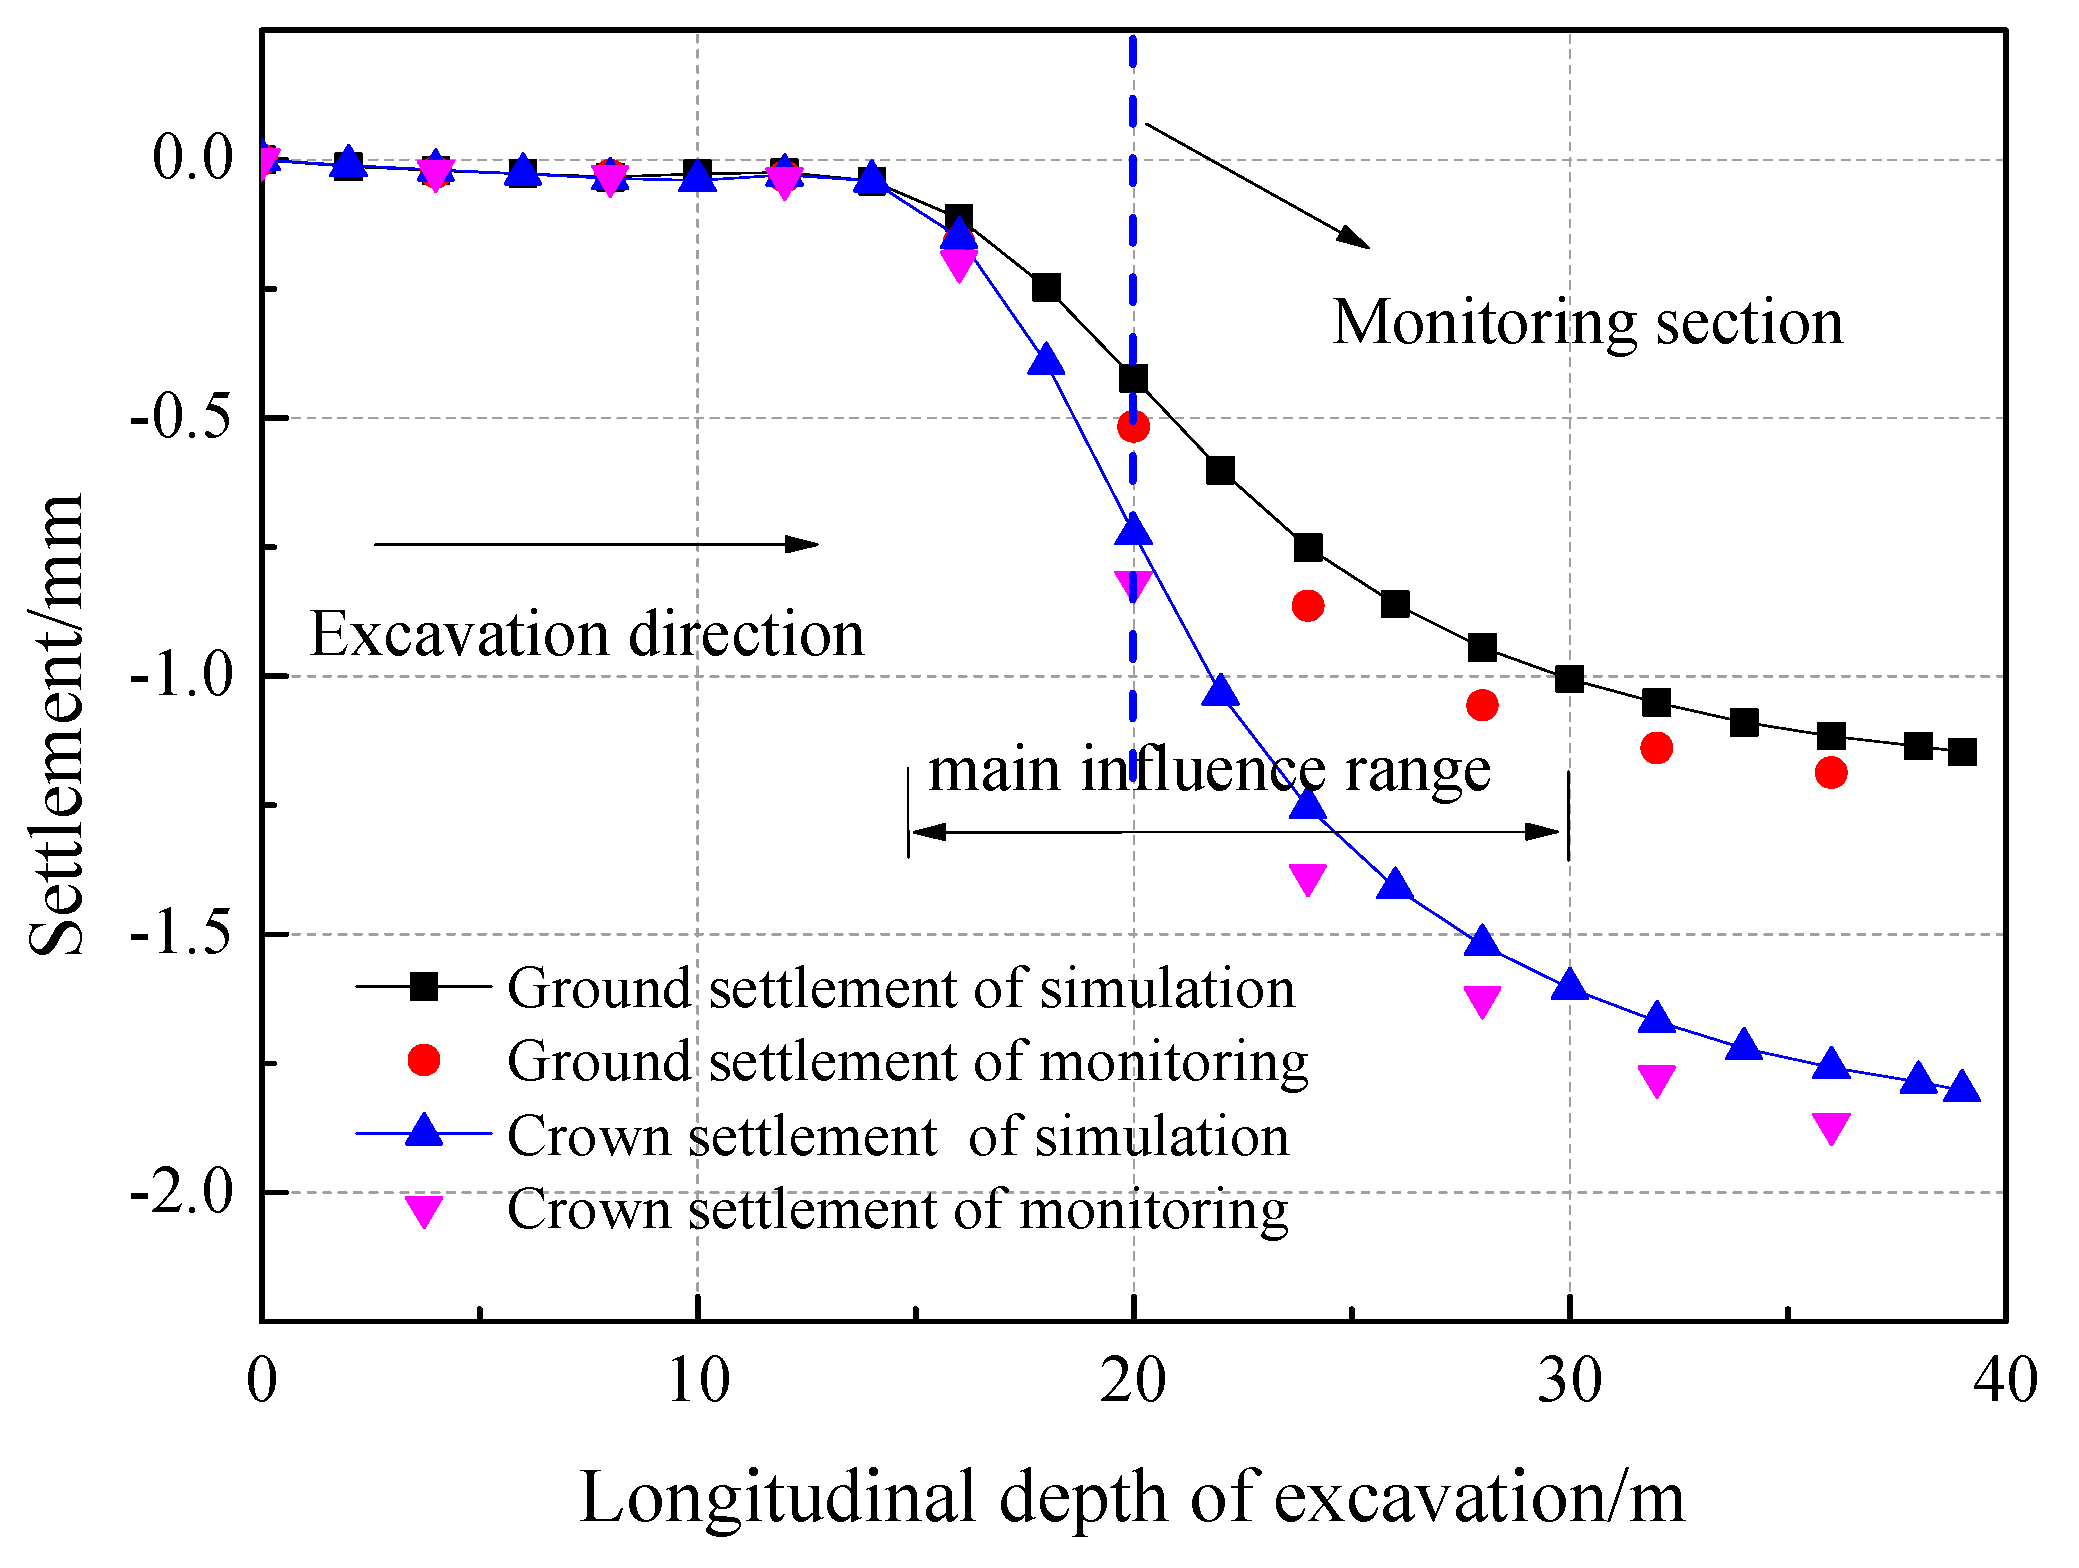
5.3.6. Longitudinal Displacement Profile of the Pilot Tunnel

The longitudinal displacement profile (LDT) of the pilot tunnel Z1 is investigated here. The step length is assumed 3 m in the numerical simulations in accordance to what was used in the site.
As for the ground and the crown of the pilot tunnel, the simulation and monitoring value show similar settlement profiles when pilot tunnel Z1 is excavated, and the largest difference of both is within 10%, as shown in Figure 36. The maximum settlement of ground is no more than 1.25 mm, and the crown settlement is less than 2.0 mm. Settlements are noticeable only for sections that are more than 15 m away from the initial face of the tunnel, and the settlement tends to be a constant when the excavation face exceeds the longitudinal length of 30 m. So, the main influence range is before 5 m and after 10 m of the monitoring section in settlement.

6. Conclusion

A new pre-supporting system, Steel Tube Slab (STS) for construction of large-span underground spaces is presented. The conclusions are as follows.
(1) Steel Tube Slab (STS) structure used in large span underground excavation with shallow depth can effectively control and reduce the surface settlement and can prevent the impact of soil excavation on adjacent buildings. The STS structure acts as the initial supporting system during the excavation stages and can increase the stiffness of the whole construction system. So, it reduces the final ground surface settlement and the deformation of the existing building.
(2) Choosing the reasonable step length can be an effective way to control the ground surface settlement. It will not only control the slipping of excavation face and longitudinal displacement, but also can close into a ring as soon as possible, which will control the ground settlement effectively.
(3) STS structure is a permanent supporting system, so it is more dependable and serviceable during its service period. STS structure simplifies the force mechanism in the initial supporting system which causes less construction sequences and reduces the engineering cost.
(4) It can be concluded that STS structure can be a very dependable and effectively method in controlling and reducing the surface settlement and the influence of the construction sequence on the existing building, especially as for the large span and ultra-shallow underground structures.

Author Contributions

Concepts and designs (P.-j.J. and W.Z.); Monitoring analysis (Y.C.); Data were analyzed and simulation results (P.-j.J. and S.-g.L.); Numerical simulation (J.-y.H. and J.-c.D.).

Acknowledgments

The authors would like to thank Northeastern University and The University of New South Wales in providing the access to the software and other facilities, and thank Arman Khoshghalb for his kind help in the research contents, analyses and the English language and style of the manuscript. The research described in this paper was supported by the Fundamental Research Funds for the Central Universities (Grant No. N160106006), the National Natural Science Foundation of China (Grant No. 51578116) and China Scholarship Council. These supports are gratefully acknowledged. And the data is available for the journal.

Conflicts of Interest

The authors declare no conflict of interest.

References

  1. Sadaghiani, M.H.; Dadizadeh, S. Study on the effect of a new construction method for a large span metro underground station in Tabriz-Iran. Tunn. Undergr. Space Technol. 2010, 25, 63–69. [Google Scholar] [CrossRef]
  2. Anastasopoulos, I. Building damage during nearby construction: Forensic analysis. Eng. Fail. Anal. 2013, 34, 252–267. [Google Scholar] [CrossRef]
  3. Peck, R.B. Deep Excavation and Tunneling in Soft Ground. In Proceedings of the 7th International Conference on Soil Mechanics and Foundation Engineering, Balkema, Mexico, July 1969. [Google Scholar]
  4. O’reilly, M.P.; New, B.M. Settlement above tunnels in the United Kingdom—Their magnitude and prediction. Tunnelling 1982, 82, 173–181. [Google Scholar] [CrossRef]
  5. Novozhenina, S.U.; Vystrchila, M.G. New method of surface settlement prediction for saint-petersburg metro escalator tunnels excavated by EPB TBM. Procedia Eng. 2016, 150, 2266–2271. [Google Scholar] [CrossRef]
  6. Kivi, A.V.; Sadaghiani, M.H.; Ahmadi, M.M. Numerical modeling of ground settlement control of large span underground metro station in Tehran Metro using Central Beam Column (CBC) structure. Tunn. Undergr. Space Technol. 2012, 28, 1–9. [Google Scholar] [CrossRef]
  7. Coller, P.J.; Abbott, D.G. Microtunneling Techniques to Form an Insitu Barrier around Existing Structures. In High Level Radioactive Waste Management, Proceedings of the Fifth Annual International Conference, Las Vegas, NV, USA, 22–26 May 1994; American Society of Civil Engineers: Reston, VA, USA, 1994. [Google Scholar]
  8. Musso, G. Jacked pipe provides roof for underground construction in busy urban area. Civ. Eng. 1979, 49, 79–82. [Google Scholar]
  9. Ire, H. Tubular trust jacking for underground roof construction on the Antwerp Metro. Tunnelling 1985, 5, 13–15. [Google Scholar]
  10. Wang, H. Optimization of pipe roof reinforcement applied in tunnel construction under complex conditions. Electron. J. Geotech. Eng. 2012, 17, 301–310. [Google Scholar]
  11. Yamazoyi, T.; Yomura, J.; Takahara, Y.; Ikeda, T.; Fujita, Y. Construction work in Hio section of Kainan route of Kinki Expressway: Large diameter box culvert jacking work by ESA method. Civ. Constr. 1991, 32, 17–28. [Google Scholar]
  12. Kaneke, M.; Sibata, Y.; Katou, K. The construction of large section tunnel under highway using FJ method in Oosawa Narita Line. Civ. Constr. 2003, 41, 2–9. [Google Scholar]
  13. Yasuhisa, B. Construction methods of the structures passing through under railway lines. Jpn. Railw. Eng. 1987, 4, 6–9. [Google Scholar]
  14. Jeon, H.T.; Kim, Y.H.; Kim, S.K. The construction of Lot 923 subway station using the trenchless TRCM (Tubular Roof Construction Method). Harmony Nat. Civiliz. 2007, 55, 39–47. [Google Scholar]
  15. Lee, W.G.; Lee, S.B.; Lee, R.C. A study on the damage reinforcement of gallery pipes under the ground subjected to various railway loads. J. Korean Soc. Railw. 2004, 9, 277–282. [Google Scholar]
  16. Yao, D.J.; Wu, Z.H.; Zhang, Y.H. Design and analysis of pipe roofing method in soft clay. Chin. J. Rock Mech. Eng. 2004, 23, 4999–5005. [Google Scholar]
  17. Zhu, H.H.; Yan, Z.G.; Li, X.Y.; Liu, X.Z.; Shen, G.P. Analysis of construction risks for pipe-roofing tunnel in saturated soft soil. Chin. J. Rock Mech. Eng. 2005, 24, 5549–5554. [Google Scholar]
  18. Li, Y.S.; Zhang, K.N.; Huang, C.B. Analysis of surface subsidence of tunnel built by pipe-roof pre-construction method. Rock Soil Mech. 2011, 32, 3701–3706. [Google Scholar]
  19. Zhang, P.; Ma, B.S.; Zeng, C.; Xie, H.M.; Li, X.; Wang, D.W. Key techniques for the largest curved pipe jacking roof to date: A case study of Gongbei tunnel. Tunn. Undergr. Space Technol. 2016, 59, 134–145. [Google Scholar] [CrossRef]
  20. Kang, Y.S.; Liu, Q.S.; Cheng, Y.; Liu, X.Y. Combined freeze-sealing and New Tubular Roof construction methods for seaside urban tunnel in soft ground. Tunn. Undergr. Space Technol. 2016, 58, 1–10. [Google Scholar] [CrossRef]
  21. Gou, D.M.; Yang, J.S.; Zhang, G. Deformation monitoring and mechanical behaviors of pipe-roof in shallow tunnels. Chin. J. Rock Mech. Eng. 2007, 26, 1258–1264. [Google Scholar]
  22. Zhao, W.; Jia, P.J.; Wang, L.G.; Guan, Y.P.; Li, S.G.; Zhao, Z. Experimental study on the flexural capacity of steel tube slab members of subway station. Eng. Mech. 2016, 33, 167–176. [Google Scholar]
  23. Guan, Y.P.; Zhao, W.; Li, S.G.; Zhang, G.B. Key techniques and risk management for the application of the Pile-Beam-Arch (PBA) excavation method: A case study of the Zhongjie subway station. Sci. World J. 2014, 7, 1–16. [Google Scholar] [CrossRef]
  24. Liu, X.R.; Liu, Y.Q.; Qu, W.B.; Tu, Y.L. Internal force calculation and supporting parameters sensitivity analysis of side piles in the subway station excavated by Pile-Beam-Arch method. Tunn. Undergr. Space Technol. 2016, 56, 186–201. [Google Scholar] [CrossRef]
  25. Hemerijckx, E. Tubular thrust jacking for underground roof construction on the Antwerp Metro Part 2. Tunn. Tunn. Int. 1983, 15, 27–30. [Google Scholar]
  26. Hisatake, M.; Ohno, S. Effects of pipe roof supports and the excavation method on the displacements above a tunnel face. Tunn. Undergr. Space Technol. 2008, 23, 120–127. [Google Scholar] [CrossRef]
  27. Xin, X.; Zhao, W.; Guan, Y.P. Numerical Simulation Research on Transverse Anti—bending Characteristics of Concrete Filled Steel Tubes in STS Method for Subway Stations. J. Water Resour. Arch. Eng. 2014, 12, 74–77. [Google Scholar]
  28. Jia, P.J.; Zhao, W.; Hao, Y.C.; Han, J.Y. Numerical analysis of the mechanical properties of steel tube slab component under different structural parameters. J. Northeast. Univ. 2016, 37, 1177–1181. [Google Scholar]
  29. Guan, Y.P.; Zhao, W.; Wang, L.G.; Jia, P.J.; Zhao, Z.; Hao, Y.C. Study on parameters optimization and the flexural behavior of steel tube slab structures. Eng. Mech. 2017, 34, 83–91. [Google Scholar]
  30. Zhang, P.; Wang, X.Y.; Zeng, P.; Ma, B.S. Situ monitoring of mechanical characteristics of pipes during steel curved pipe jacking under large buried depth. Chin. J. Geotech. Eng. 2016, 38, 1842–1848. [Google Scholar]
  31. Love, A.E.H. A Treatise on the Mathematical Theory of Elasticity; Cambridge University Press: Cambridge, UK, 1927. [Google Scholar]
  32. Xiao, J.H. Study on Flexural Behavior of STS Structure with Steel Pipe Diameter and Concrete Filling Rate. Master’s Thesis, Northeastern University, Liaoning, China, 2017. [Google Scholar]
  33. Jia, P.J.; Zhao, W.; Guan, Y.P.; Li, S.G.; Han, J.Y.; Hou, W.Y.; Wang, C.; Liu, Y.A. Numerical simulation and experimental study on flexural behavior of steel tube slab members. J. Cent. South Univ. 2016, 47, 2738–2746. [Google Scholar]
  34. Liu, H.W. Material Mechanics; Higher Education Press: Beijing, China, 2005. [Google Scholar]
  35. Liu, J.; Fang, Q.; He, S.; Wang, E.; Zhou, H. Enlarging a large-diameter shield tunnel using the Pile-Beam-Arch method to create a metro station. Tunn. Undergr. Space Technol. 2015, 49, 130–143. [Google Scholar] [CrossRef]
  36. GB50157, Code Design of Design; Architecture & Building Press: Beijing, China, 2013.
  37. Zhao, W.; Han, J.Y.; Chen, Y.; Jia, P.J.; Li, S.G.; Li, Y.; Zhao, Z. A numerical study on the influence of anchorage failure for a deep excavation retained by anchored pile walls. Adv. Mech. Eng. 2018, 10. [Google Scholar] [CrossRef]
  38. Khoiri, M.; Ou, C.Y. Evaluation of deformation parameter for deep excavation in sand through case histories. Comput. Geotech. 2013, 47, 57–67. [Google Scholar] [CrossRef]
  39. Li, B.; Ji, F.Y. Influence of shield tunneling on adjacent deep foundation pit. J. Shenyang Jianzhu Univ. 2018, 34, 639–644. [Google Scholar]
  40. Itasca Consulting Group. Fast Lagrangian Analysis of Continua in 3 dimensions, interfaces. In User Manual of FLAC3D 5.0; Itasca Consulting Group: Minneapolis, MN, USA, 2012. [Google Scholar]
Figure 1. Subway station by the pile-beam-arch method: (a) Pilot tunnels construction, (b) Perfusion pile construction, (c) Arch construction, (d) Floor slab construction, (e) Completed construction.
Applsci 08 01437 g001
Figure 2. Traditional pipe-roofing system set-up.
Applsci 08 01437 g002
Figure 3. Steel Tube Slab system set-up.
Applsci 08 01437 g003
Figure 4. Layout of the Northeast Street station: (a) Cross section; (b) General plan.
Applsci 08 01437 g004
Figure 5. Geological profile of the soil.
Applsci 08 01437 g005
Figure 6. Construction stages in the new support system. Note: Z1, Z2, Z3 and Z4 represent pilot tunnel; C1 and C2 represent cylindrical steel column.
Applsci 08 01437 g006
Figure 7. Connection of adjacent steel tubes.
Applsci 08 01437 g007
Figure 8. Connection between cylindrical steel columns and longitudinal beams: (a) Beam-column supporting system; (b) The connection nodes.
Applsci 08 01437 g008
Figure 9. Installation of strain meter.
Applsci 08 01437 g009
Figure 10. Calculation of measurement error strain meter.
Applsci 08 01437 g010
Figure 11. Diagram of strain measuring points: (a) Circumferential strain meter; (b) Longitudinal strain meter.
Applsci 08 01437 g011
Figure 12. Longitudinal stress.
Applsci 08 01437 g012
Figure 13. Circumferential stress.
Applsci 08 01437 g013
Figure 14. Monitoring instrumentation.
Applsci 08 01437 g014
Figure 15. Installation of monitoring sensors.
Applsci 08 01437 g015
Figure 16. The value of bolts along with excavation sequence in monitoring sections: (a) Pilot tunnel construction; (b) Beam-column system construction; (c) Construction of the station hall; (d) Construction of the platform layer; (e) After the main construction.
Applsci 08 01437 g016aApplsci 08 01437 g016b
Figure 17. Comparison of load-deformation curves between laboratory test results and numerical calculation.
Applsci 08 01437 g017
Figure 18. Finite element model with 7 steel tubes connected.
Applsci 08 01437 g018
Figure 19. Load-deformation curve.
Applsci 08 01437 g019
Figure 20. Simplified model of Steel Tube Slab (STS) structure: (a) Size of model; (b) The simplified model.
Applsci 08 01437 g020
Figure 21. Load deformation curve.
Applsci 08 01437 g021
Figure 22. The relationship between the elasticity modulus of material 2 and lateral stiffness of simplified model.
Applsci 08 01437 g022
Figure 23. The 3-D difference model of the station construction: (a) Numerical model of the station construction; (b) Details of the support structure in the numerical model.
Applsci 08 01437 g023
Figure 24. Interface element.
Applsci 08 01437 g024
Figure 25. Comparison of surface settlement between in-situ monitoring and numerical simulations.
Applsci 08 01437 g025
Figure 26. Surface settlement curve.
Applsci 08 01437 g026
Figure 27. Deformation of STS structure.
Applsci 08 01437 g027
Figure 28. Horizontal displacement profile of vertical sections of the STS structure and the side walls: (a) Left vertical section of STS structure and left side wall; (b) Right vertical section of STS structure and right-side wall.
Applsci 08 01437 g028
Figure 29. The horizontal deformation of bridge piles after each construction stage: (a) Bridge pile1; (b) Bridge pile 2; (c) Bridge pile 3; (d) Bridge pile 4.
Applsci 08 01437 g029
Figure 30. Welding of flanges in the STS structure: (a) Welding of flanges in the site; (b) Different welding conditions for the flanges in the simulations.
Applsci 08 01437 g030
Figure 31. Settlement profiles at a section with y = 15 m: (a) Ground settlement; (b) Vertical deformation of horizontal section of the STS structure.
Applsci 08 01437 g031
Figure 32. Longitudinal deformation curve: (a) Ground longitudinal settlement; (b) Longitudinal deformation of horizontal STS structure.
Applsci 08 01437 g032
Figure 33. Horizontal displacement at the tunnel face for different step lengths.
Applsci 08 01437 g033
Figure 34. Ground settlement curve of different step length.
Applsci 08 01437 g034
Figure 35. Vault crown settlement curve.
Applsci 08 01437 g035
Figure 36. Crown settlement profile for tunnel Z1.
Applsci 08 01437 g036
Table 1. The results of super heavy dynamic cone penetration test.
SoilMedium Coarse SandGravel SandRound GravelBoulder Clay
Index
Count64912597
maximum value14.11917.417
minimum value10.67.37.07.2
average value12.912.310.510.4
standard deviation1.2653.2932.2673.324
variation coefficient0.0980.2680.2160.262
correction factors0.9190.9340.9670.955
standard value11.911.510.212.1
Table 2. Soil stratigraphy and properties at the site.
SoilThickness (m)Internal Friction Angle (0)Cohesion c (kPa)Poisson RatioDeformation Modulus (MPa)Density (kg·m−3)
backfill soil3.41010.28161800
gravel sand6.037.010.2633.02000
round gravel11.036.710.2530.92050
medium coarse sand10.034.010.2919.01980
boulder claynon-penetrating layer29.310.3023.02000
Table 3. Material parameters in the numerical model.
MaterialνE (GPa)γ (kN·m-3)
primary lining0.22024
foot-lock bolt0.257225
top longitudinal beam0.232.524
bottom longitudinal beam0.232.524
cylindrical steel column0.256938

