1. Introduction
Worldwide energy demand is constantly increasing. It is expected that global energy consumption will increase by more than a third in the period to 2035. Among all the energy demand, the building sector represents an average 20–40% of worldwide energy use [
1]. This may become even more important as electricity demand is expected to rise in buildings, primarily due to electric heat pumps, and secondly due to the impact of electric vehicles charging facilities. Consequently, spreading the demand more evenly in time and better coordination with electricity availability could partially avoid the need for new infrastructure.
Within the framework of Smart Electric Grid, substantial energy savings could be achieved by means of a Building Energy Management System (BEMS). Thus, the combination of direct load control (DLC) algorithms, during a Demand Response (DR) event, with detailed measurements and, furthermore, with the contextual energy reporting and analytics would drive to significant impact on reducing energy costs. However, the lack of end-load monitoring (or as we might call it: submetering) or recording energy consumption “behind the meter”, e.g., at system-level or into individual appliances, have been an insurmountable barrier up to now. However, at some point in the future, submetering will be somewhat mandatory. In some cases, submetering in the multi-residential buildings can reduce the average electricity consumption by 34% for non-electrically heated buildings, and by 27% for electrically heated buildings [
2]. However, submetering could be an important way not only to identify opportunities for operational efficiency but also to regulate demand, e.g., through virtual aggregation of different submeters, for a power system which progressively relies on variable and Distributed Energy Resources (DER).
Power Quality (PQ) refers to deviations of the voltage or current waveform from the ideal single-frequency sine wave of constant amplitude and frequency. PQ deterioration is due to transient disturbances or events (voltage sags, voltage swells, impulses, etc.) and steady-state disturbances (harmonic distortion, unbalance, flicker). A consistent set of definitions and extensive overview to this important area can be found in [
3]. Presently, PQ disturbances are of increasing concern due to present widespread use of power electronics equipment in industrial, commercial and residential buildings. White and brown goods are specifically sensitive to such imperfections.
Among all categories of power disturbances, voltage sag (or dip), and momentary interruptions are the swords of Damocles of the automated industrial processes. Sag durations are subdivided in IEEE Std. 1159 [
4] into three categories-instantaneous, momentary, and temporary. In distribution networks, power system faults are principally the origin of voltage sags. Fault occurrences elsewhere can create voltage sags that may disturb consumers to different extents depending on their position in the electrical network. Voltage sags affect a larger number of customers and, for some of them, extremely serious problems may be caused. Some examples are sensitive equipment that do not have adequate ride-through capabilities to withstand fluctuations in the electrical supply [
5]. The need for line voltage regulation remains in order to meet demands for high industrial productivity. There are several conditioning solutions that have been developed to provide protection to PQ problems [
6].
Correlating and categorizing (e.g., event type, magnitude, and duration) can be classified according to i.e., EN 50160 [
7] or IEEE Std. 1159 [
4] standards. However, only the standard EN 50160 establishes limits of the voltage supplied by the public distribution network. PQ events should be measured, depending on their deterministic or stochastic nature, by following the IEC 61000-4-30 [
8] standard. In the other hand, steady-state signal variations such as harmonics are processed according to IEC 61000-4-7 [
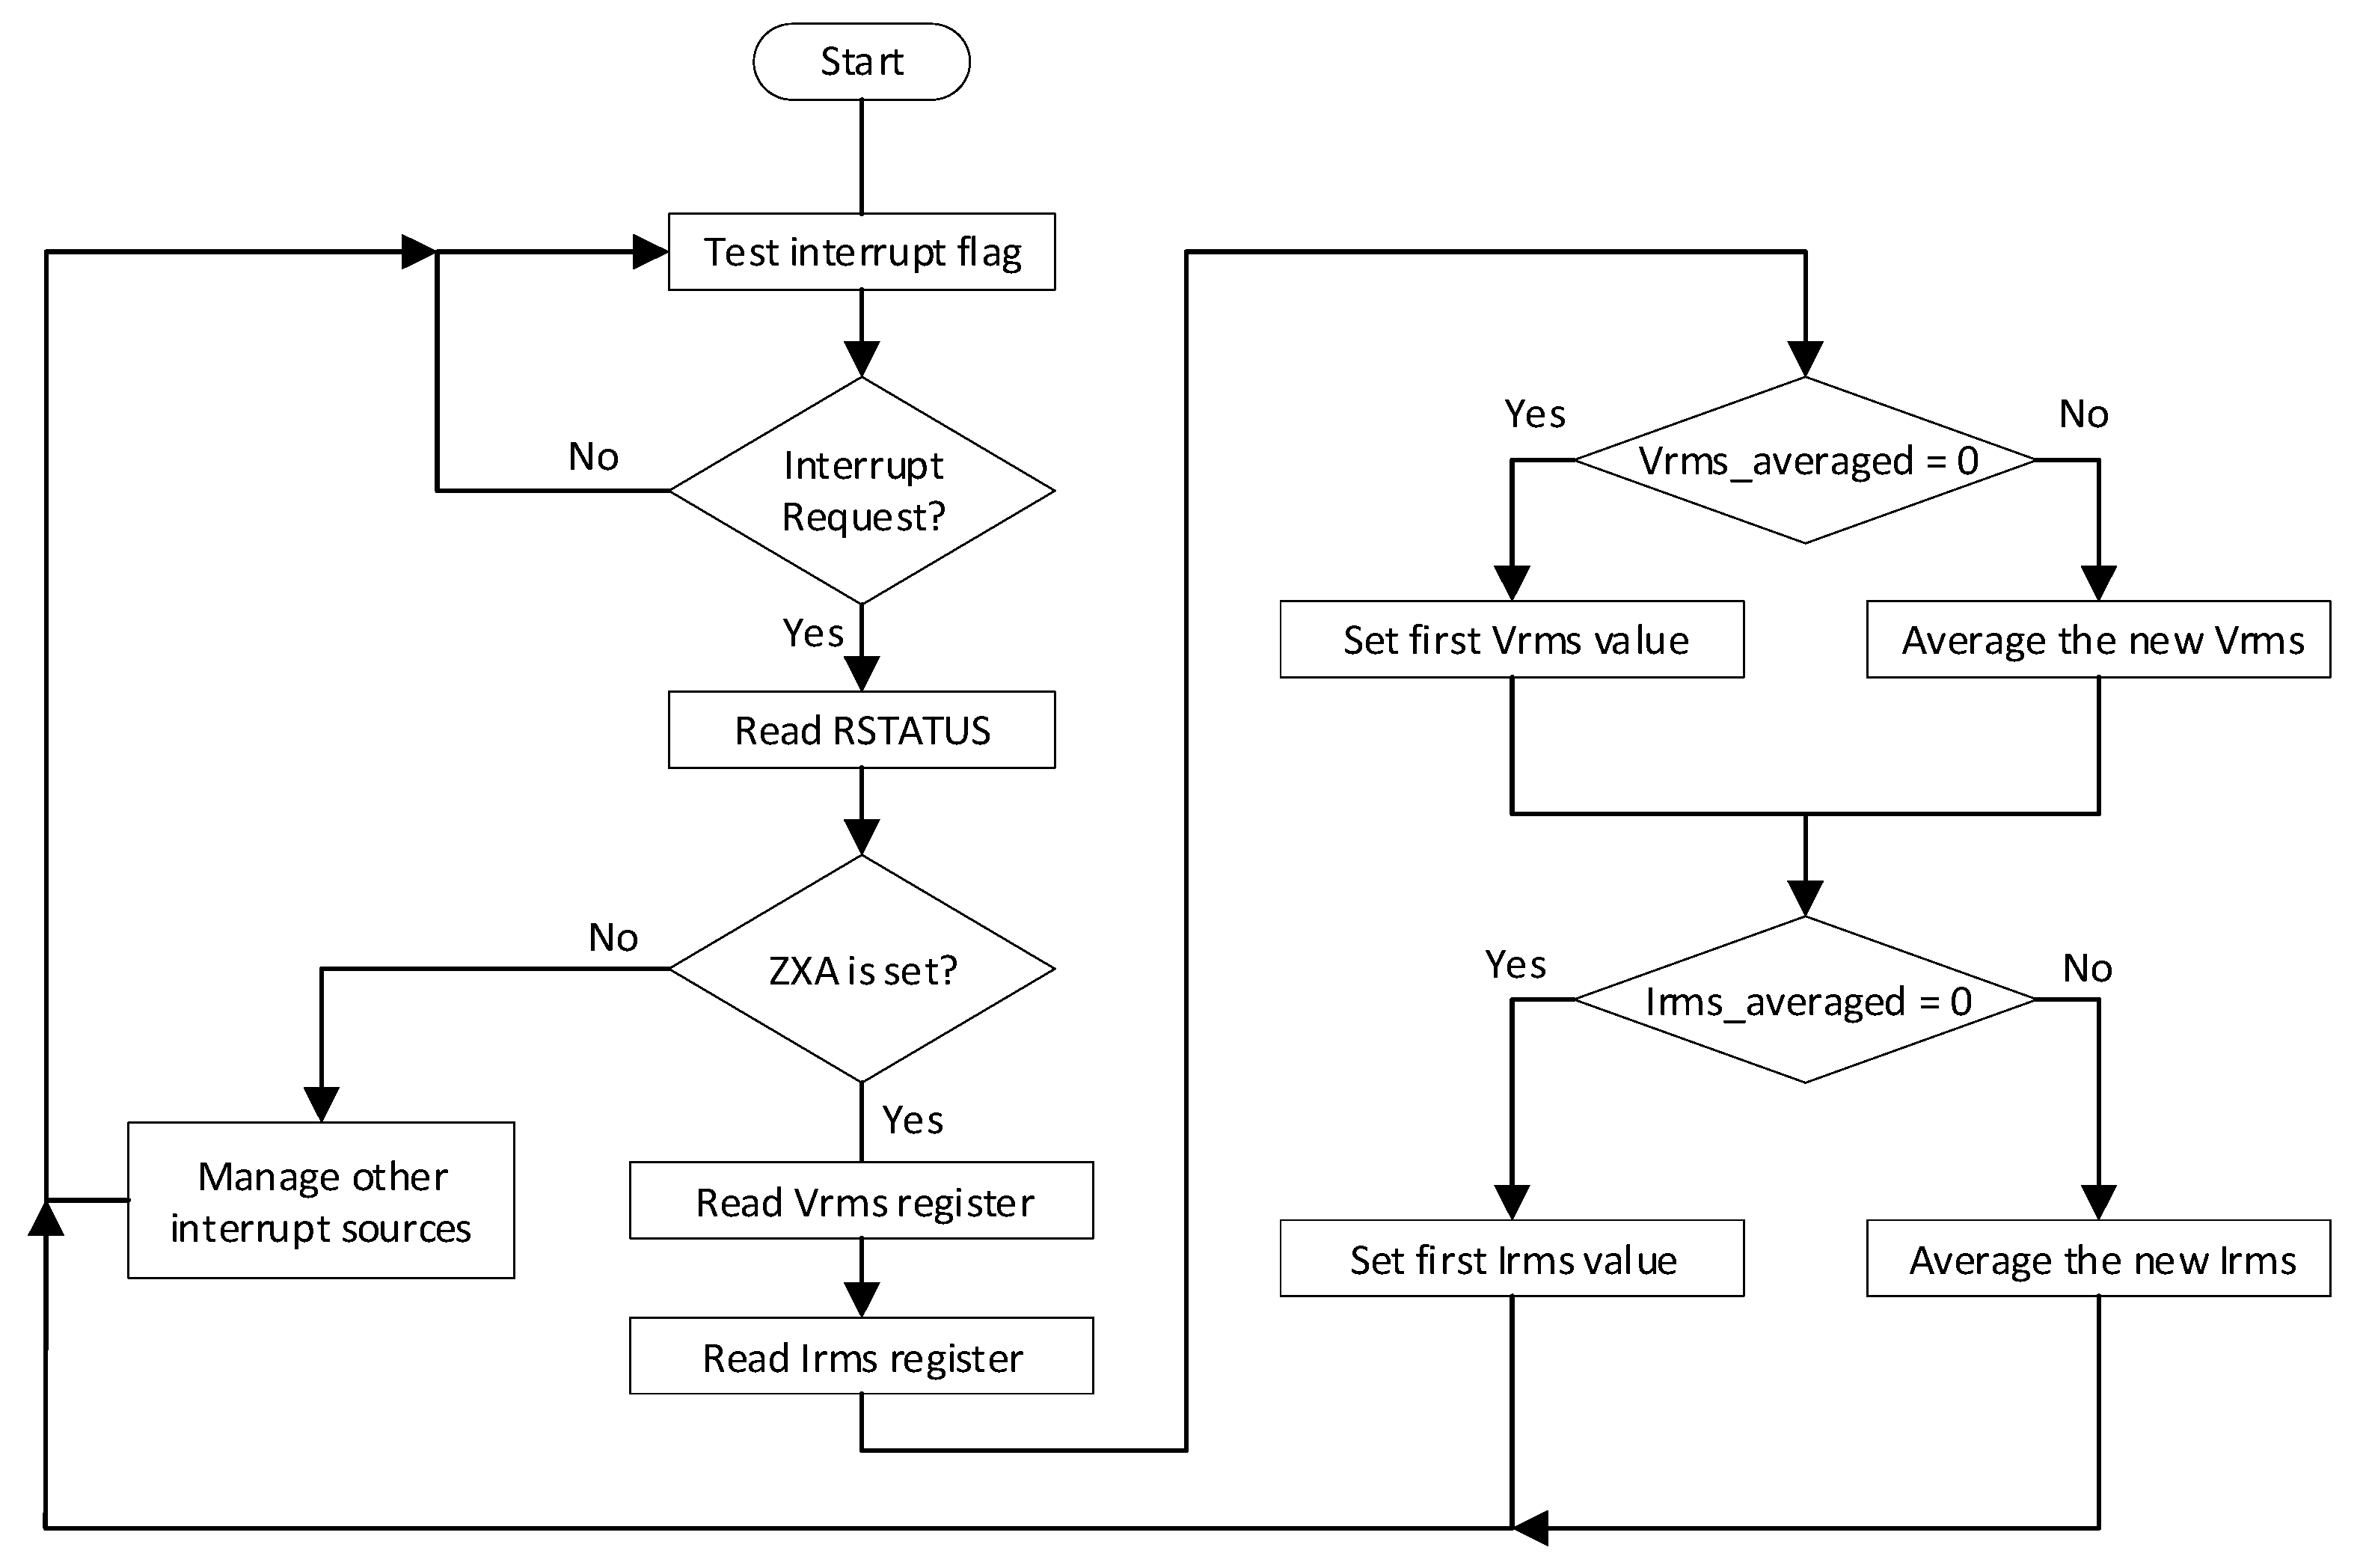
9]. Amplitude-related distortions should be pre-processed and recorded only if they have the potential to affect any device in the facility. Mostly, the likelihood of PQ event occurrence is evaluated based on the sine waveform Root-Mean-Square (RMS) change across a sliding window. According to IEC 61000-4-30, this RMS value should be measured over one waveform cycle, starting at a fundamental zero-crossing, and refreshed each half cycle (V
RMS(1/2)). Thus, this standard establishes voltage sags, swells, and interruptions as a variation in RMS below 90%, above 110%, and below 10% of the nominal value, respectively.
1.1. Motivation
The decreasing costs of Information and Communication Technologies (ICT), combined with increased environmental and regulatory pressures towards energy efficiency and reduction of greenhouse gas emissions, means that many Smart Cities and Communities are now looking at the Internet of Things (IoT) as the proper way to address energy-saving within residential and commercial buildings. The concept of IoT comprises a plethora of applications and technologies and a good definition of IoT can be found in [
10]. Inspired by the recent IoT model, and released by the National Institute of Standards and Technology [
11], four core primitives can be established and employed here: sensor, aggregator, analysis and decision trigger. The set of technologies that founded the IoT promised to swerve any device into a self-information source.
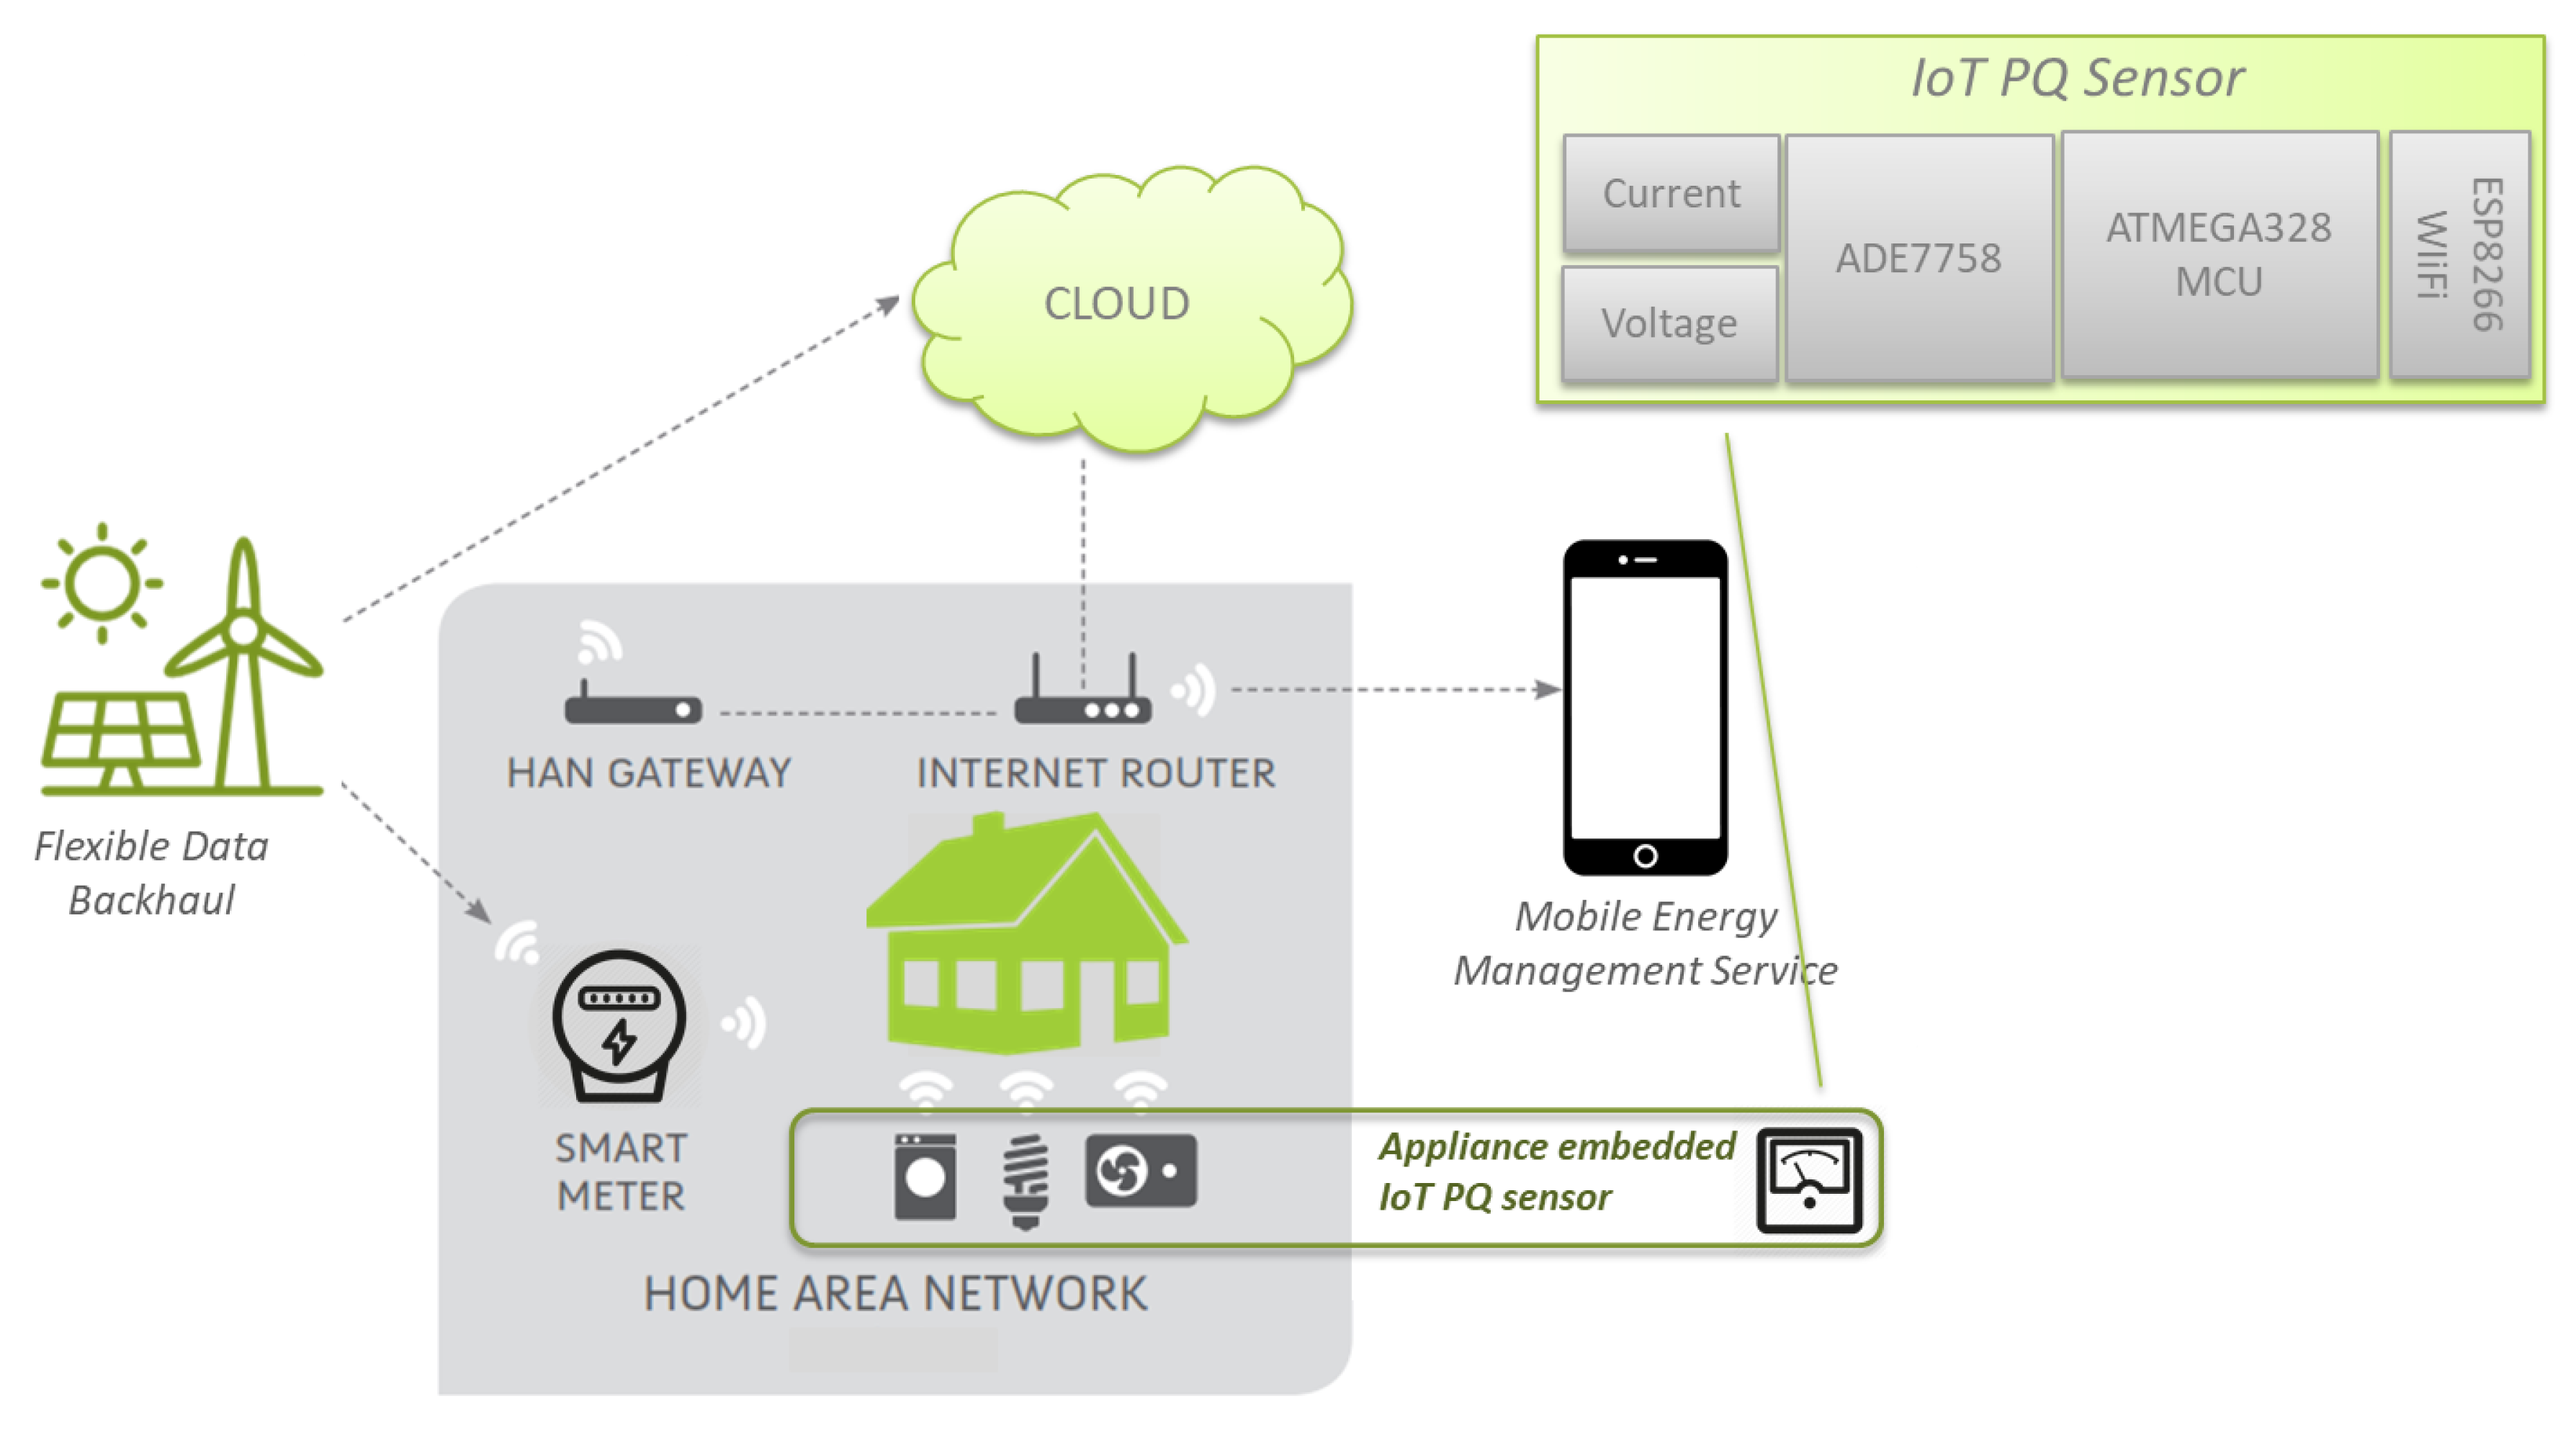
At the heart of this ecosystem is data, remotely collected from IoT sensors and feed to cloud-based applications. Through IoT software platforms, the information can be analyzed, stored and visualized in a well-designed way, and what is most important is that it can be accessible from any part of the world. This data can be then analyzed through big data techniques, to enable deeper knowledge at a granular level of the localized supply and use of electricity. In this context, the power utilities Advanced Metering Infrastructure (AMI) play a main role, mostly because it is necessary to harmonize the integration of IoT PQ sensors in the existing Smart-Grid standards-based architecture of connected Intelligent Electronic Devices (IEDs).
PQ is a concern not only because of the harm produced in equipment and the electrical distribution system itself but because it wastes energy and reduces electrical capacity. PQ problems in EU-25 countries create financial loss of more than €150 billion per year [
12]. Detecting a problem from the beginning, before it worsens and when it is easy to tackle, minimizes the likelihood of costly equipment damage or costly business interruptions.
If AMI and IoT continue overlapping trends—and they will—smart meters could be better supplemented with information from embedded IoT PQ submetering devices. This will enable appliances to self-monitor not only their electrical energy consumption but also quality, a hitherto unexplored approach. Subsequently, this would drive the development of more disruptive energy behavioral tools for making the energy data generated by IoT manageable by customers. As a conclusion, with an IoT PQ platform, it would be possible to offer advanced functionalities for energy management applications to final consumers, building managers, and municipalities on a single cost-effective and scalable multi-tenant platform.
1.2. Power Quality Literature Survey
Automated PQ analysis entails the following stages: detection, segmentation, and characterization of the PQ event. There exists a very extensive body of knowledge related to these stages, where the most advanced techniques have been applied, from the area of signal processing to artificial intelligence. See for example the latest works presented in [
13,
14,
15].
The most advanced PQ analyzer in the market today, which costs between €4,495 and €13,460 [
16], provides three-phase high-performance PQ monitoring with built-in EN 50160 or IEEE Std. 1159 monitoring, statistics and reports. These analyzers can be divided between a portable solution for load studies and PQ audits, or to be fixed for 24/7 continuous long-term monitoring. As can be seen, most of these analyzers present good characteristics, but they are usually very expensive, consequently only considered to be connected at the entrance of the facility. While all major events can be captured, this could result in excessive data from non-critical events. Manual analysis methods are expensive, time-consuming, and error-prone. Thus, designing a system that can analyze, condensing and interpreting voluminous raw data so that levels can be assessed against limits, as well as can be easily expanded, would become the most significant challenge in the present PQ measurement arena. Besides the professional PQ meters, plug-in voltage quality (VQ) recorders that detect and record different disturbances are available at prices around €900. Consequently, a low-cost system able to observe PQ data on a continuous basis is needed.
In recent years, different works have been published in energy metering fields at the customer level, and an excellent review can be found in [
17], where the current state of the art of energy management through Intrusive Load Monitoring (ILM) and Non-intrusive Load Monitoring (NILM) is presented. Another interesting paper presents an advanced IoT-based system for intelligent energy management in buildings [
18]. The proposed system extends existing approaches and integrates cross-domain data, such as building data, energy production, energy prices, weather data and end-user behavior, to develop daily and weekly action plans for end-users with actionable, customized information. Considering both concepts, in [
19] the residential energy scheduling optimization problem is solved using two-stage Mixed Integer Linear Programming (MILP) considering the customer preferences and appliances’ specifications. Similarly, but applied in a particular case, in [
20] a testbed is designed where each housing unit is equipped with sensors, actuators, smart plugs, smart meters, and Unified Home Gateway (UHG). The paper also shows results from implemented applications in Demand Response Management (DRM), energy management, home automation, dynamic pricing, and home security. However, no information regarding PQ is traditionally measured. Paper [
21] describes a gamification framework that aims to achieve greater energy conservation in public buildings. The framework leverages IoT-enabled low-cost devices to improve energy disaggregation mechanisms, providing energy use and—consequently—wastage information at the device, area and end-user level. Another example is found in [
22] where a smart-grid testbed at the Singapore University of Technology and Design (SUTD) is developed which is able to monitor, analyze, and evaluate smart-grid communication network design and control mechanisms, and test the suitability of various communications networks for both residential and commercial buildings. One of the main reasons behind these works is to make users aware of their electricity consumption to reduce their carbon footprint and eventually save money on their electricity bills. An interesting point to be added to the existing resources is recording information about PQ, as it is also a source of losses, meaning that energy consumption can also be achieved with an appropriated PQ within an installation.
In the state-of-the-art literature, energy metering has mainly been considered, as in [
23] which presents a detailed survey of behind-the-meter energy management systems, or [
24] which monitors energy usage, but also adding information about individual appliances allowing identification of which appliance is using energy, and in turn speculate on the activity and number of users. Some other authors have also considered the measurement of PQ parameters as in [
25], which studies how to take advantage of the basic PQ measures inherent in most of today’s smart meters in the context of a smart building with Energy Management System (EMS), particularly the implementation details and results at laboratory scale. With similar in mind, paper [
26] proposes a signal analysis framework for simplified PQ informative methods based on a lightweight assessment of these measures to allow optimal real-time network operation and market-correlated services. They all use existing smart meters provided by the electrical company to gather extra information aside from for billing purposes, meaning that the information is aggregated by individual consumers, making it difficult to act over individual loads and implement measures to anticipate faults in an early stage. To that end, the ground-breaking smart meter developed in paper [
27] provides standard PQ information as Total Harmonic Distortion (THD); in addition to event detections such as sags, swells, or interruptions, a complementary NILM approach is implemented in the prototype to identify appliances or industrial equipment. However, data are stored in an external micro-SD memory, so access to the data are offline, meaning no control can be done with it, and it exists only for monitoring purposes. In [
28], the same ADE7758 Integrated Circuit (IC) selected here is employed to monitor energy parameters, and complemented with overvoltage and overcurrent alarms functionality; however, the solution does show data in an LCD display, so data are not stored to be later processed. Paper [
29] presents a Wi-Fi smart plug which, in addition to monitoring energy consumption, can remotely activate the electrical appliances connected, but power quality data are not calculated. In [
30] authors present a small-size power sensor able to measure the appliance power down to 1 W and generate power for its Microcontroller Unit (MCU) and radio frequency module by energy harvesting; they emphasize that the sensor does not consume power when the electrical appliance is off. The inconvenience is that only power consumption is measured, and a Personal Computer (PC) is needed to upload data to the cloud system, so the sensor is not provided with internet access. Authors of [
31] criticize most approaches for being “distributor-centric” rather than “customer-centric,” undermining user acceptance, so they have designed a customer-centric and scalable architecture to facilitate user acceptance. According to the authors, this architecture (1) facilitates the integration of smart-grid applications with other home applications; (2) can gather data from heterogeneous communication protocols; (3) provides secure access to data; and (4) allows unequivocal mapping of each sensor and actuator to common abstraction layers so that applications easily can identify them.
1.3. Internet of Things Platform Review
A set of IoT platforms has been analyzed to select the one that allows the sensor to send a reasonable number of messages without demanding a long integration process within the device. The most interesting IoT platforms are below briefly analyzed:
Kaa [
13] is a free open-source middleware platform for IoT that supports a variety of hardware devices. It is a reliable and secure platform for developing connected things. Furthermore, Kaa server provides services such as data management, integration and visualization. Other platforms similar to Kaa are ThingsBoard [
32], OpenIoT [
33,
34] and Thinger [
35].
Carriots [
36] is a Platform as a Service (PaaS) designed for IoT and machine-to-machine (M2M) projects. It allows users to collect and store data from various devices and build powerful applications through its Software Development Kit (SDK) engine. Compared to Kaa, the development process as well as the information exchanged between the devices and the platform makes necessary the use of an Application Programming Interface (API). In contrast, Carriots only allows users to freely manage two devices.
Particle [
37] is ecosystem (hardware and software) to facilitate the IoT development applications. From the software point of view, it provides real-time events, automatic cross-platform Over-The-Air (OTA) firmware distribution and management, self-healing module introspection, and secure and efficient messaging. Compared to Carriots, it allows freely management of up to 25 devices which can send up to 250,000 messages per month.
ThingSpeak [
38,
39] is an IoT platform that enables users to collect, store, analyze, visualize, and act on data from sensors or actuators.
1.4. Contributions
In short, all previous developments are partial attempts to meet to the challenge in question. What is needed is an IoT low-cost solution (much cheaper than €900 per node) that distributes monitors and controls critical variables inside the facility; this would be extremely beneficial for management of a building and thus ensure seamless business operations. Previously publications consider that the recorded PQ parameters which are in the Cloud system can help to reduce energy consumption in a building. However, those data can also be used to automatically detect PQ disturbances and even compare to standard values. An open platform that measures and compares values with standard limits has not been implemented to this end.
To our knowledge, there does not exist any low-cost IoT systems devoted to simultaneous PQ and energy monitoring. The paper introduces the first low-cost device able to analyze power quality parameters and upload them to an IoT cloud platform. This is the novelty of the paper: the ability to measure and send aggregated on-time PQ data to the cloud system, as well as process data and check with the standard compliance. The important point here is that this information is accessible by any device that has an Internet connection and a search engine. A mobile phone can access all data, without requiring any additional configuration or application. Voltage sags are on-time monitored through amplitude and duration, moreover categorized according to the SEMI F-47 curve. This is suitable for submetering industrial or commercial facilities as PQ sensor data can be an indication of the equipment performance regarding efficiency and accomplishment of PQ standards. In fact, users will be able to detect not only most PQ steady-state disturbances but events such as voltage sags which anticipate faults with early-stage alerts.
The rest of the paper is organized as follows:
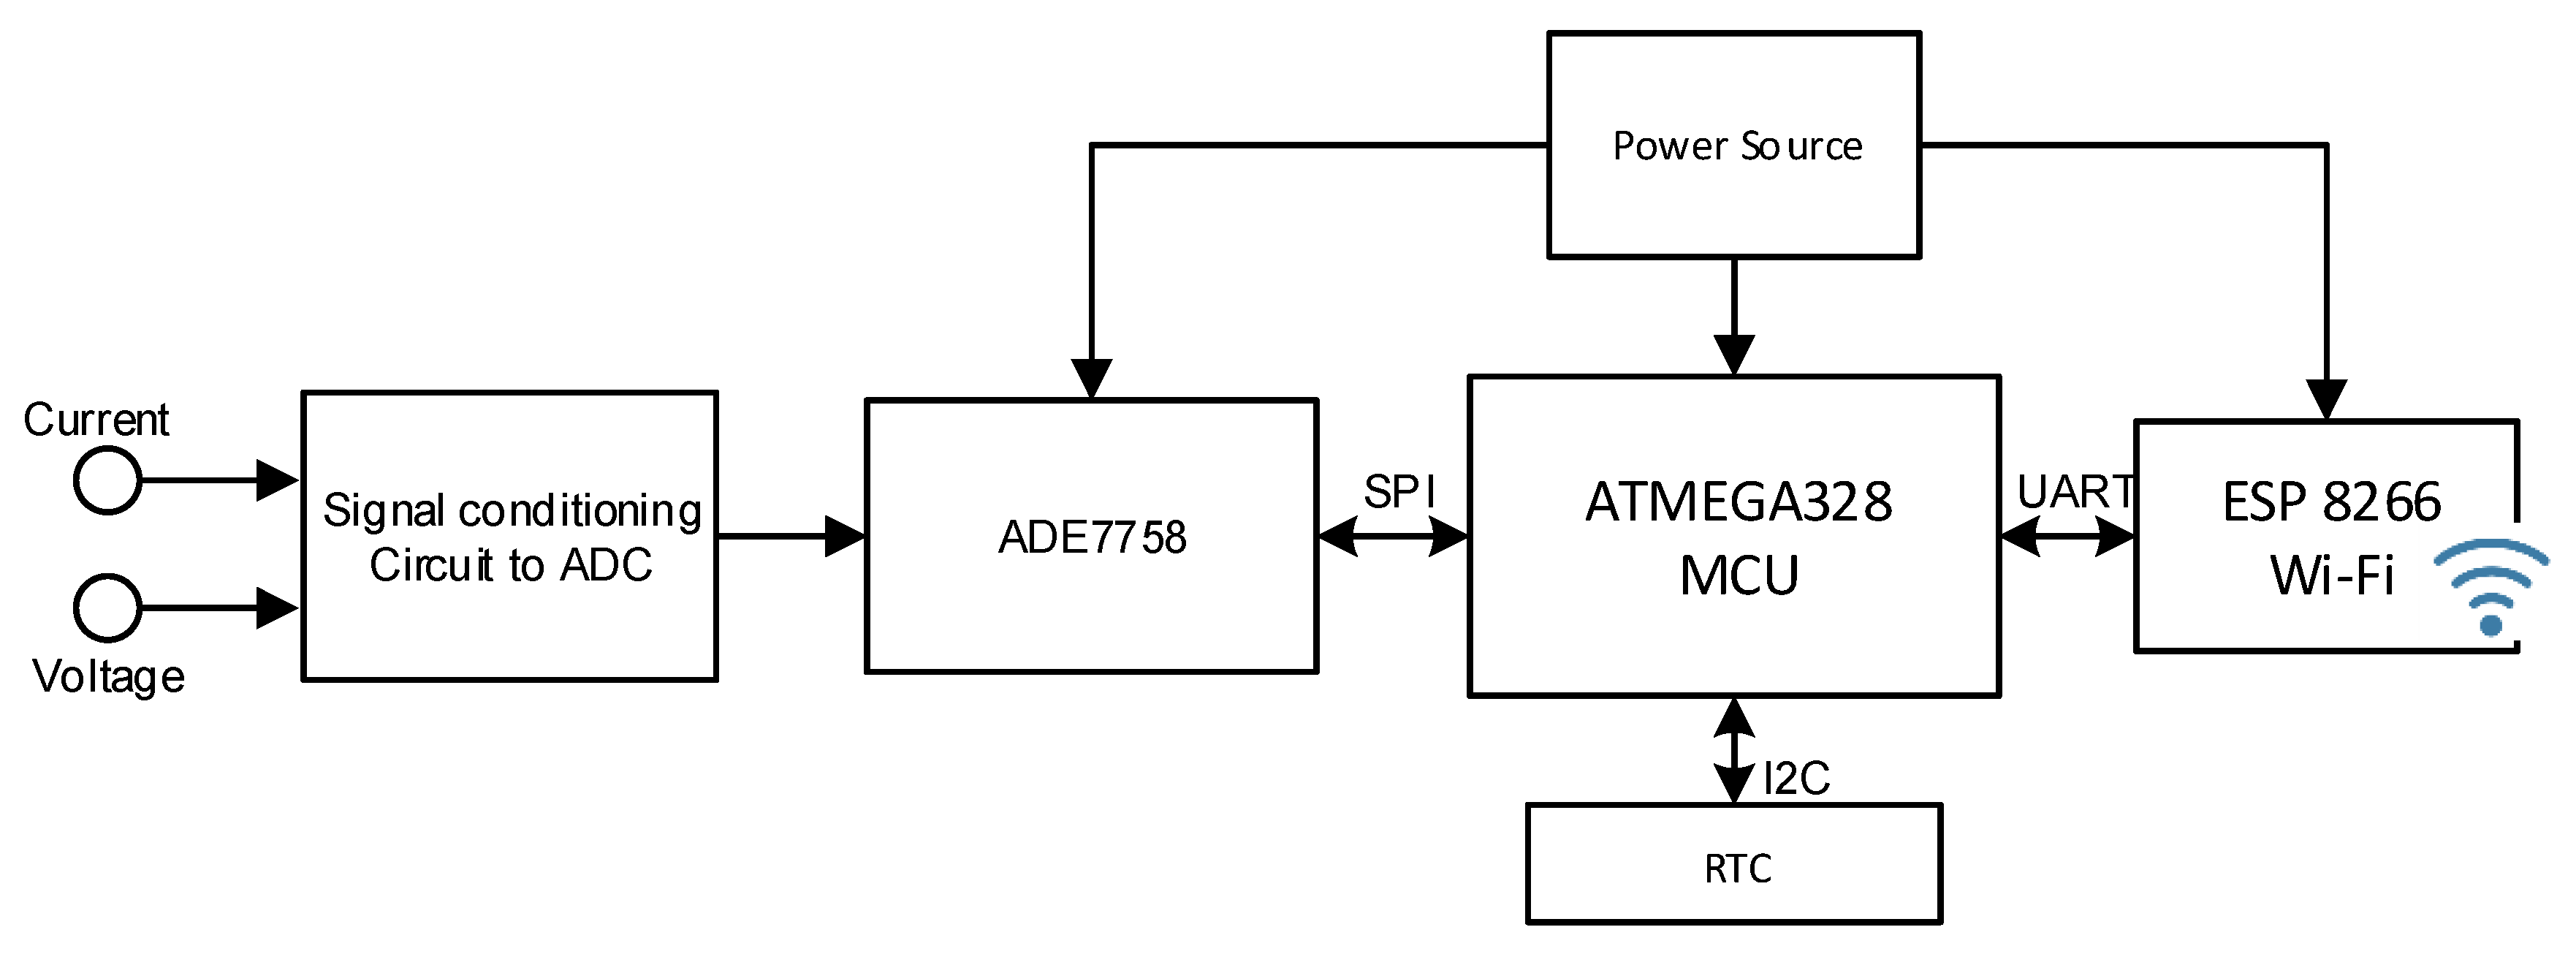
Section 2 describes the system architecture, including the description of the hardware implemented.
Section 3 resumes the PQ functionality implemented in the PQ sensor. The IoT PQ sensor cloud platform integration is included in
Section 4. Results are included in
Section 5.
Section 6 puts forward several conclusions.
4. IoT PQ Sensor Cloud Integration
The novelty of this paper is the ability to measure and send aggregated on-time PQ data to the Cloud, as well as process data and check with the standard compliance. The important point here is that this information is accessible by any device that has an internet connection and a search engine. A mobile phone can access all data, without requiring any additional configuration or application, but there are several free applications with a friendly interface that can be used if the user prefers a faster way to access the platform.
Compared to platforms such as Kaa, ThingsSpeak is less time consuming in terms of development as users must only use an API, and, compared to Carriots or Particle, ThingSpeak is free for non-commercial small projects (<3 million messages/year or around 8200 messages/day). The mentioned advantages make ThingSpeak the chosen platform in the developed IoT PQ sensor to collect, analyze and visualize data from the developed IoT PQ Sensor presented here. Another reason is the compatibility feature between this cloud platform and the software MATLAB, allowing better analysis from the data, apart from a proper visualization. The integration of MATLAB code is possible within the platform, so authors have implemented extra features for better data analysis.
ThingSpeak offers a flexible and easy way of storing the information collected by sensors into the cloud, so the used platform has been used to show data recorded by the designed IoT PQ sensor. To do that, ThingSpeak introduces the concept of channel. Each channel allows storage of up to eight fields of data, using up to 255 alphanumeric characters each. There are also four dedicated fields for positional data: description, latitude, longitude, and elevation. All incoming data is time- and data-stamped, and receives a sequential ID. Furthermore, a channel can be setup to be either private or public.
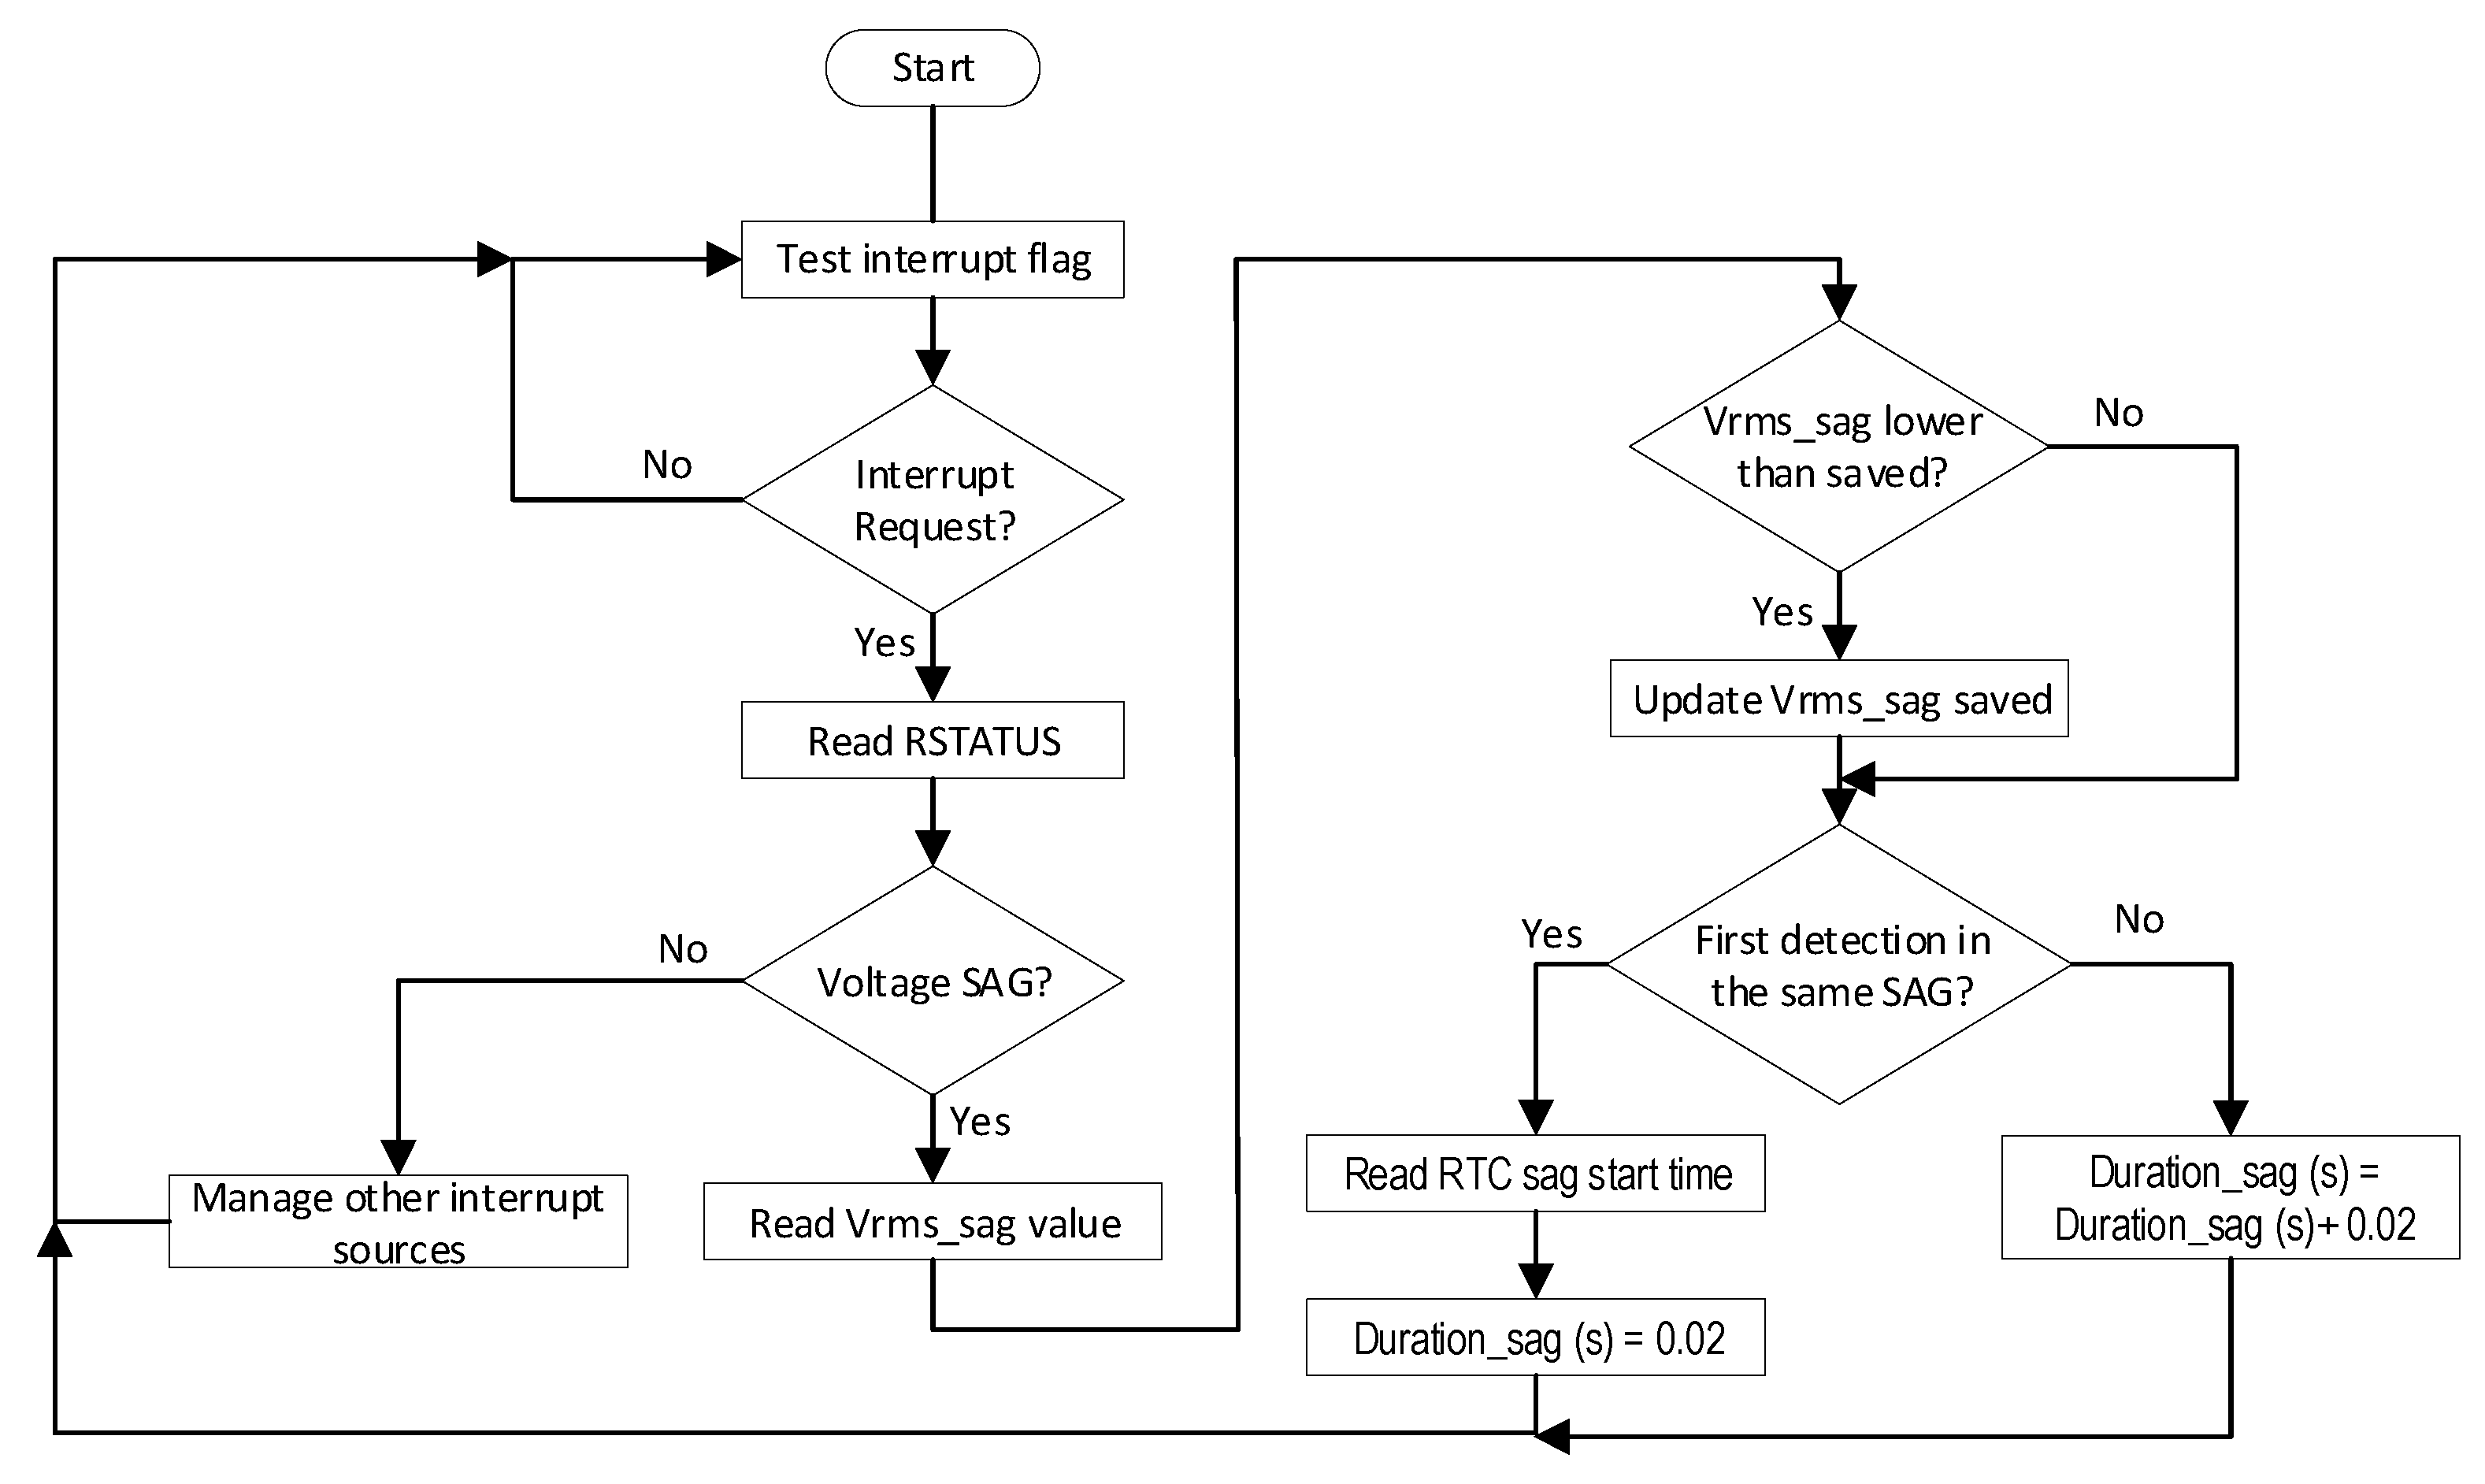
In the developed IoT PQ sensor, a public channel has been created to store four energy variables (VRMS, IRMS, Active Energy, Apparent Energy) which are obtained after analyzing the information received from the current and voltage sensors in the ADE7758, and read by the MCU. Moreover, two other fields are used to monitor information when a sag occurs, one of them containing in a coded way the joint information of the minimum VRMS and the sag duration, and the other field and most deterministic, the start time of the sag, i.e., the timestamp, which is given by the hardware equipment (RTC). As ThingSpeak is not a real-time but an on-time platform, the exact time of the sag occurrence is provided to the cloud system with this extra variable.
There is a data limitation in the ThingSpeak version that is used in this experiment, meaning that only one datum every 15 s can be uploaded, so the compromise followed here is to send both V
RMS and I
RMS every 30 s. However, using another IoT platform from the above, described in
Section 1, will allow data to be uploaded in shorter time scale, if required by the application.
The information collected by the IoT PQ sensor can be written into the ThingSpeak channels through two different methods: Representational State Transfer (REST) [
47] and Message Queue Telemetry Transport (MQTT) [
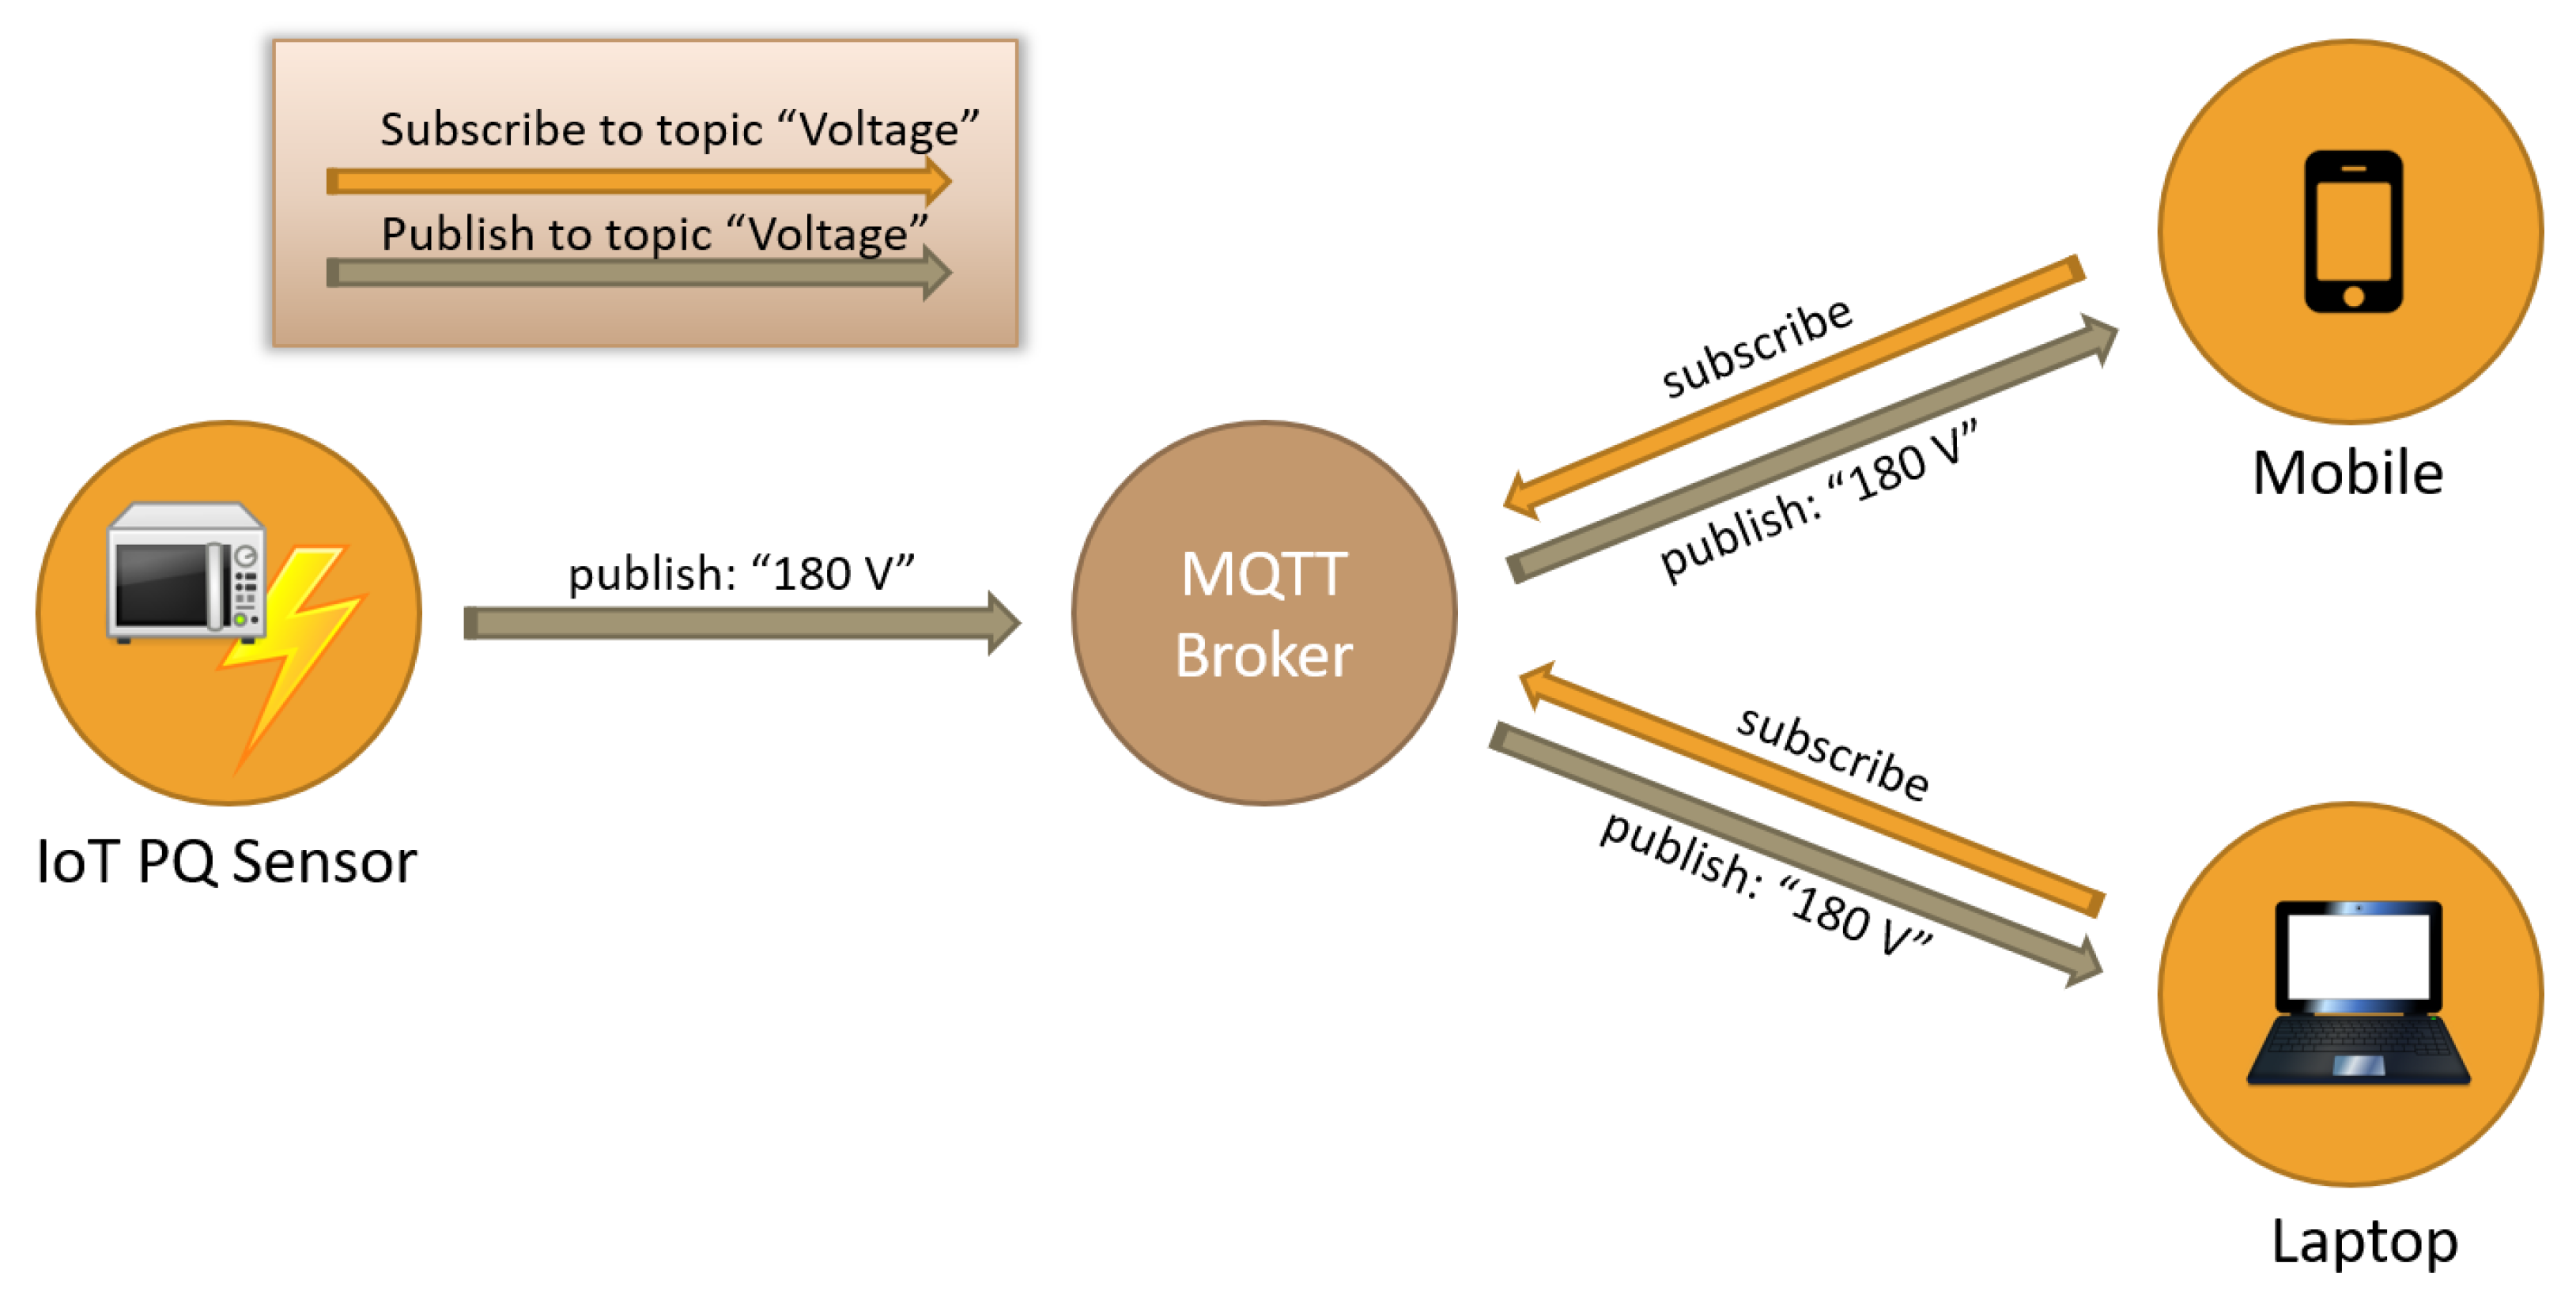
48]. The former is designed as a request/response model that communicates over HTTP and it is advisable to be used to retrieve large amounts of data, as well as to create, view, clear or delete a channel, or even when a response to your GET or POST request is needed. However MQTT is a publish/subscribe model that runs over TCP/IP sockets or WebSocket [
49] which should be used if the device updating the channel is power-constrained, as the MQTT publish operation is faster and consumes less energy. This is the main reason the MQTT method has been chosen to manage the information flow from the data registered by the designed IoT PQ sensor.
Figure 12 depicts the MQTT publish/subscribe model. MQTT broker is the central point of communication, dispatching all messages between the sender and the rightful receivers. Our IoT PQ Sensor device is the client that connects to the broker to publish different energy parameters under different topics. Alternatively, there are other clients (laptops, mobiles phones, tablets etc.) that can communicate with the broker to subscribe to topics they are interested in.
5. Evaluation and Experimental Results
A complete platform to generate voltage sags and different voltage RMS values has been developed. The experimental platform is composed of a three-phase programmable AC power source, California Instruments 3001iX [
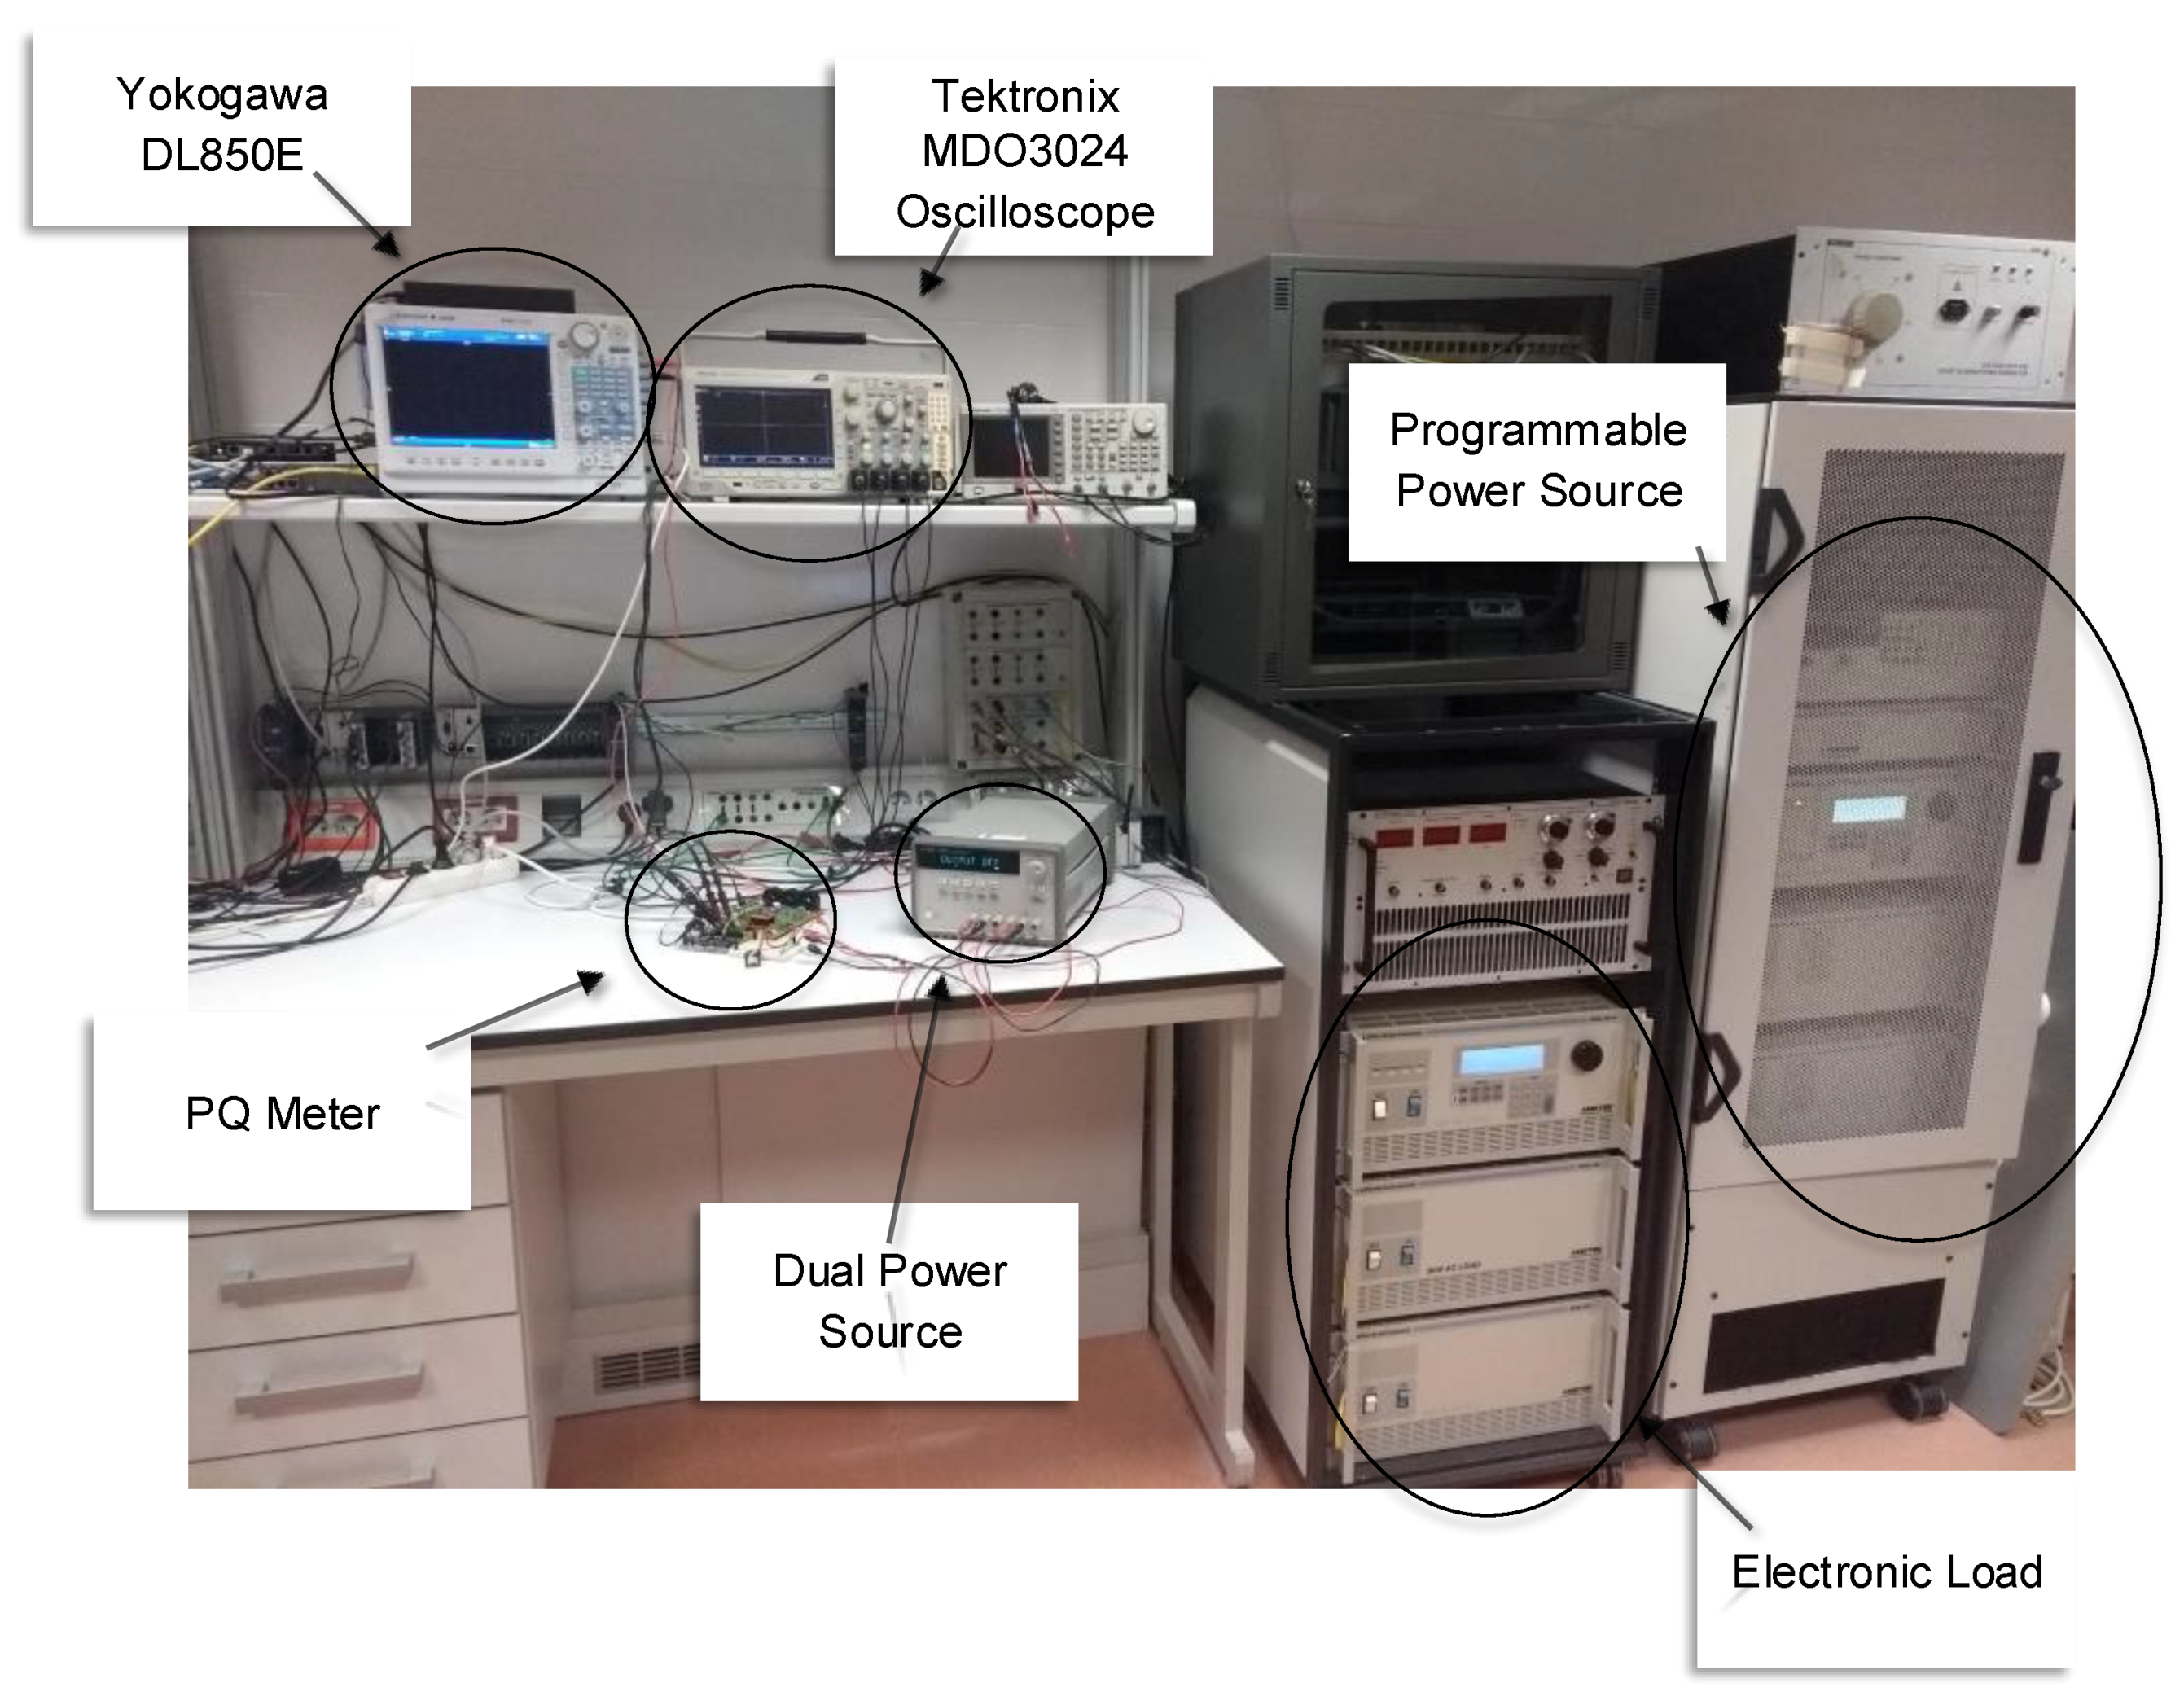
45], a three-phase electronic load, California Instruments Model 3091LD, and a desktop computer used for configuring and monitoring the power system. An overview of the system is shown in
Figure 13. This platform is part of the Smart-Grid test bench (SGTB) laboratory test bench for Smart-Grid research described in [
43].
In our experimental test, the IoT PQ sensor has been connected between the AC power source and the electronic load, so that the IoT PQ sensor is continuously recording the voltage from the power source and current at the terminal of the electronic load, and, at the same time, uploading it to the Cloud (ThingSpeak platform). The advantage of using both programmable loads are that the reliability of the platform can be checked, as the registered and uploaded values by the sensor can be checked with values generated by the power source and consumed by the load, as they both integrate measuring devices.
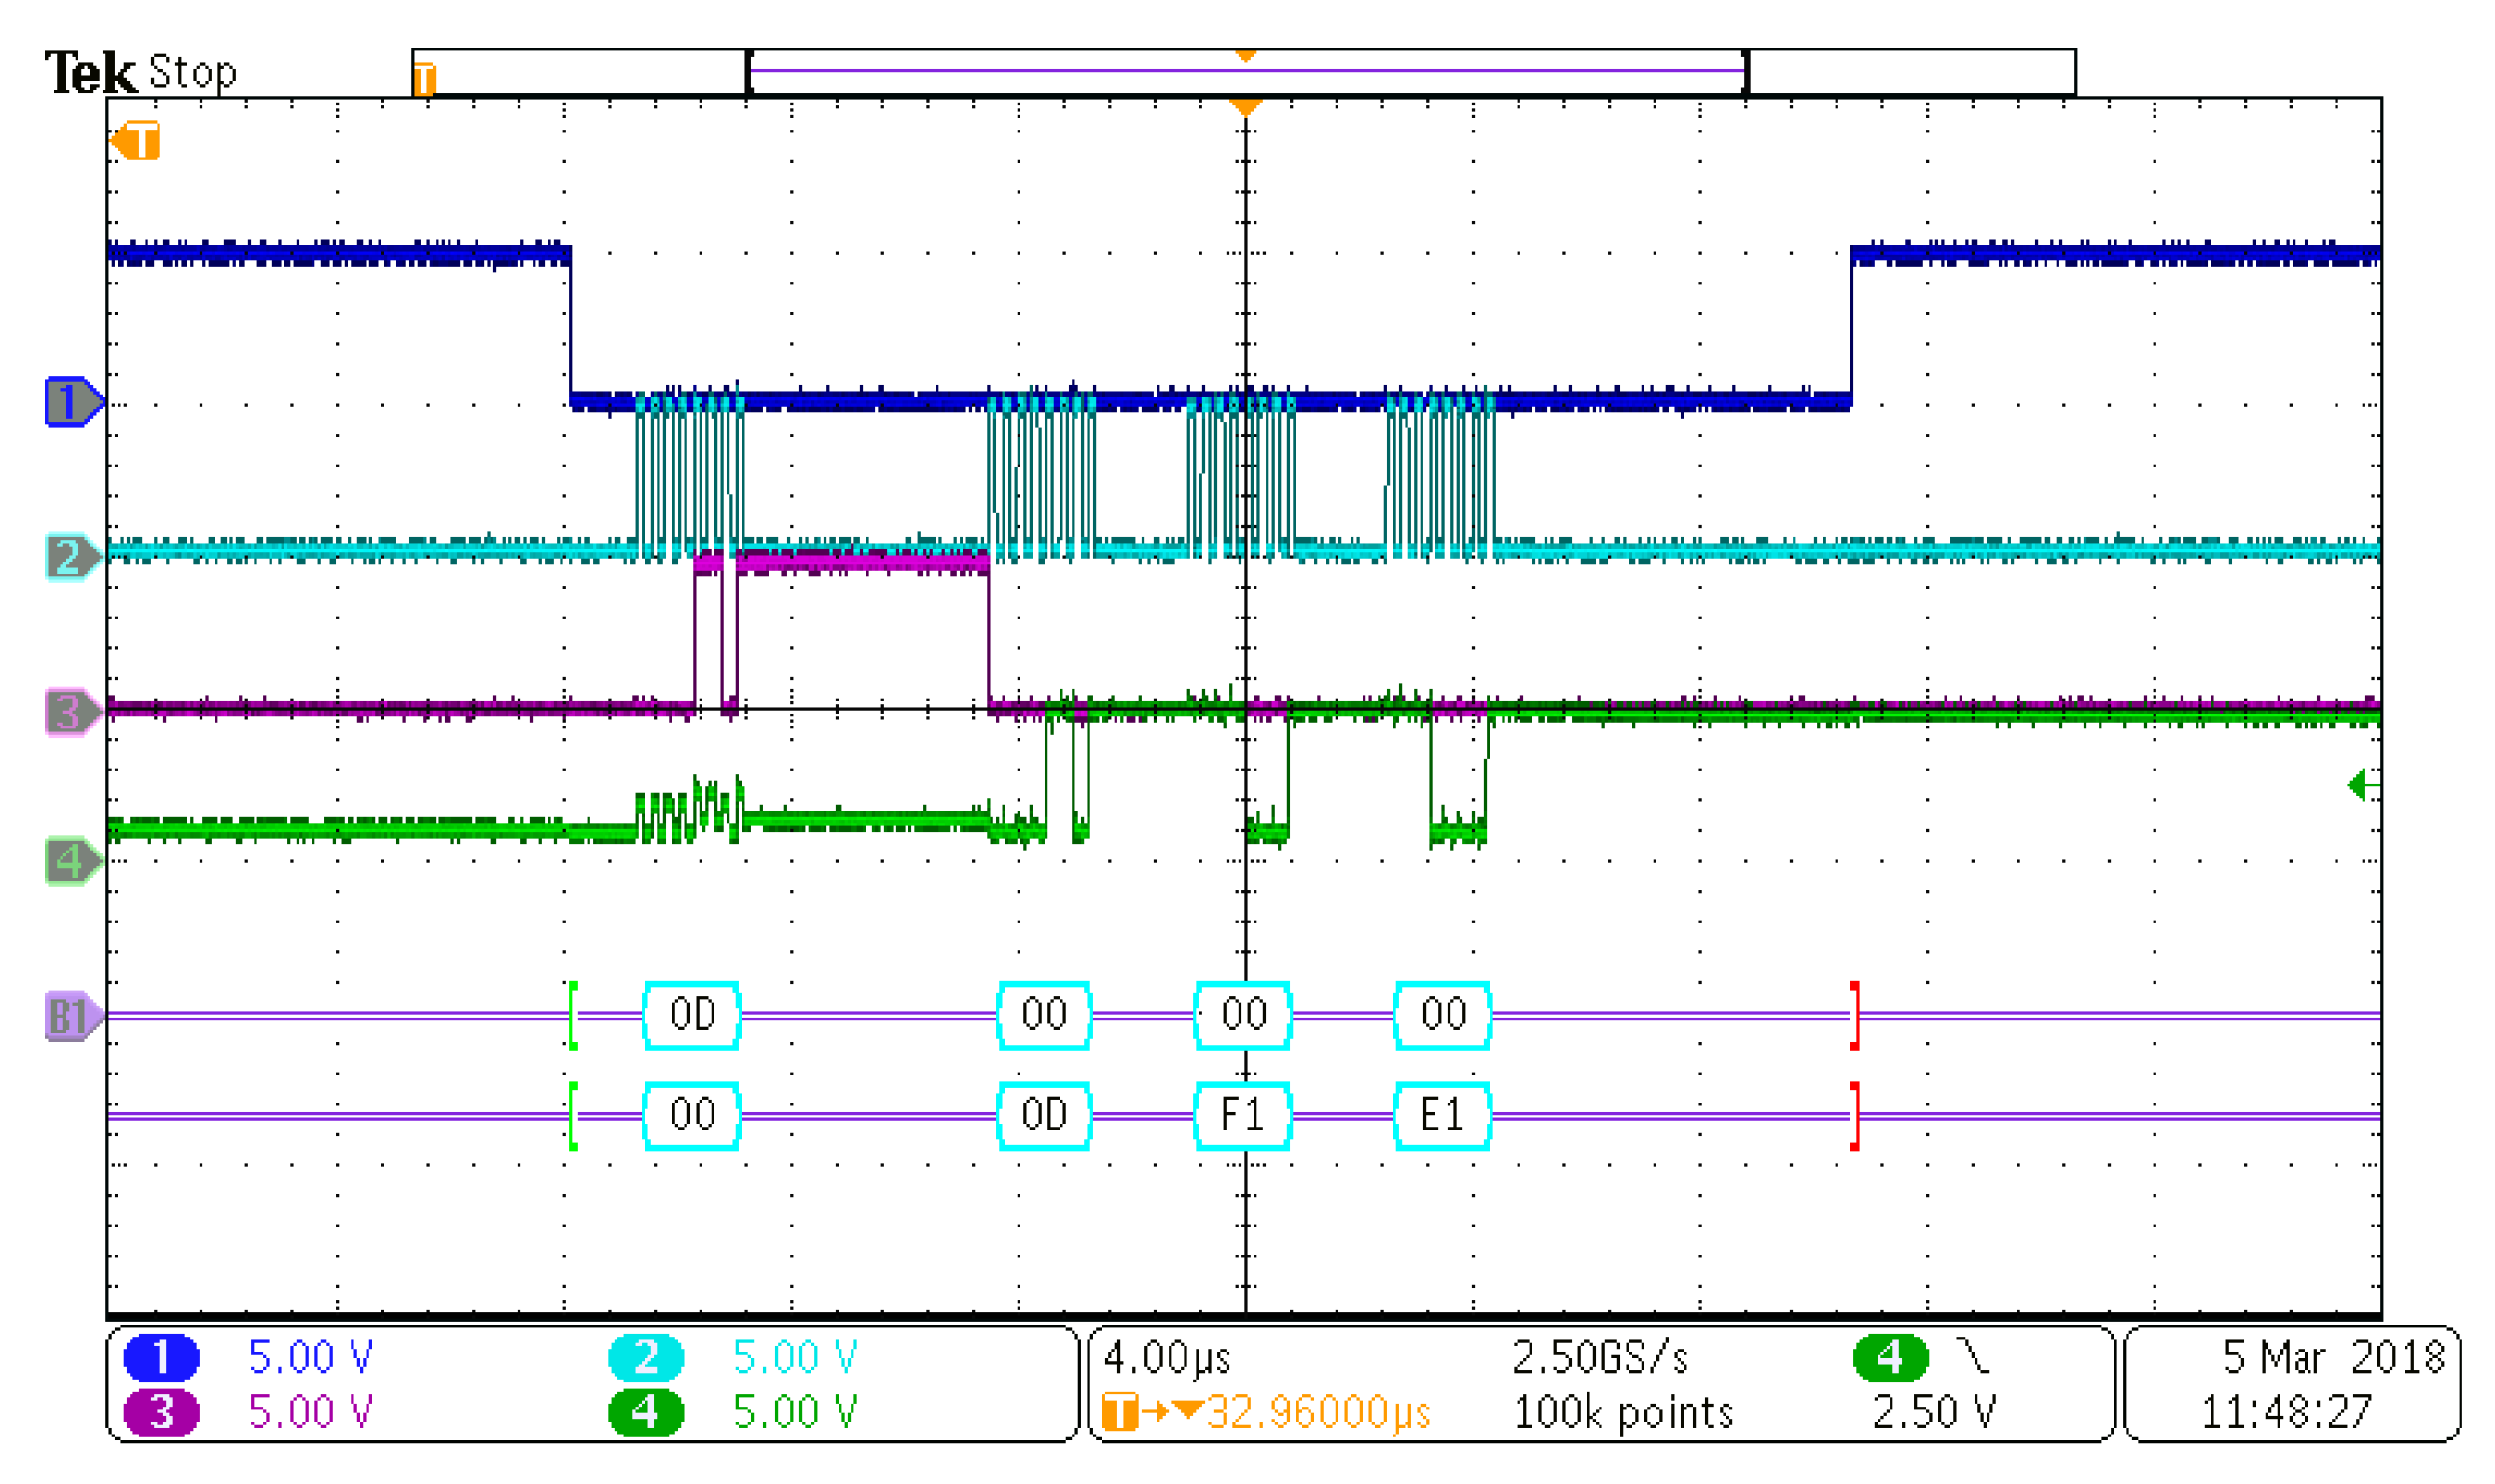
The AC programmable power system integrates a transient network analyzer and can also run several standardized PQ tests as voltage sags following IEC 61000-4-11. To have a controlled set of measurements, different voltage sags (according to the standardized tests provided by the power source) as well as different voltage RMS values, have been generated using the power source, to supply the electronic load, which has also been changed simulating different appliances. Simultaneously, the IoT PQ Sensor is measuring real voltage, current, energy as well as other power values and detecting voltage sags. To check the quality of the measurement, apart from the above equipment, two oscilloscopes have been connected for different purposes. The Yokogawa DL850E oscilloscope is recording the generated voltage waveforms at the terminal of the electronic load (i.e., the same voltage as the IoT PQ sensor is recording, and the RMS value can be also checked with it). Moreover, the Tektronix MDO3024 Mixed Domain Oscilloscope is recording the SPI communication signals between ADE7758 IC and the MCU (to check communication stability).
The sensor uploads information from the V
RMS, I
RMS, Active Energy and Apparent Energy variables, which are obtained by aggregating several raw data points. Additionally, voltage sags are also on-time monitored and stored in the Cloud. All those data uploaded to the Cloud are accessible through an electronic device with an Internet connection. In fact,
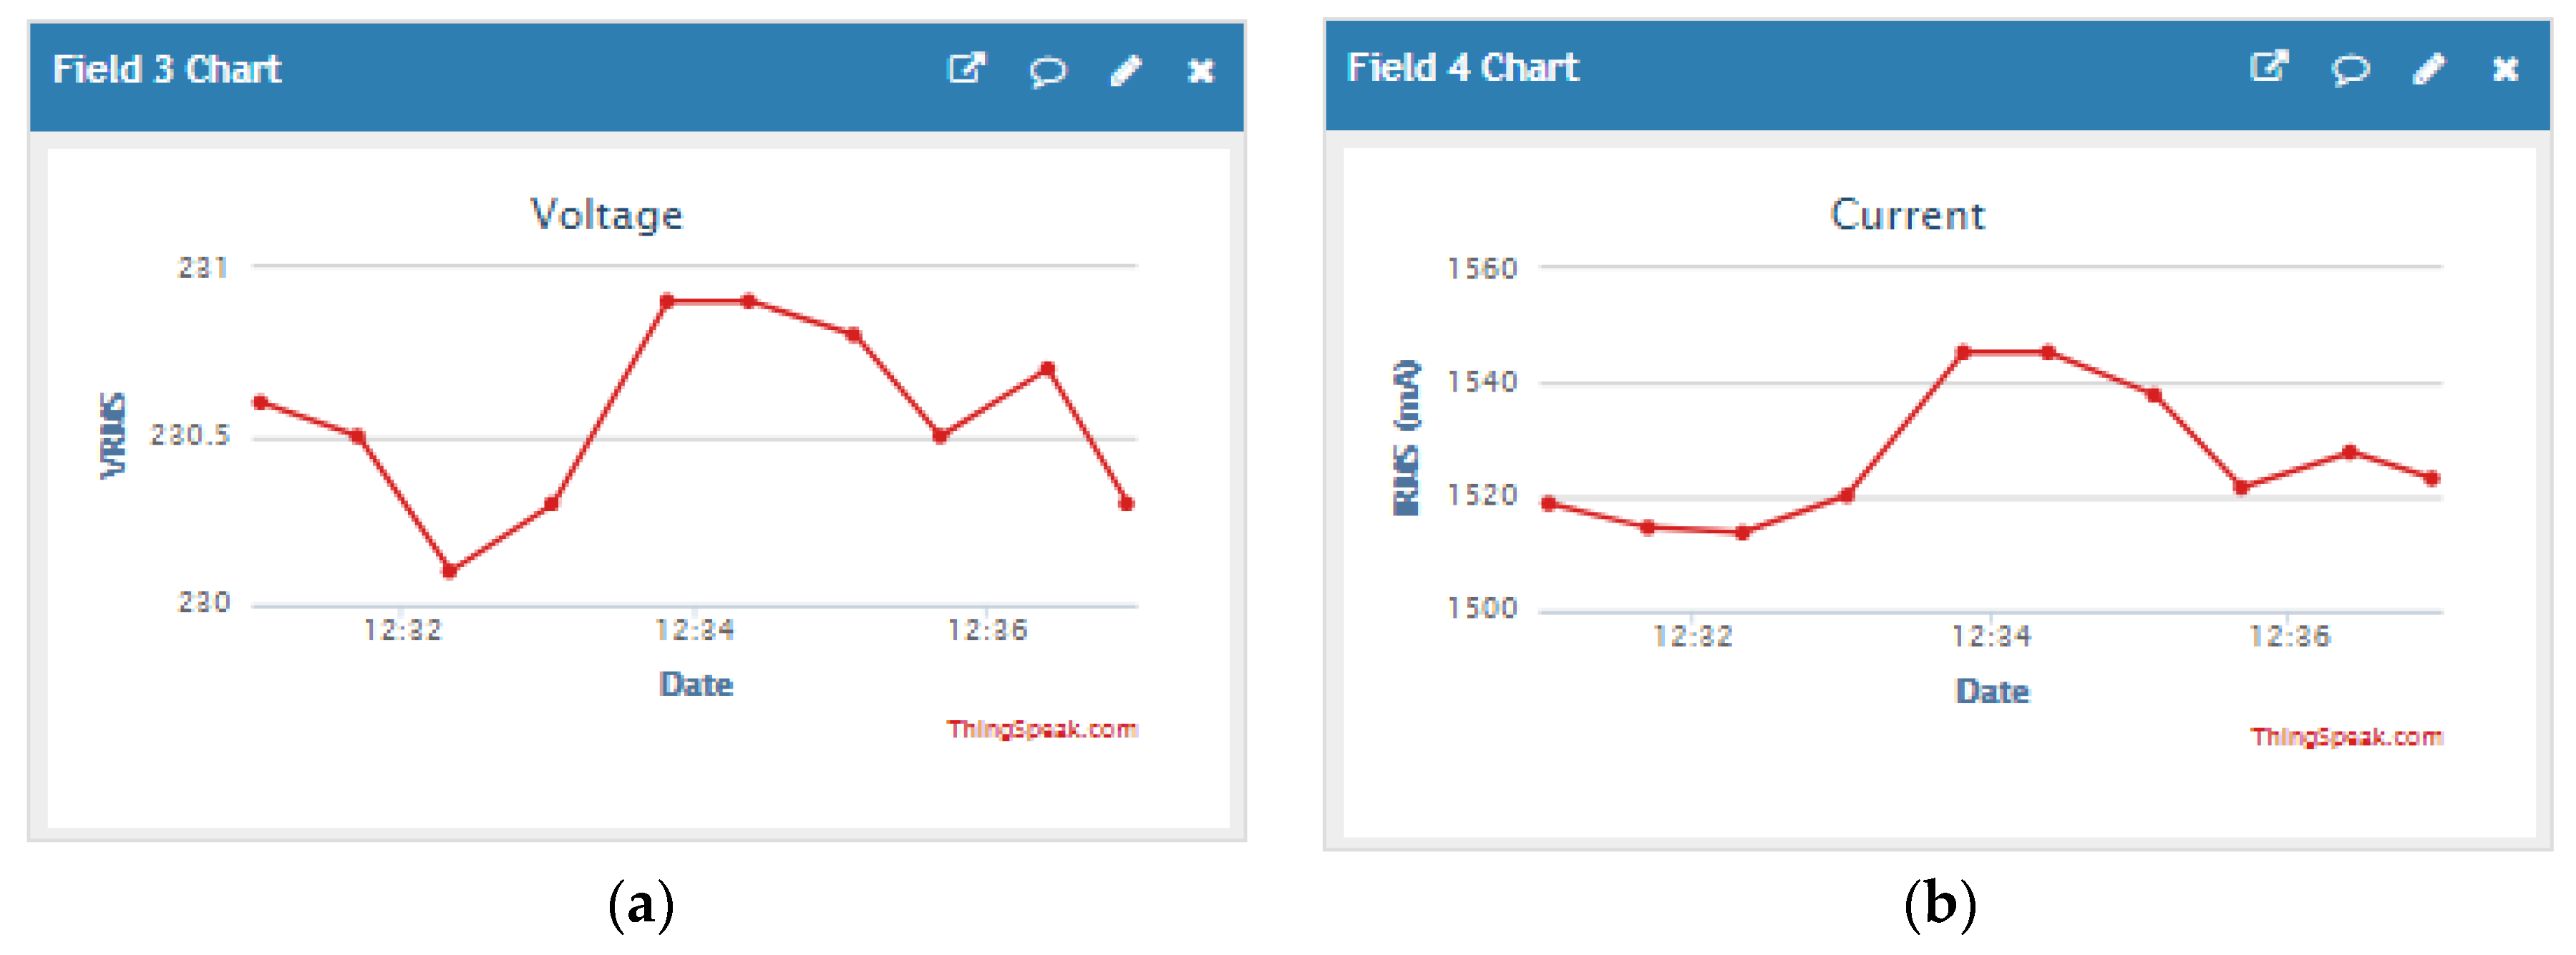
Figure 14 has been taken directly from the channel of ThingSpeak used for this experiment [
50] using a search engine on a PC.
Figure 14 (directly obtained from the ThingSpeak platform) shows the instant values as well as the time stamp of the upload data, given by ThingSpeak.
Figure 14. (a) VRMS (b) IRMS uploaded in ThingSpeak.
Figure 14a,b, represent the voltages at the terminals of the programmable load and the current flowing through it due to applied voltage respectively, representing an appliance.
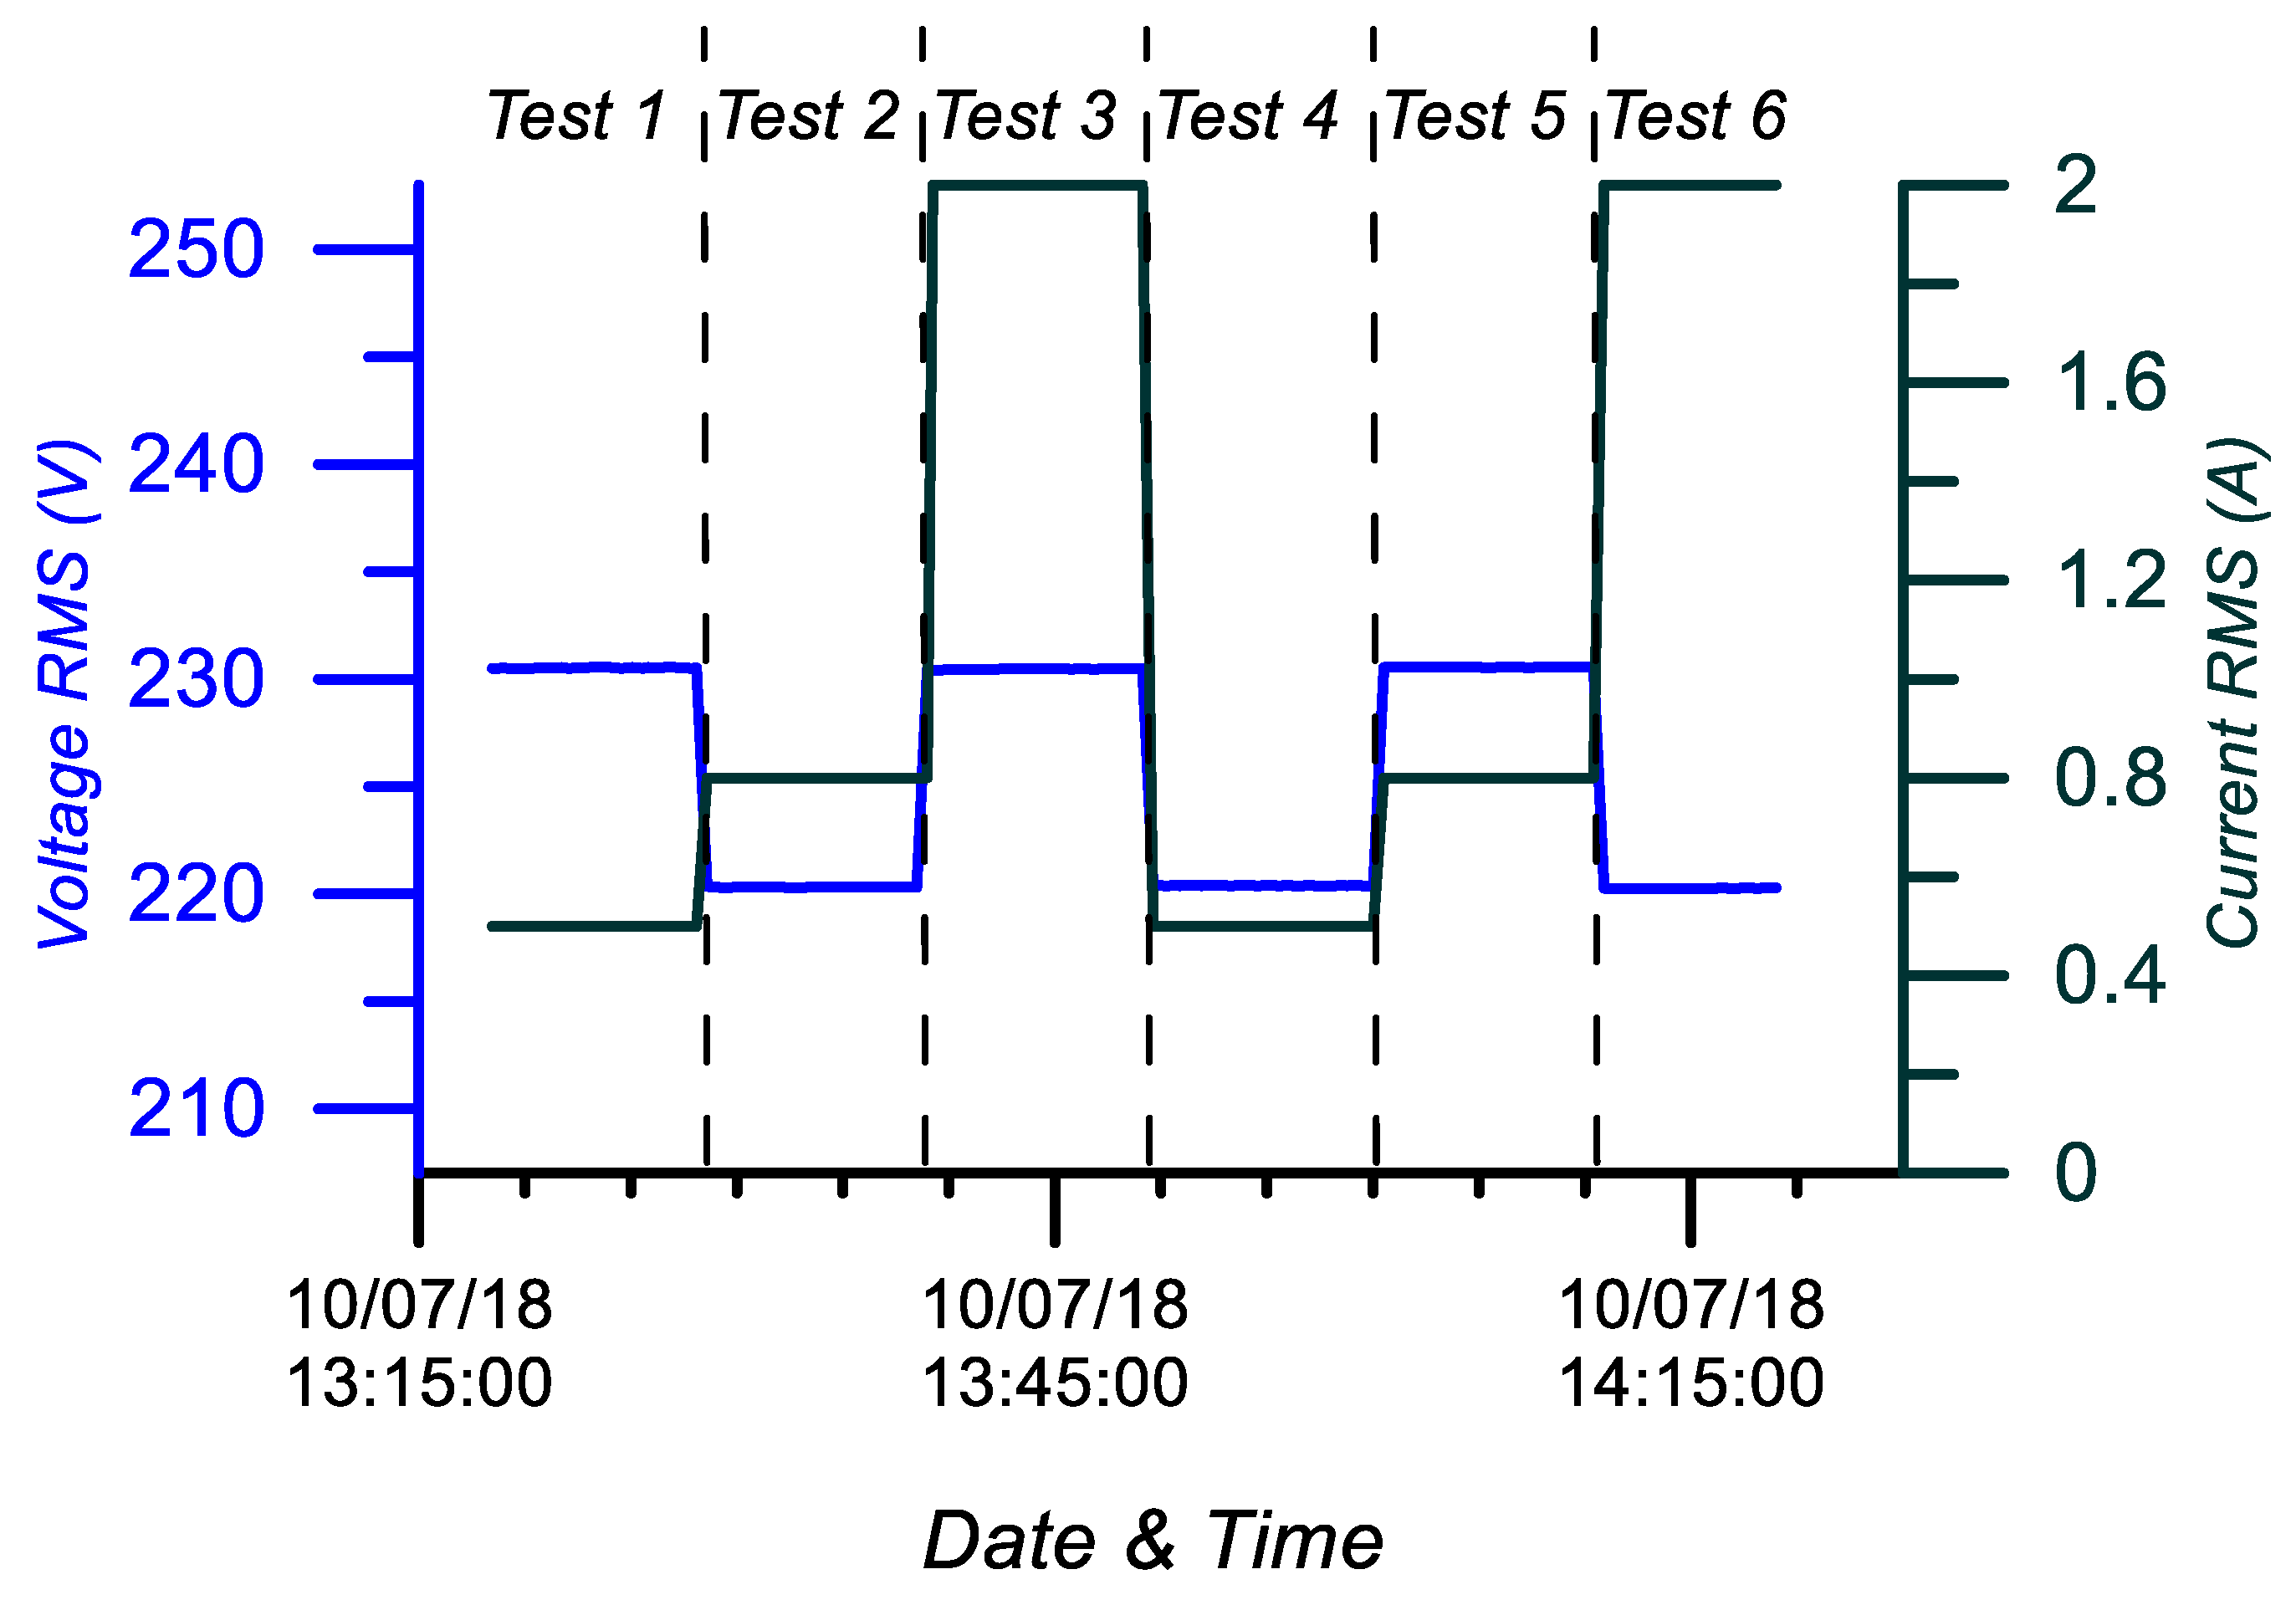
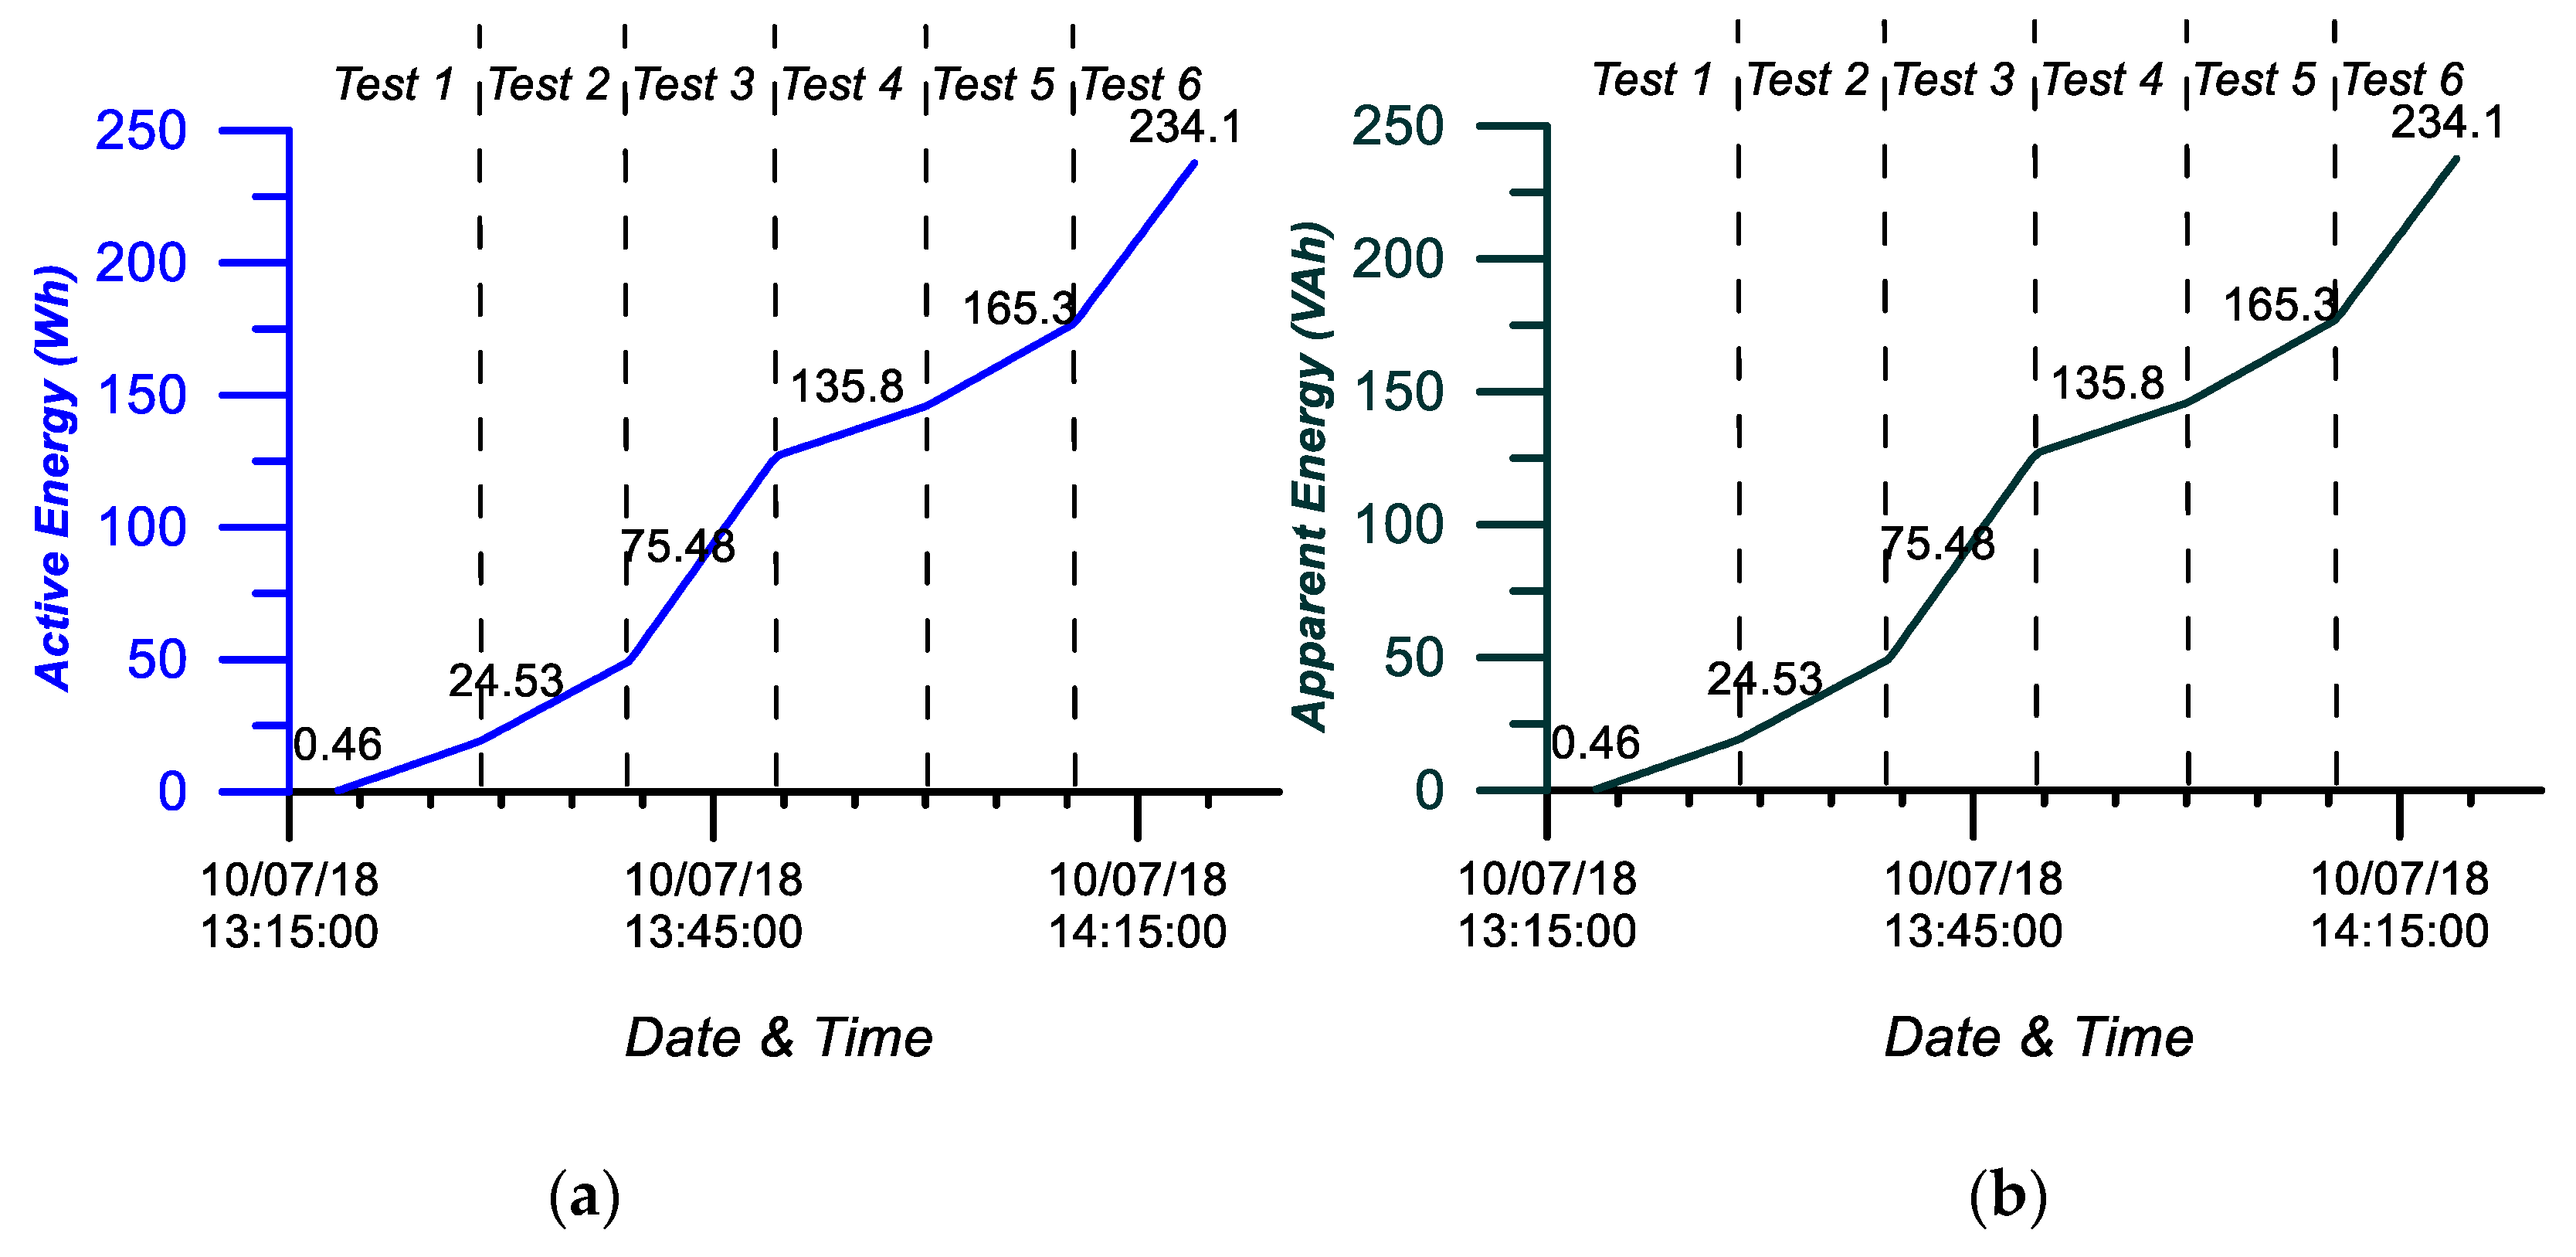
To ensure the reliability of the system, the prototype was subjected to a long-term monitoring test. For one hour, the IoT PQ sensor was monitoring the above variables under different supply voltages and load states, in total six different tests of 15 min duration each, and uploading data every 30 s to the Cloud (aggregating values between sendings). The V
RMS was changed in two different voltage levels (220 and 230 V), and the current was also changed in three different levels (0.5, 0.8 and 2 A).
Figure 15 shows the monitored voltage and current values taken by the sensor during long-term monitoring test. 30 points were recorded in every test, all showing the stability of the sensor.
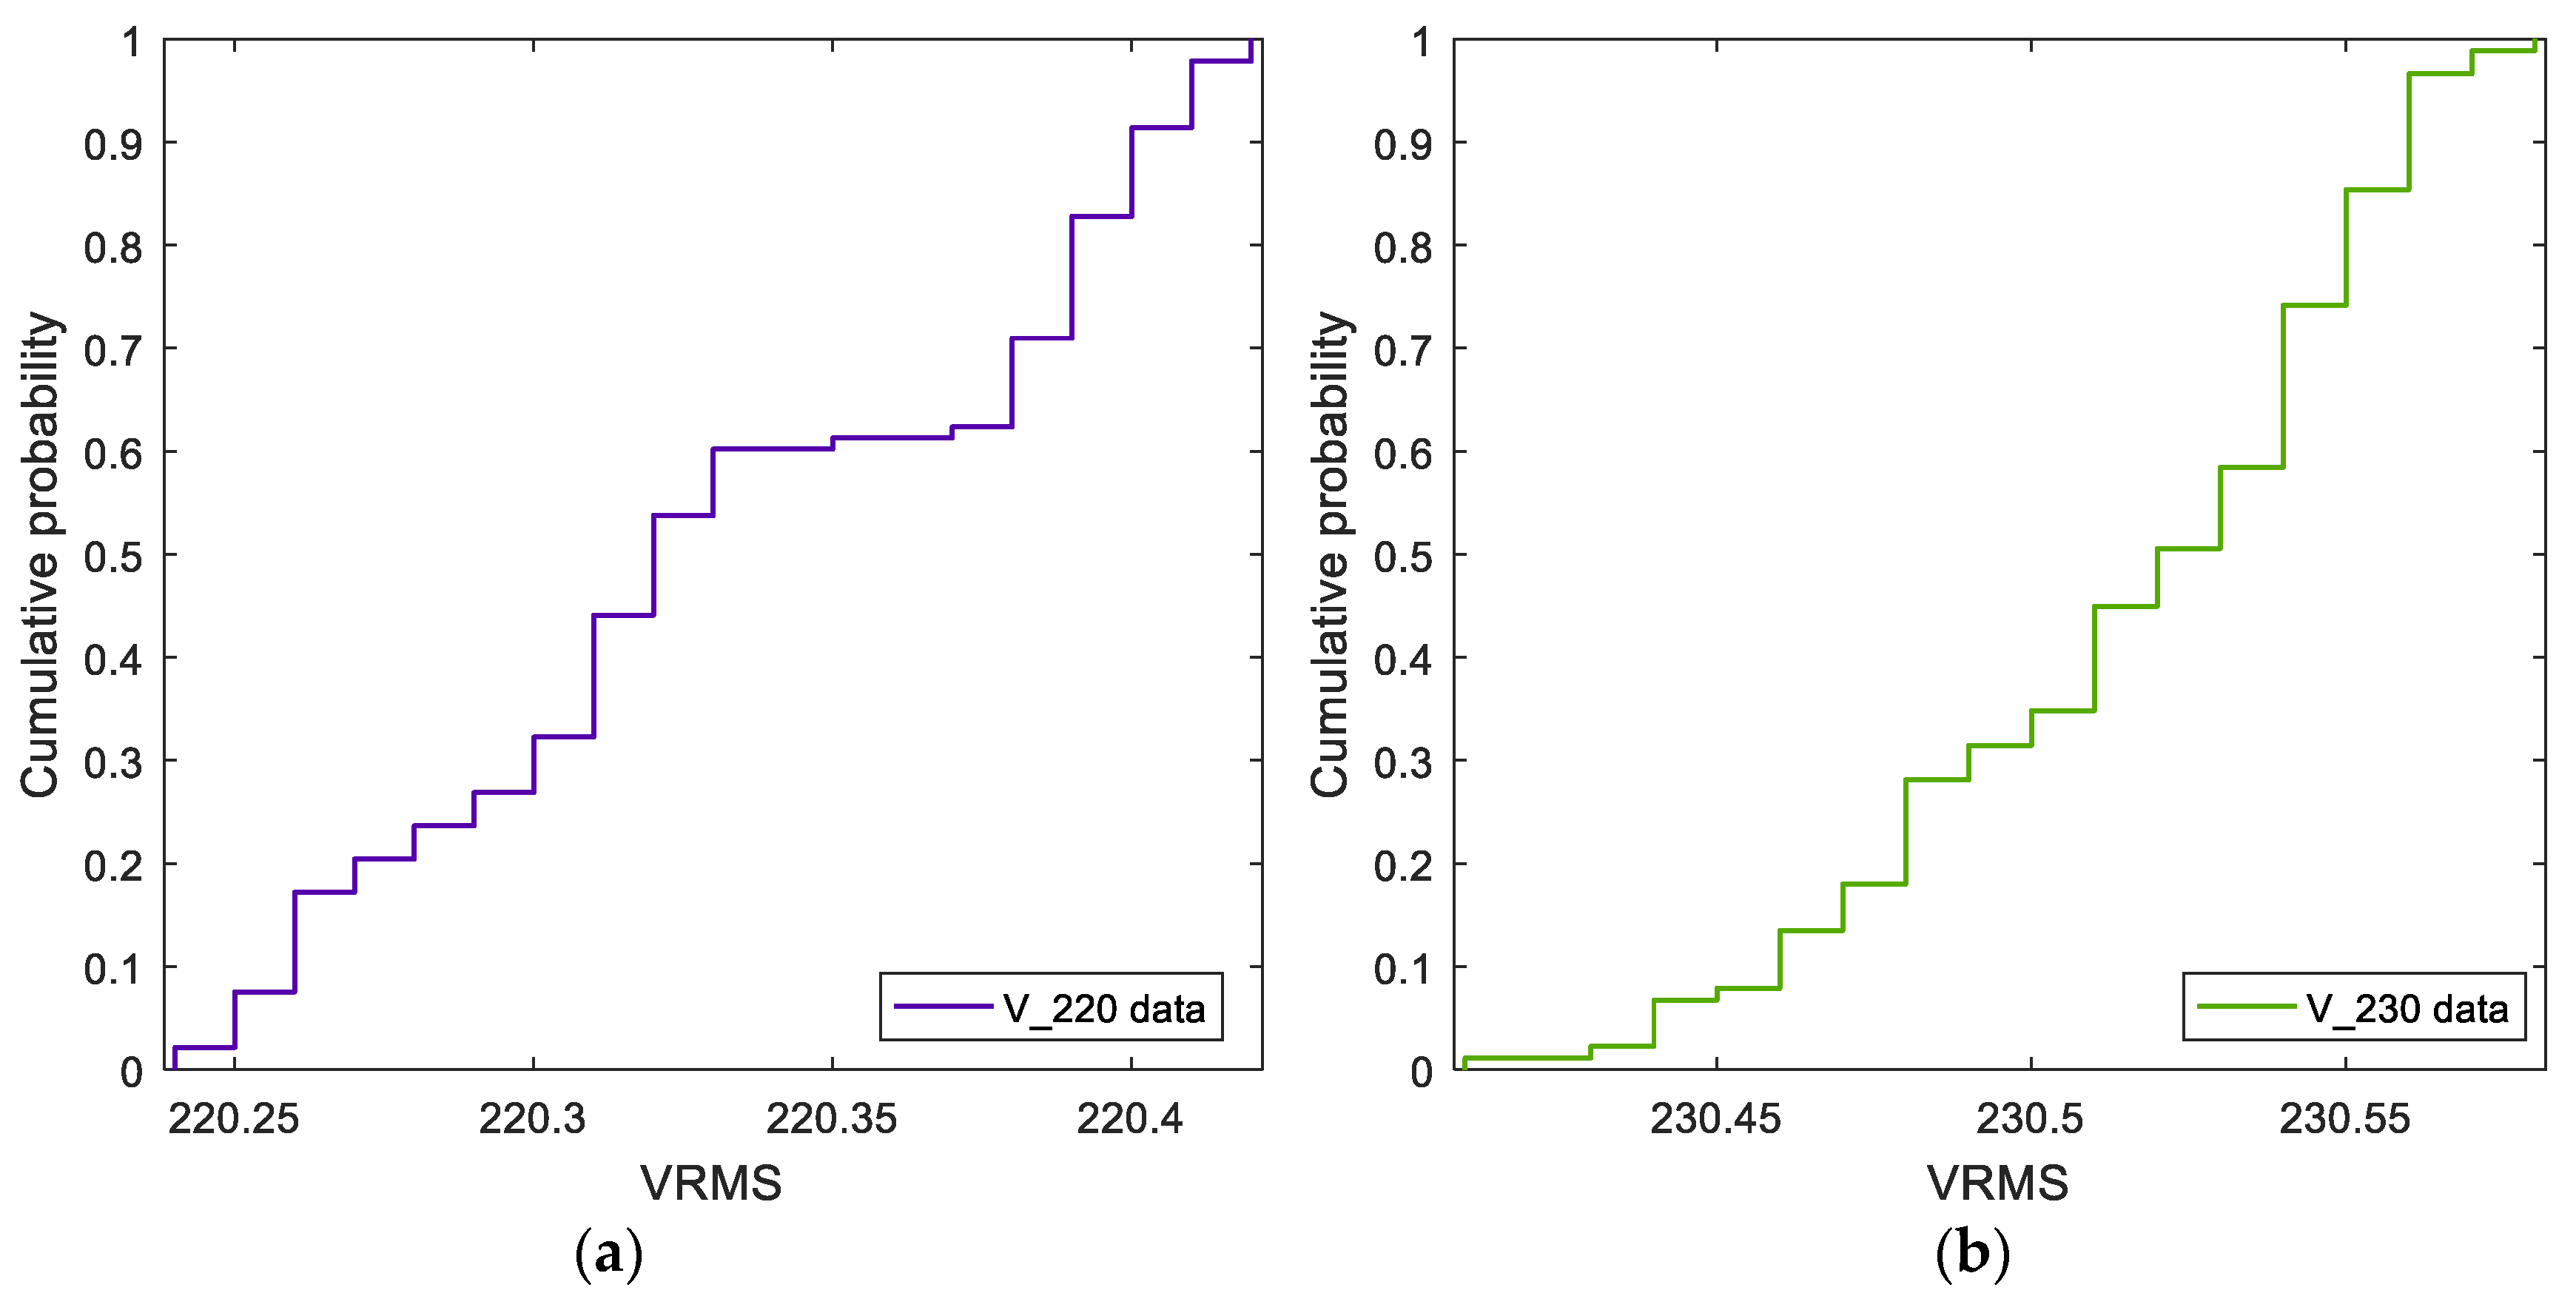
To quantify the reliability of the sensor, the cumulative distribution function of the measurements shows that when setting 220 V in the power source, the interval between 10% and 90% of the registered values gives 220.27 to 220.4 V (
Figure 16a). In this interval, the average is 220.3 V with 0.05 V standard deviation. The same ratio appears when setting the power source to 230 V, in this case the sensor measurement varies from 230.45 to 230.6 V (10–90% confidence interval) (
Figure 16b). The average voltage is 230.4 V (with a standard deviation 0.04 V).
In the case of the current, the standard deviation is below 0.01 A. Regarding the active and apparent monitored energy data (
Figure 17), both trends are equal as the load was configured as a pure resistive load with unit power factor.
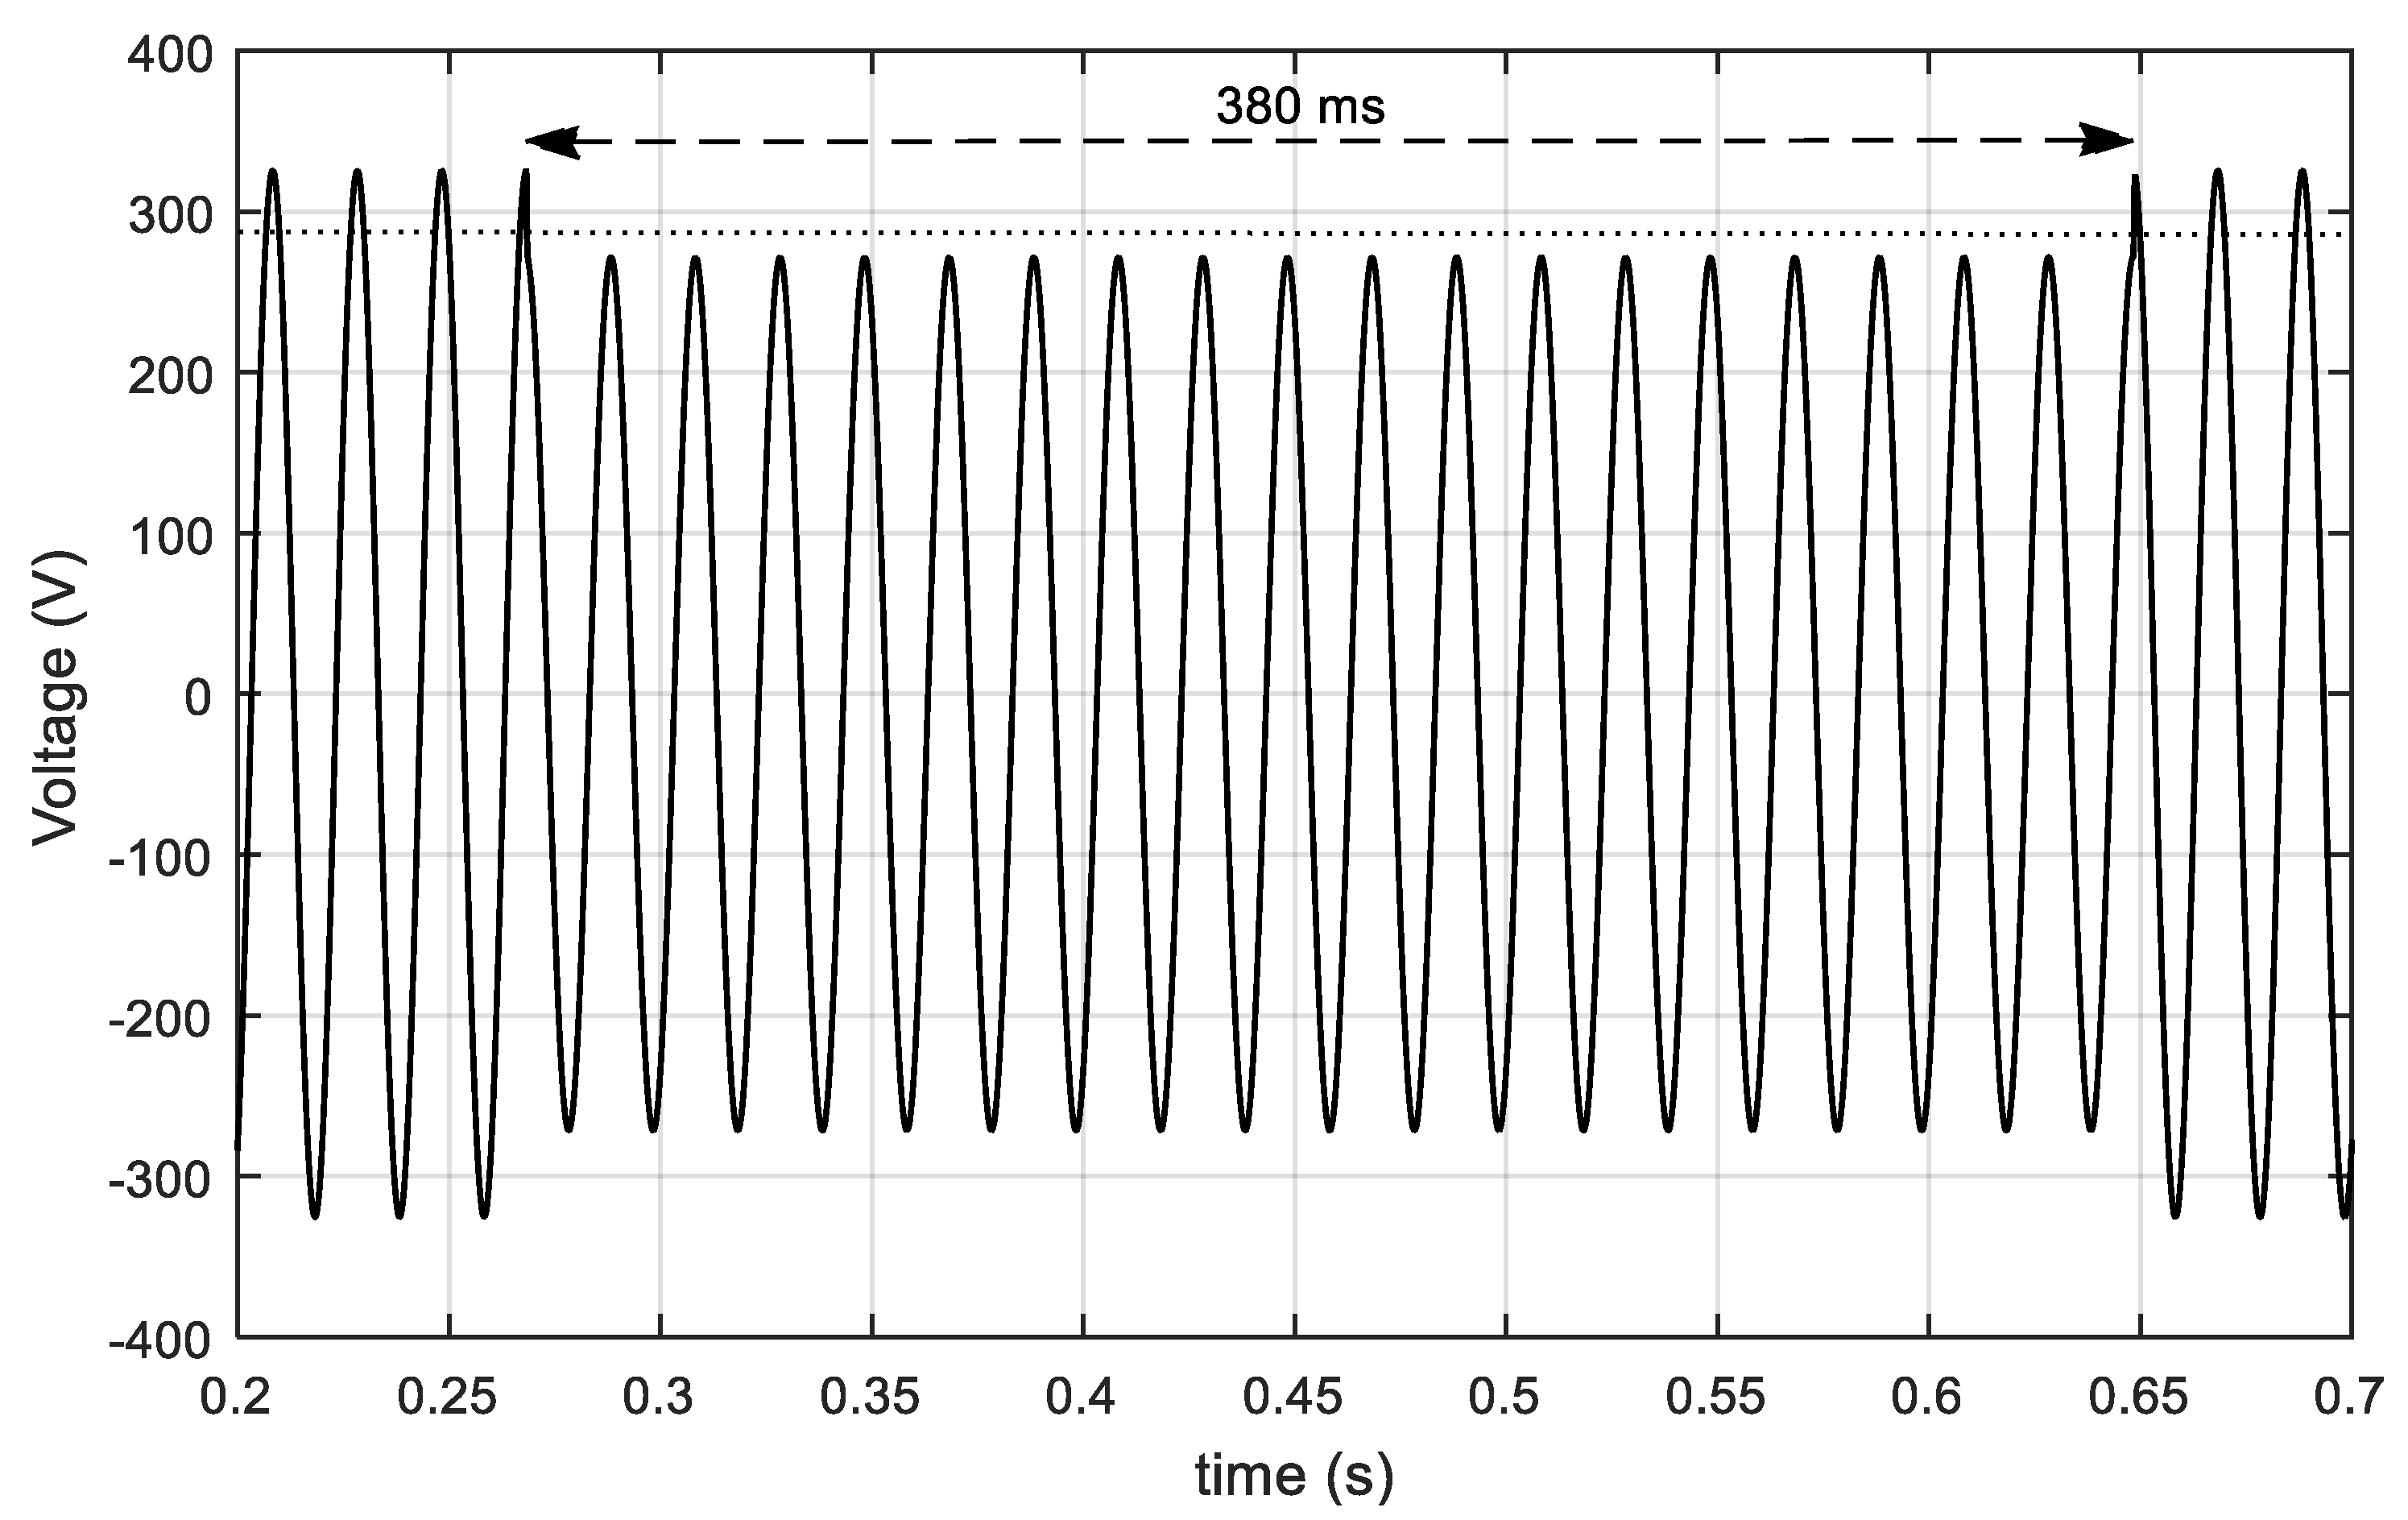
Apart from voltage and current magnitudes, different voltage sags (with different magnitudes and durations) have been created in the power source and fed to the electronic load to be monitored by the IoT PQ meter and check the event detection functionality. Therefore, the California Power Source was configured to create user-defined sags. The first sag tested was a 380 ms 83.5% V
NOM (
Figure 18) where the V
RMS change from the nominal value (230 V) to 192.05 V during 19 line frequency cycles, and after these 380 ms, there is a recovery and the voltage returns to 230 V.
Figure 18 shows the voltage measured with the Yokogawa DL850E Oscilloscope and processed with MATLAB. This allows graphical testing of the voltage waveform and consideration as a reference to compare the measurements recorded by the IoT PQ sensor. In fact, the data that are uploaded to ThingSpeak are those that are important to quantify a sag, i.e., the voltage magnitude of the sag (in this case 192.05 V) and the duration (380 ms in this case). The result of this first measurement given by the IoT cloud system is shown in the first row in the
Table 3 Sag Report.
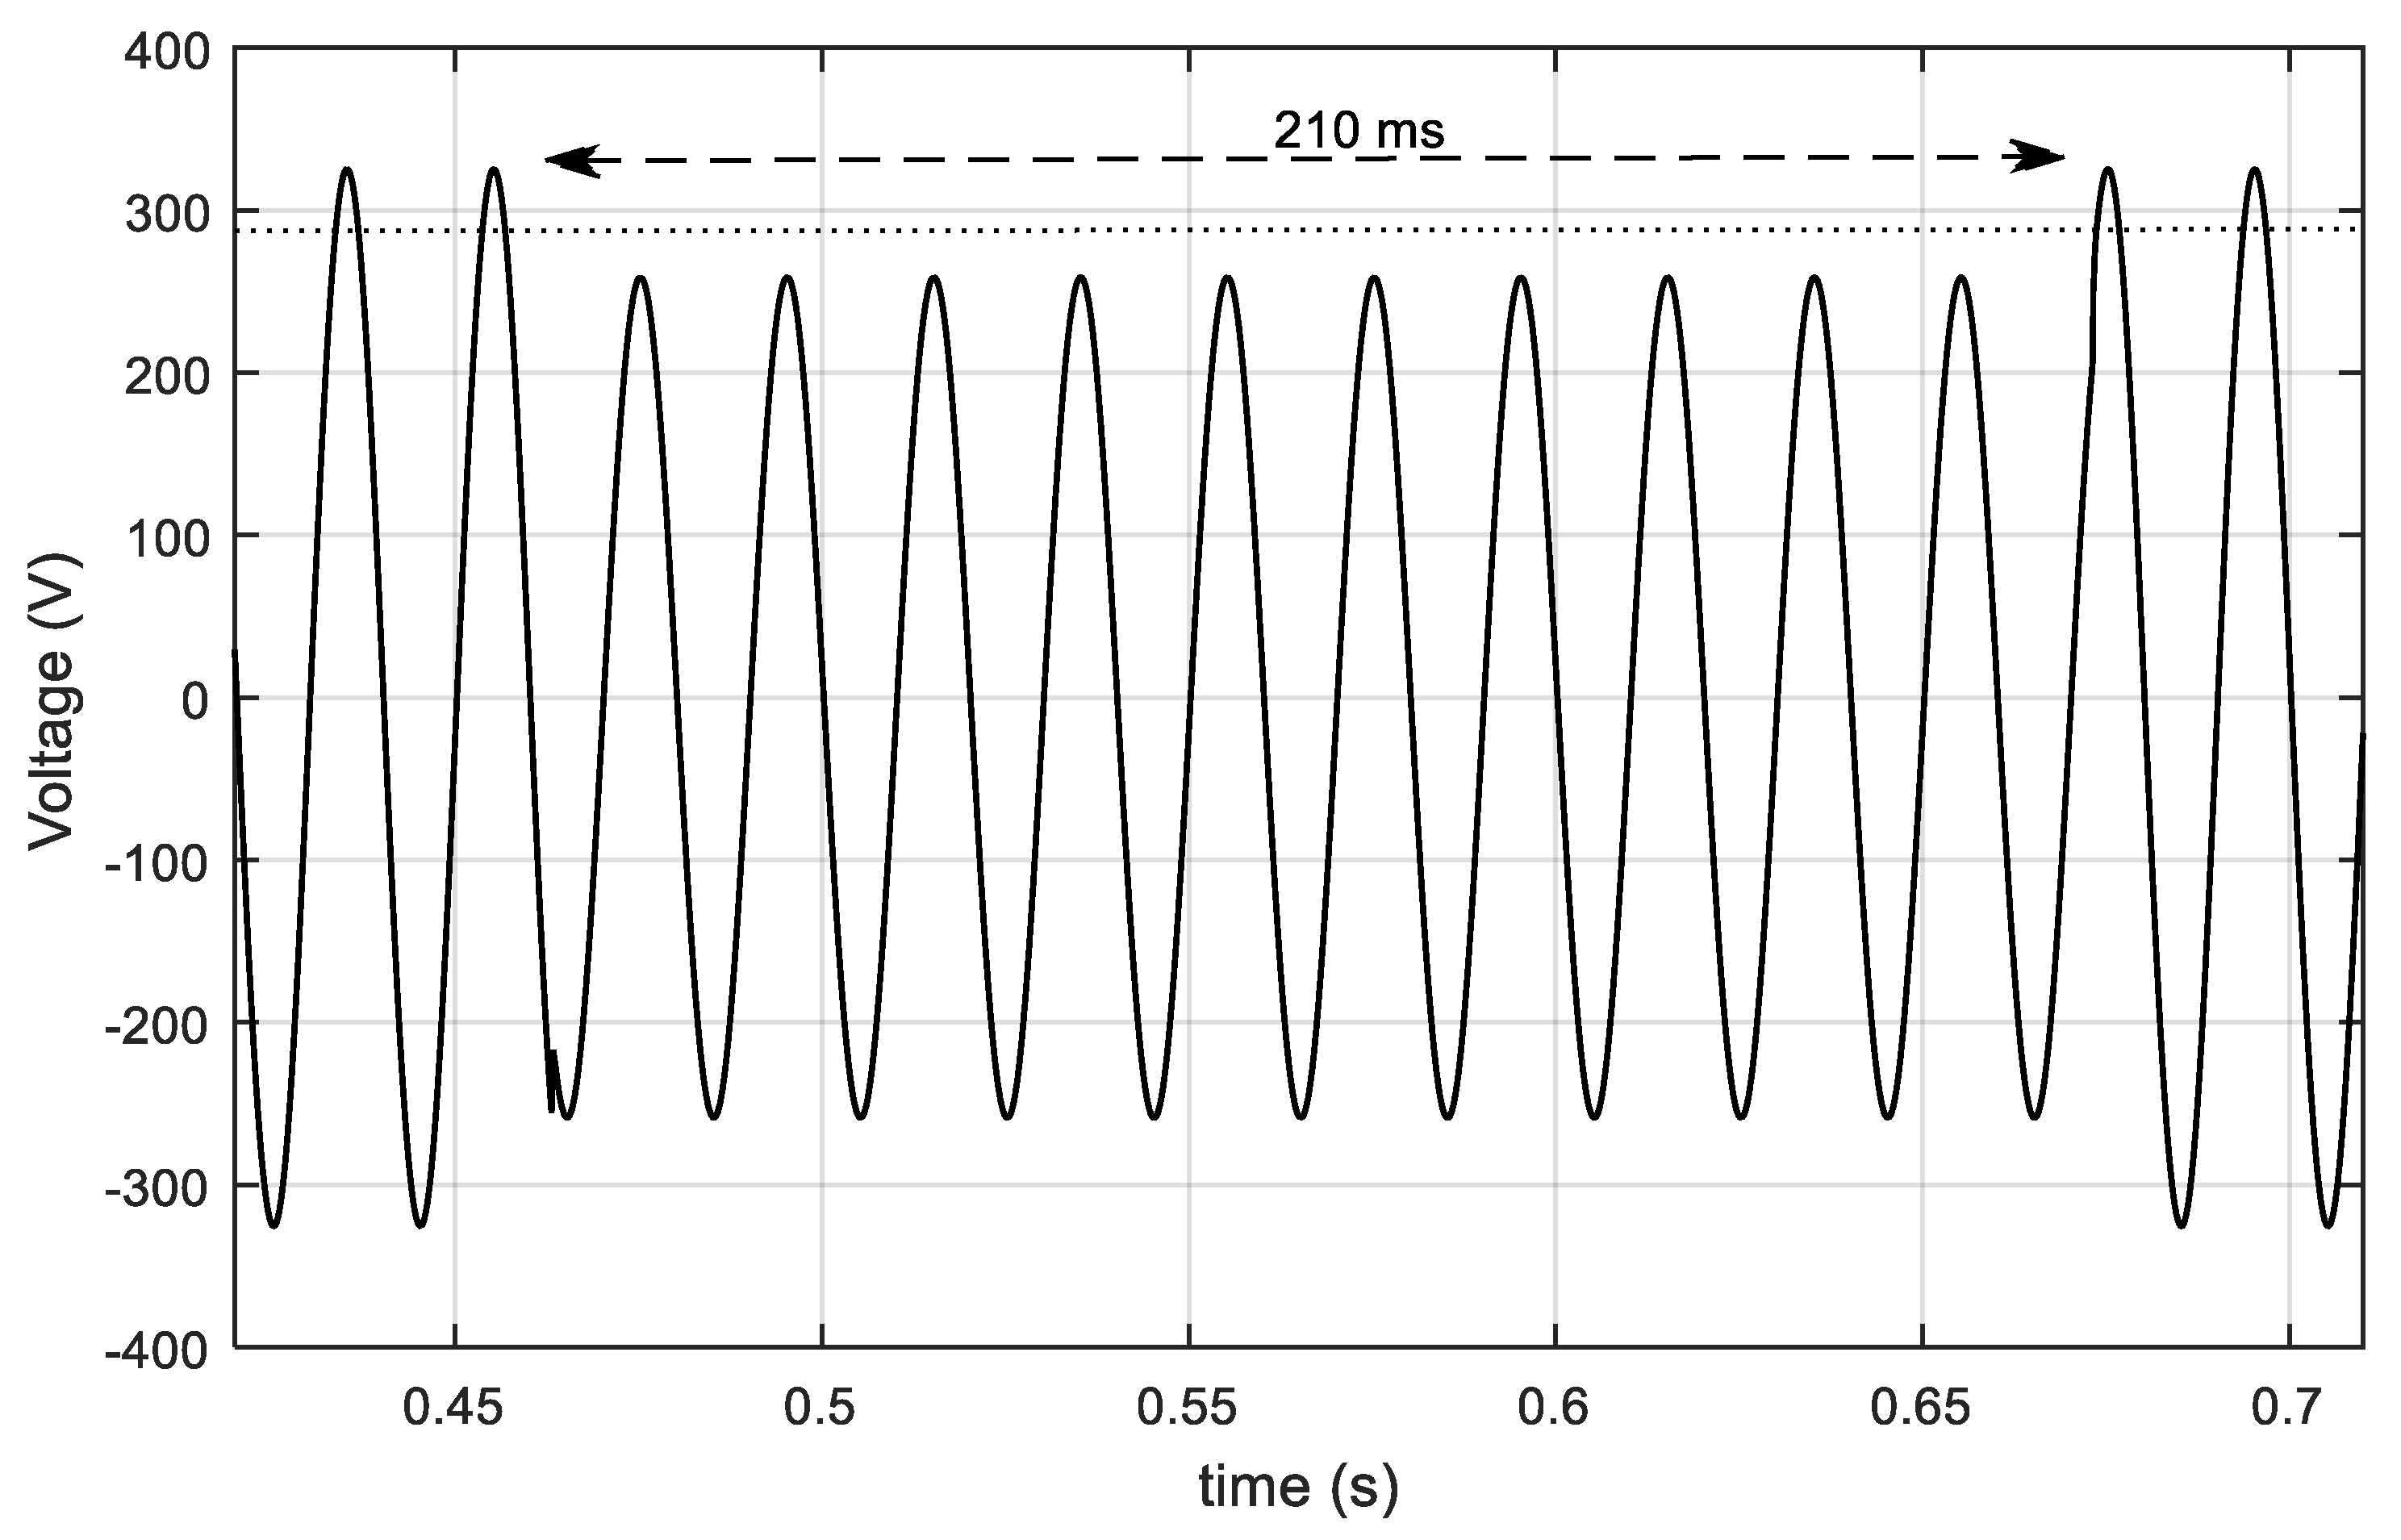
Another magnitude and duration has been selected. The second voltage sag generated and monitored by the sensor is a 210 ms 79.6% V
NOM (
Figure 19). The measurement registered at the ThingSpeak platform by the IoT PQ sensor is shown at row 2 of
Table 3, showing the magnitude (183.4 V) and the duration (210 ms) without no error in the measurement. In this case, the voltage waveform measured by the Yokogawa DL850E instrument is shown in
Figure 19. The sag changes from the nominal value to a voltage level of 183.1 V, kept during 10.5 periods at line frequency.
The report shown in
Table 3 is generated within the ThingSpeak platform, done with MATLAB code included in the Cloud. The report contains the historic sag events measured by the IoT sensor. The two first voltage sags represent the sags previously shown in
Figure 18 and
Figure 19 respectively. This is another novelty of this paper: a sag report generated in the Cloud with data from an IoT PQ sensor. The interesting point here is that the sag timestamp comes from the RTC peripheral information, so it is a precise value. The disadvantage with ThingSpeak is that the timestamp is given by the time when the measurement is uploaded, but in this case, the information sent to the Cloud also contains information about the timestamp.
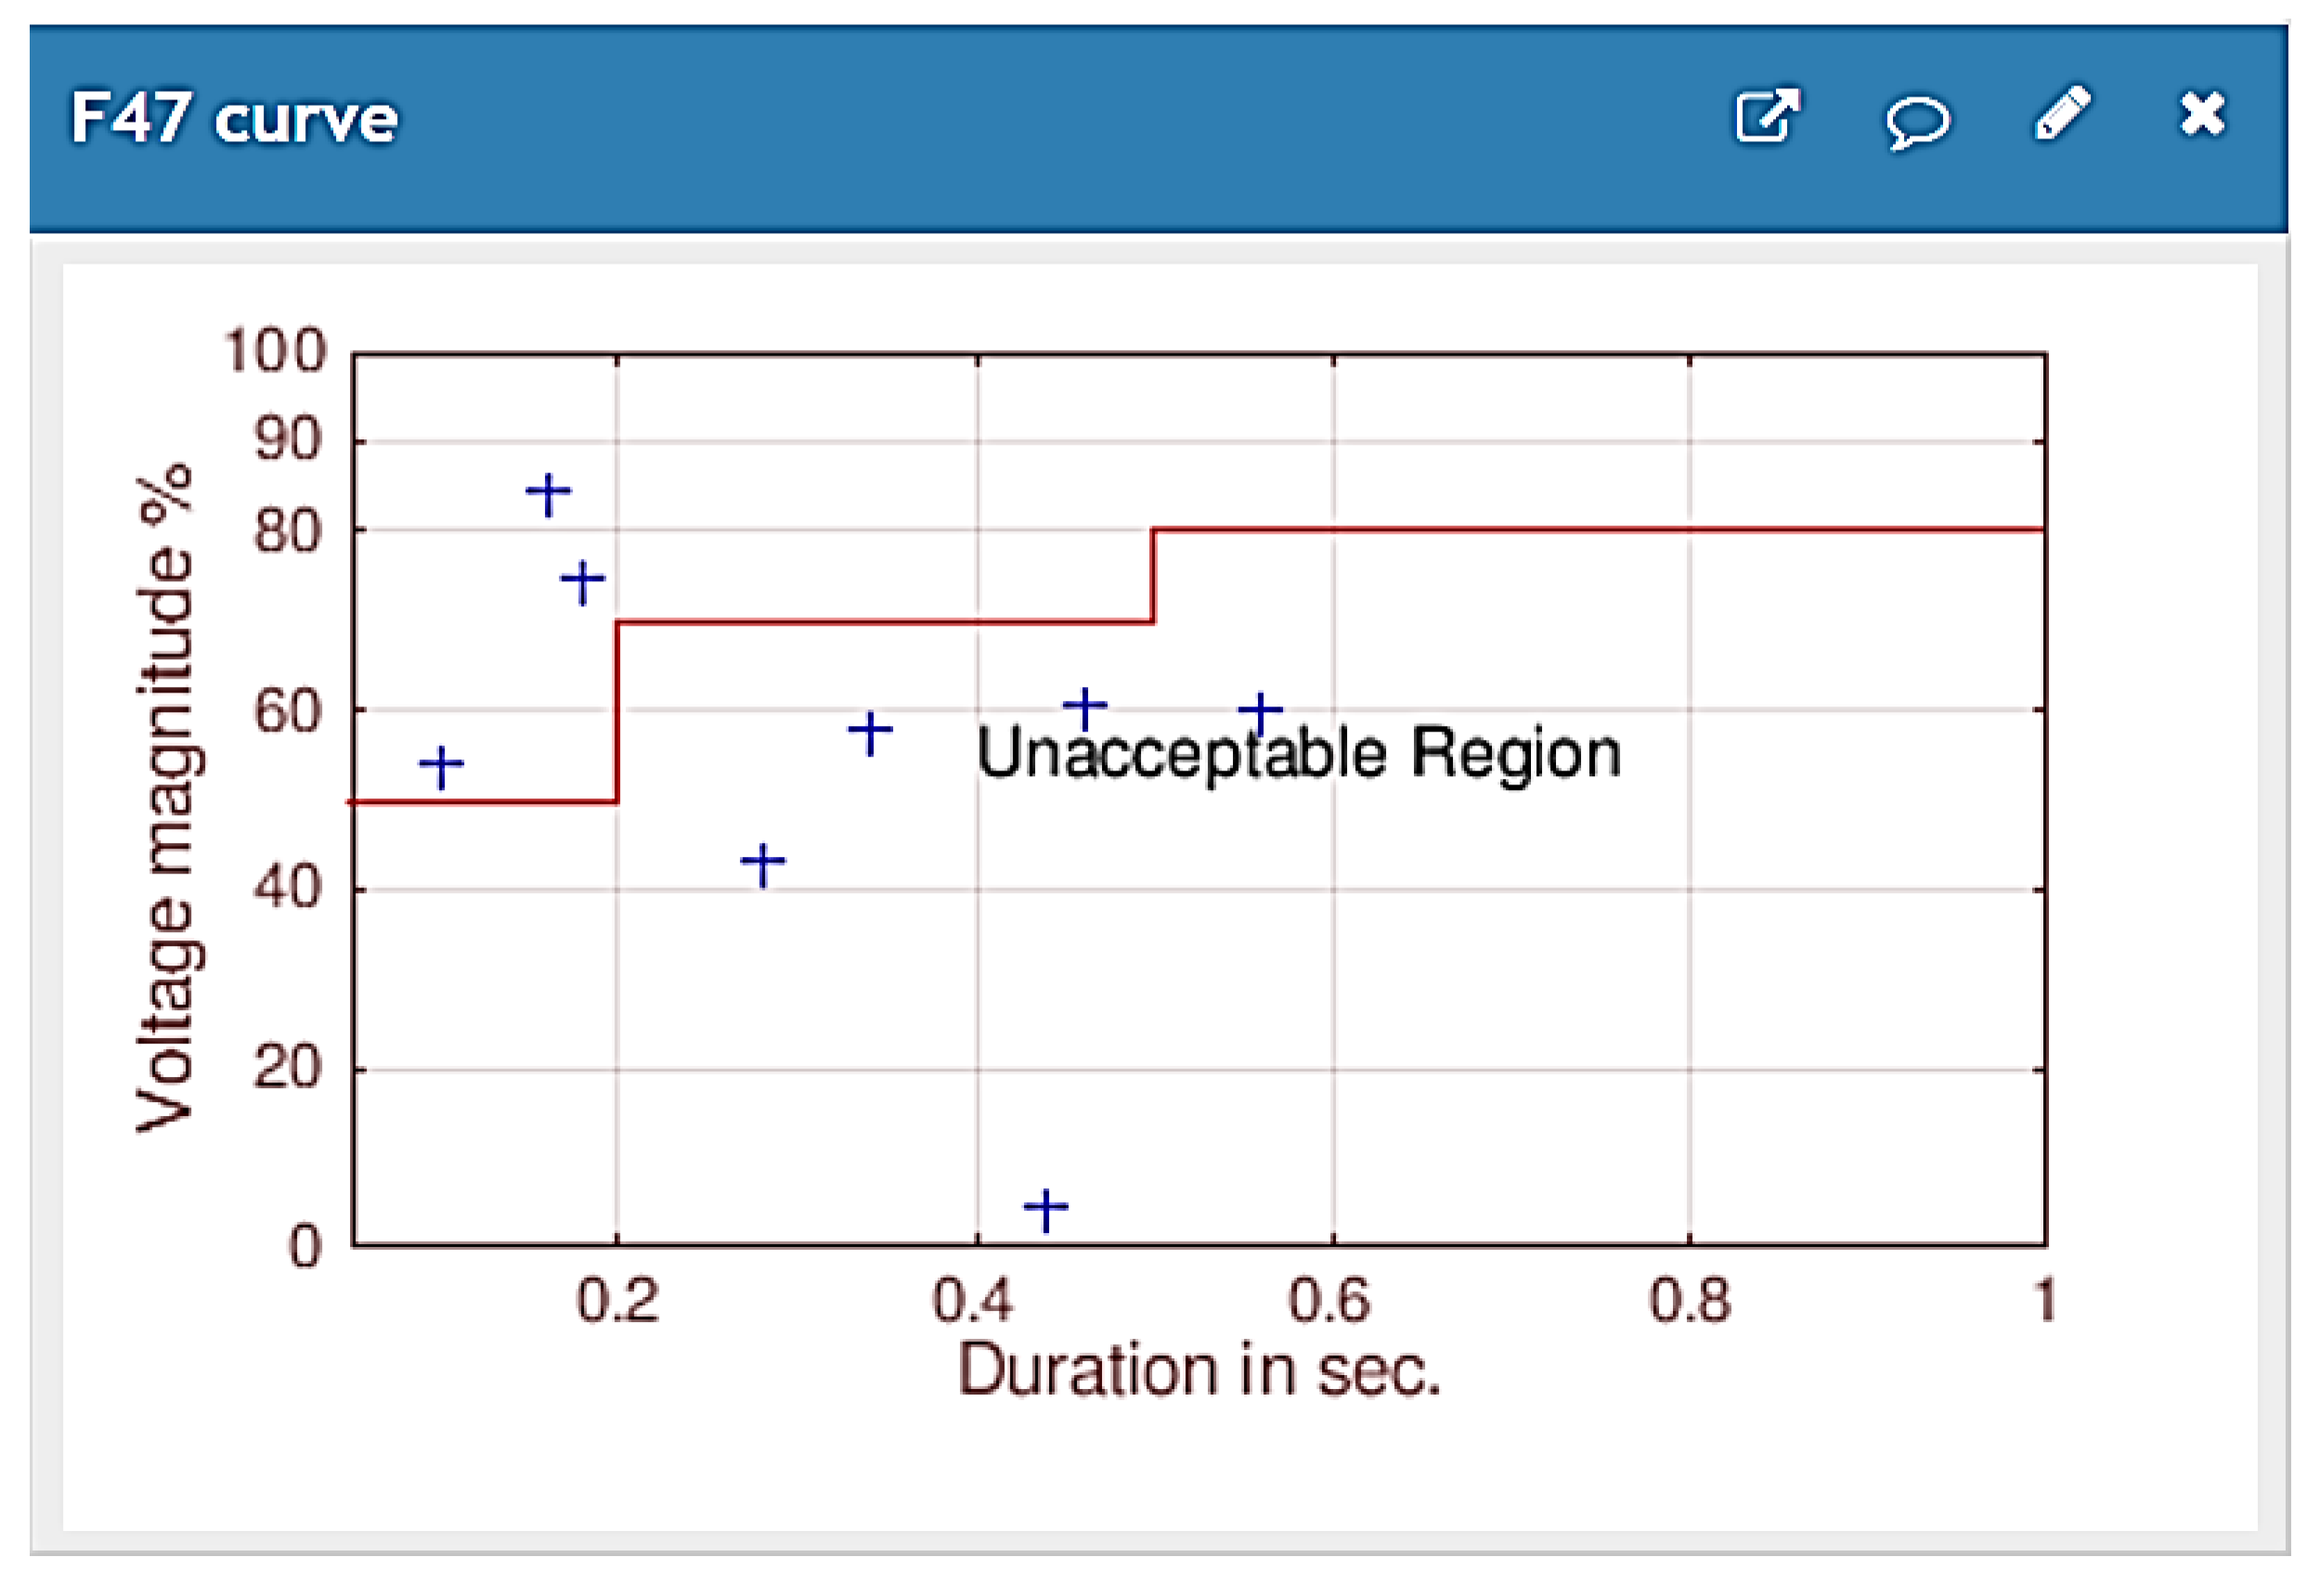
Extra functionality has been implemented in ThingSpeak with a MATLAB code integrated in the application. For the usefulness of the management operator, not only is a PQ report needed, but also a graphical way of looking, such as including the ability to show if the recorded sag meets the standard. Therefore, an advanced visualization option has been considered to incorporate the SEMI-F47 voltage sag immunity standard curve [
49] in the ThingSpeak web page itself (
Figure 20). Similar to
Figure 14, this curve can also be seen with a cellular phone or tablet, as long as it has an Internet connection. SEMI-F47 graphs sag depth vs. duration, in a similar manner to the ITI-CBEMA curve [
51]. To this end, a MATLAB code has been incorporated in ThingSpeak, which plots the limits given by the standard (in terms of duration and magnitude of the sag). Moreover, once a voltage sag is recorded, taking the information from the report, the sag is represented through its duration (in s) and its voltage magnitude (%) with a blue cross.
Figure 20 shows some voltage sags used in this new experiment, which, in contrast to the report and as indicated above, allows the user a graphical way of accessing the information in relation to the phenomenon. Mainly, this sag depth vs. duration representation shows if the sag is (or not) in an acceptable area. This curve can offer, at first glimpse, all the sag experimented in the facility during a period. Accordingly, facility managers may confront this information with the voltage sag ride-through capability information of the equipment installed. Therefore, they can take advantage of this curve whenever they purchase new equipment complying to this standard.
6. Conclusions and Future Work
Uninterrupted operations and business continuity are key requirements for any highly automated building located under the Industry 4.0 paradigm, for which Power Quality plays an extremely important role. Power Quality is a complex domain, covering over a dozen problem areas. Early detection and analysis of such Power Quality disturbances are essential for improving the quality of service and enhancing the productivity of the system. At present, most energy-intensive buildings suffer from a certain degree from poor Power Quality, adopting partial solutions to each problem. However, there is no single solution. Relatively little attention has been focused on Power Quality.
The advantage of the system presented is that sensor data could also be indicative of equipment performance regarding efficiency and Power Quality standards. With the current Internet of Things prototype, the user will be able to detect not only most Power Quality steady-state disturbances but events such as voltage sag, while also monitoring the energy consumption.
To our knowledge, there does not exist any Internet of Things system devoted to Power Quality monitoring. This is very suitable for industrial or commercial facility submetering. Through the Cloud-based Internet of Things platform, the information can be accessed, analyzed, stored, and visualized through different devices in a user-friendly manner, avoiding the need for significant investment in proprietary software infrastructure typically required for other measurement systems.
Future work can be done towards customizing Power Quality statistics that are relevant to a particular appliance or system to better forecast overall facility health. In fact, a mesh of Internet of Things Power Quality sensors and their raw measurement data can be aggregated to correlate and help identify sources of disturbances in the near future using machine-learning strategies. Those sensors can also be embedded into the appliance for tighter integration and surveillance. This could support higher understanding of the currently consumed electricity e.g., by the comparison between identical devices consumption, monitoring trends and conditions, or even further, allowing an optimized maintenance scheduling focused on preventative maintenance only when it is required. Moreover, the detection of Power Quality disturbance leads to the anticipation of faults with early-stage alerts based on on-time data streams. These data can be used to continuously track and diagnose ride-through capabilities within devices to withstand the fluctuations in the electrical supply, pro-actively and remotely identify and manage reliability issues, establishing whether the responsibility is from the distribution system or because of incidents inside customer premises, thereby boosting the ability to act and react in real-time, or near real-time, for the effective and efficient use of electricity.
In the future, authors will make the prototype smarter from two points of view. At the initial level, algorithms might be designed and executed within the prototype to help in selecting only the relevant information from an energy point of view. At a higher level, on the Cloud side, authors would consider applying machine learning to exploit all the received information from the Internet of Things Power Quality sensors to discover possible disturbances and anomalous behavior.


 ,
, 


