Article

Derivative Parameters of Hyperspectral NDVI and Its Application in the Inversion of Rapeseed Leaf Area Index

1
Hunan Agricultural University/Southern Regional Collaborative Innovation Center for Grain and Oil Crops in China, Changsha 410128, China
2
Changsha Social Work College, Changsha 410004, China
*
Author to whom correspondence should be addressed.
Appl. Sci. 2018, 8(8), 1300; https://doi.org/10.3390/app8081300
Submission received: 30 June 2018 / Revised: 27 July 2018 / Accepted: 1 August 2018 / Published: 4 August 2018

Abstract

:
AVNDVI (Accumulative Visible Normalized Difference Vegetation Index), a new type of derivative parameters of NDVI, was set up by improving the computational formulas and importing the spectral information of visible bands after analyzing the construction idea of NDVI and its derivative parameters. Then, the characteristic values of VNDVI (Visible NDVI) were calculated by applying a combinational method of sensitive bands of visible bands. The study carried out the fitting analysis between NDVI, VNDVI, AVNDVI, and LAI (Leaf Area Index). Several conclusions are obtained according to data analysis. Firstly, all of the determination coefficients between NDVI, VNDVI, AVNDVI, and LAI of rapeseed can reach or exceed 0.83. The distribution of their RMSE values ranges from 0.4 to 0.5 and absolute values of RE vary from 0.9% to 2.1%. Secondly, the inversion sensitivity SV of VNDVI and LAI ranges from 0.7 to 1.9 relative to NDVI, and the inversion sensitivity SA of AVNDVI decreases in varying degrees with the promotion of capacity of resisting disturbance accordingly. Its value varies from 0.1 to 0.9. Thirdly, the values of SA remain stable between 0.1 and 0.3 with the increase of NDVI. Applying the inversion model of AVNDVI will be a considerable scheme when faced with a complex environment and many interfering factors.

1. Introduction

The normalized difference vegetation index (NDVI), which is one of the important spectral parameters reflecting crop growth and nutrient information, has been widely used in leaf area index (LAI) estimation, chlorophyll inversion, and protein assessment. Many researchers have shown that there is a good correlation between NDVI and LAI. Therefore, measuring NDVI can characterize vegetation information and the growth trend of crops.
To improve the application effect of the normalized difference vegetation index, researchers analyze the shortcomings and deficiencies of NDVI from different aspects, put forward the corresponding improvement methods, and furthermore build a series of derivative parameters. There are generally two main ideas, as follows: (1) Keeping the same spectral characteristics of the red band and near-infrared band of NDVI, and improving the mathematical transformation. This method can enhance the vegetation characteristics of vegetation information and weaken the non-vegetation interference information, so as to improve the sensitivity of vegetation index. (2) On the basis of the original mathematical function of NDVI, new spectral parameters are introduced by a certain mathematical expression for improving applicability and sensitivity. Chen Zhaoxia et al. [1] and Jin Xiuliang et al. [2] adopted the first improvement idea and amplified the reflectivity components of NIR (Near Infrared) and Red n times, thus enlarging the difference between the near-infrared and infrared reflectance parameters. Consequently the estimation accuracy of NDVI for the vegetation coverage of winter wheat is improved. Meanwhile, the literature [3,4,5,6,7,8,9,10,11,12,13,14,15,16,17,18,19,20,21,22,23,24] has taken the second kind of idea. Wang Fuming et al. [3] thought that green and blue bands were sensitive to the vegetation coverage in varying degrees. Accordingly, new types of NDVI derivative parameters such as BNDVI (Blue NDVI), GRNDVI (Green and Red NDVI), GBNDVI (Green and Blue NDVI), RBNDVI (Red and Blue NDVI), etc., were constructed. Then, the estimation ability of these vegetation indices for rice LAI was analyzed by experiments. Li Xinchuan et al. [6] constructed a new vegetation index to assess the leaf area index of winter wheat after fusing the short infrared ray characteristic band with the index of visible and near-infrared wave bands, which effectively improved the correlation between the vegetation index and LAI. Gitelson et al. [9] introduced the green wave band in the index of NDVI to build the GNDVI (Green NDVI) index, and achieved a high estimation accuracy in correlation with vegetation coverage. Yoder et al. [12] also used the green band to construct a new vegetation index, and achieved an ideal result in the study of the fitting degree with the photosynthesis of Douglas fir. The above research has already achieved preferable results in the quantitative analysis of the spectral vegetation index and crop biological parameters. But in terms of research ideas, it seems to be relatively simple. Only one of the two methods is usually used, namely, improving mathematical transformation or introducing new band characteristic parameters. Therefore, it is worth further exploring whether the two methods can be combined to construct new derivative parameters of NDVI to improve the estimation accuracy and applicability of the quantitative analysis of the vegetation index. On the basis of the parameters such as NDVI, GNDVI, BNDVI etc., the study attempts to enhance vegetation feature information and construct accumulative types of derivative parameters of NDVI through the accumulation of correlation information, analyzing the correlation between these parameters and the leaf area index of rapeseed simultaneously.

2. Materials and Methods

2.1. Experimental Design

During the 2017 growing season, a field experiment was conducted at Yunyuan comprehensive experimental site of Hunan Agricultural University (113.07° E, 28.18° N), located in Furong district, Changsha city. Xiangyou 708, which is a variety of middle-mature and high oleic acid rapeseed, was selected for this experimental material. The sowing density was designed to be high, medium, and low, with a high density of 450,000 plants per ha, a medium density of 300,000 plants per ha, and a low density of 150,000 plants per ha. A fertilization scheme was implemented according to compound fertilizer (the content of N, P and K is 45%) gradient design: low −225 kg·ha−1, medium −487.5 kg·ha−1, and high −750 kg·ha−1. Planting plots, each of which was 16 m2, were randomly distributed.

2.2. Data Collection

The spectrometric measurement was conducted using a Field Spec®3 portable analytical spectral device (ASD, Boulder, CO, USA). The sampling interval of this device over the range of 350–1000 nm is 1.4 nm with a 3 nm resolution. The spectral sampling interval of 1000–2500 nm is 2 nm, and its resolution is 10 nm. Measurements were taken between 10:30 am and 1:30 pm. During the data measurements, fiber optic probes had a 25° field of view all the time. Scans were taken from the height of 70 cm to the nadir position of the rapeseed canopy. Five canopy positions with balanced growth in each plot were selected for spectral data acquisition respectively. Meanwhile, a whiteboard calibration was performed every five minutes.
LAI-2200 (LI-COR, Lincoln, NE, USA) was selected for the measuring of the rapeseed leaf area index. The measurement time was synchronized with the spectral data acquisition. Five sampling points were selected evenly along two diagonal lines of each planting plot. Furthermore, each point was measured five times to calculate the average.
According to the above method, 180 samples of rapeseed growth cycle from 2017 to 2018 were obtained.

2.3. NDVI and Its Derivative Parameters

NDVI and its derivative parameters are spectral characteristic parameters composed of four bands: blue, green, red, and near-infrared. The correlation between vegetation indices and the leaf area index is not same with varying degrees. For example, Tian Yong-chao et al. [5] obtained the derivative normalized NI (D524, D805) formed by the combination of 524 nm and 805 nm, which has the best correlation with LAI. Chen Zhao-xia et al. [1] calculated that 692/858 nm was the combination of the NDVI band with the highest determination coefficient of wheat coverage. Additionally, the vegetation index calculated by the other band combination can be ignored in the correlation analysis. Wang Fu-ming et al. [3] worked out the mean values of the composition band of VNDVI (Visible NDVI) and got the vegetation index values by putting these mean values into formulas. This idea reduced the complexity of calculation and enhanced the anti-interference ability of these parameters to some extent, but neglected a large amount of feature information of the spectral data. In this study, AVNDVI (Accumulative Visible NDVI), a new type of derivative parameters of NDVI, was constructed through leading the band combination calculation into VNDVI [3] and accumulating the results. The parameters take account of vegetation spectral information contained in red, blue, and green wavebands. Thus, the stability of the response characteristics is enhanced by the accumulative calculation of spectral information, and the fitting performance of the inversion models is improved because of the complementary information of the hyperspectral bands. The calculation formula is as follows:
A VNDVI = r m 1 r m 2 r n 1 r n 2 NIR m VIS n NIR m + VIS n
where NIR m represents the spectral reflectances of near infrared; VIS n represents the spectral reflectances of visible bands, containing blue, green, and red wavebands; [ r m 1 , r m 2 ] and [ r n 1 , r n 2 ] represent the reflectances in the near infrared and visible band range respectively; and [ m 1 , m 2 ] and [ n 1 , n 2 ] denote the range of the near infrared and visible waveband. The specific calculation formulas of vegetation indices are shown in Table 1.
The series of Landsat satellites are one of the main sources of observation data for remote sensing technology research and application. In this study, the blue band (450–520 nm), green band (520–600 nm), red band (630–690 nm), and near infrared (760–900 nm) were selected as the calculation range of each parameter according to the spectral division criteria of Landsat 5/7.

2.4. Measurements of Sensitivity and Anti-Interference

The sensitivity of spectral parameters refers to the drifting degree of the parameters in each spectral dimension when the properties of the object change [20]. What is more, the anti-interference is used to indicate the displacement degree of the value of parameters when the properties of a non-research object change in spectral space. The sensitive function is a common index employed to measure sensitivity and anti-interference. In this study, we have defined the calculation formulas of the sensitive function of derivative parameters on the basis of NDVI.
S v = [ d ( VNDVI ) d ( NDVI ) ] [ Δ ( VNDVI ) Δ NDVI ] 1
S A = [ d ( A VNDVI ) d ( NDVI ) ] [ Δ ( A VNDVI ) Δ ( NDVI ) ] 1
where VNDVI is the general term for GNDVI, BNDVI, GRNDVI, GBNDVI, and RBNDVI; AVNDVI is the general term for ANDVI, AGNDVI, ABNDVI, AGRNDVI, AGBNDVI, and ARBNDVI; S V and S A are the sensitive functions of VNDVI and AVNDVI, respectively; and d ( VNDVI ) , d ( NDVI ) , and d ( A VNDVI ) represent the first derivative of leaf area indices corresponding to VNDVI, NDVI, and AVNDVI, respectively.
d ( VNDVI ) = [ VNDVI + o ( VNDVI ) ] [ LAI + o ( LAI ) ] 1
d ( NDVI ) = [ NDVI + o ( NDVI ) ] [ LAI + o ( LAI ) ] 1
d ( A VNDVI ) = [ A VNDVI + o ( A VNDVI ) ] [ LAI + o ( LAI ) ] 1
where VNDVI, NDVI, A VNDVI , and LAI refer to the values of VNDVI, NDVI, A VNDVI , and LAI, respectively; and o ( VNDVI ) , o ( NDVI ) , o ( A VNDVI ) , and o ( LAI ) represent the infinitesimal value change of VNDVI, NDVI, A VNDVI , and LAI, respectively.
Δ ( VNDVI ) = VNDVI max VNDVI min
Δ ( NDVI ) = NDVI max NDVI min
Δ ( A VNDVI ) = ( A VNDVI ) max ( A VNDVI ) min
where VNDVI max , NDVI max , and ( A VNDVI ) max refer to the maximum hyperspectral values of VNDVI, NDVI, and AVNDVI in the crop growth cycle, respectively; and VNDVI min , NDVI min , and ( A VNDVI ) min refer to the minimum LAI values of VNDVI, NDVI, and AVNDVI in the growing period, respectively. The value of the sensitive function indicates the variation trend of sensitivity and anti-interference. The higher the value of the sensitive function, the higher the sensitivity, and the worse the anti-interference. Conversely, a lower value of sensitive function indicates a lower sensitivity and better anti-interference.
Obviously, the sensitive function of NDVI is S V = 1 . When S V and S A are greater than 1, it means that the corresponding VNDVI and AVNDVI are more sensitive and exhibit less anti-interference than NDVI. Furthermore, when S V and S A are less than 1, the corresponding VNDVI and AVNDVI display higher anti-interference and a lower sensitivity than NDVI.

3. Results

3.1. Correlation Analysis of NDVI and Its Derivative Parameters
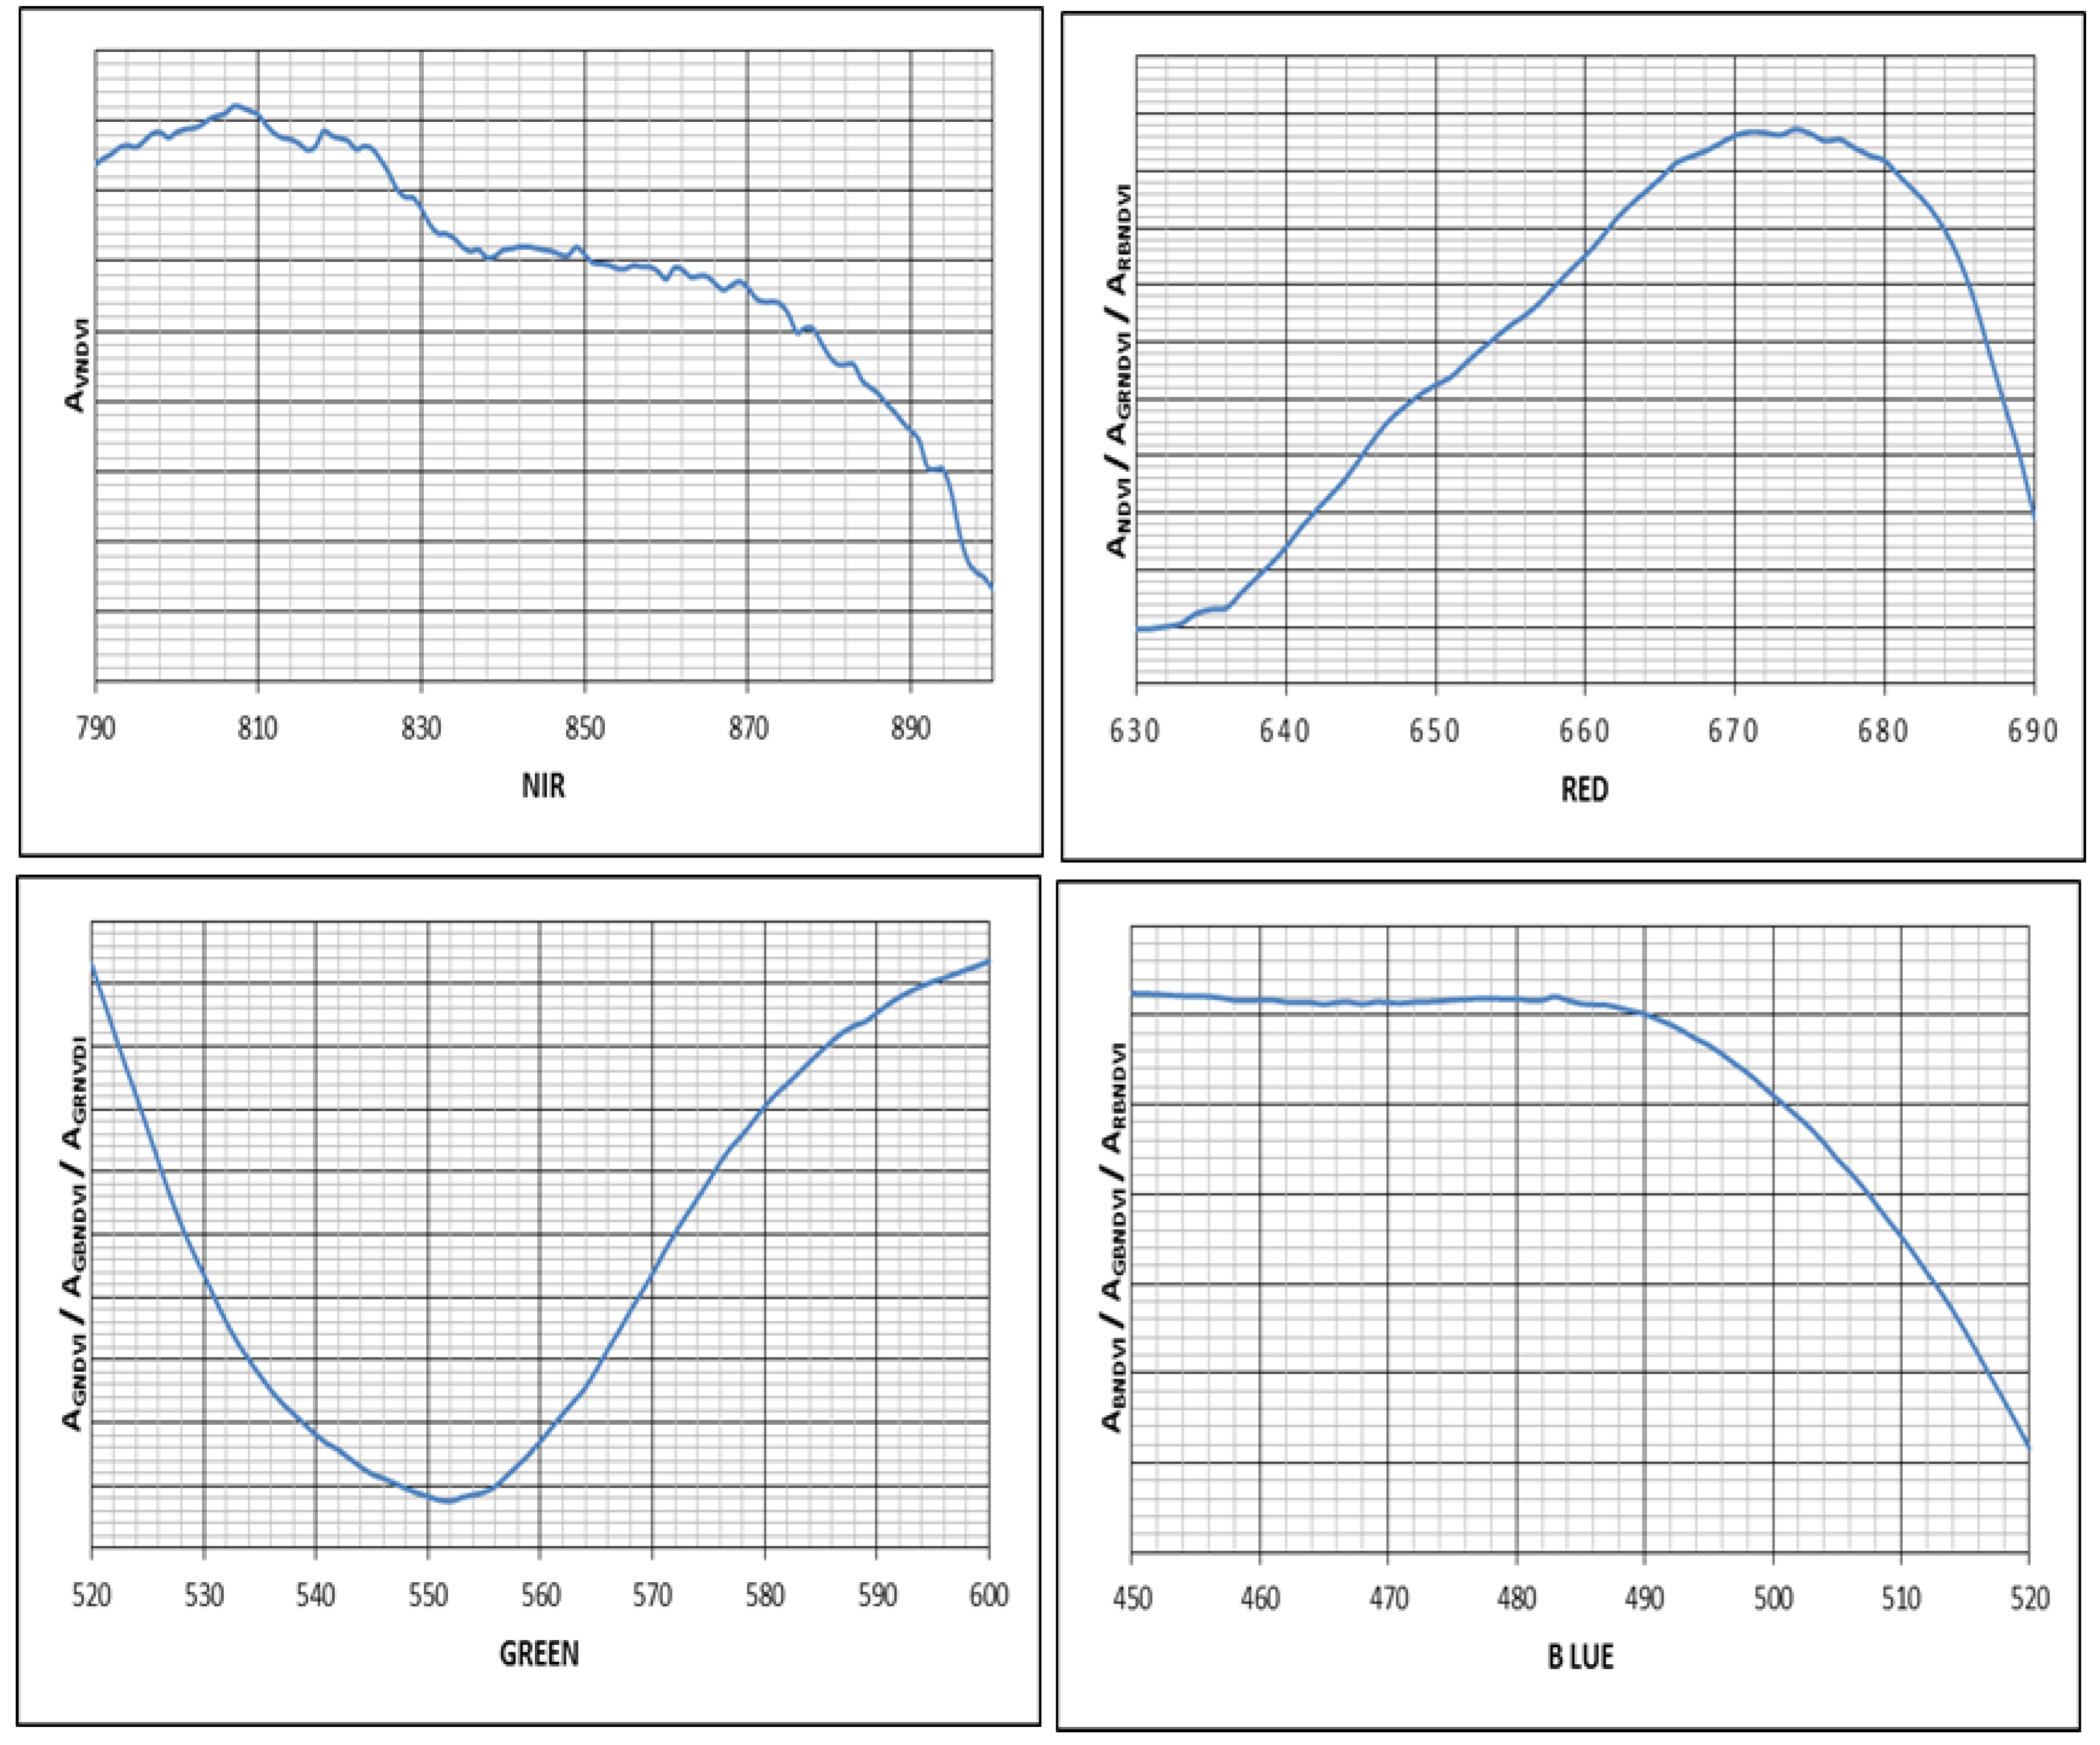
Because the information of the blue, green, and red spectral bands has a high redundancy [3], there is a high correlation between NDVI and its derivative parameters which are constructed on the basis of visible and near-infrared bands. As shown in Table 2, there is a high correlation between two parameters of NDVI, GNDVI, GRNDVI, RBNDVI, ANDVI, AGNDVI, AGRNDVI, AGBNDVI, and ARBNDVI, while the correlation coefficient between BNDVI and other indices is relatively small. For example, the correlation coefficient between BNDVI and NDVI is only 0.7065, and the values of correlation coefficients between BNDVI and GRNDVI, and ANDVI are only 0.7932 and 0.7536, respectively, which are in the middle correlation interval. This is mainly due to the fact that there is a large difference and small redundancy in the information between the blue and red, and green band. In addition, because GBNDVI and RBNDVI contain the information of the blue band, the correlation between them and other vegetation indices is also affected to some extent. For example, the correlation coefficient between GNDVI and NDVI is 0.9417, while the correlation coefficient between GBNDVI and NDVI is 0.9083, showing a significant decline. The stability and applicability of cumulative normalized vegetation indices are improved in various degrees. Taking NDVI as a reference, the correlation coefficients of BNDVI and GBNDVI are 0.7065 and 0.9083, respectively, while the corresponding values of ABNDVI and AGBNDVI are 0.7345 and 0.9365, respectively, which shows an obvious promotion. The correlation coefficients between GNDVI, GRNDVI, and RBNDVI, and NDVI are 0.9417, 0.9813, and 0.9494, respectively, and the corresponding indices of the accumulation normalized vegetation indices— A GNDVI , A GRNDVI , and A RBNDVI —are 0.9360, 0.9708, and 0.9597, showing favorable stability.

3.2. Selection of A V N D V I Sensitive Band

If AVNDVI contains too many non-sensitive bands, the sensitivity of parameters to LAI will be reduced, thus affecting its inversion accuracy and reliability. The trends between near-infrared, red, green, and blue bands, and AVNDVI are shown in Figure 1. The sensitive bands can be derived from the calculation formulas of the sensitive function (3) and AVNDVI shown in Table 1: NIR—820~840 nm and 860~900 nm, Red—680~690 nm, Green—520~550 nm and 560~580 nm, and Blue—490~520 nm.

3.3. Model and Validation

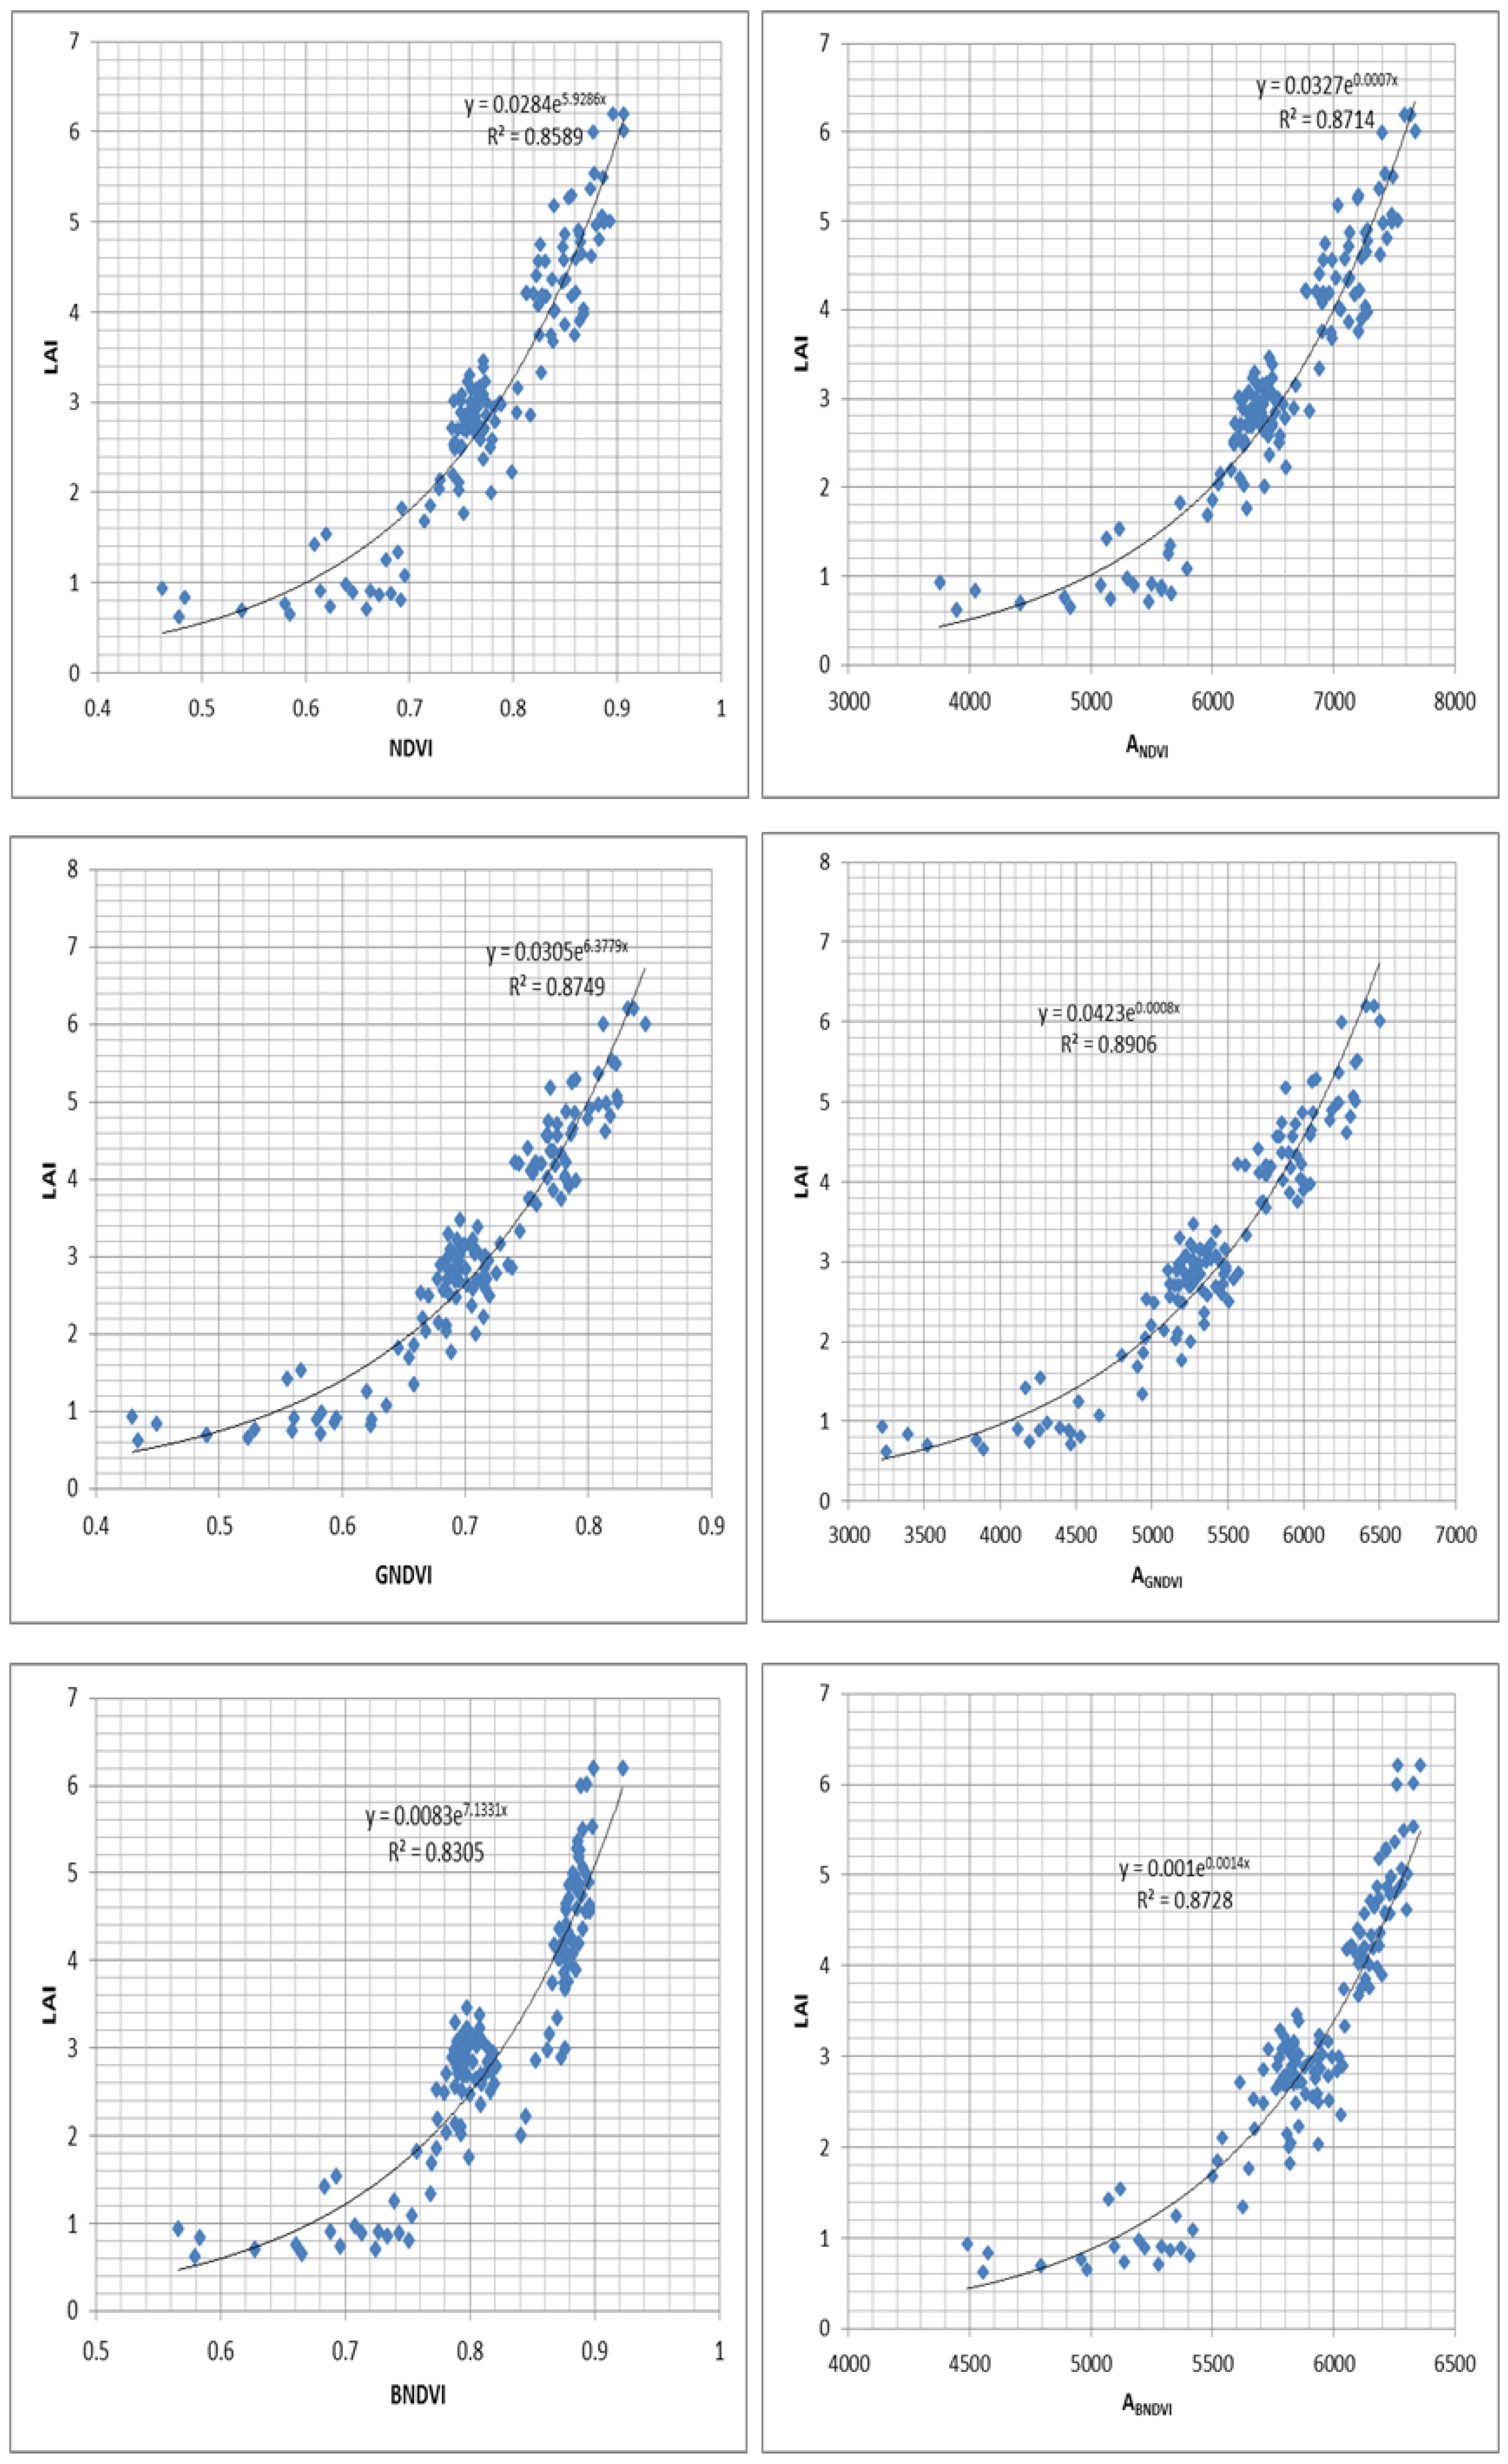
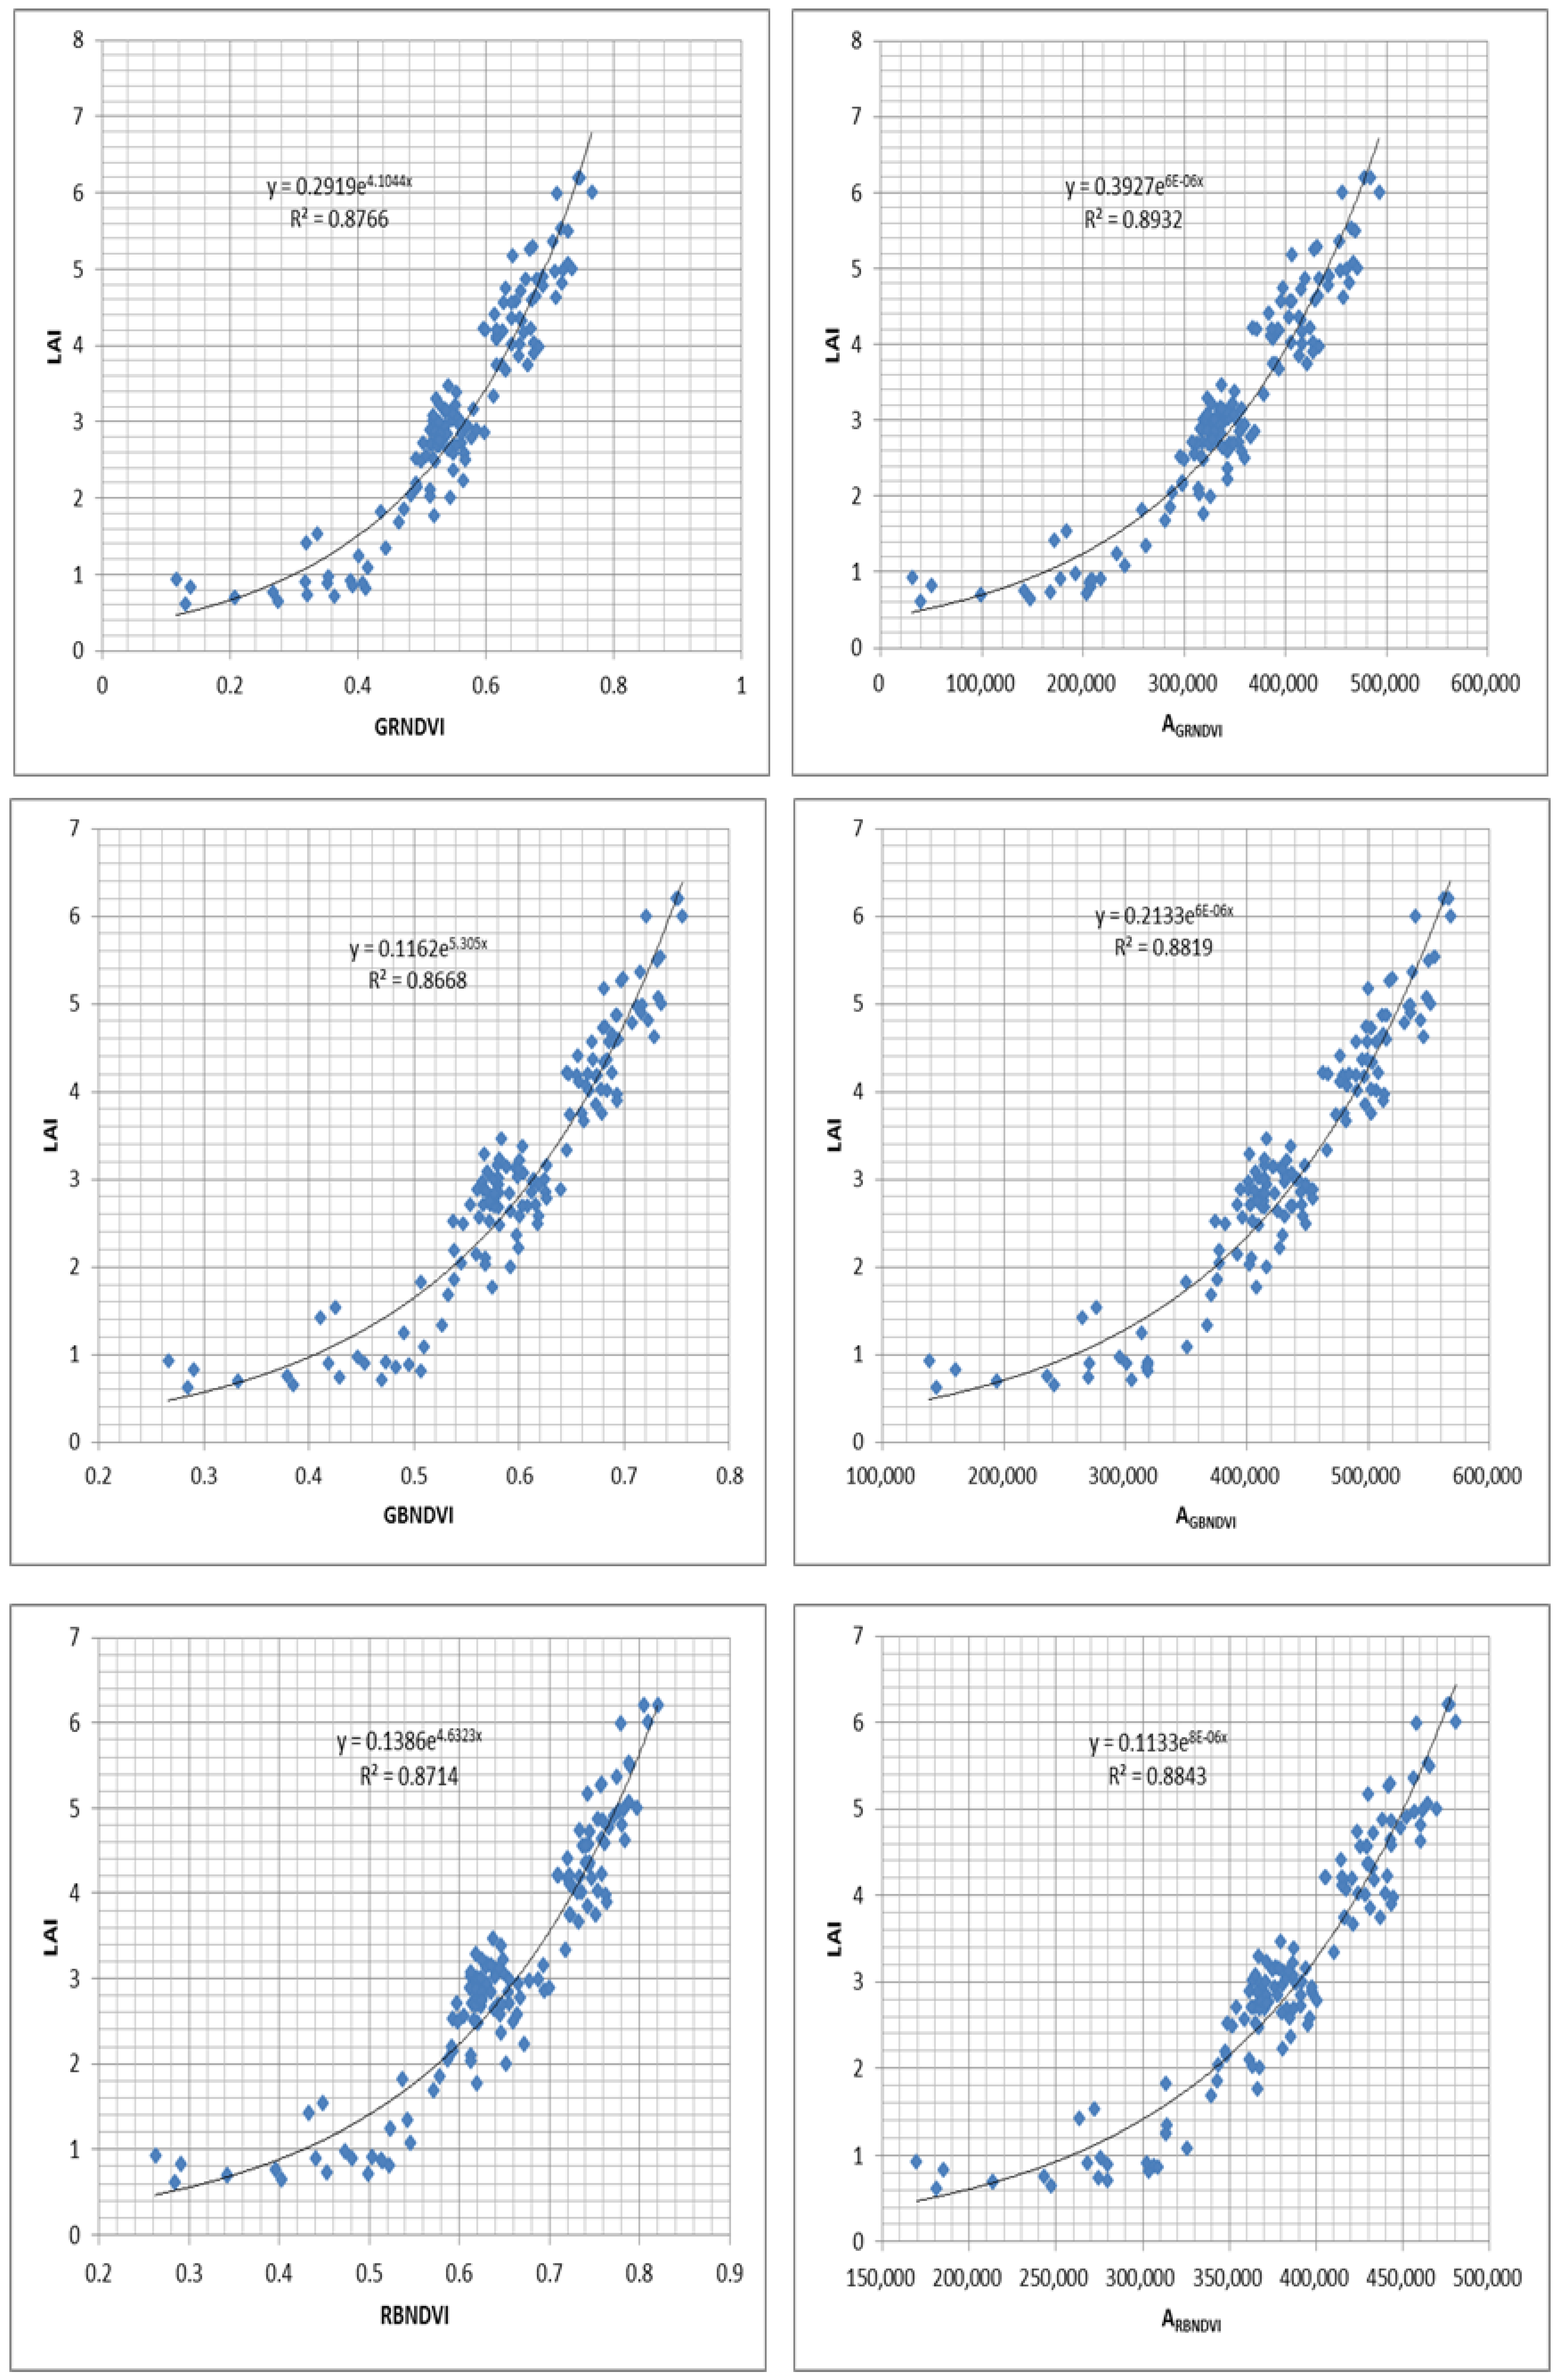
3.3.1. LAI Inversion Model Based on NDVI and Its Derivative Parameters

The NDVI and its derivative parameters were inversed with the leaf area index in the growing cycle of rapeseed based on the 150 samples. Also, optimal regressive equations are all exponential functions (shown in Figure 2). Through data analysis, it can be concluded that: (1) the coefficient of determination R2 of each regression equation is greater than 0.83. This shows that the NDVI series of the vegetation index has a good inversion effect on LAI. The inversion effect of AGRNDVI and AGNDVI is the best, with values of 0.8932 and 0.8906, respectively. Compared with the derivative parameters of the same type, it is easy to find that the coefficients of determination R2 satisfy the following relationships:
GRNDVI > GNDVI > RBNDVI > GBNDVI > BNDVI, AGRNDVI > AGNDVI > ARBNDVI > AGBNDVI > ANDVI > ABNDVI. The above conclusion basically conforms to the analysis results of sensitivity and anti-interference. (2) Compared with NDVI, the coefficients of determination R2 of regression equations between derivative parameters (except BNDVI) and the leaf area index have increased to a certain extent, ranging from 1.25% to 3.43%. The reason for this is that compared with other bands, the correlation between the blue band and LAI is relatively low [3]. Therefore, the inversion of BNDVI and LAI shows a low coefficient of determination. Additionally, the coefficients of other derivative parameters of NDVI are improved because of including highly correlated band information. (3) The regression equations of the cumulative vegetation indices and their prototype vegetation indices have different degrees of improvement in the coefficients of determination, generally about 1.5%. The coefficient R2 of ABNDVI is increased by 4.23% to 0.8728 on the basis of BNDVI’s 0.8305, indicating a significant increase. It shows that the accumulating parameters containing more spectral information are more robust.

3.3.2. Validation of LAI Inversion Model Based on the Derivative Parameters of NDVI

In this study, we have extracted 30 sample data from the growth cycle of rapeseed to verify the index models of NDVI and its derivative parameters, and calculated two index values of RMSE and RE, as shown in Table 3. The results showed that the indices of RMSE and RE were not significantly different in each inversion model. It can be seen by comparison that the better models in overall applicability included GNDVI, GRNDVI, AGDNVI, ANDVI, AGBNDVI, and AGRNDVI, where the models of GRNDVI, GNDVI, and AGNDVI had good RE values of 0.9737, 1.0211, and 1.0547, respectively. Furthermore, the RMSE performance of GNDVI and ANDVI had better values of 0.4133 and 0.4138, respectively. The models with a poor overall performance were: BNDVI, ABNDVI, and GBNDVI, where the RMSE of BNDVI was 0.4916, while the RE values of ABNDVI and GBNDVI were relatively large, with values of −1.8454 and 2.0991, respectively.

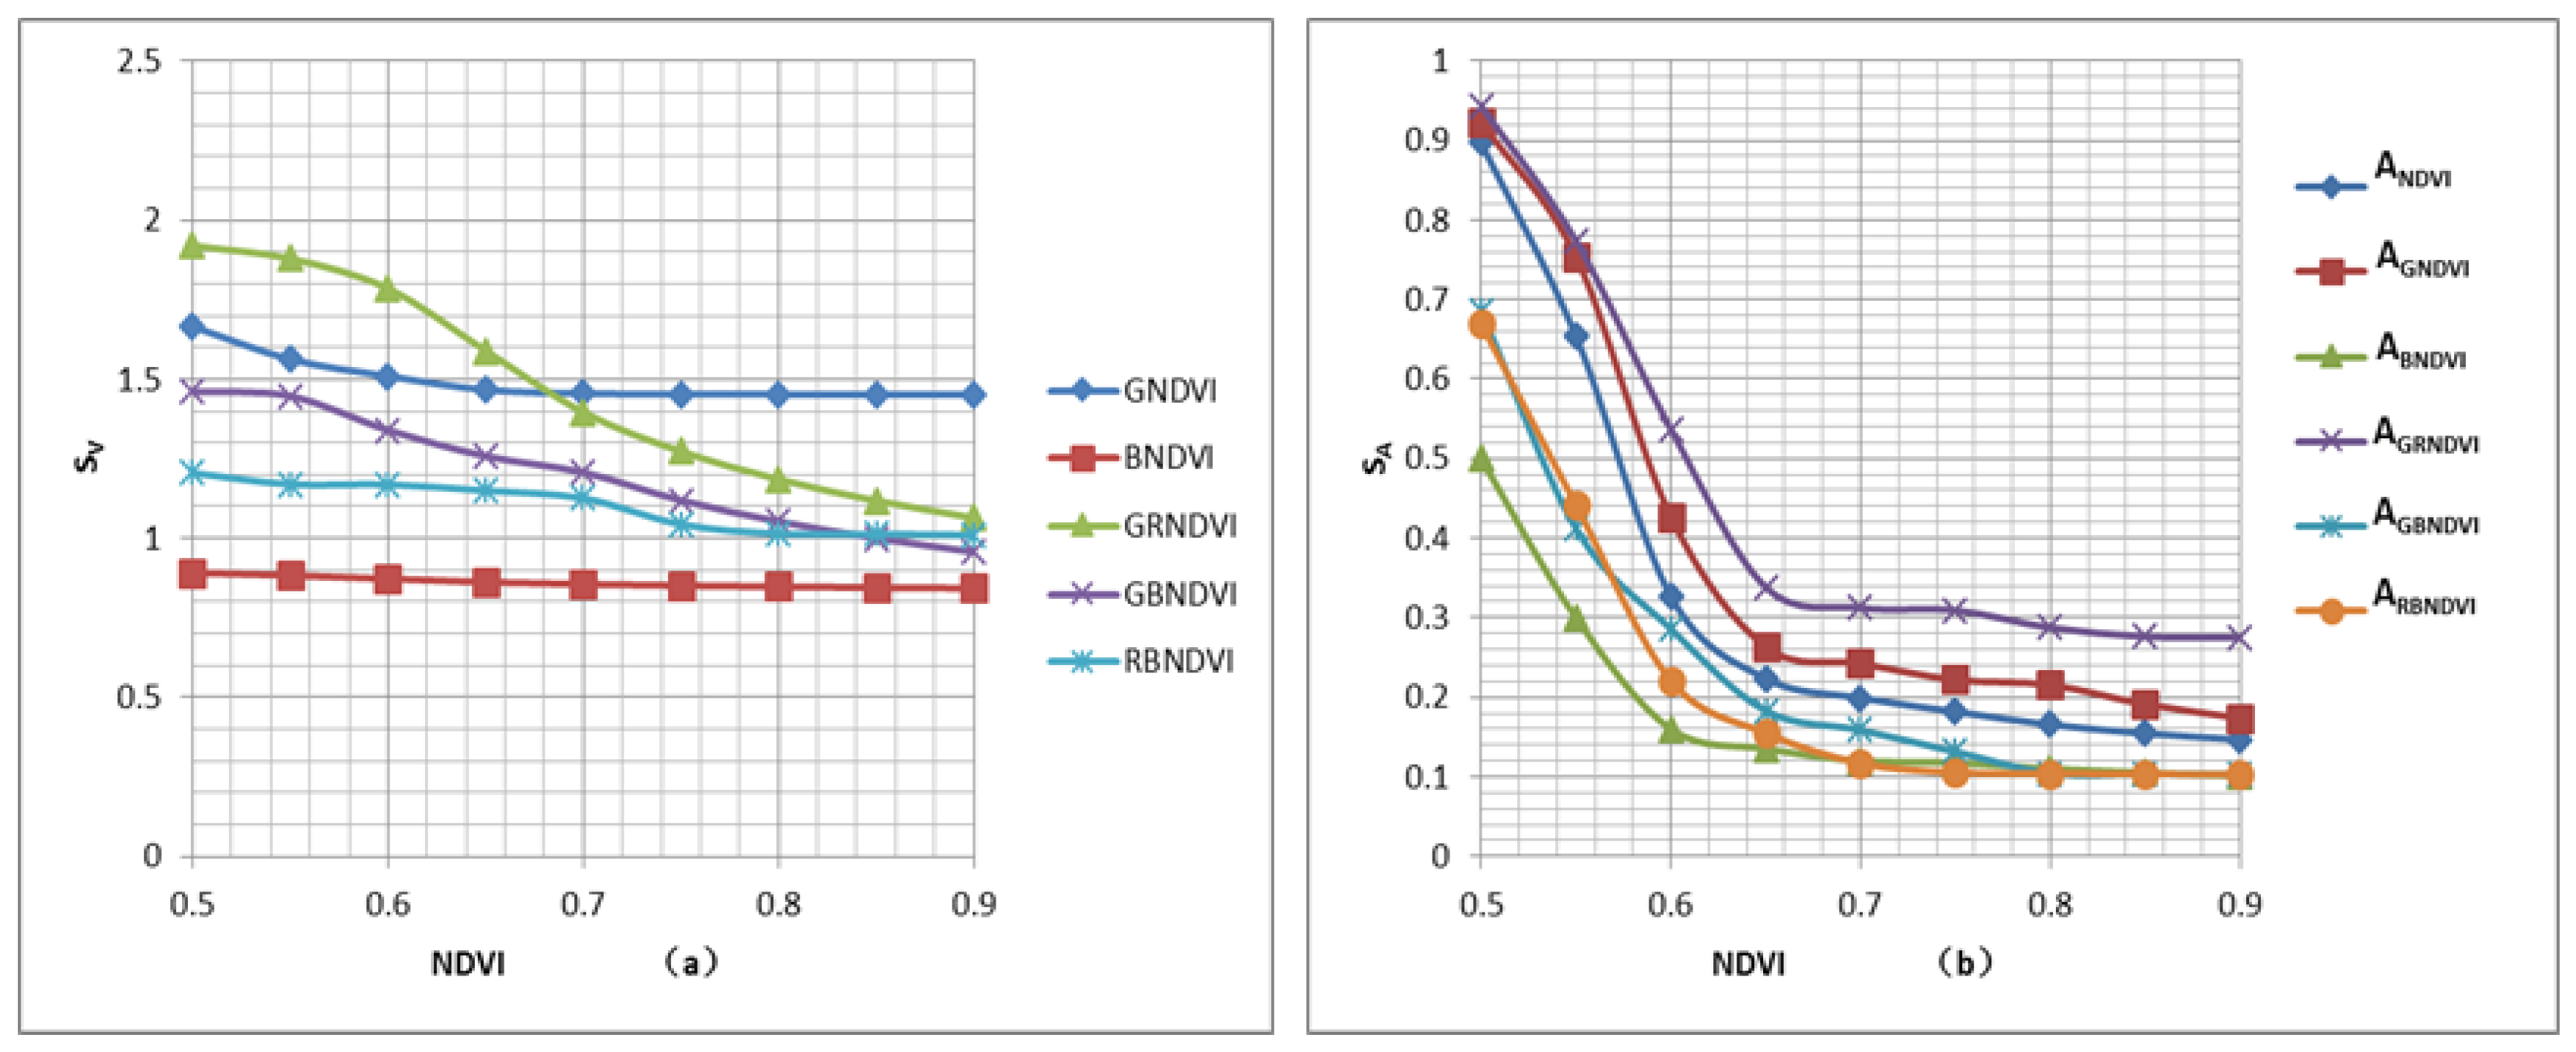
3.3.3. Sensitivity and Anti-Interference Analysis of NDVI and Its Derivative Parameters

According to the sensitivity function (formula 2 and formula 3), the sensitivity of derivative parameters relative to NDVI is calculated, as shown in Figure 3. It can be concluded from Figure 3a that GNDVI, GRNDVI, GBNDVI, and RBNDVI are more sensitive than NDVI, and the corresponding anti-interference levels are low. The sensitivity of BNDVI is slightly lower than NDVI, and the anti-interference is relatively higher. Figure 3b shows that the sensitivity of cumulative NDVI derivative parameters is lower than that of NDVI, while the anti-interference is greatly improved. However, the sensitivity of AGNDVI, AGNDVI, and ANDVI is relatively high, while the sensitivity of ABNDVI, ARBNDVI, and AGBNDVI, which contains the blue band, is affected to some extent. When NDVI is greater than 0.65, the sensitivity of all derivative parameters shows a steady downward trend. The relative sensitivity values of GRNDVI, GBNDVI, and RBNDVI gradually approach 1, indicating that the sensitivity of these three parameters gradually becomes close to NDVI. Moreover, the relative sensitivity of all the accumulative derivative parameters of AVNDVI decreases gradually, indicating that the sensitivity and anti-interference of AVNDVI gradually tend to be stable with the increase of the accumulative effect. In general, the sensitivity of cumulated parameters has the same law as NDVI.

4. Discussion

It is an important approach in the field of hyperspectral nondestructive monitoring to analyze the response characteristics of spectral features, to propose an improved method for the vegetation index, and to obtain an LAI inversion model with a higher accuracy and applicability. The study has changed the calculation formulas of mathematical transformation based on the normalized difference vegetation index (NDVI) through introducing the characteristic information of green and blue bands, and constructed a series of AVNDVI derivative parameters. Furthermore, we analyzed the sensitive spectral band of AVNDVI combined with other research results [3,9,25] and discussed the coefficients of R2, RMSE, and RE between VNDVI, AVNDVI, and LAI of rapeseed. The results showed that: (1) NDVI and its derivative parameters such as VNDVI and AVNDVI have a good correlation with the leaf area index of rapeseed. The determination coefficients R2 are greater than 0.83, the values of RMSE vary from 0.4133 to 0.4916, and the absolute values of RE are distributed between 0.9737% and 2.0991%, which indicates the good accuracy and reliability of the inversion models. It is shown that the information complementation and redundancy effects of the red, green, and blue bands can improve the overall performance of the inversion models of vegetation indices to a certain extent. The results are basically consistent with the conclusions of [3,26]. (2) The coefficients of determination R2 of the inversion models between the series derivative parameters of NDVI and LAI are slightly raised. Some parameters, such as GNDVI, AGNDVI, and GRNDVI, have certain advantages in RMSE and RE, but the advantages of other parameters are not obvious. (3) The cumulative derivative parameters—AVNDVI, introducing more spectral feature information, greatly improve the anti-interference and evidently decrease the sensitivity. It is a worthwhile consideration scheme to estimate LAI with AVNDVI series parameters in the case of large interference factors in the background. In addition, if the balance point which is more suitable for the specific scene needs to be explored between sensitivity and anti-interference, fine-grained analysis of sensitive bands can be carried out. It should be pointed out that the above results are based on data analysis of the planting cycle of a single rapeseed variety, and whether the inversion models can be applied to other rapeseed varieties needs to be verified by more experimental data.

Author Contributions

Conceptualization, C.Q.; Methodology, C.Q. and G.L.; Software, C.Q.; Validation, C.Q.; Formal Analysis, C.Q. and H.T.; Investigation, C.Q. and F.L.; Resources, G.L.; Data Curation, C.Q.; Writing—Original Draft Preparation, C.Q.; Writing—Review & Editing, R.Z. and Z.Z.; Visualization, C.Q. and X.L.; Supervision, G.L.; Project Administration, G.L.; Funding Acquisition, G.L.

Funding

This research was funded by [Chinese National Natural Science Foundation] grant number [11571103], [Crop’s Image Processing Innovation Team of Southern Regional Collaborative Innovation Center for Grain and Oil Crops in China] grant number [620190107013], [The Specific Fund of the CPC Central Committee Leading Local Science and Technology Development for Hunan Province in 2016] grant number [2014TP1001], and [Natural Science Foundation of Hunan Province] grant number [2017JJ5063].

Conflicts of Interest

The authors declare no conflict of interest.

References

  1. Chen, Z.; Xu, X.; Xu, L.; Yang, G.; Xing, H.; He, P. Estimating vegetation coverage of winter wheat based on new vegetation index. J. Triticeae Crop. 2016, 36, 939–944. [Google Scholar]
  2. Jin, X.L.; Xu, X.G.; Li, Z.H.; Wang, Q.; Wang, Y.; Li, C.J.; Wang, J.H. Estimation of winter wheat protein content based on new indexes. Spectrosc. Spectr. Anal. 2013, 33, 2541–2545. [Google Scholar]
  3. Wang, F.M.; Huang, J.F.; Tang, Y.L.; Wang, X.Z. New vegetation index and its application in estimating leaf area index of rice. Chin. J. Rice Sci. 2007, 21, 159–166. [Google Scholar] [CrossRef]
  4. Zhang, X.H.; Chang, Q.R.; Zhang, M.; Liu, J.Q. Hyperspectral vegetation index monitoring of chlorophyll content of different corn growth stage in Northwest China. J. China Agric. Univ. 2015, 20, 75–81. [Google Scholar]
  5. Yong-Chao, T.; Jie, Y.; Xia, Y.; Yan, Z.; Wei-Xing, C. Quantitative relationships between hyperspectral vegetation indices and leaf area index of rice. Chin. J. Appl. Ecol. 2009, 20, 1685–1690. [Google Scholar]
  6. Li, X.C.; Bao, Y.S.; Xu, X.G.; Jin, X.L.; Zhang, J.C.; Song, X.Y. New vegetation index fusing visible-infrared and shortwave infrared spectral feature for winter wheat LAI retrieval. Spectrosc. Spectr. Anal. 2013, 33, 2398–2402. [Google Scholar]
  7. Tavakoli, H.; Mohtasebi, S.S.; Alimardani, R.; Gebbers, R. Evaluation of different sensing approaches concerning to nondestructive estimation of leaf area index (LAI) for winter wheat. Int. J. Smart Sens. Intell. Syst. 2014, 7, 337–359. [Google Scholar] [CrossRef]
  8. Din, M.; Zheng, W.; Rashid, M.; Wang, S.; Shi, Z. Evaluating hyperspectral vegetation indices for leaf area index estimation of Oryza sativa L. at diverse phenological stages. Front. Plant Sci. 2017, 8, 820. [Google Scholar] [CrossRef] [PubMed]
  9. Gitelson, A.A.; Kaufman, Y.J. MODIS NDVI optimization to fit the AVHRR data series spectral considerations. Remote Sens. Environ. 1998, 66, 343–350. [Google Scholar] [CrossRef]
  10. Gitelson, A.A. Remote estimation of crop fractional vegetation cover: The use of noise equivalent as an indicator of performance of vegetation indices. Int. J. Remote. Sens. 2013, 34, 6054–6066. [Google Scholar] [CrossRef]
  11. Heiskanen, J.; Rautiainen, M.; Stenberg, P.; Mõttus, M.; Vesanto, V.H. Sensitivity of narrowband vegetation indices to boreal forest LAI, reflectance seasonality and species composition. ISPRS J. Photogramm. Remote Sens. 2013, 78, 1–14. [Google Scholar] [CrossRef]
  12. Yoder, B.J.; Waring, R.H. The normalized vegetation index of small douglas fir canopies with varying chlorophyll concentration. Remote Sens. Environ. 1994, 49, 81–91. [Google Scholar] [CrossRef]
  13. Delegivo, J.; Verrelst, J.; Rivera, J.P.; Ruiz-Verdú, A.; Moreno, J. Brown and green LAI mapping through spectral indices. Int. J. Appl. Earth Obs. Geoinf. 2015, 35, 350–358. [Google Scholar] [CrossRef]
  14. Chang-ping, H.; Xin-ran, Z.; Chen-lu, Z.; Na, Q.; Shun-shi, H.; Li-fu, Z. Pork freshness spectral feature index: Development and sensitivity analysis. Spectrosc. Spectr. Anal. 2018, 38, 552–558. [Google Scholar]
  15. Zhao, J.; Huang, W.J.; Zhang, Y.H. Inversion of leaf area index during different growth stages in winter wheat. Spectrosc. Spectr. Anal. 2013, 33, 2546–2552. [Google Scholar]
  16. Zhao, J.; Wang, K.; OuYang, Q. Measurement of chlorophyll content and distribution in tea plant’s leaf using hyperspectral imaging technique. Spectrosc. Spectr. Anal. 2011, 31, 512–515. [Google Scholar]
  17. Tian, X.; Wenbin, W.; Qingbo, Z. An estimation method of winter wheat leaf area index based on hyperspectral data. Sci. Agric. Sin. 2012, 45, 2085–2092. [Google Scholar]
  18. Dong, T.; Wu, B.; Meng, J.; Du, X.; Shang, J. Sensitivity analysis of retrieving fraction of absorbed photosynthetically active radiation (FPAR) using remote sensing data. Acta Ecol. Sin. 2016, 36, 1–7. [Google Scholar] [CrossRef]
  19. Chen, H.; Niu, Z.; Huang, W.; Huang, N.; Zhang, Y. Estimation of winter wheat LAI using hotspot-signature vegetation indices. Trans. CSAE 2012, 28, 167–172. [Google Scholar]
  20. Chen, J.L.; Wang, K.R.; Li, S.K.; Xiao, C.H.; Chen, B. Monitoring of the leaf area index of cotton based on spectral parameters and the sensitivity study. J. Cotton Sci. 2011, 23, 552–558. [Google Scholar]
  21. Robinson, N.P.; Allred, B.W.; Jones, M.O.; Moreno, A.; Kimball, J.S.; Naugle, D.E.; Erickson, T.A.; Richardson, A.D. A dynamic landsat derived normalized difference vegetation index (NDVI) product for the conterminous Unites States. Remote. Sens. 2017, 9, 863. [Google Scholar] [CrossRef]
  22. Wang, S.; Zhang, L.; Huang, C.; Qiao, N. An NDVI-based vegetation phenology is improved to be more consistent with photosynthesis dynamics through applying a light use efficiency model over boreal high-latitude forests. Remote. Sens. 2017, 9, 695. [Google Scholar] [CrossRef]
  23. Zhang, G.; Su, X.; Singh, V.P.; Ayantobo, O.O. Modeling NDVI using joint entropy metheod considering hydro-meteorological driving factors in the middle reaches of Hei river basin. Entropy 2017, 19, 502. [Google Scholar] [CrossRef]
  24. Filippa, G.; Cremonese, E.; Migliavacca, M.; Galvagno, M.; Sonnentag, O.; Humphreys, E.; Hufkens, K.; Ryu, Y.; Verfaillie, J.; di Cella, U.M.; et al. NDVI derived from near-infrared-enabled digital cameras: Applicability across different plant functional types. Agric. For. Meteorol. 2018, 249, 275–285. [Google Scholar] [CrossRef]
  25. Rouse, J.W.; Haas, R.H.; Schell, J.A. Monitoring the Vernal Advancement of Retrogradation (Green Wave Effect) of Natural Vegetation; Type Ш, Final Report; NASA/GSFC: Greenbelt, MD, USA, 1974; pp. 1–371. [Google Scholar]
  26. Liu, W.; Chang, Q.; Guo, M.; Xing, D.; Yuan, Y. Monitoring of leaf nitrogen content in summer corn with first derivative of spectrum based on modified red edge. J. Northwest A F Univ.-Nat. Sci. Ed. 2010, 38, 91–98. [Google Scholar]
Figure 1. Trends between AVNDVI and reflectivity of the near-infrared, green, blue, and red bands.
Applsci 08 01300 g001
Figure 2. Inversion models between NDVI, its derivative parameters, and rapeseed LAI. Note: significant level is 1% (n = 150).
Applsci 08 01300 g002aApplsci 08 01300 g002b
Figure 3. (a) Relative sensitivity and anti-interference curves of NDVI and VNDVI; (b) Relative sensitivity and anti-interference curves of NDVI and AVNDVI.
Applsci 08 01300 g003
Table 1. Summary of NDVI and its derivative parameters.
IndexCalculation FormulaReferenceComment
NDVI NDVI = NIR RED NIR + RED Rouse et al. [21]normalized vegetation index
GNDVI GNDVI = NIR Green NIR + Green Gitelson et al. [9]Green normalized vegetation index
BNDVI BNDVI = NIR Blue NIR + Blue Wang Fu-ming et al. [3]Blue normalized vegetation index
GRNDVI GRNDVI = NIR ( Green + Red ) NIR + ( Green + Red ) Wang Fu-ming et al. [3]Green and Red normalized vegetation index
GBNDVI GBNDVI = NIR ( Green + Blue ) NIR + ( Green + Blue ) Wang Fu-ming et al. [3]Green and Blue normalized vegetation index
RBNDVI RBNDVI = NIR ( Red + Blue ) NIR + ( Red + Blue ) Wang Fu-ming et al. [3]Red and Blue normalized vegetation index
A NDVI A NDVI = r m 1 r m 2 r n 1 r n 2 NIR m Red n NIR m + Red n this paperaccumulative normalized vegetation index
A GNDVI A GNDVI = r m 1 r m 2 r n 1 r n 2 NIR m Green n NIR m + Green n this paperGreen accumulative normalized vegetation index
A BNDVI A BNDVI = r m 1 r m 2 r n 1 r n 2 NIR m Blue n NIR m + Blue n this paperBlue accumulative normalized vegetation index
A GRNDVI A GRNDVI = r p 1 r p 2 r m 1 r m 2 r n 1 r n 2 NIR p ( Green m + Red n ) NIR p + ( Green m + Red n ) this paperGreen and Red accumulative normalized vegetation index
A GBNDVI A GBNDVI = r p 1 r p 2 r m 1 r m 2 r n 1 r n 2 NIR p ( Green m + Blue n ) NIR p + ( Green m + Blue n ) this paperGreen and Blue accumulative normalized vegetation index
A RBNDVI A RBNDVI = r p 1 r p 2 r m 1 r m 2 r n 1 r n 2 NIR p ( Red m + Blue n ) NIR p + ( Red m + Blue n ) this paperRed and Blue accumulative normalized vegetation index
Note: NIR, Green, Blue, and Red represent spectral reflectances of near infrared, green, blue, and red bands, respectively.
Table 2. Summary of correlation coefficients of NDVI and its derivative parameters.
NDVIGNDVIBNDVIGRNDVIGBNDVIRBNDVI A NDVI A GNDVI A BNDVI A GRNDVI A GBNDVI A RBNDVI
NDVI1.00000.94170.70650.98130.90830.94940.99510.93600.73450.97080.93650.9597
GNDVI0.94171.00000.86630.98810.97790.97160.96390.99320.86160.99160.98840.9838
BNDVI0.70650.86631.00000.79320.90370.83100.75360.87860.93310.82170.85160.8977
GRNDVI0.98130.98810.79321.00000.94500.97340.99100.97960.81000.99580.96330.9851
GBNDVI0.90830.97790.90370.94501.00000.96940.91190.97600.94210.95690.99390.9715
RBNDVI0.94940.97160.83100.97340.96941.00000.96610.97070.90220.97620.97410.9960
A NDVI 0.99510.96390.75360.99100.91190.96611.00000.96310.77880.98780.93750.9786
A GNDVI 0.93600.99320.87860.97960.97600.97070.96311.00000.87300.99240.99250.9855
A BNDVI 0.73450.86160.93310.81000.94210.90220.77880.87301.00000.83420.91680.8864
A GRNDVI 0.97080.99160.82170.99580.95690.97620.98780.99240.83421.00000.97700.9903
A GBNDVI 0.93650.98840.85160.96330.99390.97410.93750.99250.91680.97701.00000.9818
A RBNDVI 0.95970.98380.89770.98510.97150.99600.97860.98550.88640.99030.98181.0000
Table 3. The verification results of NDVI and its derivative parameters.
RMSERE (%) RMSERE (%)
NDVI0.44091.4323ANDVI0.41381.4699
GNDVI0.41331.0211AGNDVI0.42591.0547
BNDVI0.4916−1.4618ABNDVI0.4381−1.8454
GRNDVI0.46080.9737AGRNDVI0.47261.2127
GBNDVI0.42052.0991AGBNDVI0.41671.4456
RBNDVI0.43561.6531ARBNDVI0.44341.5621
Note: significant level is 5% (n = 30).

