Acoustic Emission Method for Locating and Identifying Active Destructive Processes in Operating Facilities

Faculty of Civil Engineering and Architecture, Kielce University of Technology, Aleja Tysiąclecia Państwa Polskiego 7, 25-314 Kielce, Poland
Appl. Sci. 2018, 8(8), 1295; https://doi.org/10.3390/app8081295
Submission received: 2 July 2018
/
Revised: 26 July 2018
/
Accepted: 2 August 2018
/
Published: 3 August 2018
(This article belongs to the Special Issue Structural Health Monitoring of Large Structures Using Acoustic Emission–Case Histories)
Abstract
:Featured Application
The data collected can be the basis for determining the structural condition of the structure.
Abstract
Durability, safety, and usability are the three foundations of structural reliability, vital in the economic and social context. As the locating and tracking of potential damage and evaluating its impact on the condition of the structure are part of service life assessment, relevant methods should be developed that would detect the onset of the deterioration process and enable the monitoring of its progress within the entire volume of the structure, not only in the areas selected in a subjective way. The acoustic emission (AE) method relying on the analysis of active destructive processes can be the best choice. This article reports the results of the application of the AE method for identifying active destructive processes and tracking their development during the routine operation of various types of structures.
1. Introduction
Structural condition diagnostics and monitoring are two important issues in the economic and social context. Aging infrastructure, deteriorating environmental conditions, and increasing operational loads are the primary stimuli for fast-progressing research on a new interdisciplinary field of technical knowledge called “Structural Health Monitoring (SHM)”, closely connected to the safe service life of structures [1,2].
Two different problems are involved in the durability assessment, one associated with the analysis of existing structures designed according to the standards previously in force, and the other associated with ensuring the anticipated useful life, taking into account the mechanical and strength-related characteristics of the newly designed structures.
In this work, the author’s attention will be focused on assessing the structural integrity of existing facilities and its impact on their durability.
Durability, safety, and usability are the three foundations of structural reliability. The durability factor is, unlike in the past, equally important and has to include the evaluation of environmental impacts (moisture, frost, CO2, de-icing agents, etc.) on the present and future health of the structure. Ability to assess the environmental effects on the degradation level is critical for the durability and resistance of structures. Research programs conducted by the international ISO standardization organization [3], the American Concrete Institute [4], or those implemented within the Basic Research in Industrial Technologies/ European Research in Advanced Materials (BRITE/EURAM) framework [5] by the European Union countries, revealed that environmental changes—on a local, regional, and global scale—were faster than initially assumed, thereby making the environmental assessment an urgent issue.
It is particularly important to determine the onset of the damaging process in the materials and structural elements, because attempts to stop once-initiated processes are often inefficient, leading to the failure or catastrophic collapse of the entire structure. The Eurocodes propose four approaches to design for safety, thus providing a certain amount of autonomy to the designers. Niriaki in [6] eliminates this autonomy by proposing his original approach independent of structural safety but based on the durability and resistance analysis.
The demand for the method capable of detecting the onset of the deterioration process and monitoring its progress within the entire volume of the structure, not only in the subjectively chosen parts, is fulfilled by the technique of acoustic emission (AE). The method involves performing comparative analysis of the acoustic emission signals recorded during the tests and those collected in the database of reference signals corresponding to particular destructive processes. The results are used to identify and locate active destructive processes in reinforced concrete structures (IADP—Identification of Active Damage Processes), in prestressed concrete structure (RPD—Recognition of Destructive Processes), and in steel structures, thereby allowing the global monitoring across the whole member and recording only active deterioration processes developing under actual loading conditions [7,8,9,10,11,12,13,14,15,16,17]. The AE method is being increasingly developed for use in the construction of gas pipelines.
This article aims to discuss examples of AE monitoring of different engineering structures, including the AE-based Structural Health Monitoring System (SHMS) on the My Thuan Bridge.
2. Materials and Methods
2.1. Materials
2.1.1. Steel Bridge
Selected structural members of the bridge were examined. The damage assessment was based on the results of AE signal analysis.
Visual inspection (Figure 1) revealed surface corrosion of the majority of the bridge steel elements (Figure 2), being especially intensified on top surfaces in the area of bottom chords, crossbars, stringers, and lower joints of the truss. Corrosion was also found at the interface between profiles and steel plates of posts, diagonals, and flanges, as well as at the connections between steel angles and web plates, crossbars, and stringers. Due to inadequate drainage of the steel orthotropic plates on the bridge roadway, additional corrosion sites were also detected.
The damage was defined as caused by stagnant water. The method of constructing the nodes, the lack of appropriate falls, the counter-falls formed due to bridge deflection, and the lack of openings at the connection of the columns with the lower chord facilitated water accumulation, which, in the absence of a proper protective coating on all steel elements of the bridge, promoted rapid corrosion progression and degradation of the material.
The measurement set included 12 sensors spaced 2–10 m apart. Determining the distance between the sensors in the location involves the measurement of the Hsu–Nielsen signal source. This measurement was also used to determine the speed of wave propagation in the material.
2.1.2. Steel Columns
Two steel piles (Figure 3a and Figure 4a) constituting the supporting structure for the cable car were examined. Visual inspection of the piles revealed surface corrosion of most steel members, deformations of some elements, as well as pitting corrosion and fatigue cracks on sections of those elements (Figure 3b and Figure 4b). Corrosion intensified on the central surfaces of the flanges in the column structure, in particular in the area of gusset plates at welded and bolted joints. Corrosion was also found at the interface between the profiles and flanges of posts, crossbars, and chords, as well as at the place where the angles were connected to the webs and flanges. Corrosion processes and the loosening of bolts securing the column elements caused friction between some of the steel elements.
The damage was caused by rainwater and insufficient use of protective and anti-corrosive agents (no paint coating; sites of strongly developed corrosion). The photographs show changes in the structure of the material of the columns. Observed delamination of the steelwork and intergranular corrosion require additional maintenance and improved supervision.
Twelve sensors were installed with a spacing of 2 m.
2.1.3. Gas Pipeline
A section of steel high-pressure gas pipeline 400 mm in diameter and 200 m in length was examined (Figure 5). The age of the pipes is estimated at approximately 60 years. The pipeline operates under environmentally difficult conditions with wetlands underneath, electrical power lines, and a lumber transport route running nearby. Two 30–80 kHz sensors were installed in a linear configuration on the structure.
2.1.4. My Thuan Bridge
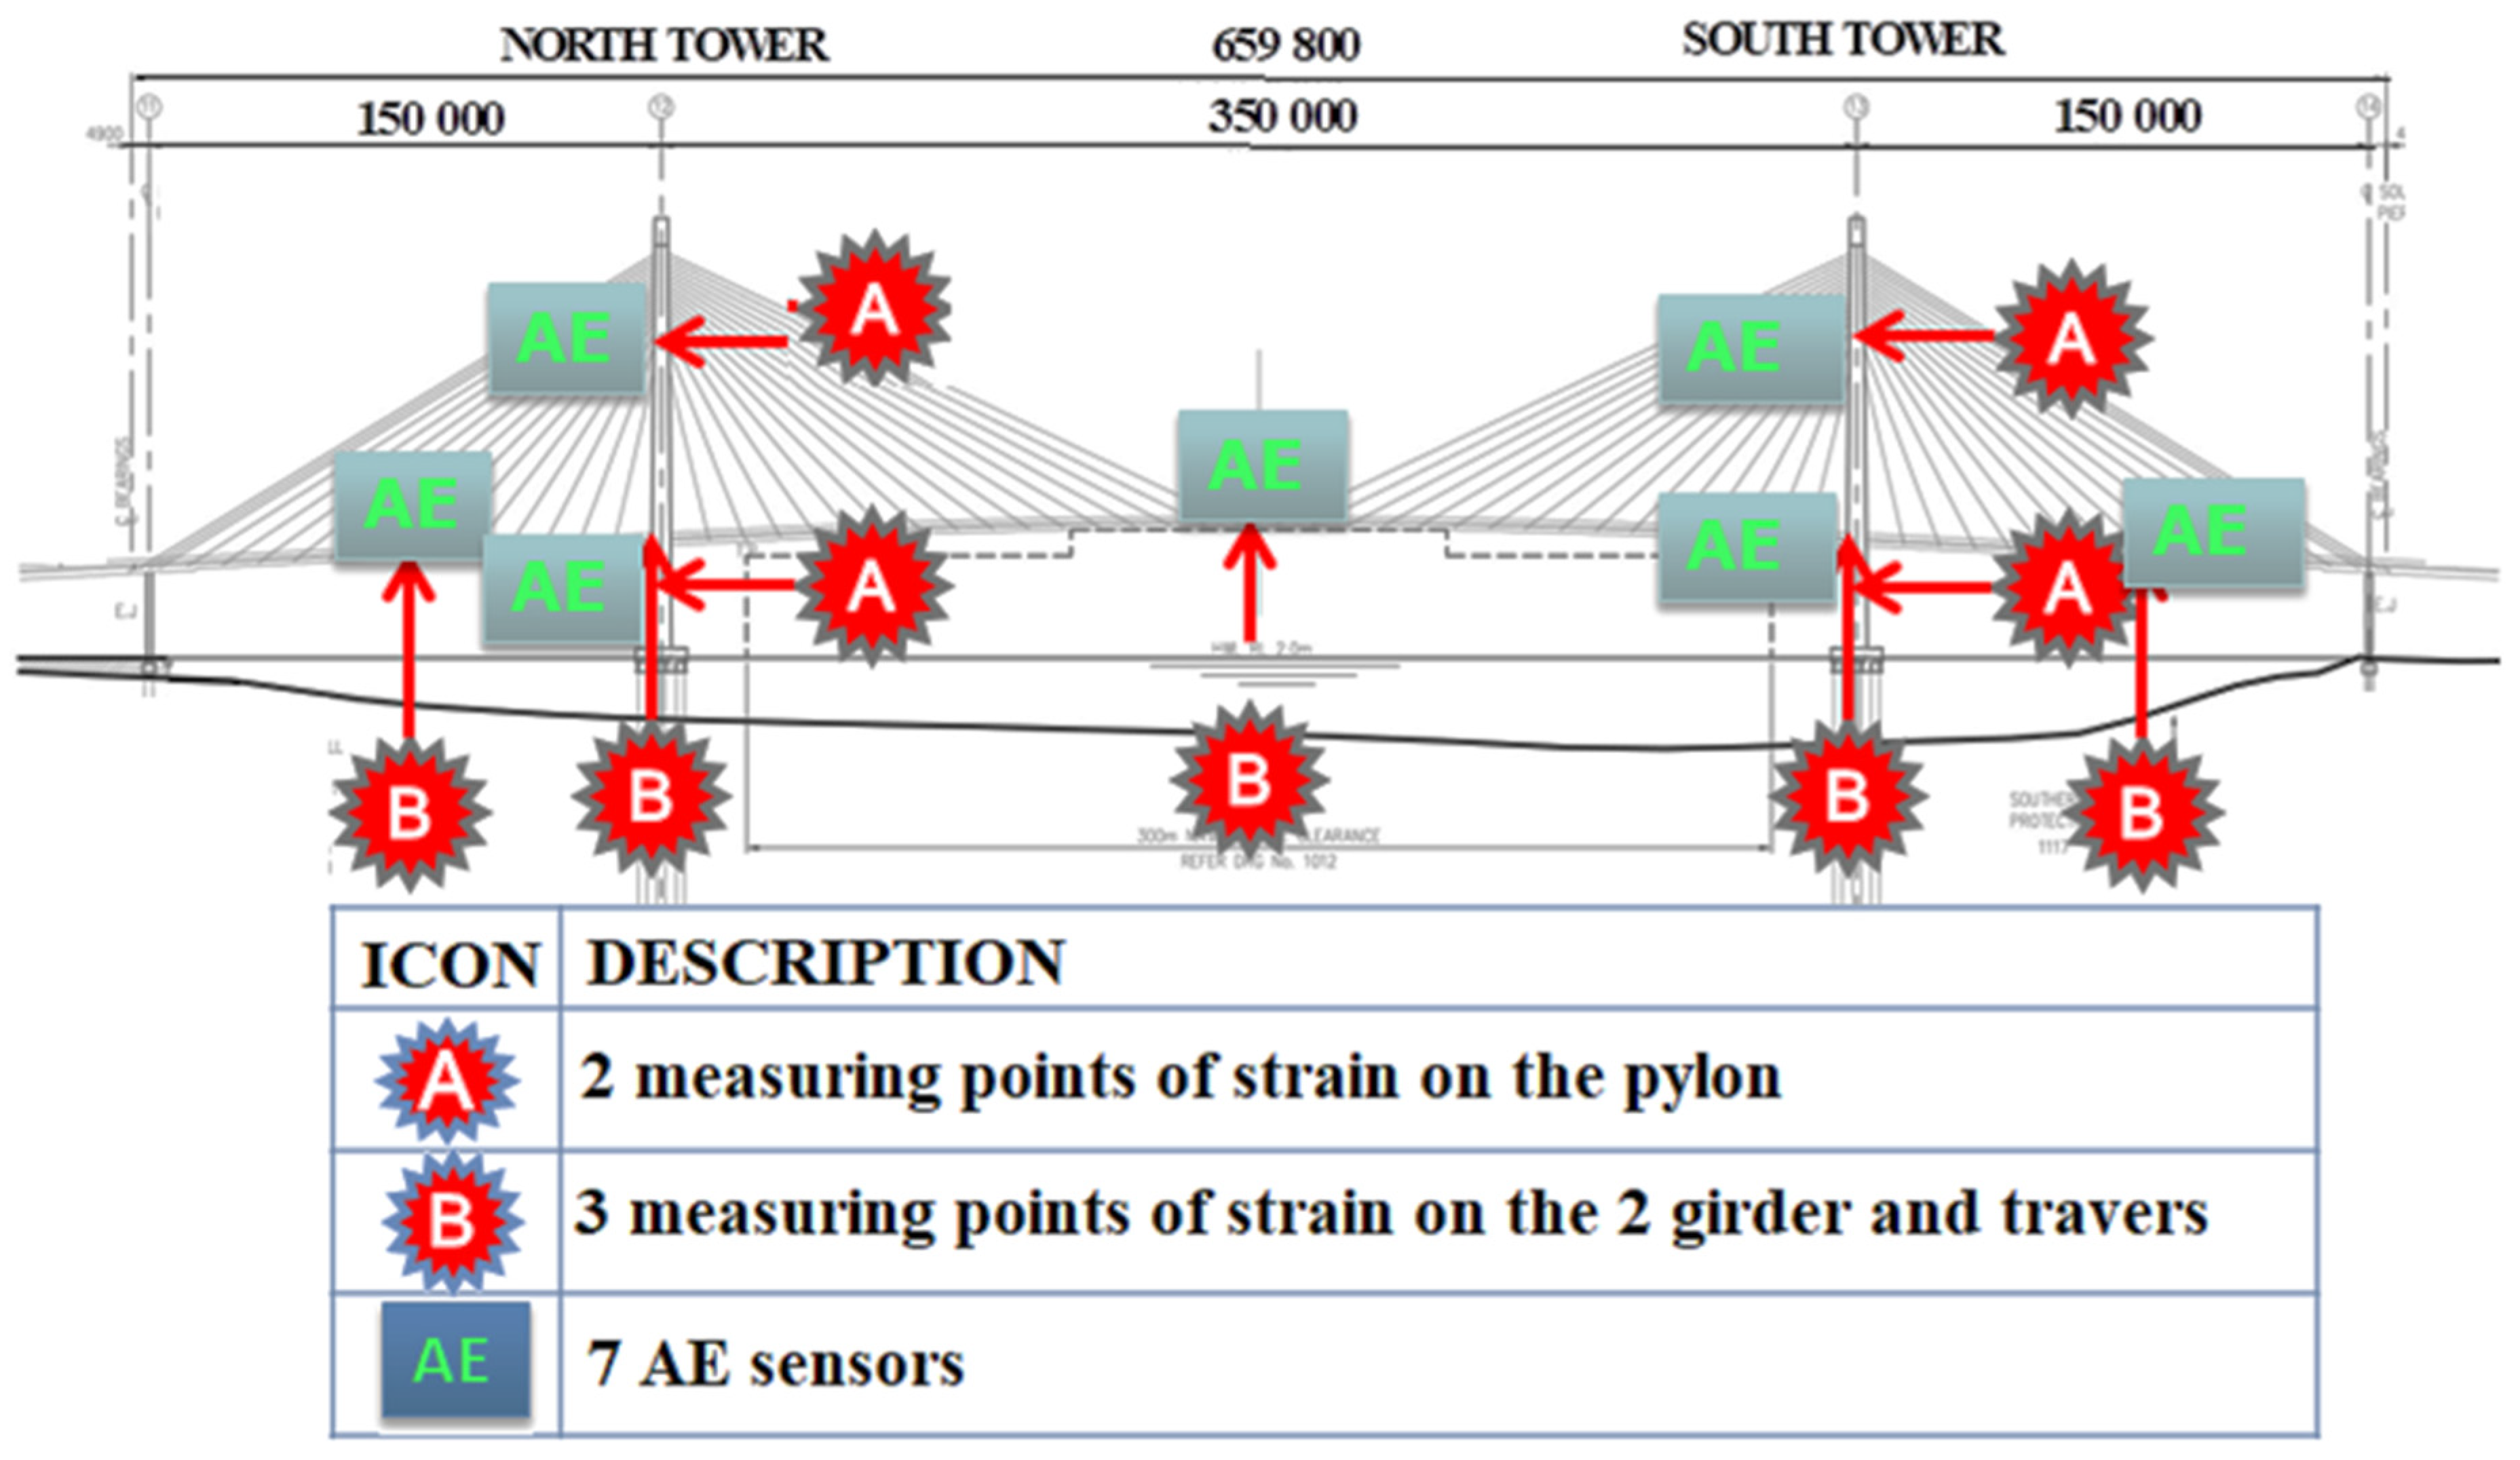
The My Thuan cable-stayed bridge connects the banks of the Tien Giang River flowing between two large provinces in the Mekong basin and and is part of Vietnam highway network. Completed in 2000, the bridge was designed to Australian and Vietnamese standards.
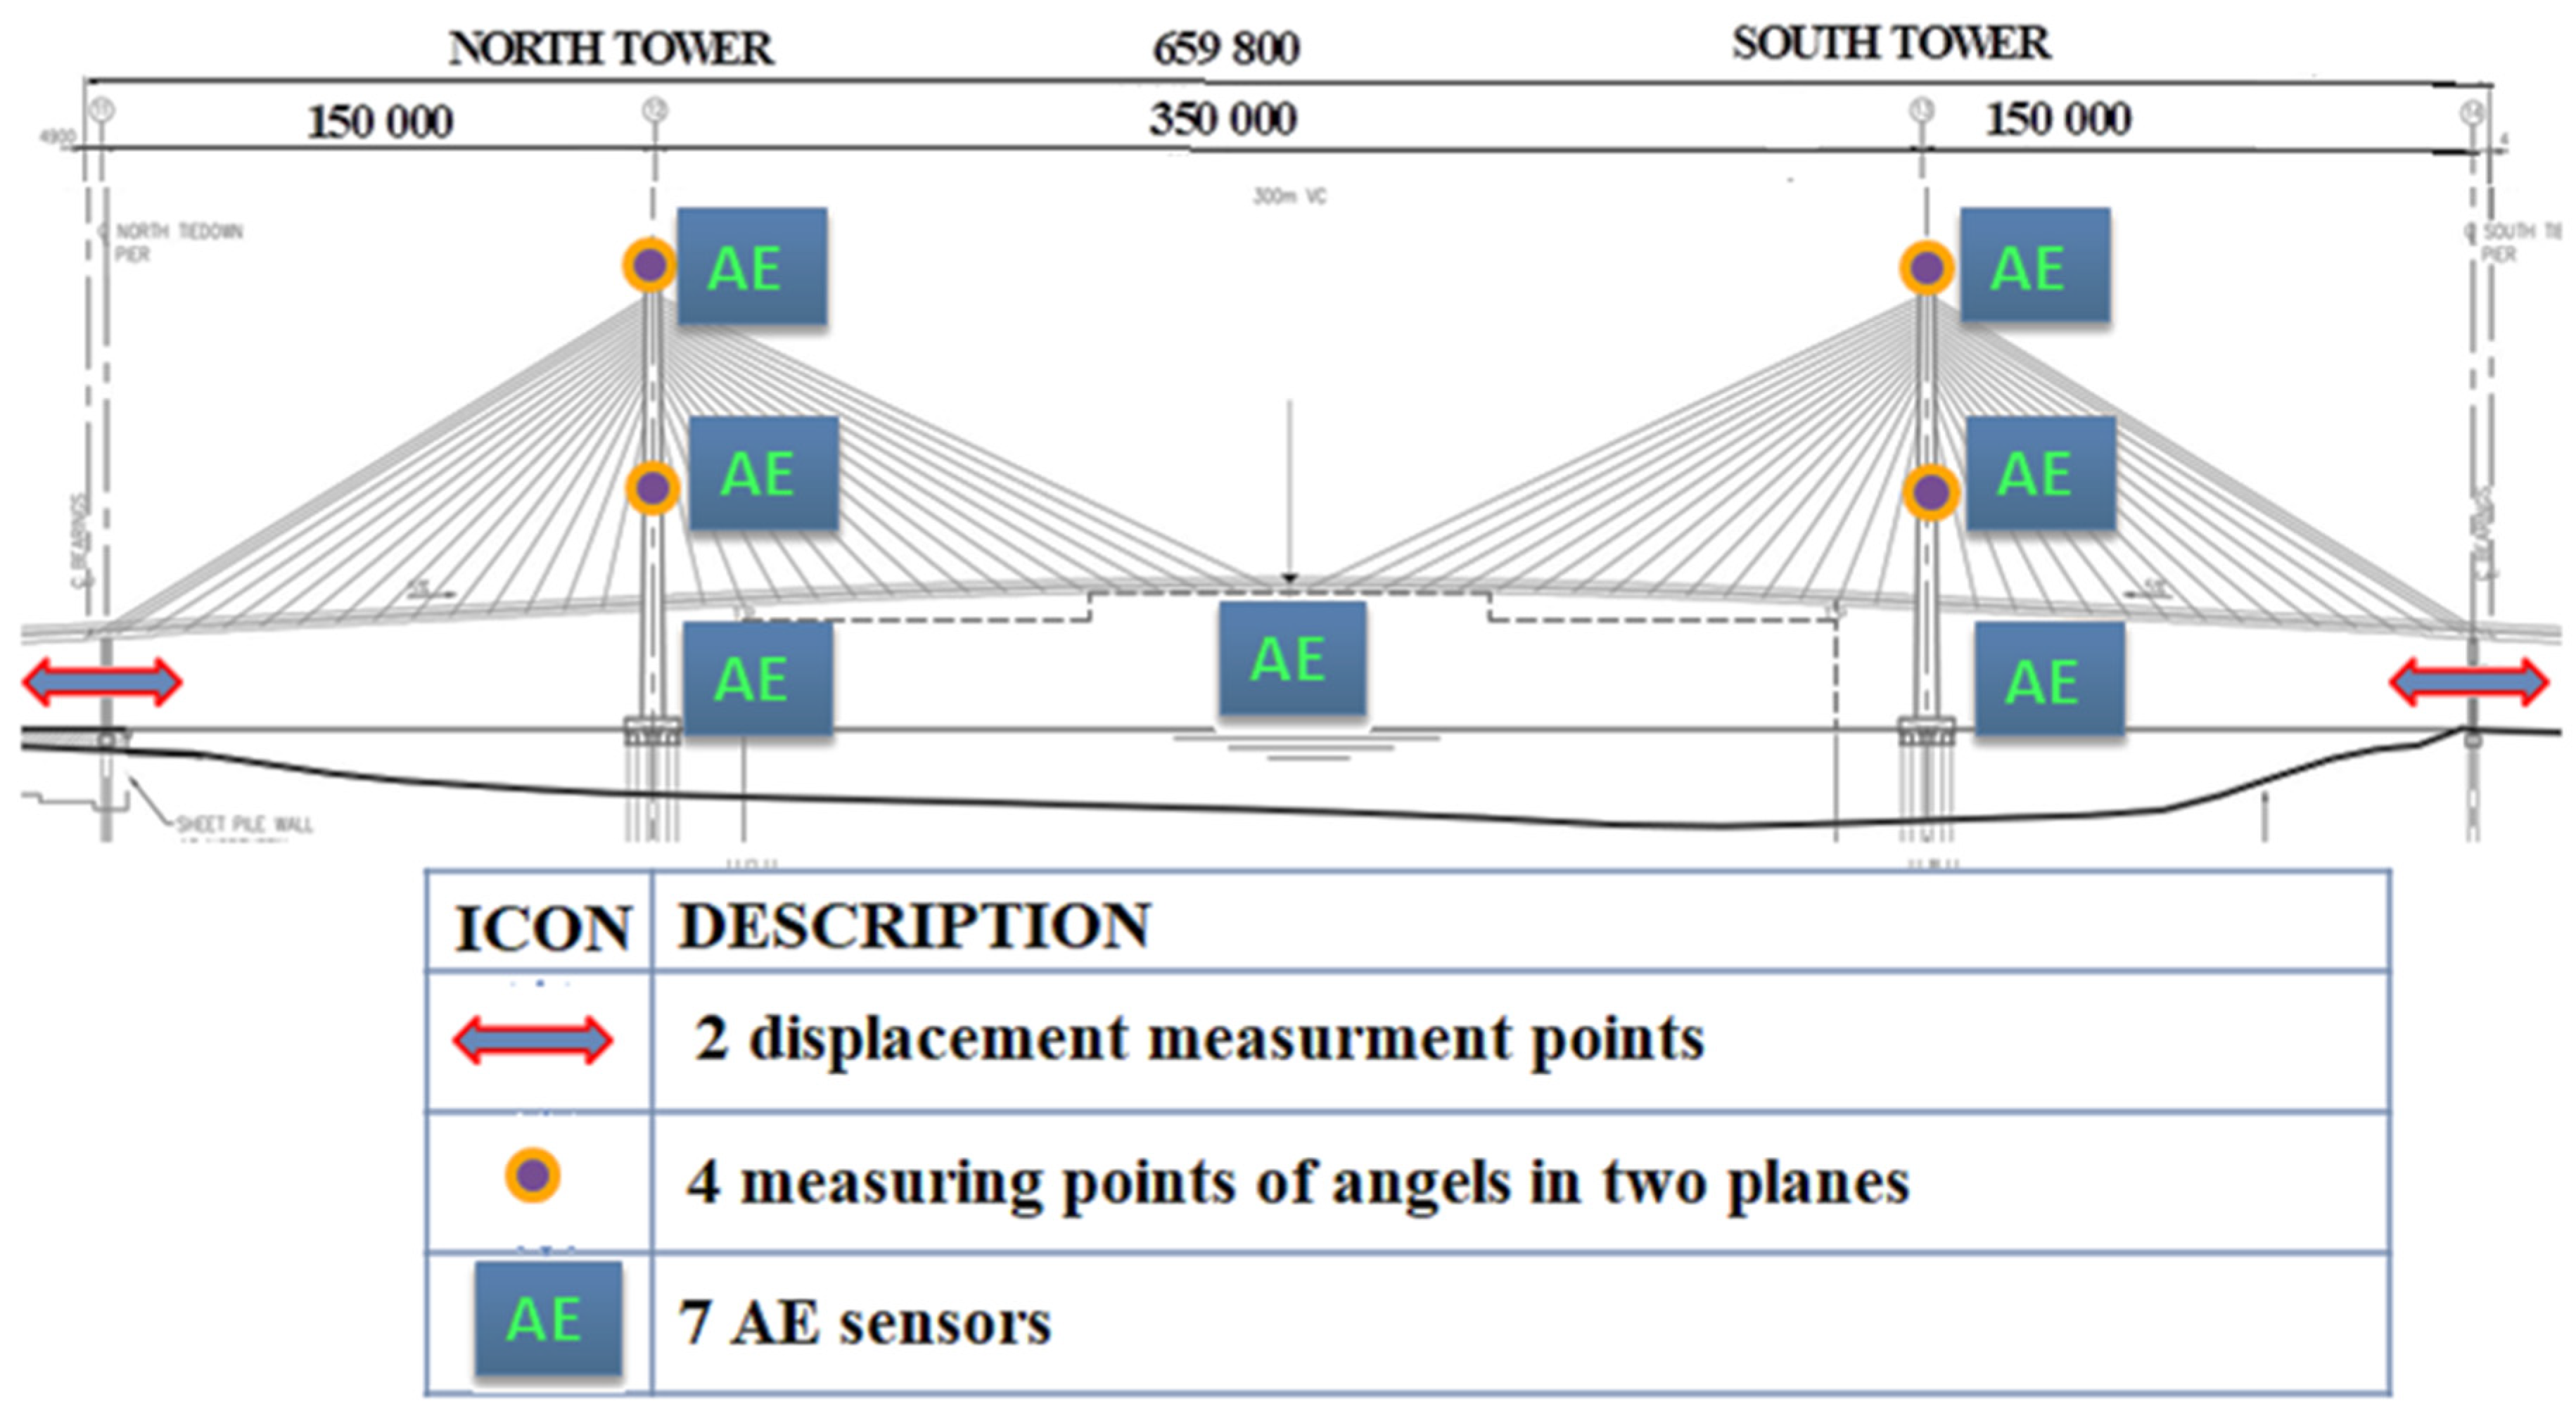
The total length of the bridge is 1535.2 m. The main bridge has three continuous spans with dimensions 150 + 350 + 150 m supported by two main pylons. The main spans are made of prestressed concrete class 50 (fc = 50 MPa) and have two main girders internally attached by a set of floor beams. The bridge was constructed with the use of the cantilever method. The height of the main spans is 1760 mm with the width ranging from 1200 to 1400 mm. The deck slab is 250 mm thick. The end spans are suspended on 4 × 32 cable stays and each stay is composed of 22–29 seven-wire strands 15.2 mm in diameter—a system of dampers was installed on each side of the cable stays to control vibration. The two pylons made of reinforced concrete grade 50 have a splayed H-frame and the height of 123.5 m (from the foundation base) and 84.43 m (from the deck). Each pylon is supported on 16 bored piles 2.5 m diameter driven into the riverbed to the depth of −90 m (northern pylon) and −100 m (southern pylon).
Except for the weather stations (measurement of humidity level, wind speed and direction—installed on the main deck and on the northern pylon, plus two cameras monitoring the water level and traffic), no condition assessment systems for determining the integrity of the bridge were implemented during the design and construction stages. The current condition of these devices is not known.
2.2. Methods
Basic acoustic emission monitoring is carried out during the routine operation of the facility under load (in exceptional cases under the test load).
The tests performed during the routine operation of the facility aim to:
- look for active damage processes (progressing under service conditions) in the structure;
- identify and locate the damage;
- estimate the risk potential of the damage;
- determine the extent of the risk posed to the safety of the facility under routine operation.
The µSamos system (PAC MISTRAS Corp., 195 Clarksville Rd, Princeton Jct, NJ 085, USA) with three PCI-8 cards was used to develop the reference signal databases (24 measurement channels) used in subsequent stages to assess the condition of steel and concrete structures. Flat type sensors operating in the frequency range of 30–80 kHz was used for all structures. A 55 kHz sensor was also used in the concrete structures. Signal amplification was 40 dB. AEWin software was used for the measurements. To analyze the measurement data, Noesis 5.8—ADVANCED DATA ANALYSIS PATTERN RECOGNITION SOFTWARE (PAC MISTRAS Corp., Princeton, NJ, USA) was applied. The reference signal database was created using 13 parameters of acoustic emission: rise time (µs), counts to peak amplitude, counts, energy (EC), amplitude (dB), average frequency (kHz), root-mean square (RMS) (V), reverberation frequency (kHz), initiation frequency (kHz), absolute energy (aJ), signal strength (pVs), duration (µs), and average signal level (ASL) (dB).
The Identification of Active Damage Processes (IADP) method is based on the analysis of acoustic waves generated by active destructive processes developing under operational loads in buildings and engineering structures. The signals received by acoustic sensors mounted on the object are compared to the database of reference signals created earlier for defined destructive processes. The identified destructive processes are then localized by analyzing the difference in time of signal arrival to individual sensors. The identification and the location of active damage processes make it possible to assess the technical condition of structures, and thus can be the basis for the diagnosis and management strategies.
The big advantage of the IADP method is that the AE sensors can be arranged to cover the entire structure being measured and that the measurements can be performed under actual operational loads.
In its original version, the IADP method was developed to analyze destructive processes in prestressed concrete elements. It was then expanded and applied in the analysis of steel elements for which a new database was created with pattern signals of destructive processes resulting from cyclic and monotonic loads.
Patterns of AE signals were obtained as a result of tests carried out at temperatures ranging from −60 °C to +60 °C on monotonically loaded V-notch specimens made with St3S and 18G2A grade steels and with the steel recovered from an old bridge, on bent models of V-notch elements under monotonic and cyclic loading at +20 °C, and models of welded, riveted, and bolted nodes made of the same grade steel.
The following destructive processes being the AE signal sources can be distinguished in prestressed concrete structures:
- microcracks;
- friction between crack surfaces;
- formation and development of cracks in concrete;
- cracking at the concrete–reinforcement interface;
- concrete crumbling;
- friction at the concrete–reinforcement interface;
- corrosion;
- plastic deformation and cracking of cables and other reinforcements.
The values of the AE signal parameters allow the classification of the signals into classes, each of which is characterized by dominant destructive processes and different risk levels. The signals characteristic of each class create the reference databases capable of identifying a destructive process, e.g., “cracking at the concrete-reinforcement interface” corresponds to the database that groups selected signal parameters assigned to the specific process.
Databases for individual processes (or their groups) are determined on the samples of materials, on models used in special laboratory tests (where a given destructive process or a group of processes predominates) and on full-size structural elements during strength tests, attenuation tests, and during normal operation of the facility.
The database of AE reference signals makes it possible to identify active destructive processes over the entire element under test. Long-term measurements can be used to determine the damage under true loading conditions, with the external factors such as rain, frost, or wind taken into account. Appropriate installation of AE sensors allows the measurement of the entire volume of the examined element and the location of the emission source (the point of damage).
To build the reference signal database with the Recognition of Destructive Processes (RPD) method, the NOESIS 5.8 program was used with hierarchical and non-hierarchical statistical grouping methods and neural networks. For the RPD database, two versions of the pattern recognition method were used: with arbitrary division into classes—unsupervised pattern recognition (USPR) and self-learning, in which the division into classes was carried out using the reference signals—supervised pattern recognition (SPR).
In the first case, analysis of arbitrary patterns is mainly used for creating a reference signal database if the number of classes is unknown. The second method is applied when model signals characterizing the destructive processes are available. The reference signals are the signals previously collected in databases generated during independent experiments.
While the USPR method classifies AE sources based on the similarity of signals without assigning appropriate mechanisms to the groups, the SPR method assigns specific processes to the groups, provided they have a base of reference signals.
Creating a reference signal database is organized in several stages. These are:
- generating signals in the laboratory while destroying specially designed specimens (bars, cubes, rolls) in a specific way,
- comparison of signals received from the specimens with the signals generated during the destruction of model beams (reinforced concrete and pre-tensioned concrete),
- verification of reference signals based on the monitoring results obtained for various types and lengths of prestressed concrete girders loaded to failure,
- final verification of selected elements of the bridge during its normal operation.
2.2.1. Acoustic Emission Evaluation of Steel Structures
Assessment involves the analysis of changes in the intensity of acoustic emission signals generated in particular zones of structural elements under routine use. Recorded AE signals are grouped into classes to which various destructive mechanisms are assigned. The number of parameters used to build the database of reference signals must be consistent with the number of previously registered parameters of AE signals [11,12].
The risk posed by generating processes within one class is determined by the so-called intensity code of destructive processes. These processes are best illustrated by graphs where each AE signal is assigned to one point. The color and shape of the point indicate the class to which the given AE signal belongs. The classes, symbols, and codes are summarized in Table 1.
Training patterns are used for the grouping and classification of AE signals.
Class No.5 signals are generated by the constant AE noise. Classes No. 4, No. 3, and No. 2 of signals are generated by single destructive mechanisms such as:
- No.4—yielding of steel at the crack tip;
- No.3—crack initiation;
- No.2—crack propagation.
Class No.1 includes the signals resulting from the superposition of waves generated by more than one destructive process and by crack surface friction.
Occurrence of signals of all classes during the monitoring period is regarded as another item among the codes defining the influence of defects on the structural condition and indicates the presence of destructive processes in the structure.
The extent of damage is assessed using the zone location results and AE signal classification in the zones.
The individual signal classes mean (Table 2):
- No.1—rupture;
- No.2—friction;
- No.3—crack propagation;
- No.4—crack initiation;
- No.5—perforation/deformation;
- No.6—material losses;
- No.7—surface corrosion;
- No.8—work in the elastic range.
2.2.2. Acoustic Emission Evaluation of Gas Pipelines
Classes, symbols and codes of AE signals together with the risk level for gas pipeline are compiled in Table 3.
2.2.3. Acoustic Emission Evaluation of Reinforced Concrete Structures; Classes, Symbols, and Risk Codes for Reinforced Concrete Structures
The database of reference signals was created by conducting a series of tests on various types of reinforced concrete beams and specimens under various loads, including cyclic loading for the modeling of the car’s passage [18,19,20,21,22,23,24]. The tests aimed at finding predominant destructive processes that might occur during testing of reinforced concrete structures under operation. The database was verified on real facilities [25,26,27,28,29,30,31,32].
The reference databases were classified on the basis of 12 AE parameters (rise time (µs), counts to peak amplitude, counts, energy (EC), amplitude (dB), average frequency (kHz), RMS (V), reverberation frequency (kHz), initiation frequency (kHz), absolute energy (aJ), signal strength (pVs), duration (µs), ASL (dB)) and marked for reinforced concrete (RC) structures as Class (Table 4):
- Class No.1 Crack formation in the paste;
- Class No.2 Crack formation at the paste—aggregate boundary;
- Class No.3 Microcrack formation;
- Class No.4 Crack growth;
- Class No.5 Loss of adhesion around the cracks;
- Class No.6 Buckling of compressed bars/crushing of compressed concrete/rupture of rebar.
The results of the cracking tests under monotonic, cyclic, and variable loading were used to develop the following criteria of structural damage:
- Classes No.6 and No.5—safe behavior of the structure;
- Class No.4—warning;
- Class No.3—threat to durability;
- Class No.2—threat to load carrying capacity;
- Class No.1—loss of safety.
3. Results and Discussion
3.1. Steel Bridge
The following is the AE measurement data processed for selected groups of components.
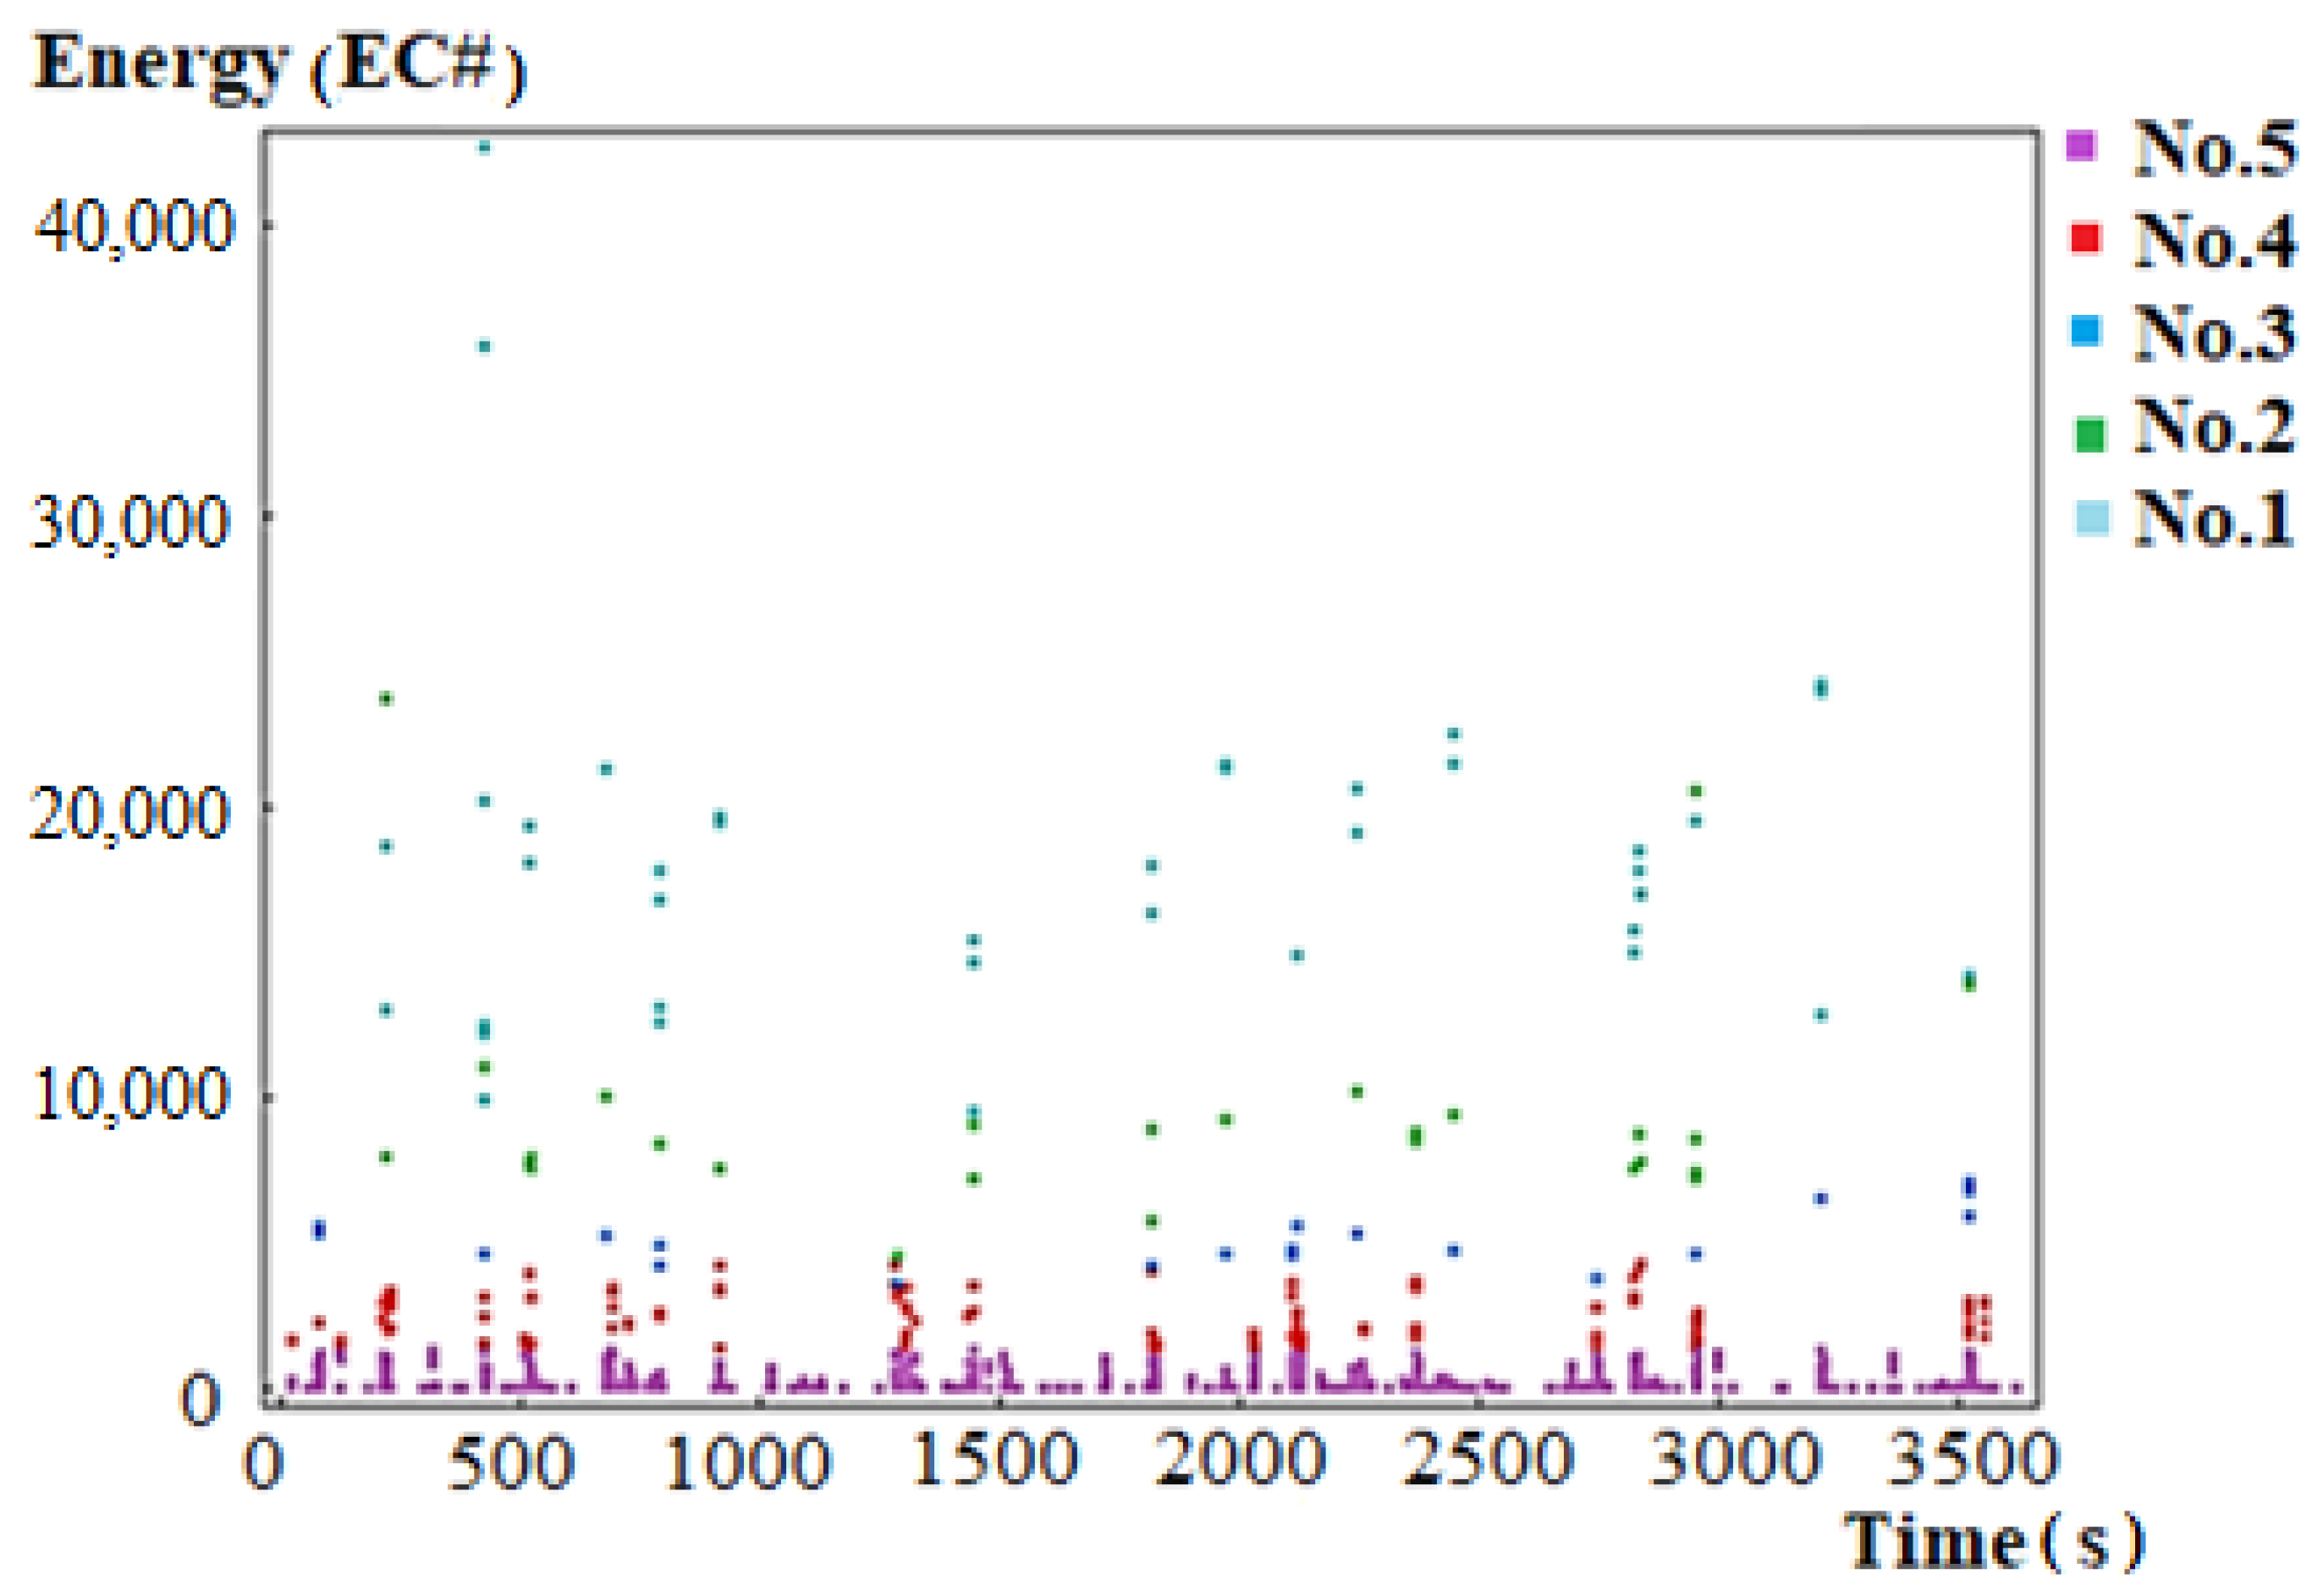
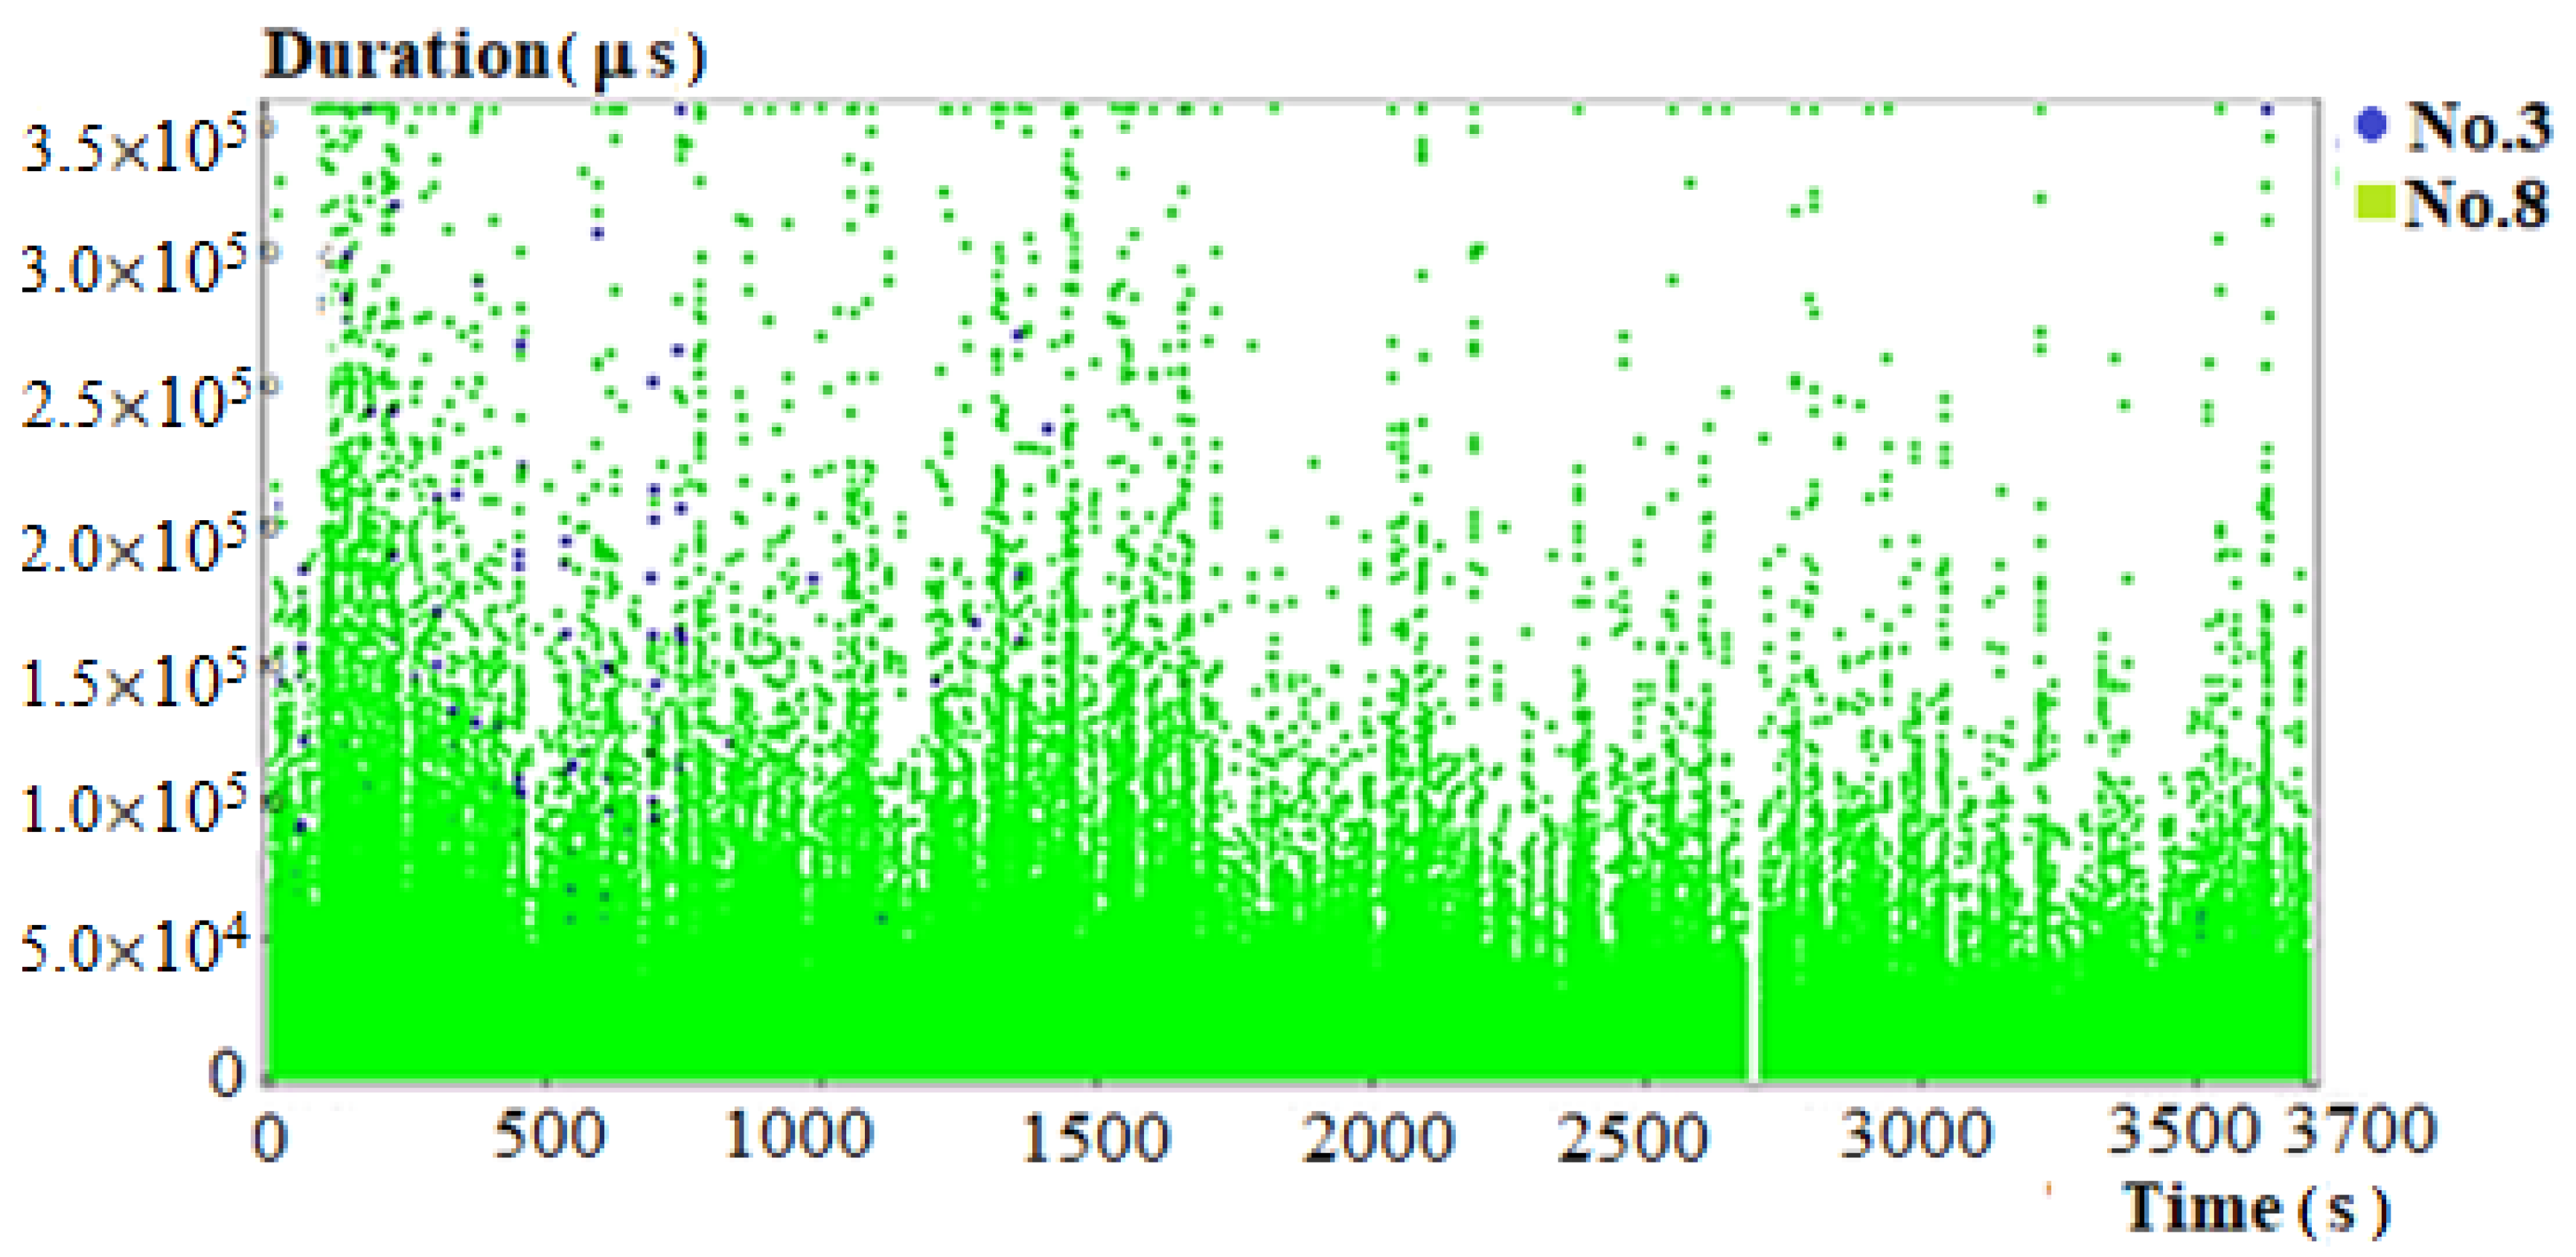
The bottom chord (span 1): Analysis of the recorded AE signals against the reference signal database reveals the presence of signals representing all classes. Signal duration is variable and reaches 350,000 μs. The energy emitted when signals are generated is low and reaches 20,000 ec (Figure 6). Individual signals attain slightly higher values. The generation of AE signals is not continuous; the signals are initiated by passing vehicles with specific characteristics (tractors with semi-trailers moving at a speed of more than 60 km/h or heavy trucks moving in the column at speeds exceeding 60 km/h). This is due to the condition of expansion joints and dynamic loads initiating AE signals at the seats of diagonals and vertical members in the gusset plates. The resulting signals suggest that stresses increase in riveted and welded joints due to significant surface corrosion and in some locations due to pitting, slight loosening of rivets, and their movement. The number of signals describing the yielding and crack development is small and concentrated in three zones of the chord. These signals are generated when trucks traveling at excessively high speeds pass through.
Nodes 1–3 (span 1): Analysis of the recorded AE signals against the reference signal database reveals the presence of signals representing all classes. Signal duration does not exceed 50,000 μs. Energy is low, 25,000 ec (Figure 7). Individual signals reach slightly higher values. The generation of AE signals is not continuous; the signals are initiated by the movement of vehicles with specific characteristics or originate from the work of the element working both in tension/compression. This should be interpreted to mean that the change in stress level will result in slight movement at riveted connections and at the connections of the gusset plate with the upper chord. The recorded signals inform about the behavior of elements in the elastic range, and individual signals inform about local yielding and corrosion at the nodes.
Stringers 1–6 (span 1): Analysis of the recorded AE signals against the reference signal database reveals the presence of signals representing all classes. Signal duration is long, up to 360,000 μs, and the energy emitted during signal generation reaches a value of up to 40,000 ec (Figure 8). Individual signals have slightly higher energy values of up to 60,000 ec. High parameter signals are not emitted continuously. The signals are initiated by passing vehicles with specific characteristics (tractors with semi-trailers moving at a speed of more than 60 km/h or heavy vehicles moving in the column at speeds above 60 km/h). Signals located and recorded originate mainly in the central zone of the stringers. The high rise time of 25,000 μs suggests that the signals originate from corrosion processes and friction occurring on the surface of the upper flange of the stringer and on the orthotropic plate. The signals indicate that corrosion processes are advanced and that dynamic loads cause delamination cracks on the corroded surfaces and friction between them. The number of signals from higher classes 1, 2, 3 is significant, which suggests that these processes do not pose a risk to the bridge although strong corrosion processes and the formation of fatigue microcracks have begun, which left without repair, can lead to fatigue cracks, thus weakening the entire structure.
Stringers 7–8 (span 2): Analysis of the recorded AE signals against the reference signal database reveals the presence of signals representing only class 5. Signal duration is short, 15,000 µs and energy emitted when signals are generated reaches 2500 ec (Figure 9). The rise time of 4500 µs confirms good performance of the members in the elastic range.
3.2. Steel Columns
Twelve sensors were installed on column 1. Spatial location demonstrated that the column of the supporting structure was working in the range that might, sometime in the future, pose a threat to the safety of the cableway. The tests were performed when the cable cars were stationary and during their regular operation. When stationary, no processes generating dangerous phenomena were recorded, but when the cable cars started moving (within the normal operating envelope), destructive processes Class 2–8 were revealed (Table 2), which indicated the growth of microcracks in the members. This demonstrates that some of the members were exposed to fatigue-induced destructive processes. Surface corrosion attack were found at the bolted connections and at half height of the vertical elements of the column.
Figure 10, Figure 11, Figure 12 and Figure 13 show damage classes occurring in the tested elements. Data from 12 sensors were combined using the supervised pattern recognition method.
Analysis of the recorded AE signals against the reference signal database (Figure 10) reveals the presence of signals representing classes from 2 to 8 (Table 2). The signal strength is high, up to 9 pVs. Continuous emission of the signals is initiated by passing trolleys with weight of 2500 kg, which translates to the presence of locations with fatigue and overload cracks and corrosion centers. The welded and bolted connections in the nodes may be affected due to substantial surface corrosion and pitting. The condition of the members revealed during the examination was an indication for further observation of the column and for placing spacer blocks between the column and the safety platform. A portion of damage may result from additional load caused by the movement of the platform (fatigue).
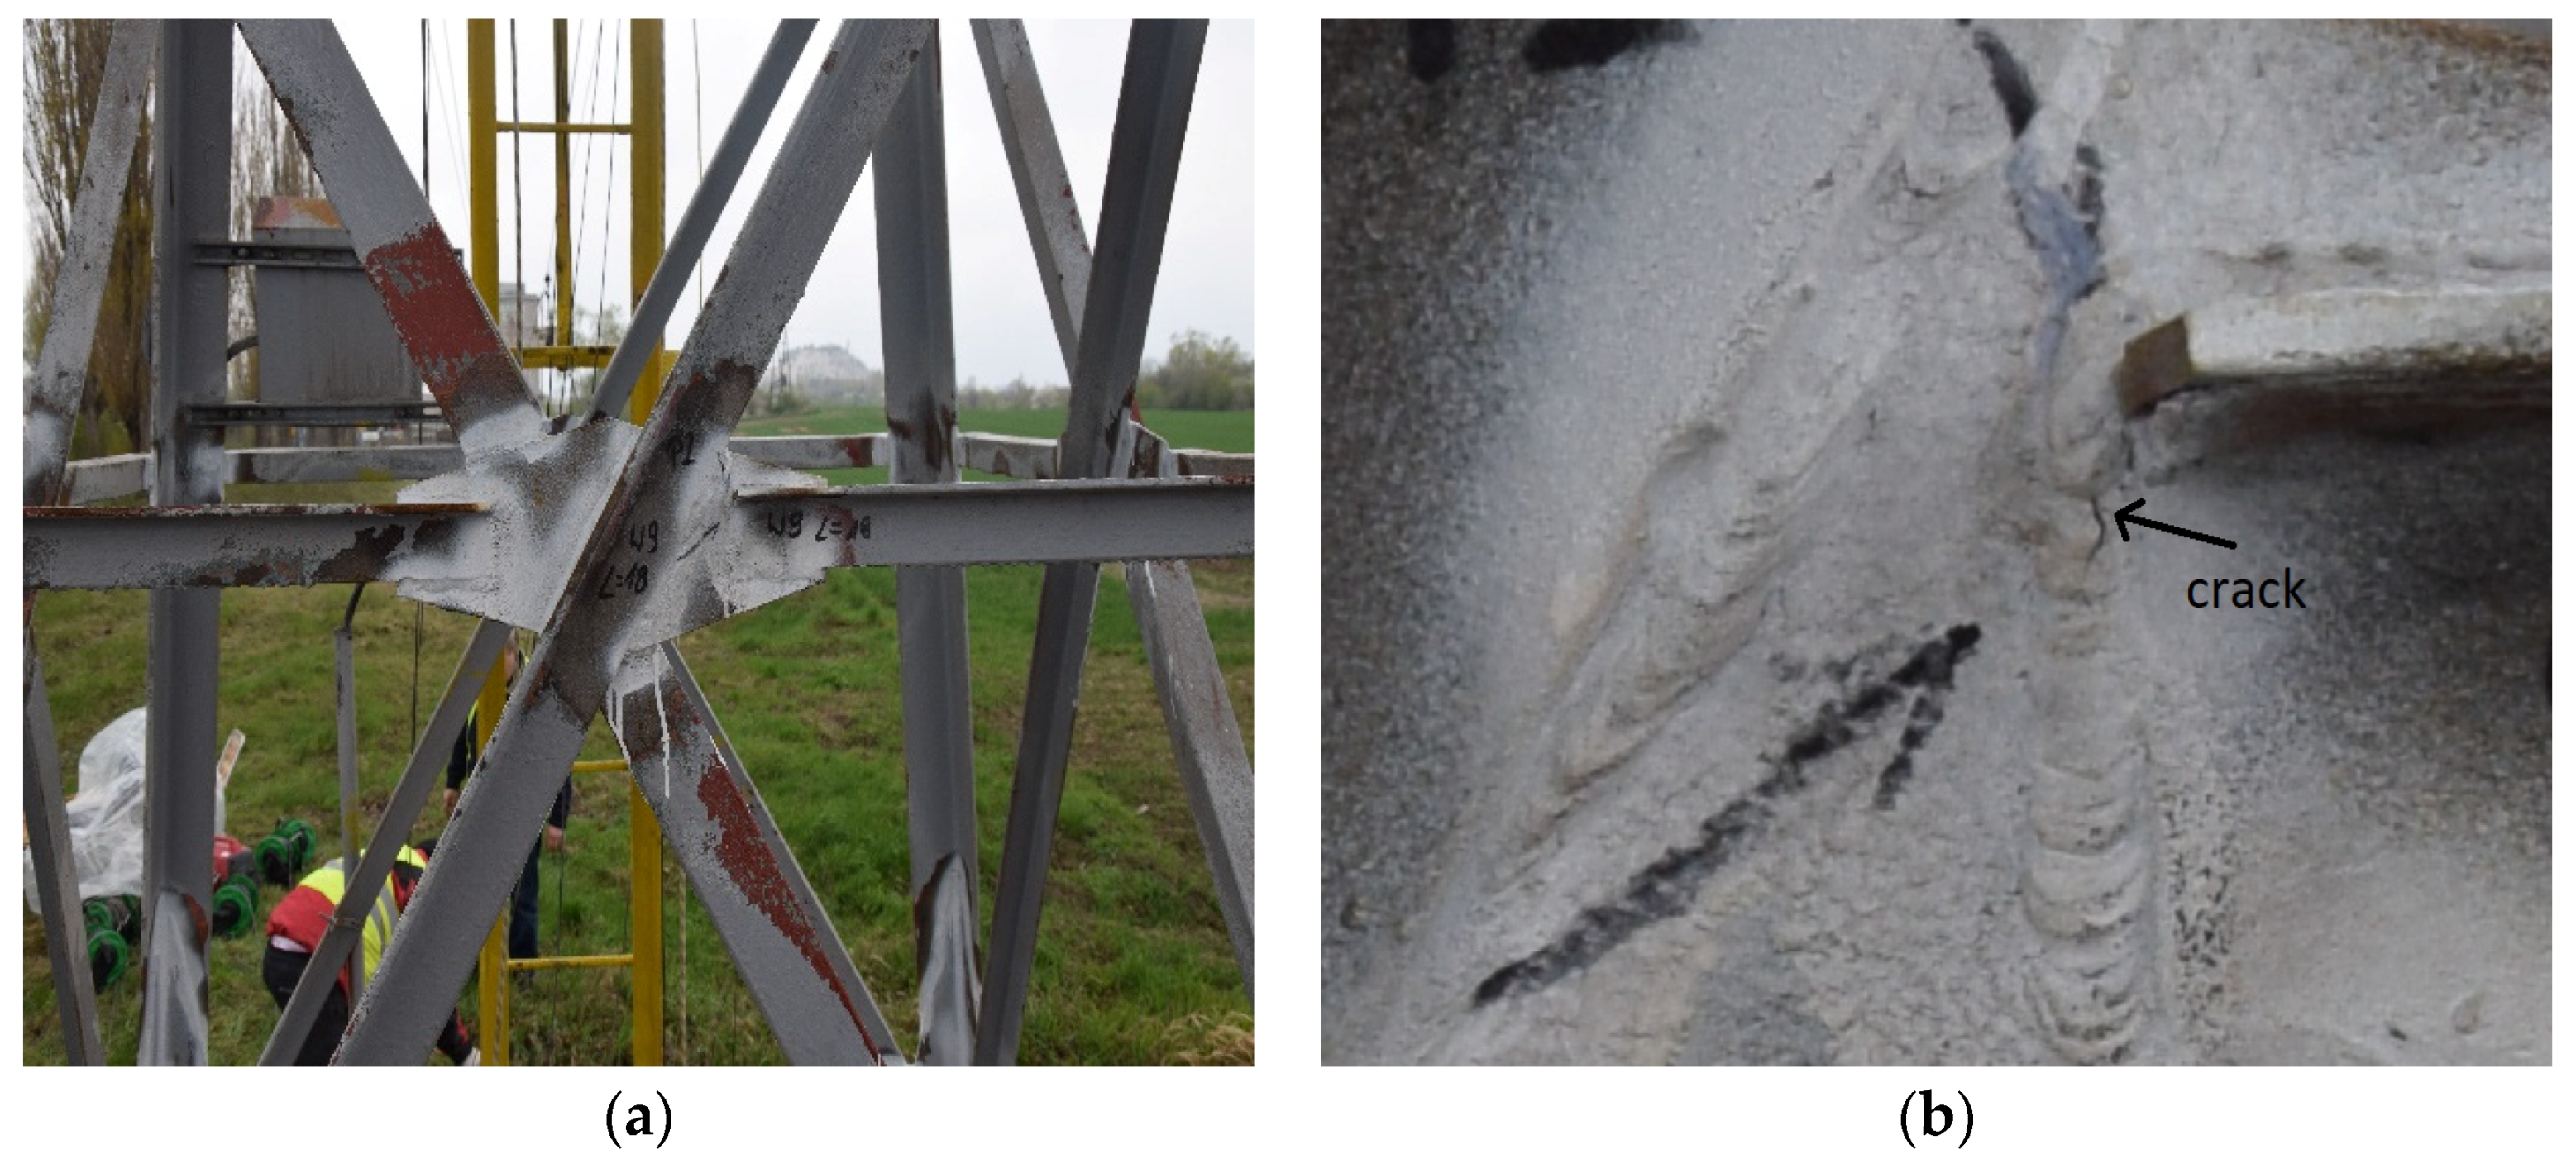
Fatigue cracks were detected in the indicated places on the basis of magnetic particle tests (Figure 11). It allowed to verify the visual assessment and AE measurements with the actual condition of the element.
Twelve sensors were installed on column 2. Spatial location indicated that the column of the supporting structure worked in the range that may in the future cause a cableway safety risk. The tests were performed during routine operation of the facility. Two processes that generated events within the elastic range were revealed, as were the locations where the steel yielded, described as Class 4 destructive processes. In the case of column 2, yielding was probably caused by the additional load due to vibrations of the steel platform securing the road. The lack of spacers at the connection of these two structural elements may cause steel yielding and, as a consequence, fatigue microcracks and cracks. This indicates that some elements are exposed to destructive processes caused by fatigue. Locations of surface corrosion were also detected. The most strained locations were discovered at the bolted connections and at the mid-height of the column vertical elements.
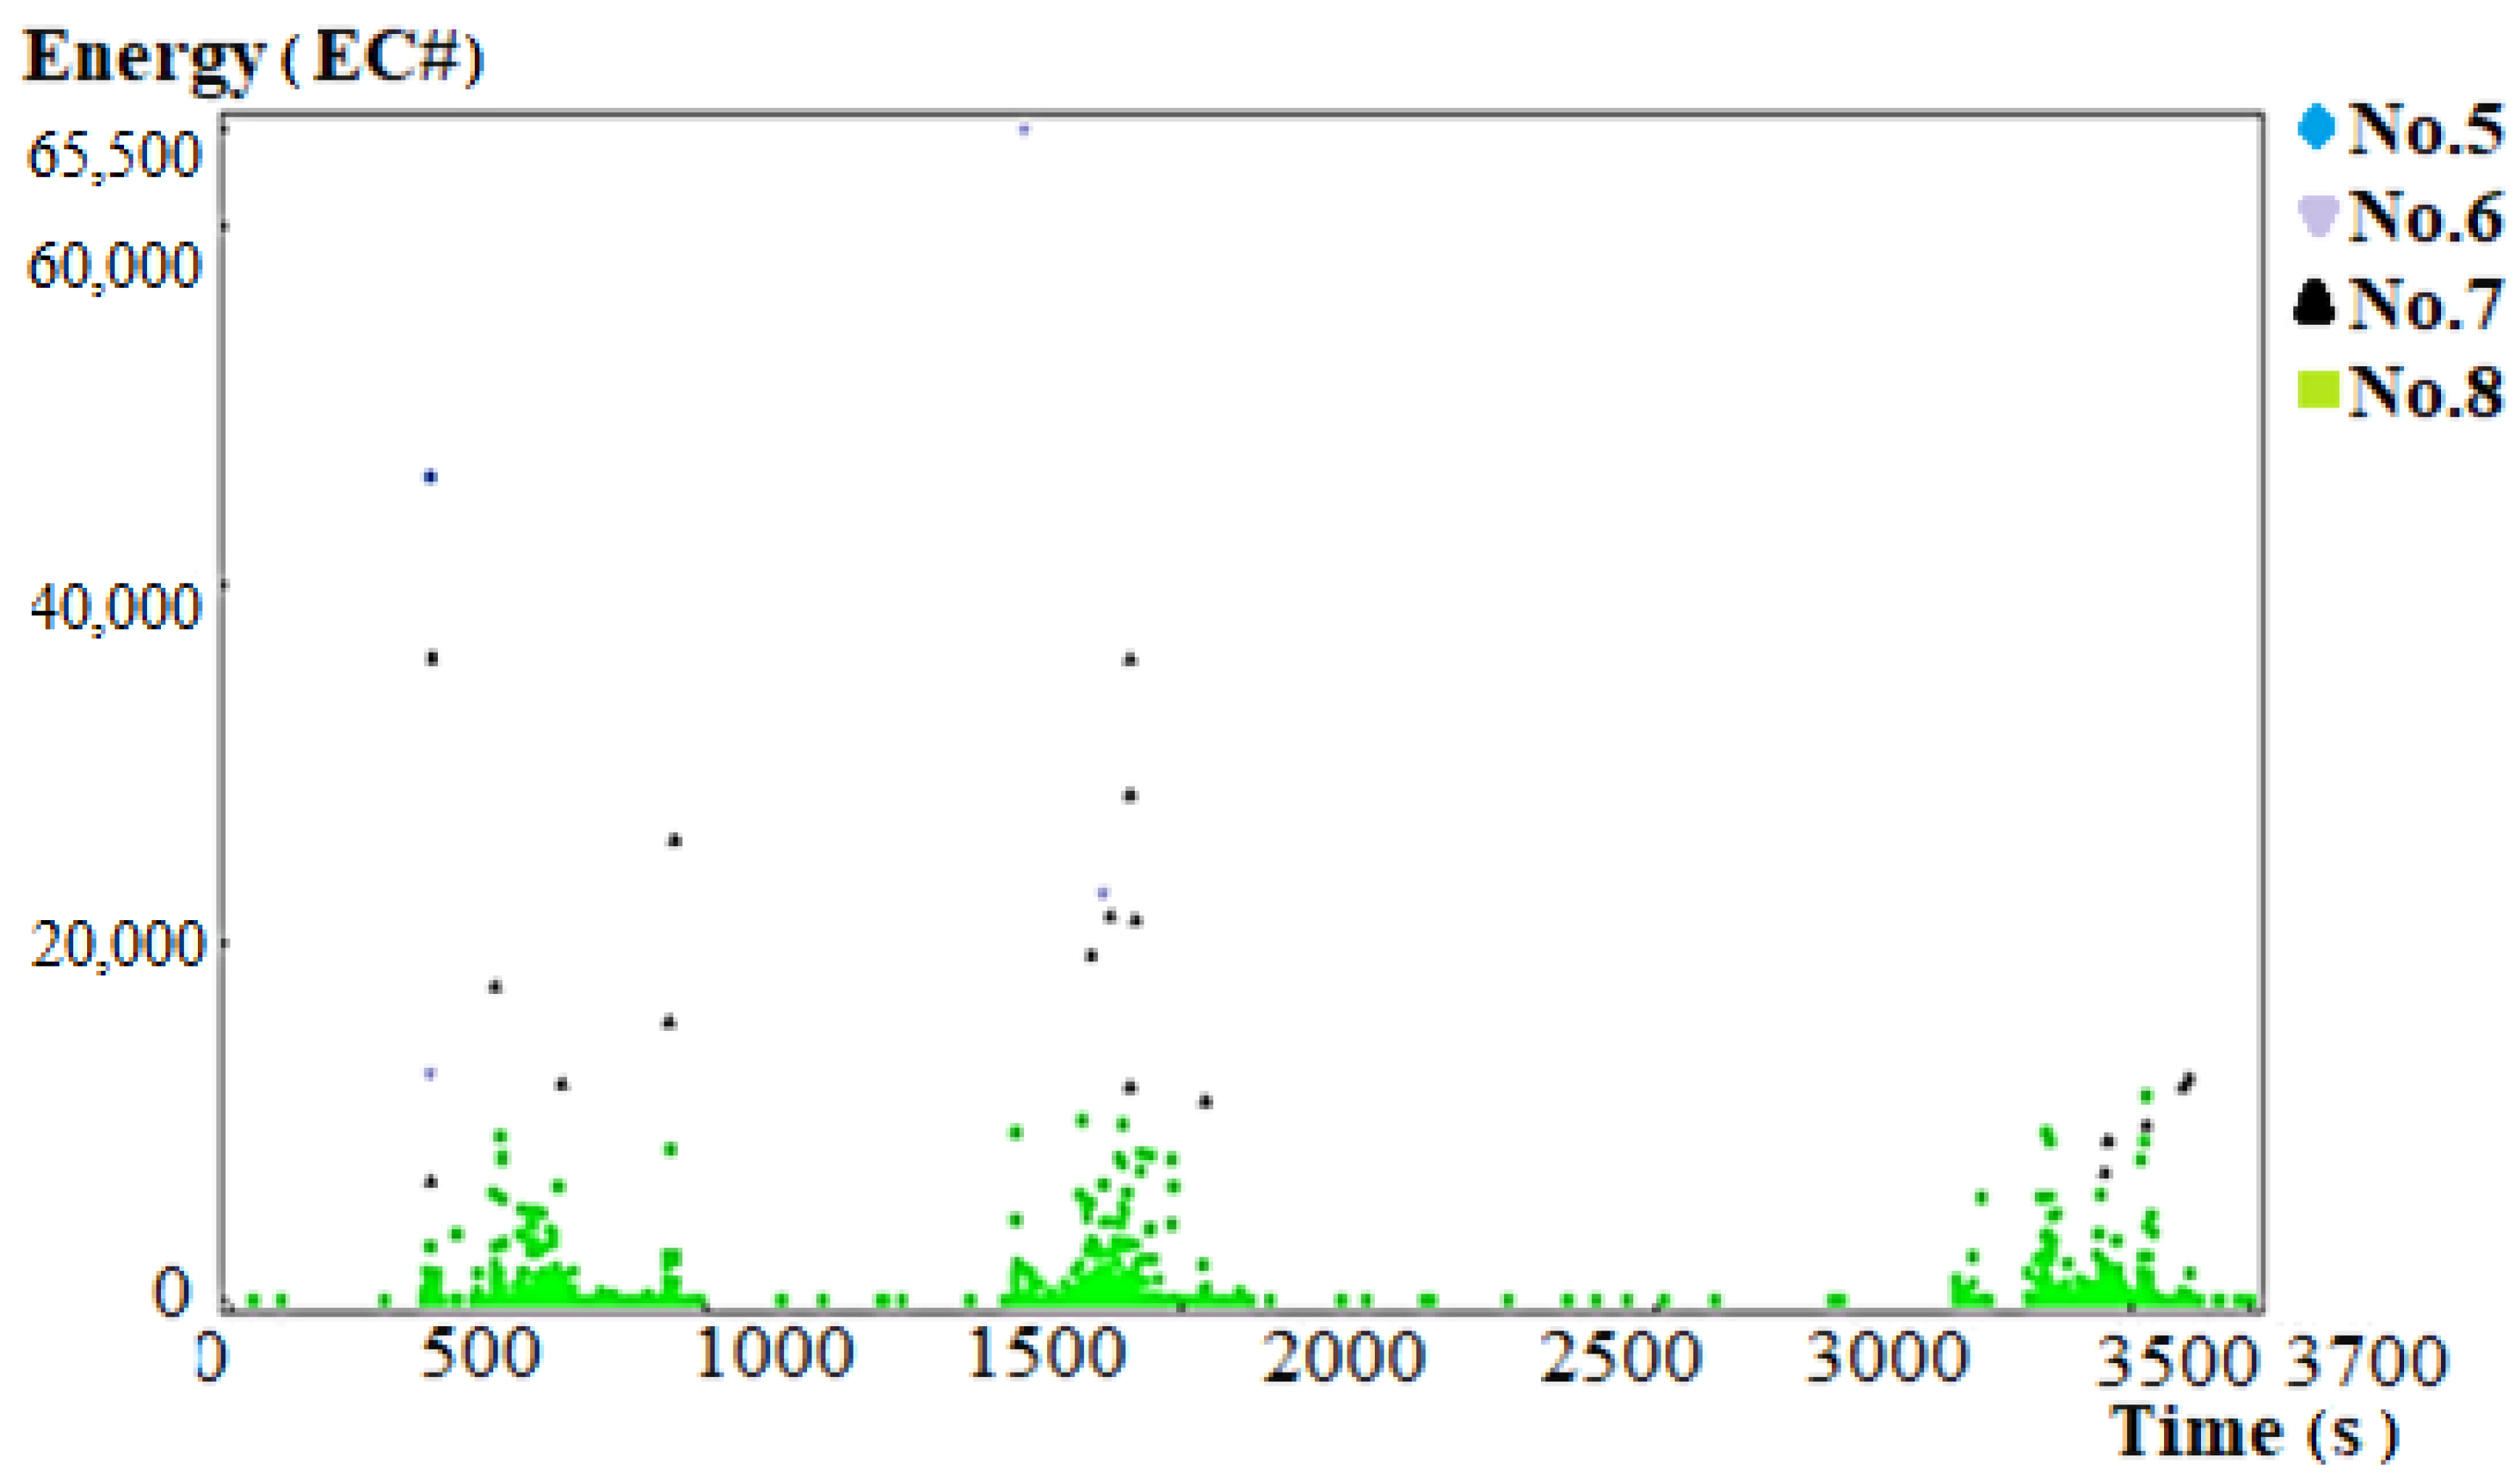
The recorded AE signals analyzed using the reference signal database (Figure 12 and Figure 13) indicate that in the node under analysis only Class 3 and 8 signals appear. The duration of these signals is long, up to 350,000 μs, while the signal energy is low, 30,000 ec on average and up to 65,000 ec locally. The acoustic emission signals are generated dis-continuously and are not initiated by passing trolleys weighing approximately 2500 kg, which indicates the existence of sites with plastic deformations, which may degenerate into fatigue microcracks and corrosion sites. Welded and bolted connections within the nodes may be affected due to surface corrosion, with some bolts (plates) loosened. Those destructive processes were the reason for the observation of this column and for the use of spacer blocks between the column and the safety platform. Part of the damage may result from the additional load caused by the movement of the platform contributing to material fatigue.
3.3. Gas Pipeline
The results of the acoustic emission evaluation of the high-pressure gas pipeline were analyzed by grouping using non-hierarchical methods (k-means) and by comparison to the reference signals (Table 3). The results showed reduced thickness of the pipe wall due to pitting and deformations and perforations of the structure due to changing working and corrosion conditions.
Analysis of absolute energy parameter as a function of time, correlated with parameters such as duration, amplitude, rise time, and AE counts, shows that destructive processes exhibit low intensity across a small area of the gas pipeline (Figure 14).
It should be emphasized that the destructive processes do not proceed continuously, which indicates the local character of these phenomena. The next step in the analysis is to locate places generating destructive processes.
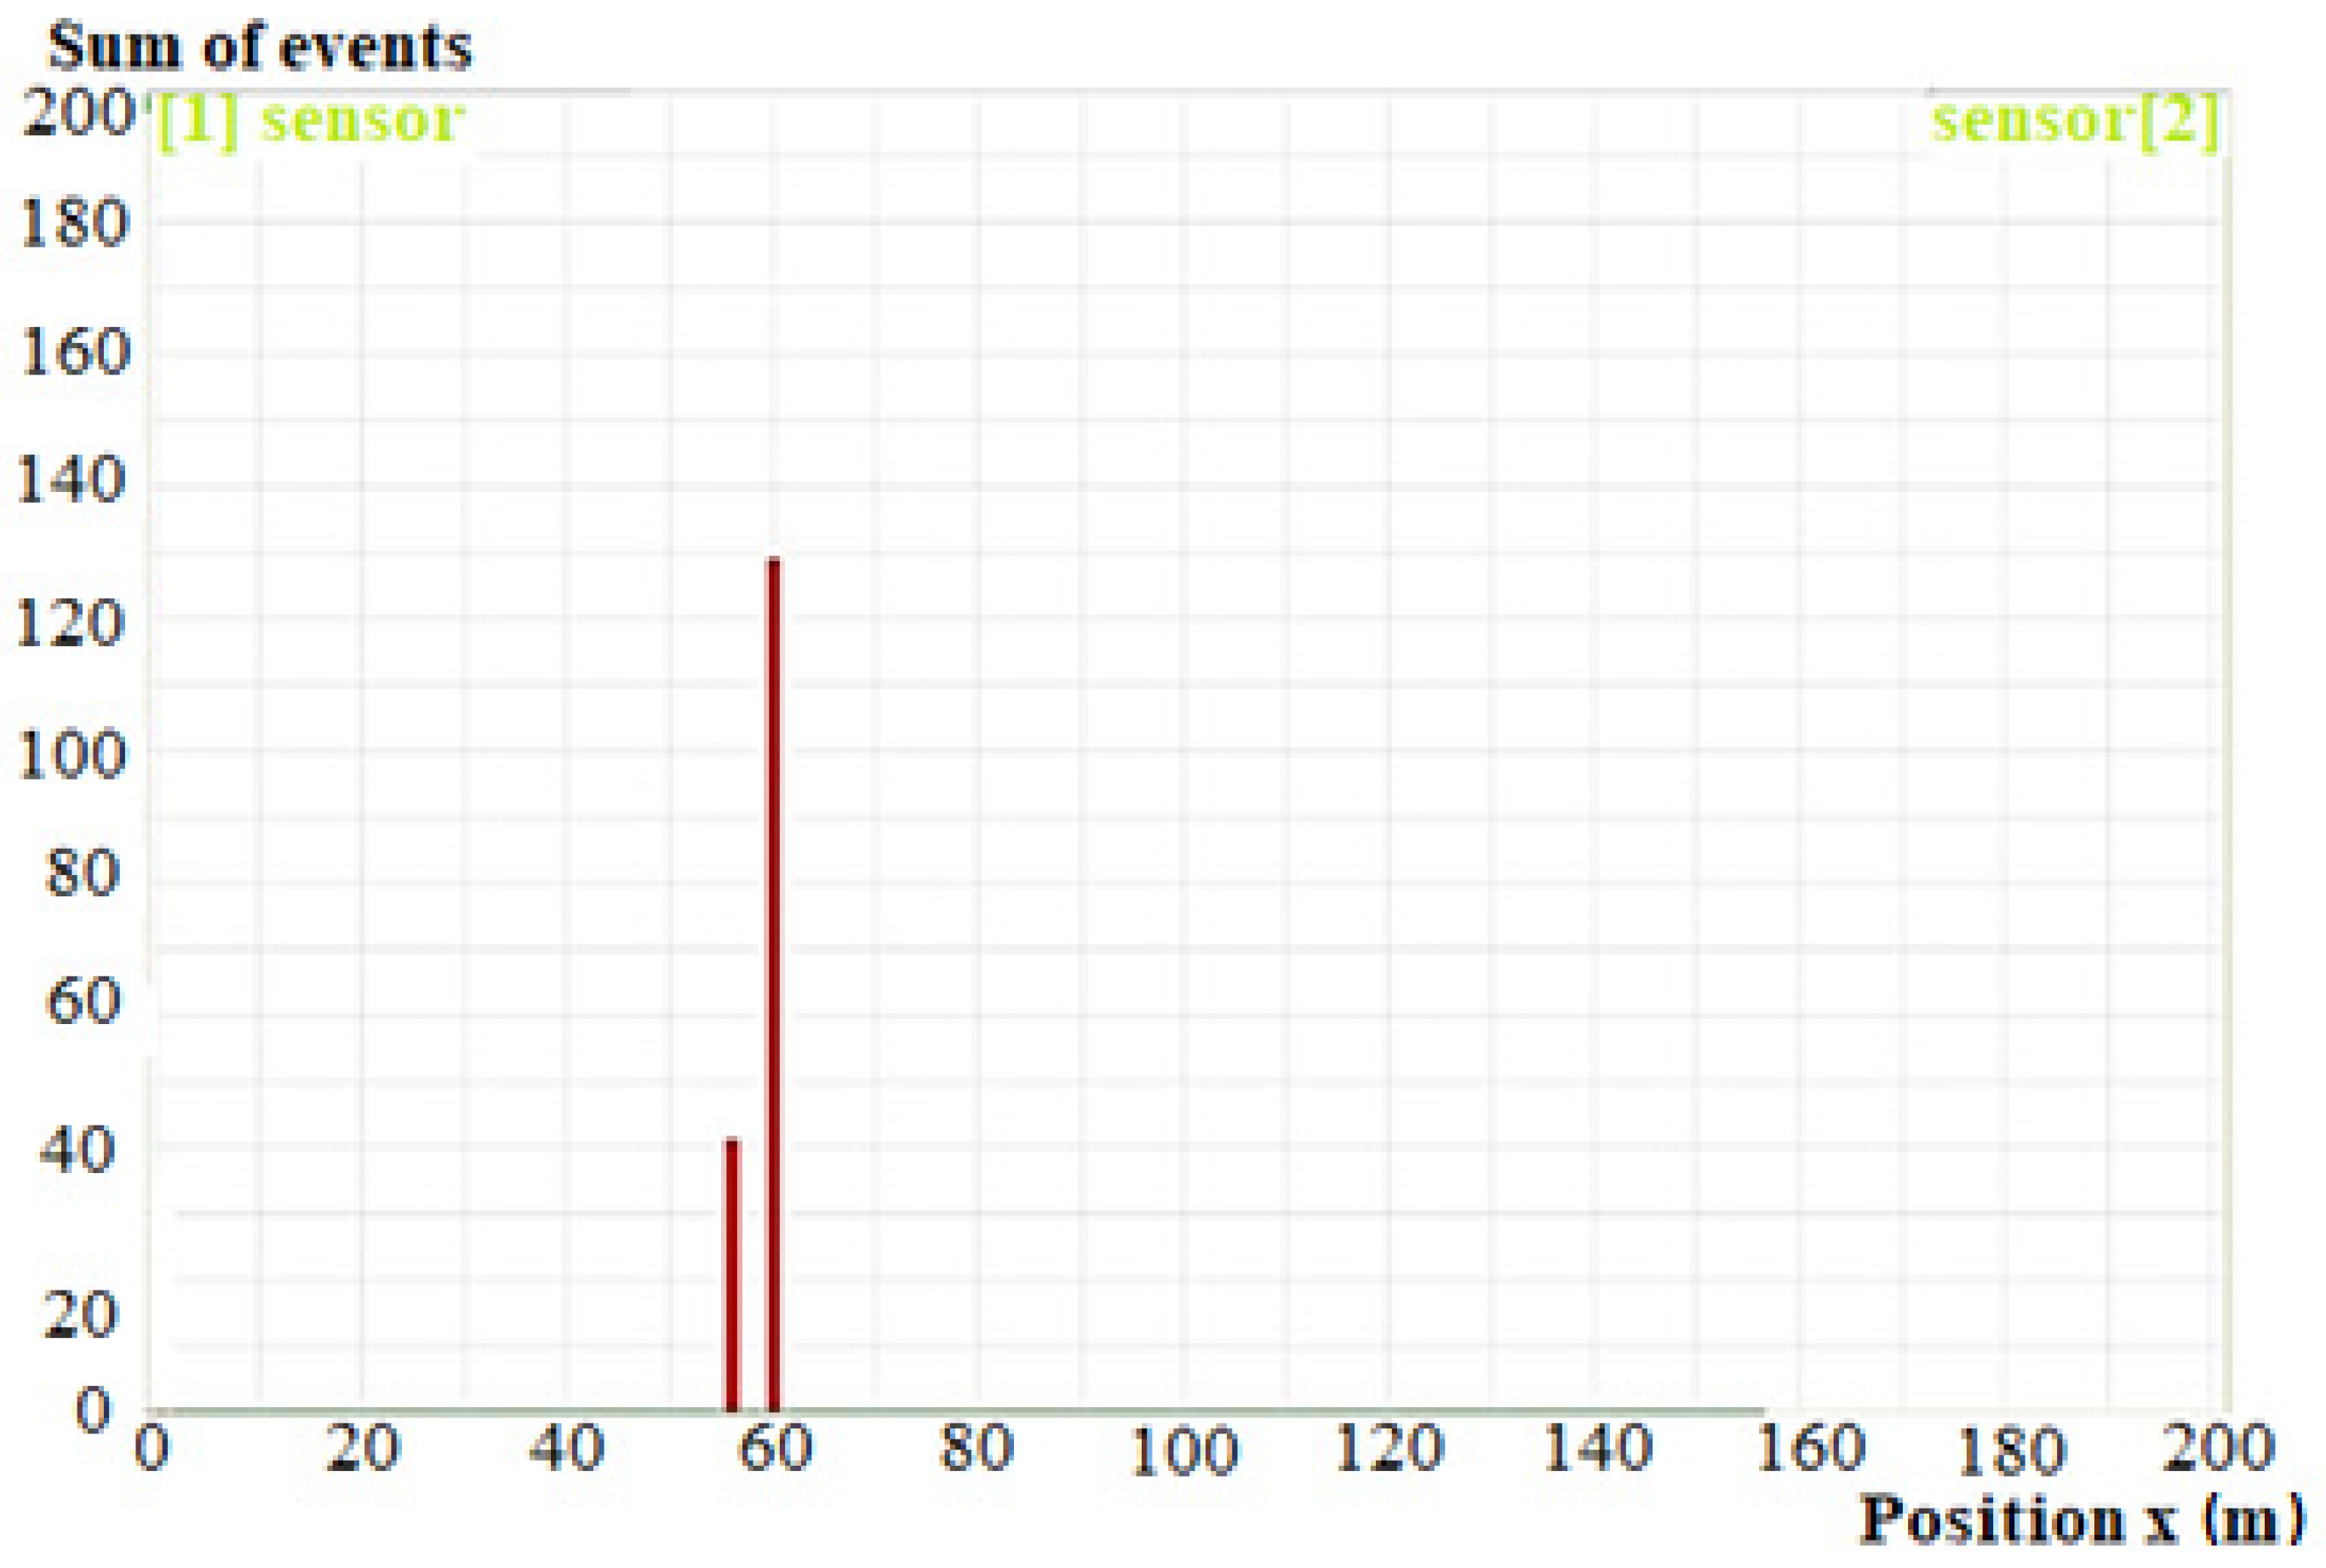
Linear location of destructive process sources shows the area of increased intensity of AE signals extending between 55.79 m and 59.66 m, which corresponds to the pipes laid under the woodland path (Figure 15). Further analysis of destructive process location on the examined section of the pipeline indicated two points, at 57 m and 59.5 m.
Analysis of the amplitude versus time graph for AE signals recorded in the area beyond the indicated points shows that no signals indicating destructive processes were recorded in that area.
3.4. My Thuan Bridge
Examples of localized concrete cracks within compression cables are shown in Figure 16.
Described below are two complete measurement systems being the elements of the condition assessment system that helps decision makers plan maintenance and repairs [30].
The vertical displacement measurement system (Figure 17) measures the condition of and long-term changes in the span, and determines support settlements and their effect on the span vertical alignment. The static measurements are performed every hour or every 30 min, whereas the dynamic measurements are made when the accelerometer reading is higher than the value determined in the design calculations or on demand. The system comprises seven measurement points along the span and, if needed, a hydro profile meter and a hydro level (GEOKON) can be mounted on the pylons and the Global Navigation Satellite System (GNSS) can be used both along the span and on the pylons.
The strain measurement system (Figure 18) measures long-term strain variations in the span and pylons. The sensors are mounted on the rebar, first uncovered and subsequently secured again. The system comprises seven measurement points with two sensors at each point to reduce the risk of error. The location of the measurement points should be established to the accuracy of ±1.0 cm. As the bridge is large, the wind profile and its effective velocity need to be determined.
The angle measurement system measures torsion in the spans generated by all types of loads, span rheology, and workmanship quality. The system comprises seven measurement points located along the span length. At each point, torsion and bending are measured.
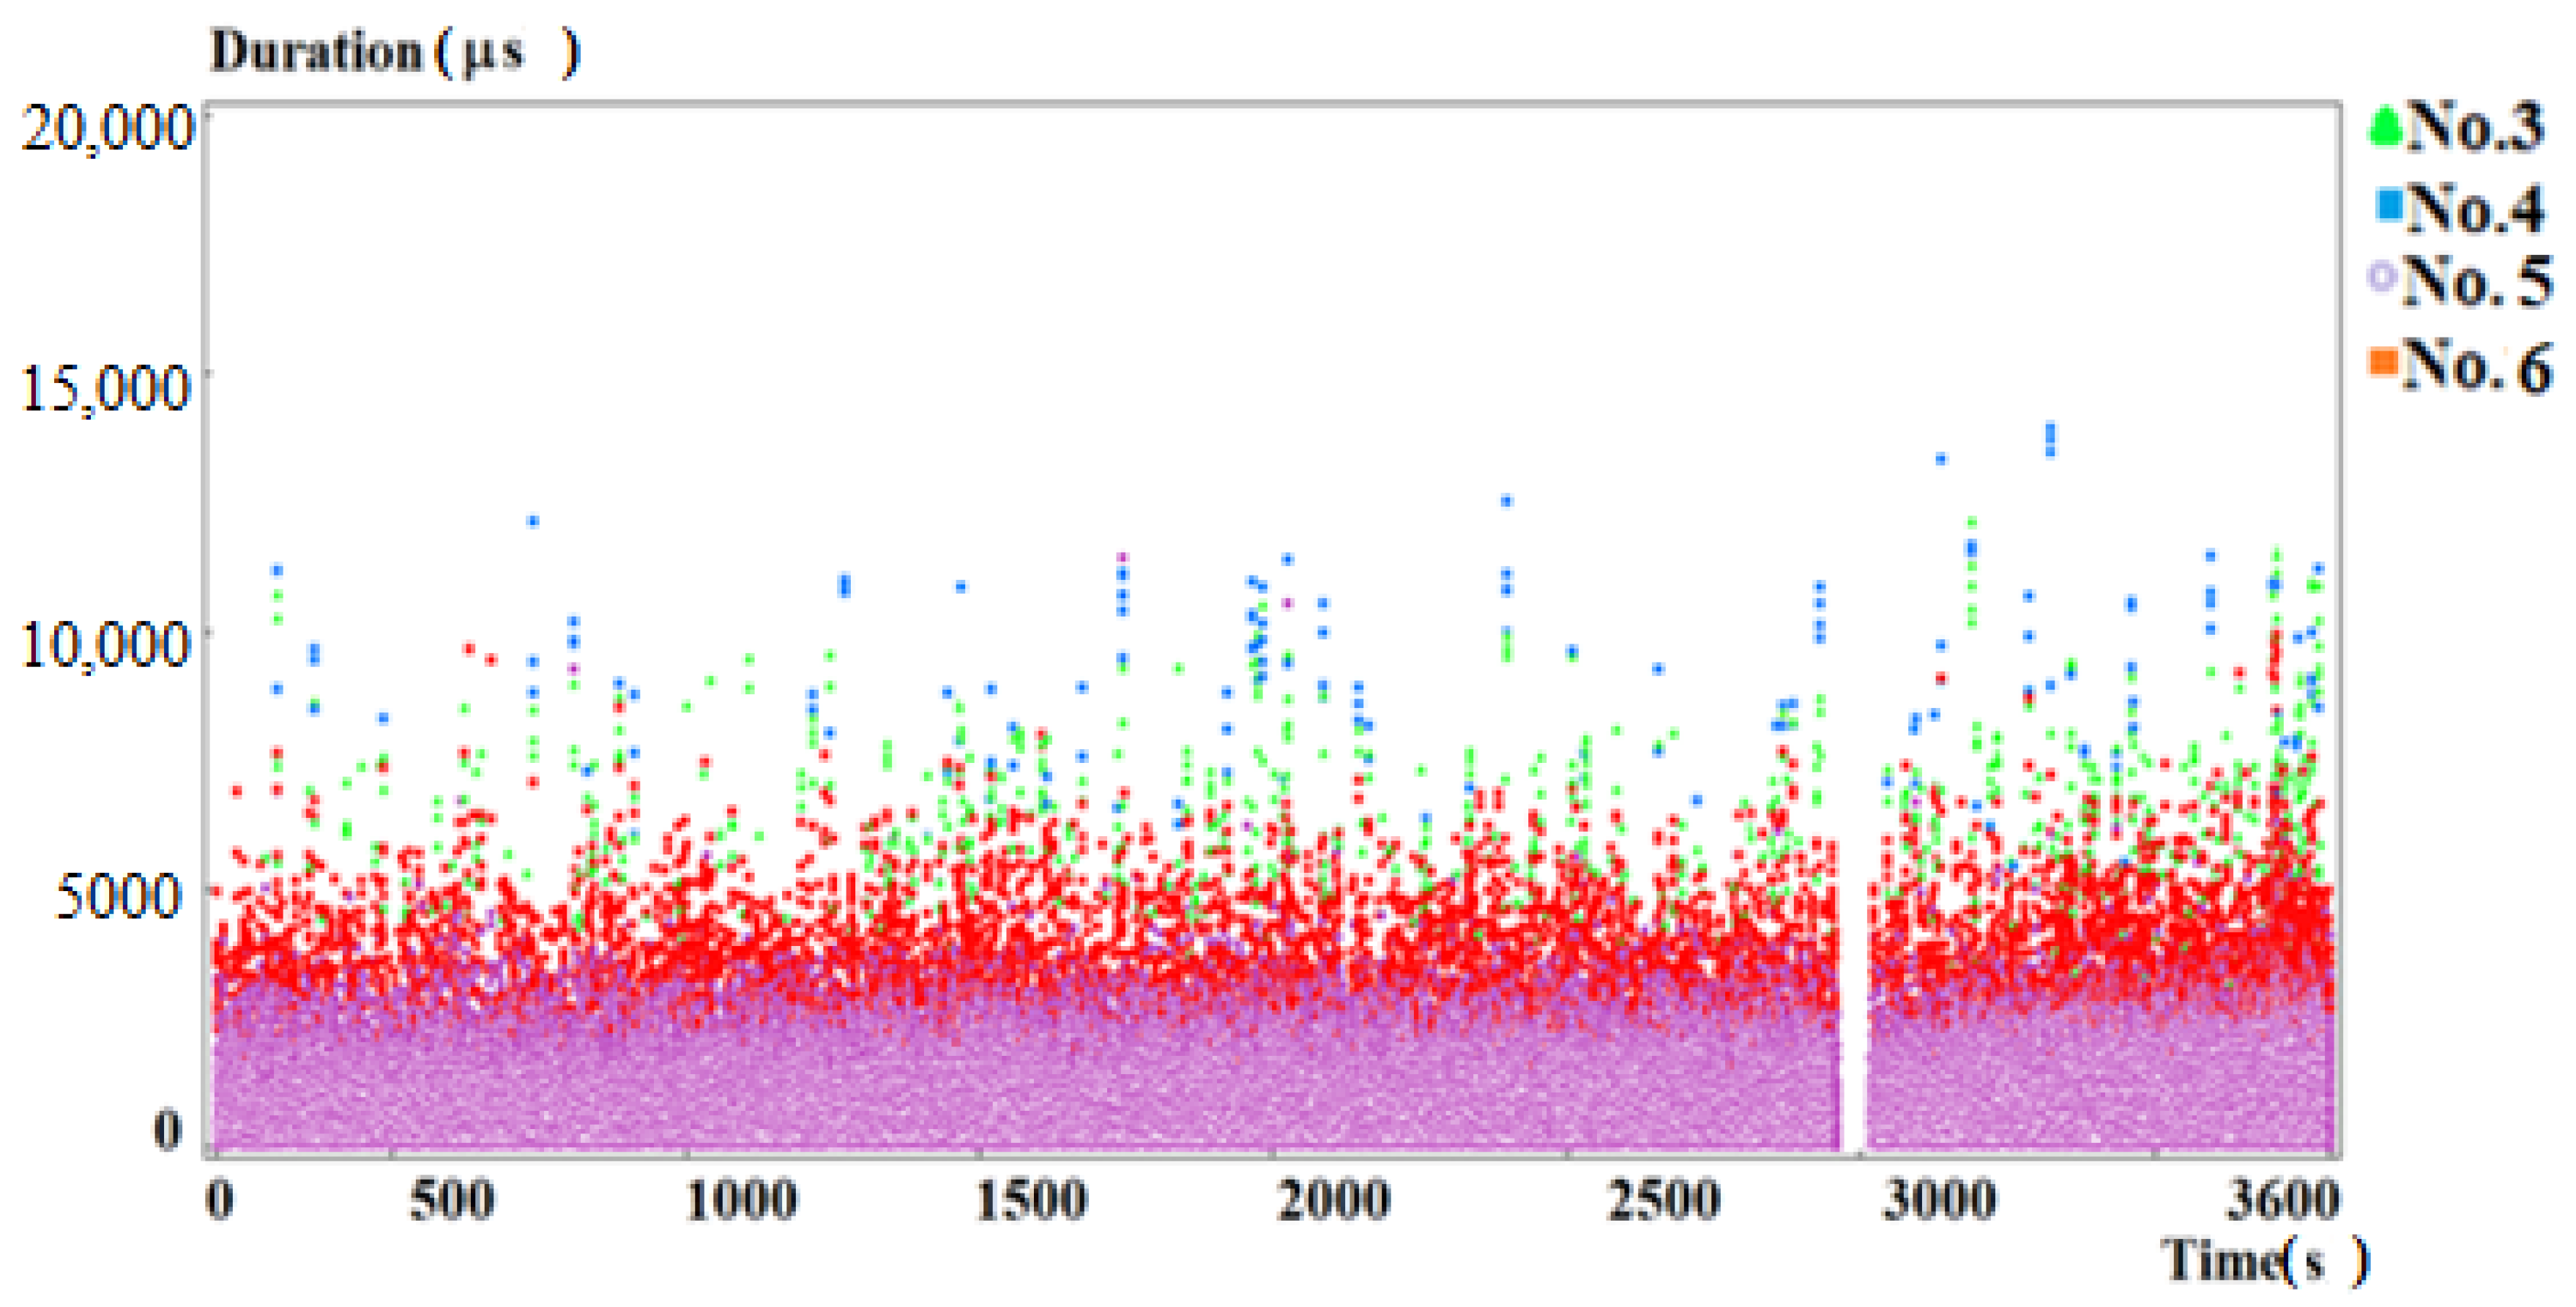
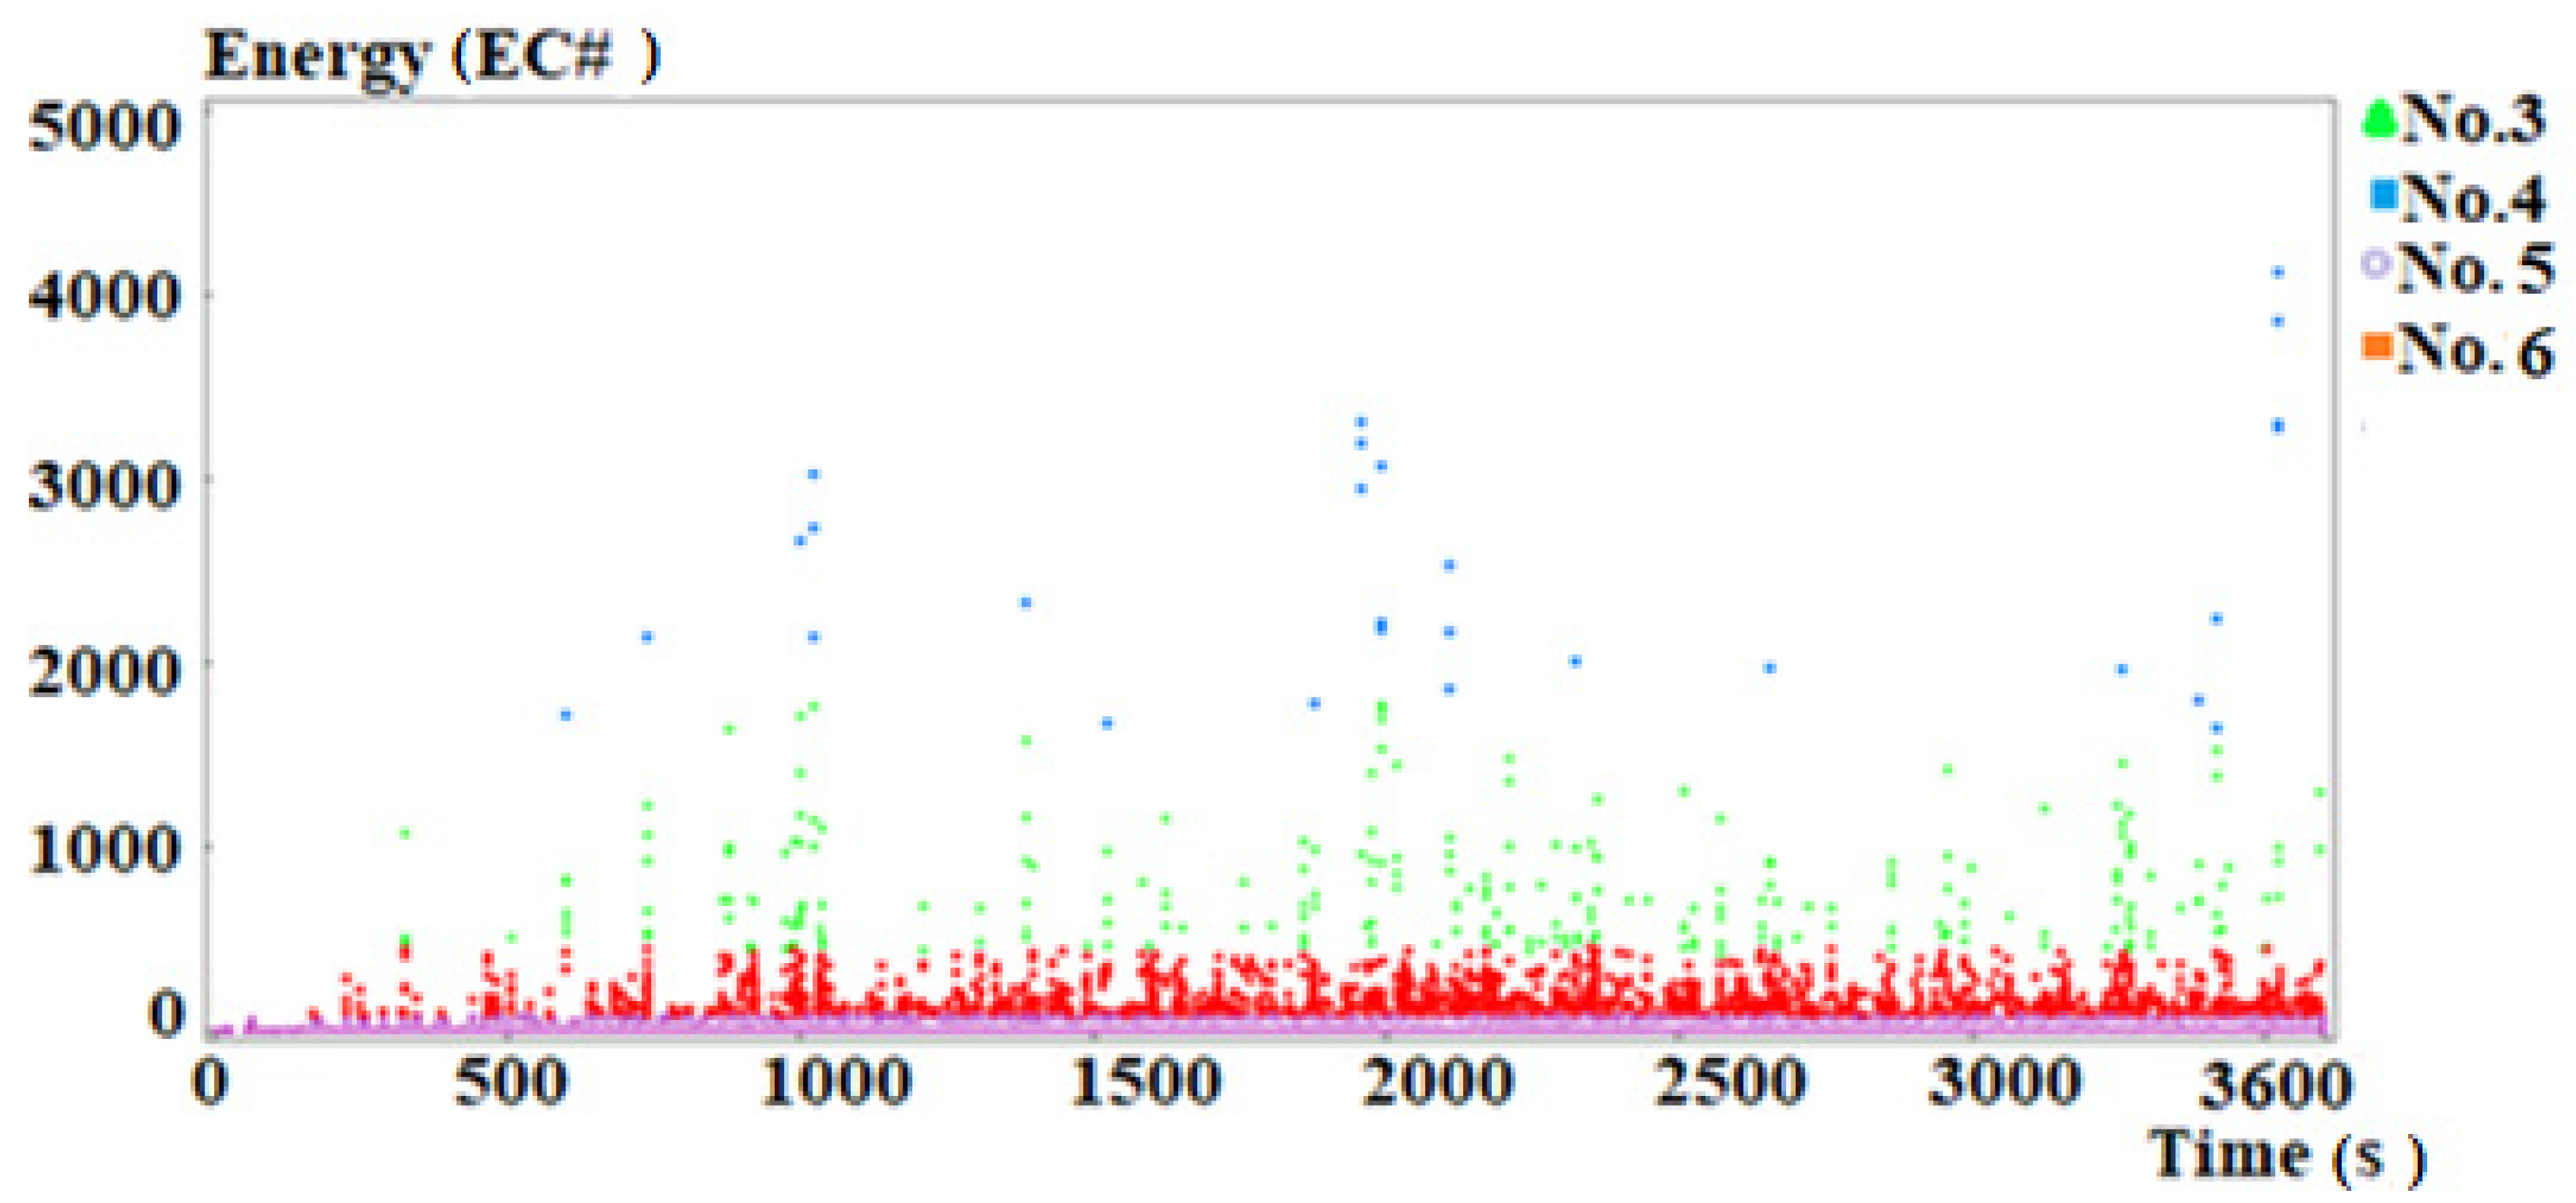
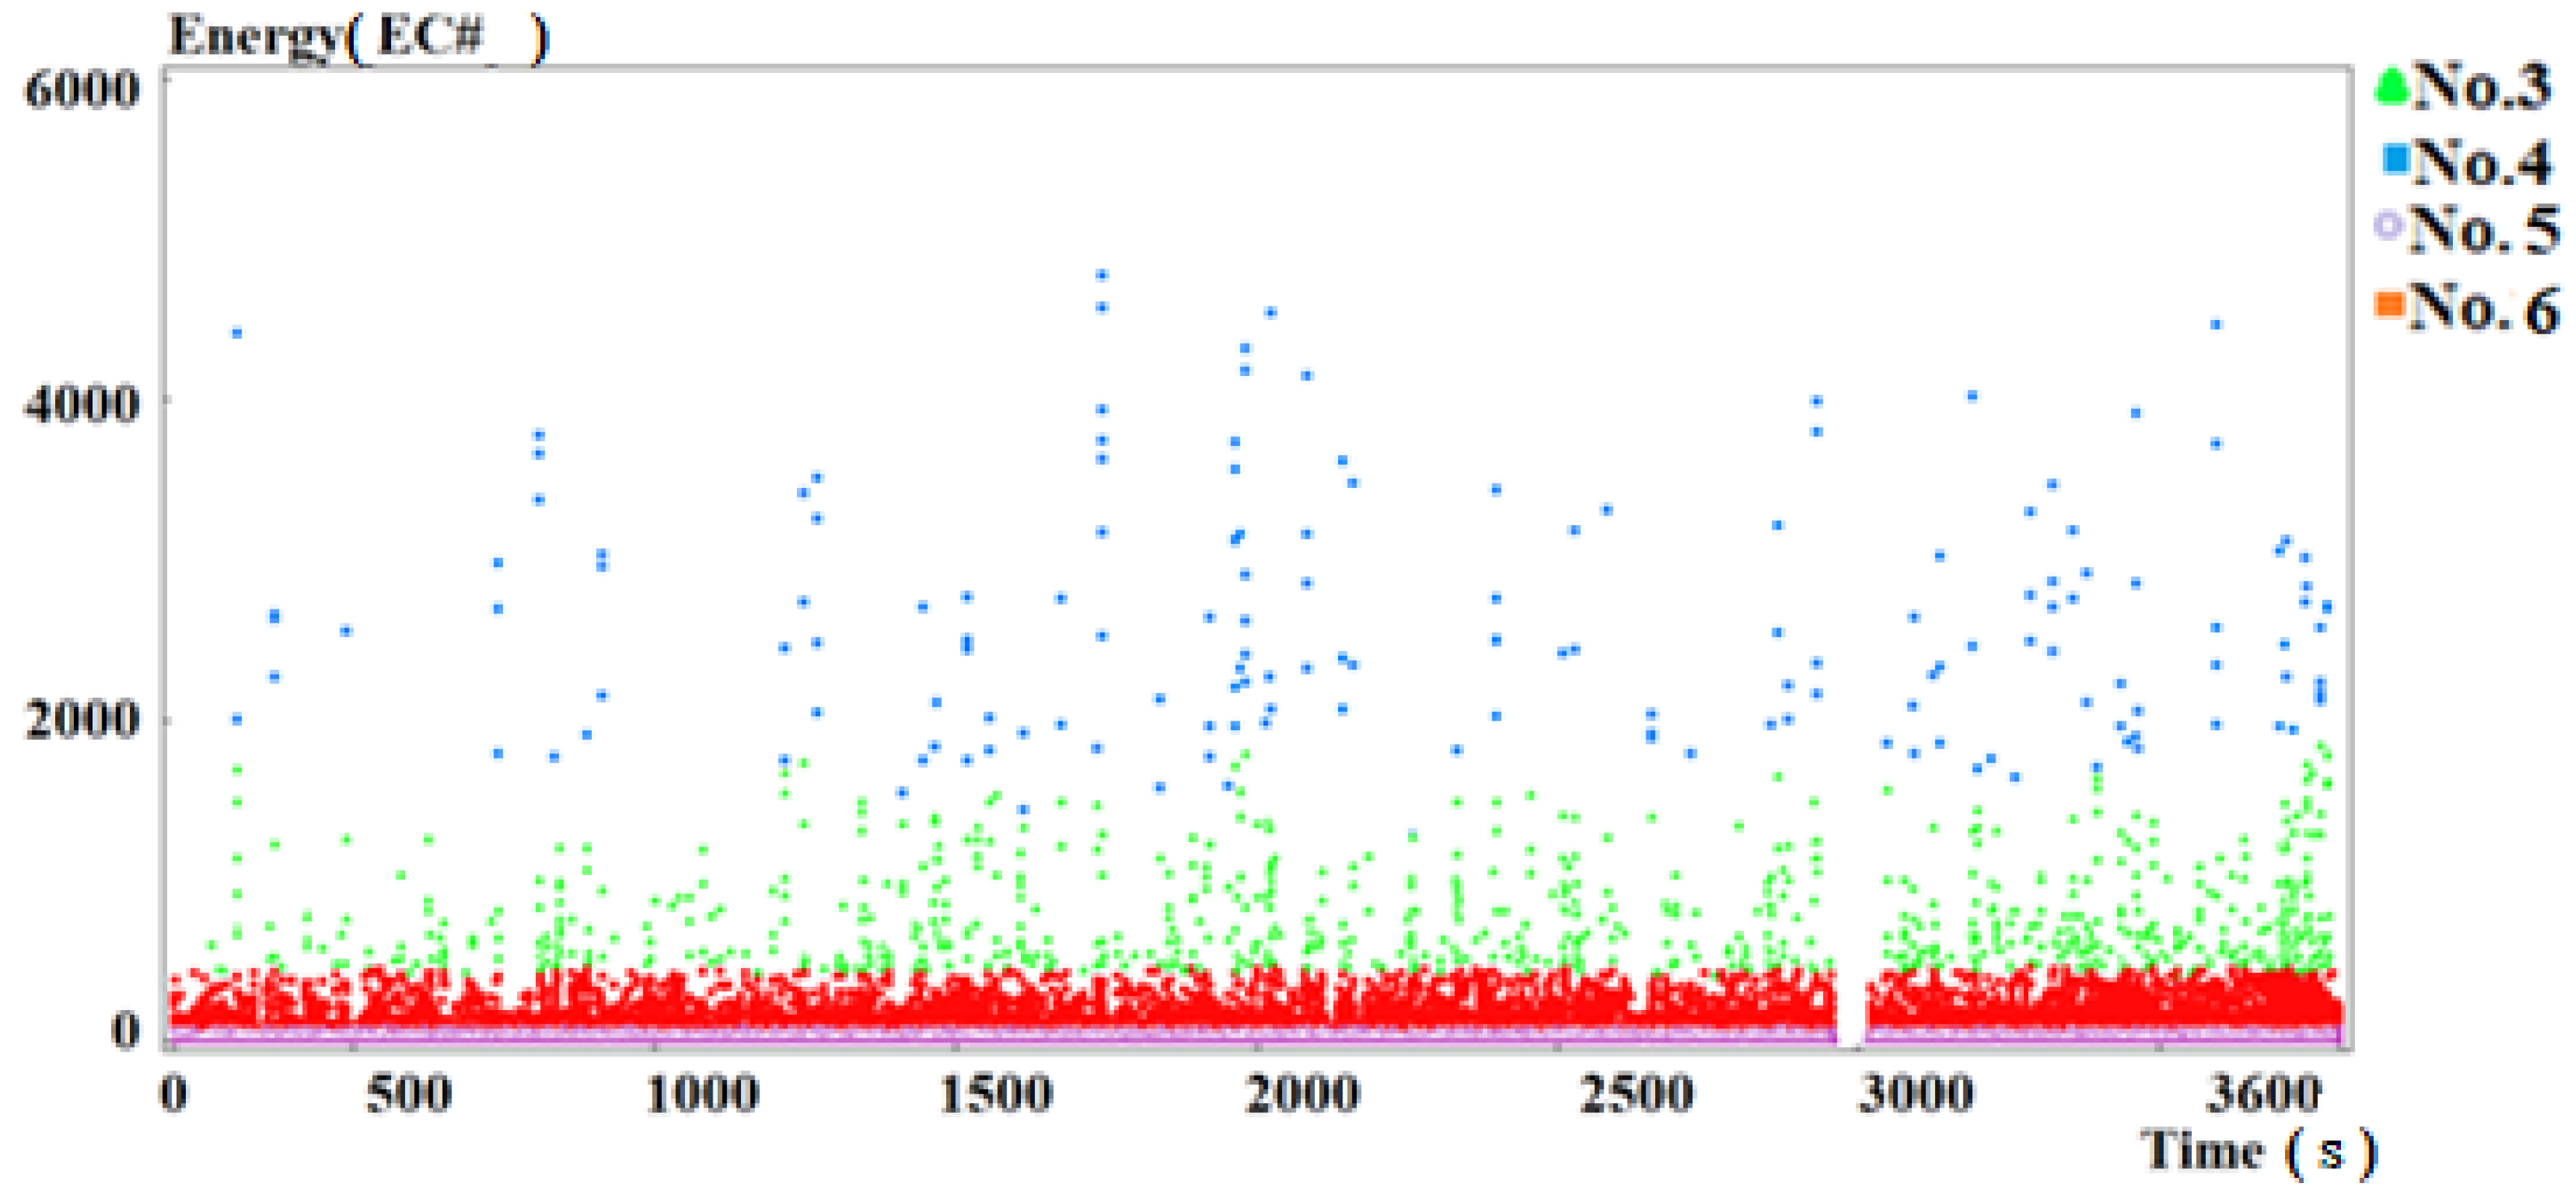
Prior to the design of the indicated system, for a period of 1.5 years, every 6 months AE was measured at selected points, which confirmed the development of microcracks and cracks in the concrete elements. This supported the idea of applying the AE method for monitoring the facility using the proposed prototype. Measurements were carried out in March 2016, October 2016, and March 2017. The measurement in each case lasted an hour and was conducted in the afternoon of the traffic peak. Below are sample graphs of signal energy versus time for each measurement period and one graph showing the duration of signals against time for one measurement period, because it was similar in each research period.
Analysis of the graphs (Figure 19, Figure 20, Figure 21 and Figure 22) indicates that in each case the signal energy is not very high and reaches the values of 5000 ec and 6000 ec in the first and the following two measurement periods, respectively. Also, the values of the signal duration are low and reach a level of approximately 1500 μs in each analyzed period. While analyzing the graphs, it can be also observed that the data indicates generation of Class 3–6 signals (Table 4). The duration of the signals is relatively short—it is assumed that the signals are induced by atmospheric conditions and by vehicle traffic. Further test results are dependent on the implementation of the prototype installation. Currently, the research team is working on creating the reference base.
4. Conclusions
The examples of acoustic emission evaluation of various types of engineering structures and the proposed global monitoring system based on the measurement of acoustic emission signals accompanying destructive processes, covers the entire volume of the element under test or its selected part, and allows locating and identifying active destructive processes and their dynamics in real time. The data collected can be the basis for determining the structural condition of the structure [33,34,35,36,37,38,39].
The system is a useful tool for:
- the assessment of the health of a structure and identification of potential risks;
- the monitoring of the dynamics of destructive processes;
- the support in decision-making process concerning the risk management;
- the assessment of the repair work quality and outcome;
- the assessment of non-standard vehicle traffic.
The findings presented in this article indicate that the use of the acoustic emission method with the systems of the global structural health monitoring ensure insight into the condition of structures.
5. Patents
“The system for detecting and locating active destructive processes in communication road infrastructure structural” Wiesław Trąmpczyński, Grzegorz Świt, Barbara Goszczyńska.
“Method for testing and/or monitoring of destructive processes in steel structures subjected to loads” Leszek Gołaski, Barbara Goszczyńska, Wiesław Trąmpczyński, Grzegorz Świt.
“Method for diagnosis and/or monitoring of technical condition of reinforced concrete and prestressed concrete structures and a system for diagnosing the condition of reinforced concrete and prestressed concrete structures” Wiesław Trąmpczyński, Grzegorz Świt, Leszek Gołaski, Barbara Goszczyńska, Kanji Ono.
Funding
This research received no external funding.
Conflicts of Interest
The author declares no conflict of interest.
References
- Ono, K. Application of Acoustic Emission for Structure Diagnosis. Diagnostics 2011, 2, 3–18. [Google Scholar]
- Marsh, B.K.; Nixon, P.J. Assuring performance of concrete structures through a durability audit. Int. Conf. Concrete in the Service of Mankind. In Appropriate Concrete Technology, Proceedings of the Concrete in the Service of Mankind, Dundee, UK, 24–26 June 1996; CRC Press: Boca Raton, FL, USA, 1996; pp. 49–59. [Google Scholar]
- Guide for Service Life Design of Buildings: Part 1—General Principles; ISO Draft No. 2; International Standard Organization: Geneva, Switzerland, 1995.
- Service Life Design ACI 365 (1R-00); State-of-the-Art-Report; ACI: Farmington Hills, MI, USA, 2000.
- BRITE/EURAM (Basic Research in Industrial Technologies/European Research in Advanced Materials) Program; DuraCrete 1996–99, DuraNet 1998–01, Darts 1997–2004.
- Niraki, T. Service life design. Constr. Build. Mater. 1996, 10, 403–406. [Google Scholar] [CrossRef]
- Houston, J.T.; Atimtay, E.; Ferguson, P.M. Corrosion of Reinforcing Steel Embedded in Structural Concrete; Research Report 112-1F; Center for Highway Research: Austin, TX, USA, 1972. [Google Scholar]
- Yuyama, S.; Okamoto, T.; Shigeiski, M.; Ohtsu, M.; Kishi, T. A Proposed Standard for Evaluating Integrity of Reinforced Concrete Beams by Acoustic Emission: Standard and Technology Update; American Society for Testing and Matrials: West Conshohocken, PA, USA, 1999. [Google Scholar]
- Lawson, R.M. Sustainability of Steel in Housing and Residential Buildings (P370); The Steel Construction Institute: Ascot, UK, 2007. [Google Scholar]
- Lawson, R.M.; Francis, K. Energy Efficient Housing Using Light Steel Framing (P367); The Steel Construction Institute: Ascot, UK, 2007. [Google Scholar]
- Lu, Y.; Michael, J. A methodology for structural health monitoring with diffuse ultrasonic waves in the presence of temperature variations. Ultrasonics 2005, 43, 717–731. [Google Scholar] [CrossRef] [PubMed]
- Su, Z.; Ye, L.; Lu, Y. Guided Lamb waves for identification of damage in composite structures: A review. J. Sound Vib. 2006, 295, 753–780. [Google Scholar] [CrossRef]
- Ebrahimkhanlou, A.; Salamone, S. Single-Sensor Acoustic Emission Source Localization in Plate-Like Structures Using Deep Learning. Aerospace 2018, 5, 50. [Google Scholar] [CrossRef]
- Ebrahimkhanlou, A.; Salamone, S. A probabilistic framework for single-sensor acoustic emission source localization in thin metallic plates. Smart Mater. Struct. 2017, 26, 095026. [Google Scholar] [CrossRef]
- Ebrahimkhanlou, A.; Salamone, S. Acoustic emission source localization in thin metallic plates: A single-sensor approach based on multimodal edge reflections. Ultrasonics 2017, 78, 134–145. [Google Scholar] [CrossRef] [PubMed] [Green Version]
- Carpinteri, A.; Lacidogna, G.; Puzzi, S. From criticality to final collapse: Evolution of the ‘‘b-value” from 1.5 to 1.0. Chaos Solitons Fractals 2009, 4, 843–853. [Google Scholar] [CrossRef]
- Carpinteri, A.; Corrado, M.; Lacidogna, G. Three different approaches for damage domain characterization in disordered materials: Fractal energy density, b-value statistics, renormalization group theory. Mech. Mater. 2012, 53, 15–28. [Google Scholar] [CrossRef]
- Balageas, J.; Fritzen, C.; Guemes, A. Structural Health Monitoring Systems; ISTE: Washington, DC, USA, 2006. [Google Scholar]
- Adams, D. Health Monitoring of Structural Materials and Components; Wiley: New York, NY, USA, 2007. [Google Scholar]
- Swamy, R.N. Durability of Rebars in Concrete. Spec. Publ. 1992, 131, 67–98. [Google Scholar]
- Vennesland, O.; Gjorv, O.E. Effect of Cracks in Submerged Concrete Sea Structures on Steel Corrosion. Mater. Perform. 1981, 20, 49–51. [Google Scholar]
- Alampalli, S.; Ettouney, M. Results of workshop on structural health monitoring in bridge security. In Proceedings of the 3rd International Conference on Structural Health Monitoring of Intelligent Infrastructure, Vancouver, BC, Canada, 14–16 November 2007; pp. 13–16. [Google Scholar]
- Inaudi, D. Structural Health Monitoring of bridges: General Issues and Applications. Struct. Health Monitor. Civ. Infrastruct. Syst. 2009, 339–370. [Google Scholar]
- Zhou, H.F.; Ni, Y.Q.; Ko, J.M. Structural Damage Alarming Using Auto-Associative Neural Network Technique: Exploration of Environment-Tolerant Capacity and Setup of Alarming Threshold. Mech. Syst. Signal Process. 2011, 25, 1508–1526. [Google Scholar] [CrossRef]
- Olaszek, P.; Świt, G.; Casas, J.R. On-site assessment of bridges supported by acoustic emission. Proc. Inst. Civ. Eng. Bridge Eng. 2016, 169, 81–92. [Google Scholar] [CrossRef]
- Świt, G.; Adamczak, A.; Krampikowska, A. Wavelet Analysis of Acoustic Emissions during Tensile Test of Carbon Fibre Reinforced Polymer Composites. IOP Conf. Ser. Mater. Sci. Eng. 2017, 245. [Google Scholar] [CrossRef]
- Świt, G.; Adamczak, A.; Krampikowska, A. Time-frequency analysis of acoustic emission signals generated by the Glass Fibre Reinforced Polymer Composites during the tensile test. IOP Conf. Ser. Mater. Sci. Eng. 2017, 251, 1–8. [Google Scholar] [CrossRef]
- Goszczyńska, B.; Świt, G.; Trąmpczyński, W.; Krampikowska, A. Application of the Acoustic Emission Method of identification and location of destructive processes to the monitoring concrete bridges. In Proceedings of the 7th International Conference on Bridge Maintenance, Safety and Management (IABMAS), Shanghai, China, 7–11 July 2014; pp. 688–694. [Google Scholar]
- Świt, G.; Krampikowska, A. Influence of the Number of Acoustic Emission Descriptors on the Accuracy of Destructive Process Identification in Concrete Structures. In Proceedings of the 2016 Prognostics and System Health Management Conference, Chengdu, China, 19–21 October 2016; pp. 6–11. [Google Scholar]
- Świt, G.; Krampikowska, A.; Chinh, L.M. A Prototype System for Acoustic Emission-Based Structural Health Monitoring of My Thuan Bridge. In Proceedings of the 2016 Prognostics and System Health Management Conference, Chengdu, China, 19–21 October 2016; pp. 624–630. [Google Scholar]
- Chinh, L.M.; Adamczak, A.; Krampikowska, A.; Świt, G. Dragon bridge—The world largest dragon-shaped (ARCH) steel bridge as element of smart city. In Proceedings of the International Conference on the Sustainable Energy and Environment Development (SEED 2016), Krakow, Poland, 17–19 May 2016; Volume 10, pp. 1–5. [Google Scholar]
- Świt, G.; Krampikowska, A.; Chinh, L.M.; Adamczak, A. Nhat Tan Bridge—THE Biggest Cable-Stayed Bridge in Vietnam. Procedia Eng. 2016, 161, 666–673. [Google Scholar] [CrossRef]
- Olaszek, P.; Świt, G.; Casas, J.R. Proof load testing supported by acoustic emission. An example of application. In Bridge Maintenance, Safety, Management and Life-Cycle Optimization, Proceedings of the Fifth International IABMAS Conference, Philadelphia, PA, USA, 11–15 July 2010; CRC Press: Boca Raton, FL, USA, 2010; pp. 472–479. [Google Scholar]
- Deraemaeker, A.; Reynders, E.; De Roeck, G.; Kullaa, J. Vibration—Based structural health monitoring using output-only measurements under changing environment. Mech. Syst. Signal Process. 2008, 22, 34–56. [Google Scholar] [CrossRef]
- Wong, K.Y. Design of a Structural Health Monitoring System for Long-Span Bridges. Struct. Infrastruct. Eng. 2007, 3, 169–185. [Google Scholar] [CrossRef]
- Catbas, F.N. Structural Health Monitoring: Applications and Data Analysis. In Structural Health Monitoring of Civil Infrastructure Systems; Woodhead Publishing: Cambridge, UK, 2009. [Google Scholar]
- Goszczyńska, B.; Świt, G.; Trąmpczyński, W. Application of the IADP acoustic emission method to automatic control of traffic on reinforced concrete bridges to ensure their safe operation. Arch. Civ. Mech. Eng. 2016, 16, 867–875. [Google Scholar] [CrossRef]
- Świt, G. Evaluation of compliance changes in concrete beams reinforced by glass fiber reinforced plastics using acoustic emission. J. Mater. Civ. Eng. 2004, 16, 414–418. [Google Scholar] [CrossRef]
- Goszczyńska, B.; Świt, G.; Trąmpczyński, W. Analysis of the microcracking process with the Acoustic Emission method with respect to the service life of reinforced concrete structures with the example of the RC beams. Bull. Pol. Acad. Sci. Tech. Sci. 2015, 63, 55–65. [Google Scholar] [CrossRef]
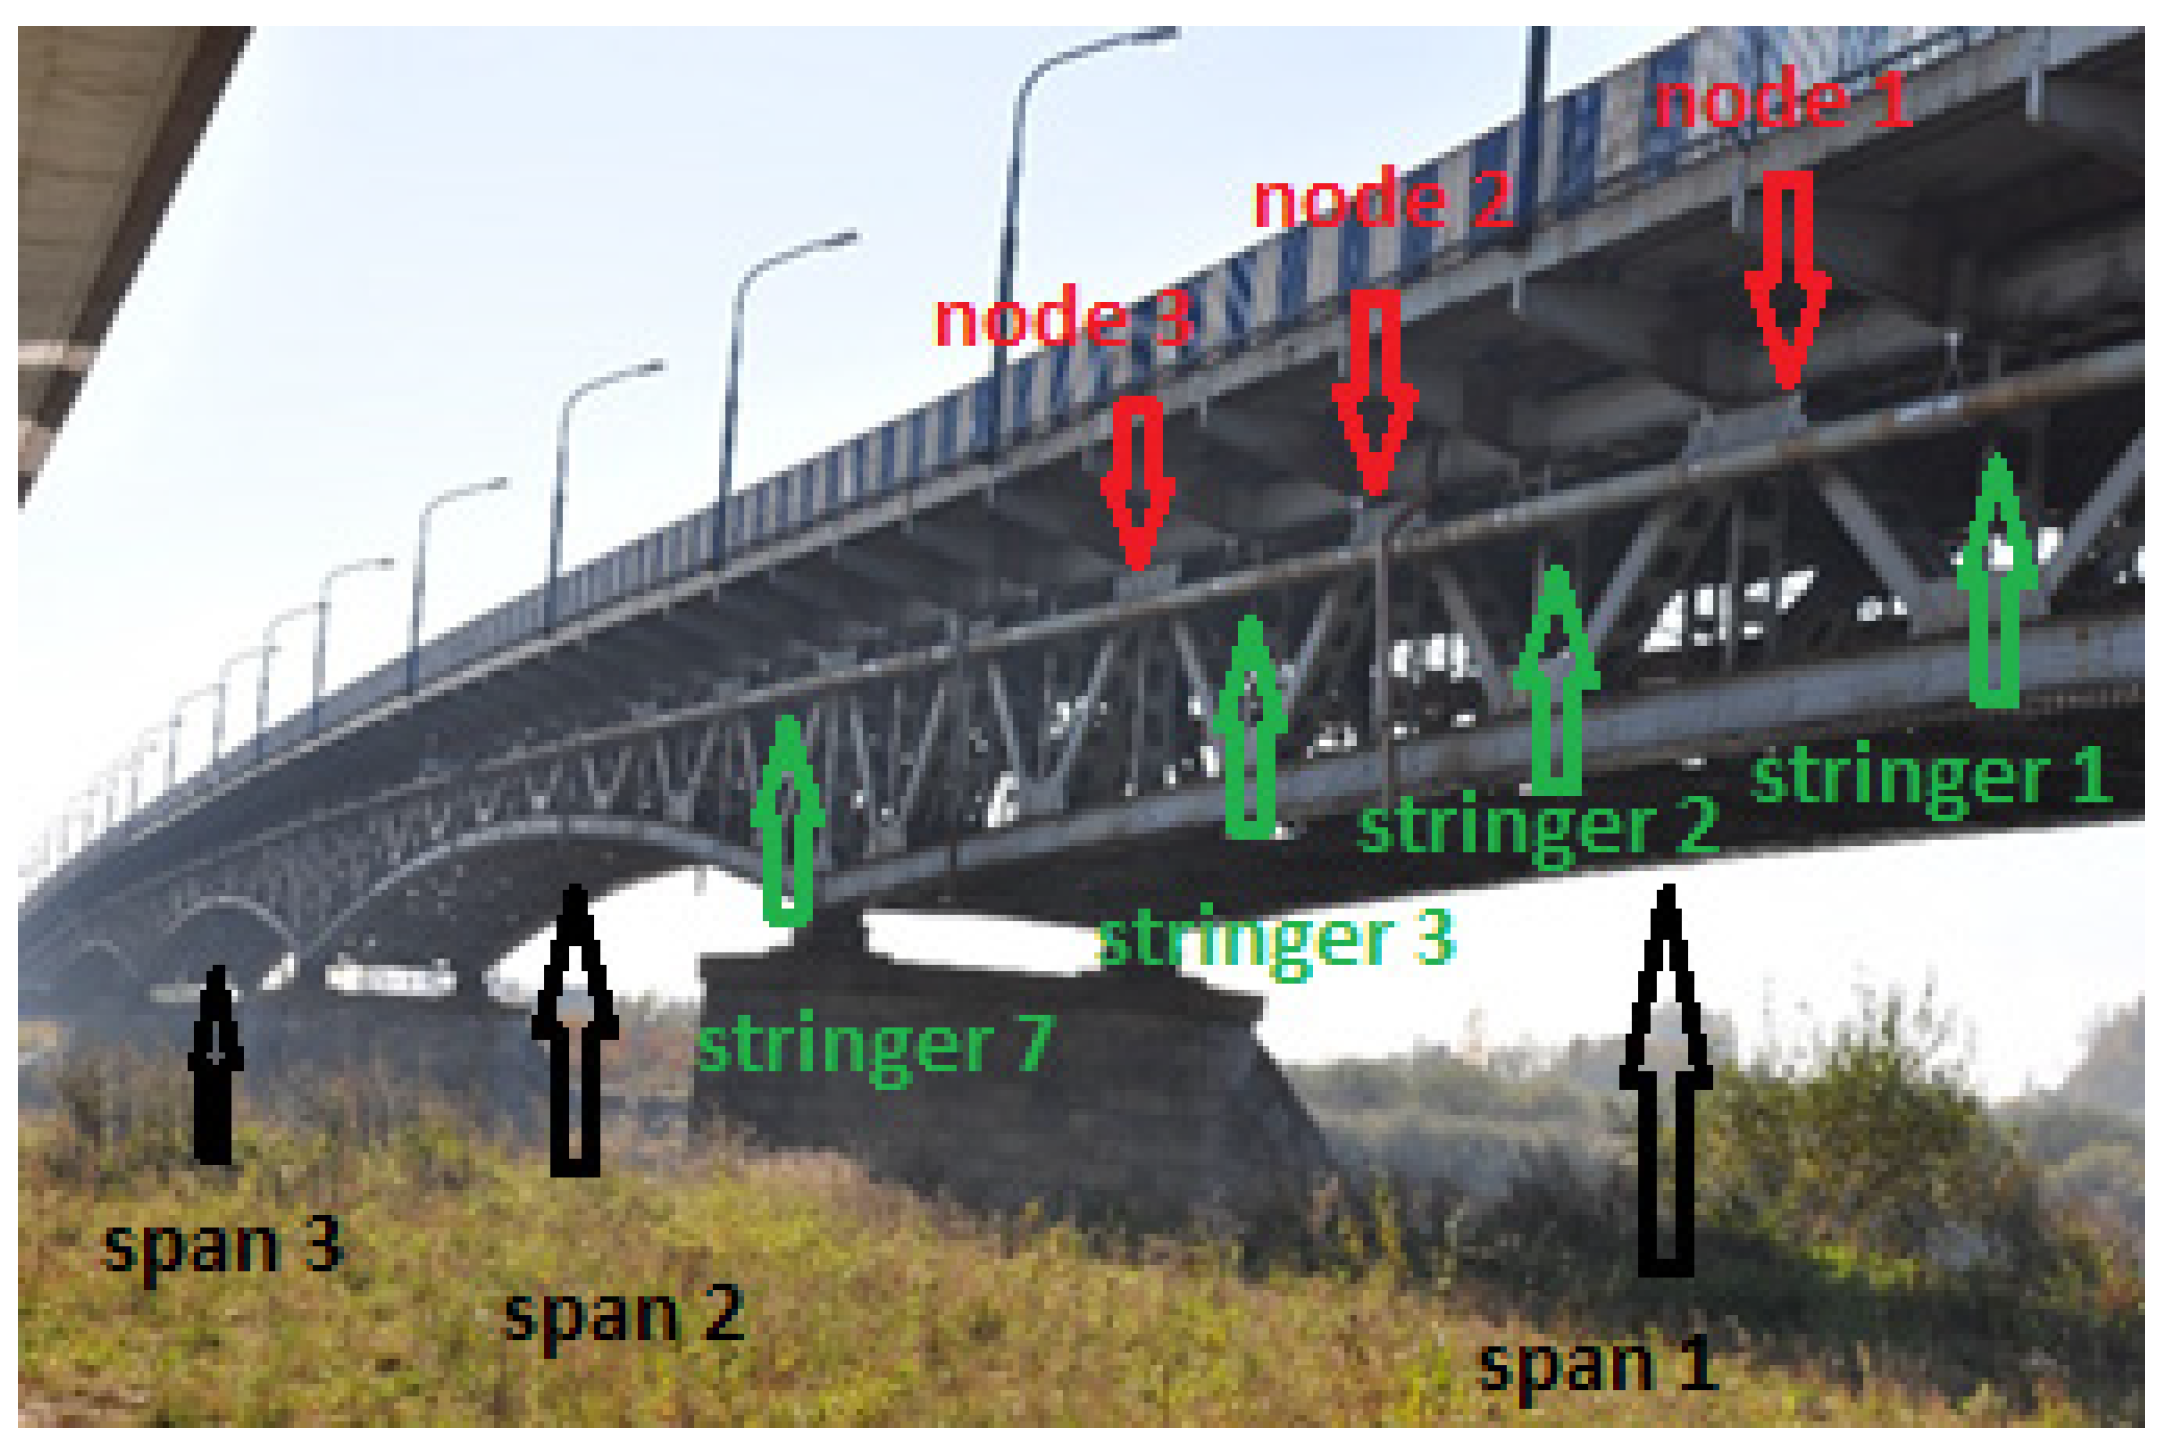
Figure 1.
Side view of three bridge spans subjected to tests.
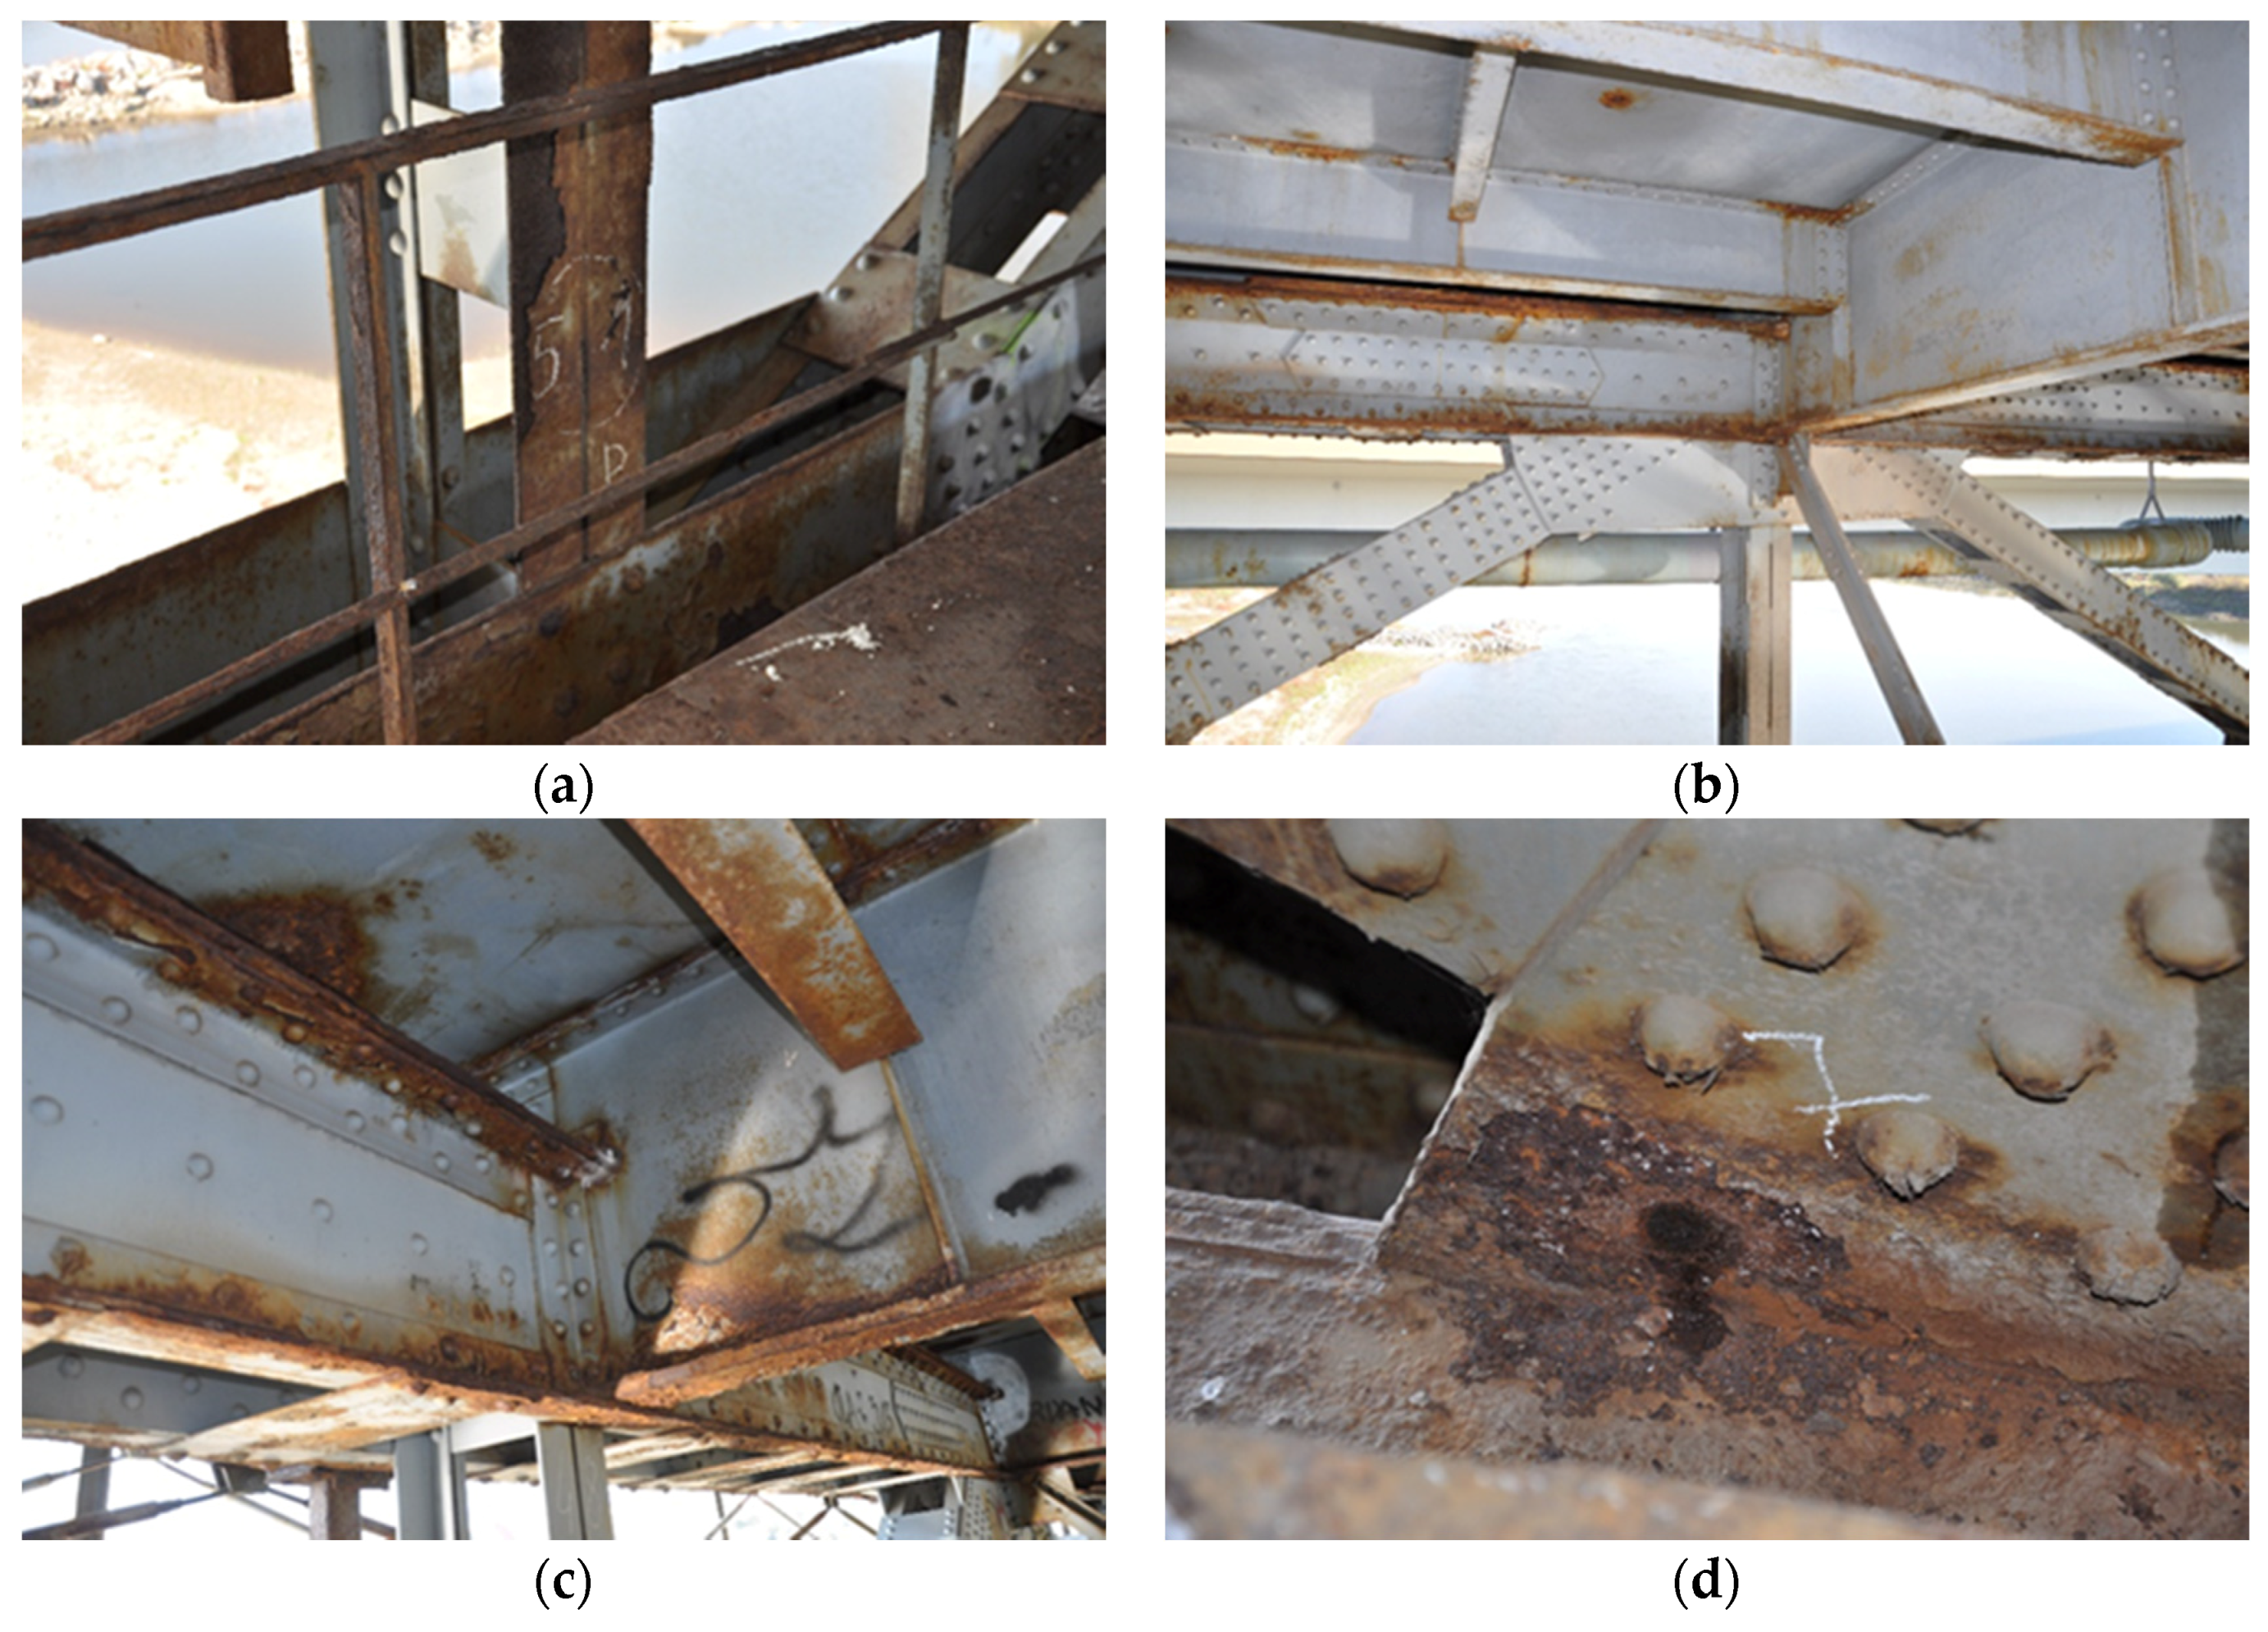
Figure 2.
(a) View of the connection between the truss lower chord with the diagonals and the vertical member, with visible advanced surface corrosion. (b) View from the inside to the top node, visible surface corrosion of structural elements of the truss, as well as corrosion at the joints at the contact surface of connected profiles. (c) View from the inside—the upper node, visible surface and pitting corrosion on the stringers, crossbars, and orthotropic slabs. (d) View of the node with signs of pitting and surface corrosion on steel plate and rivets.

Figure 3.
(a) View of column 1 with a safety platform. (b) View of anchor block and flanges at the connection between column 1 and foundation; signs of surface corrosion and pitting.
Figure 3.
(a) View of column 1 with a safety platform. (b) View of anchor block and flanges at the connection between column 1 and foundation; signs of surface corrosion and pitting.
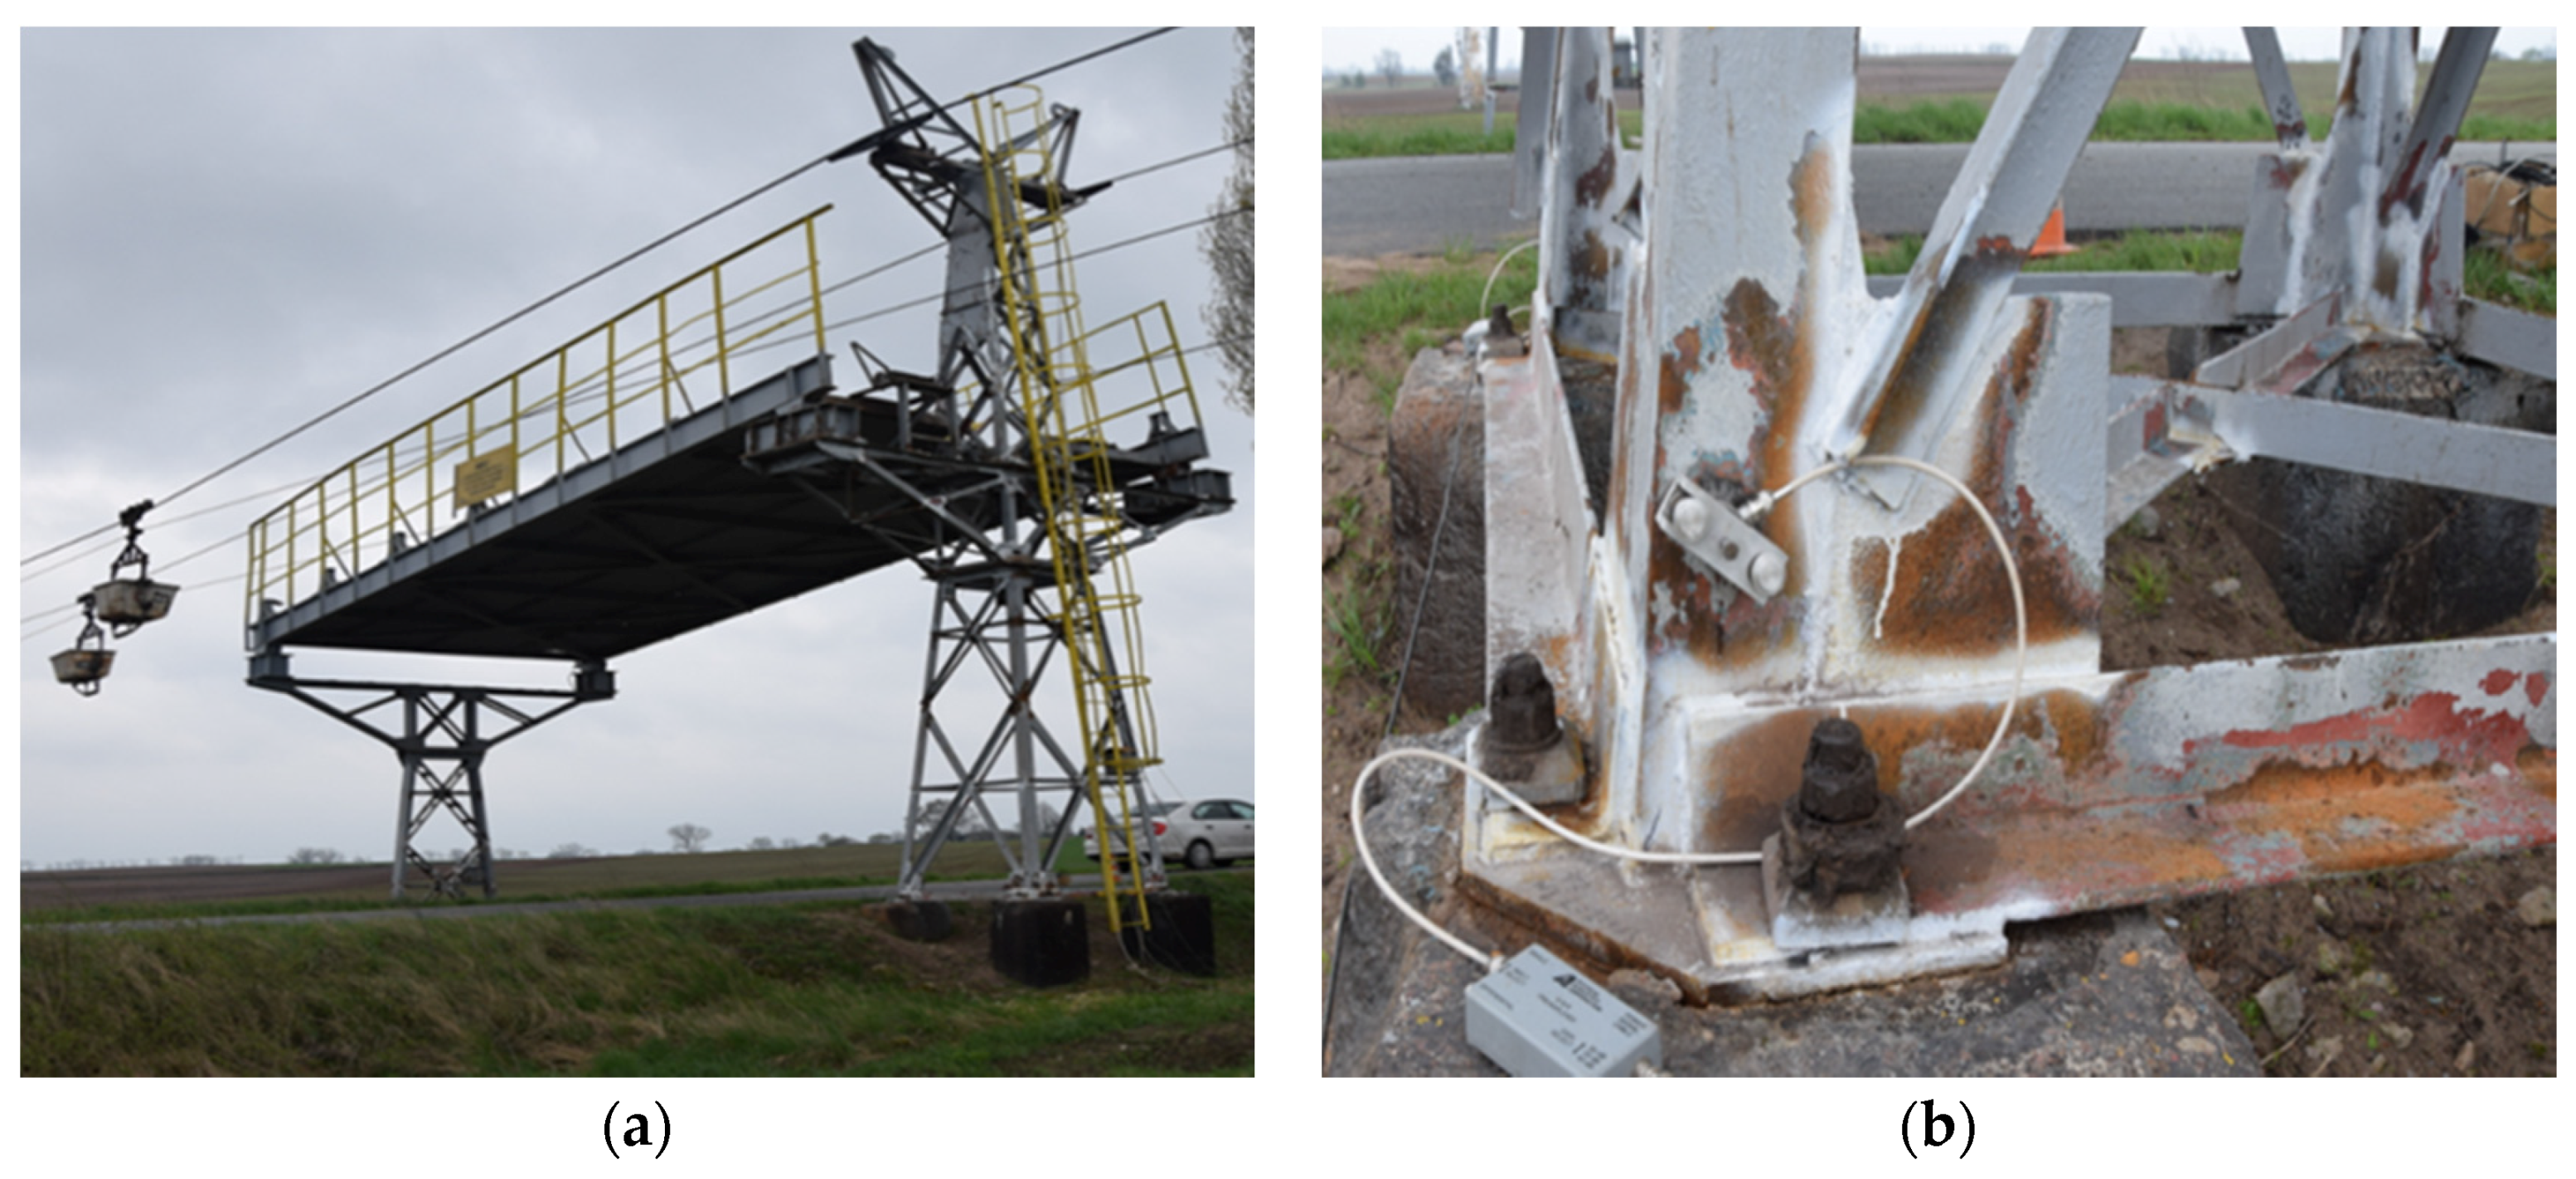
Figure 4.
(a) Side view of column 2. (b) External view of the upper chord; signs of surface corrosion on truss members.
Figure 4.
(a) Side view of column 2. (b) External view of the upper chord; signs of surface corrosion on truss members.
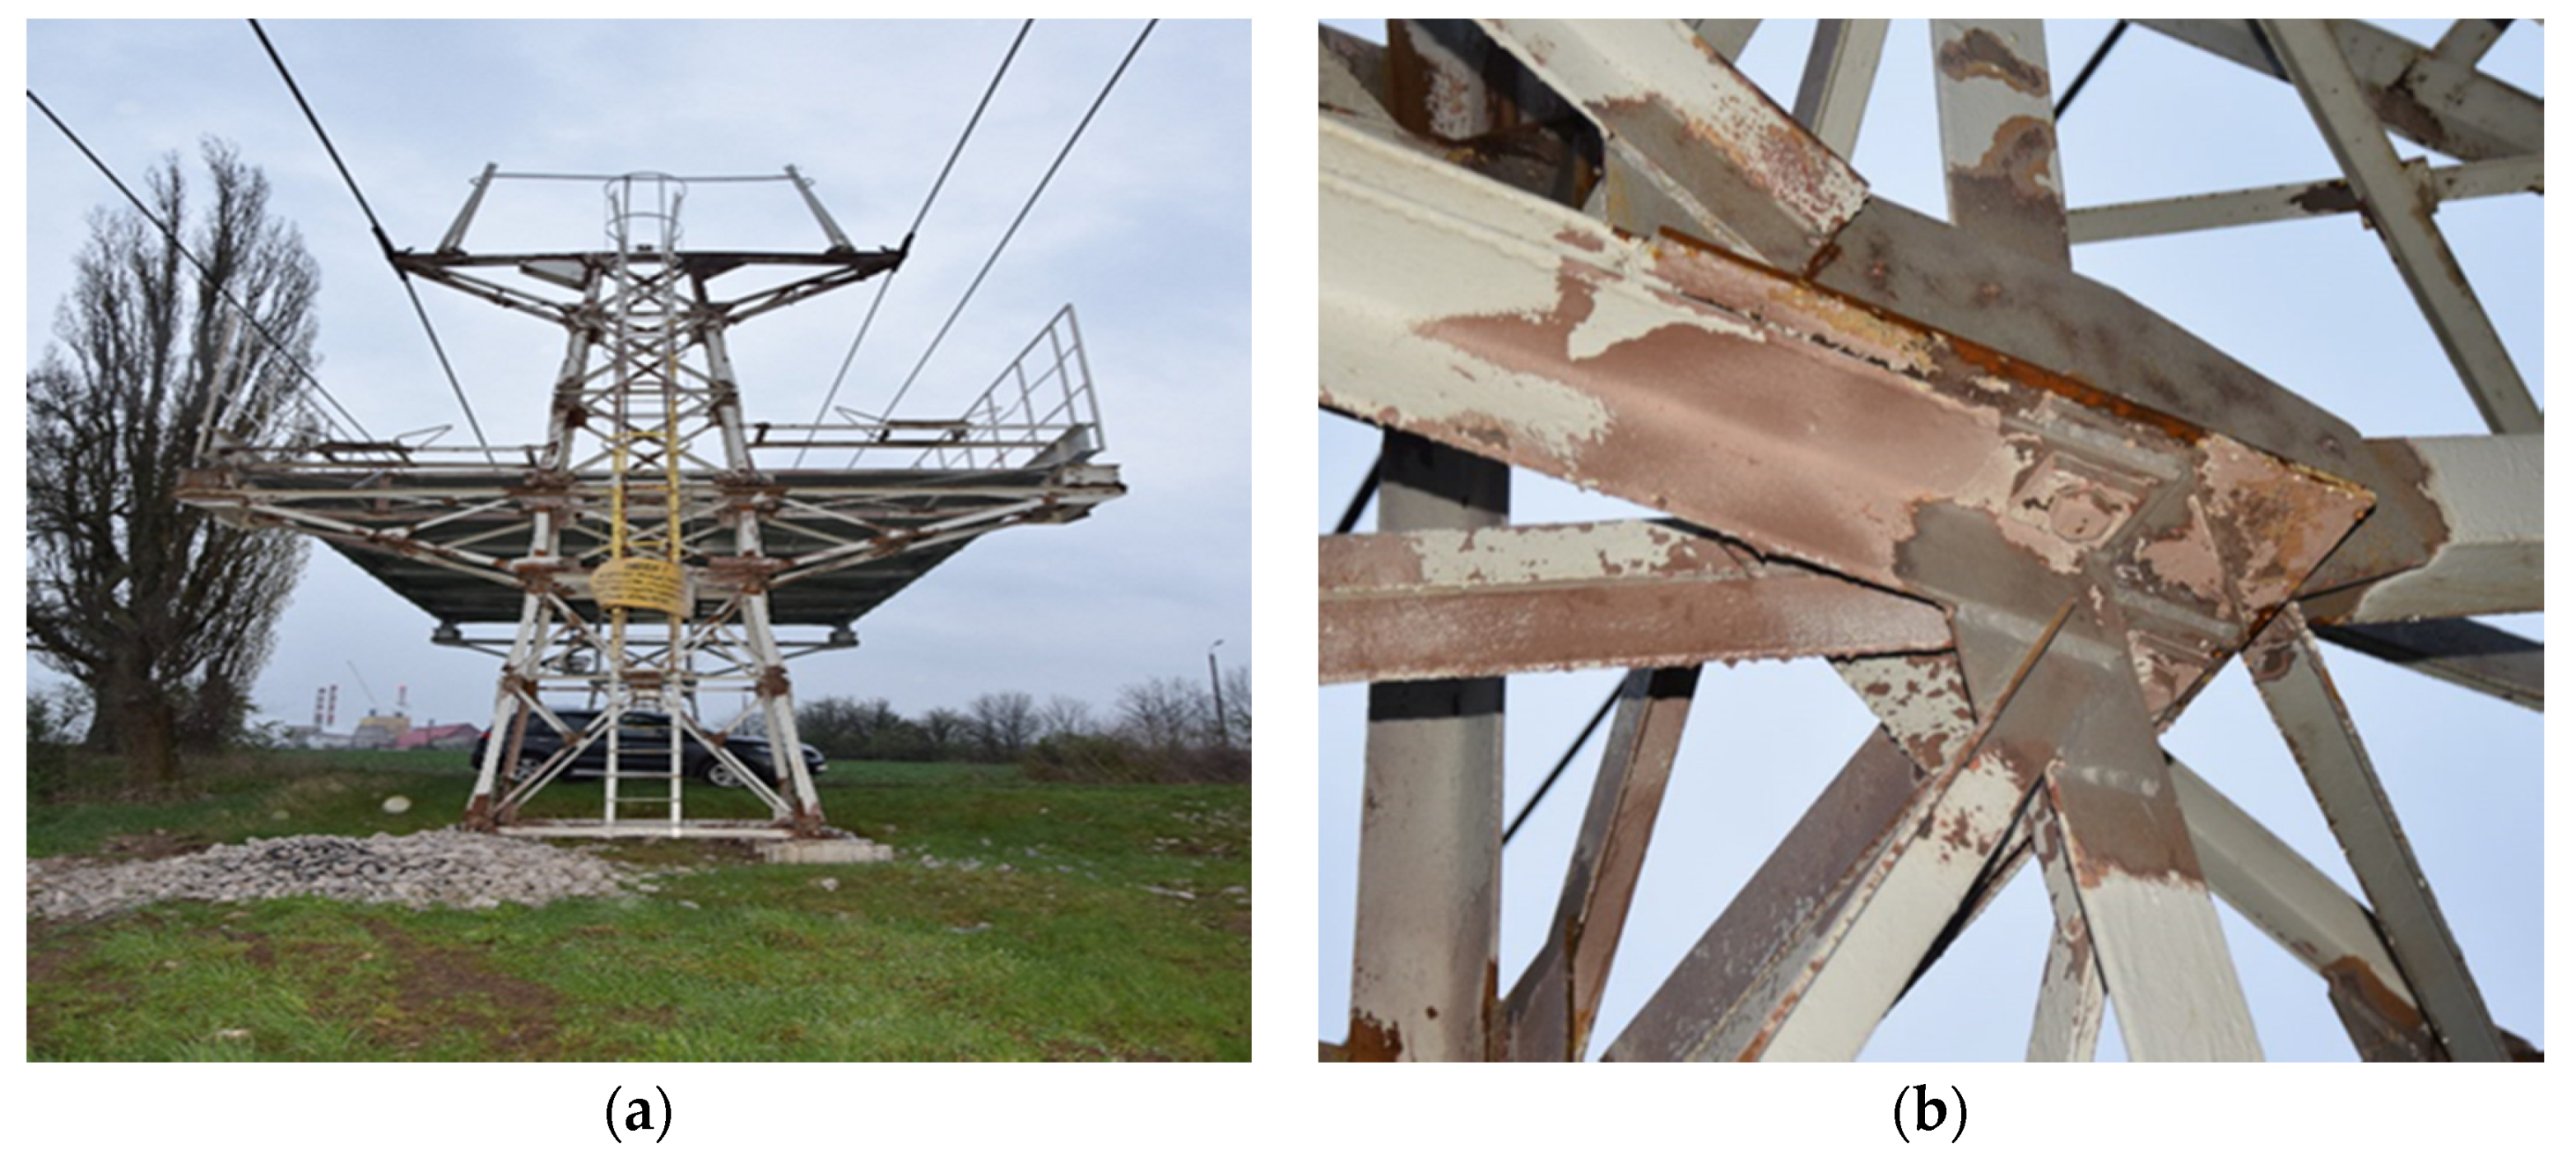
Figure 5.
(a) Arrangement of measuring points on the gas pipeline. (b) Measuring scheme.
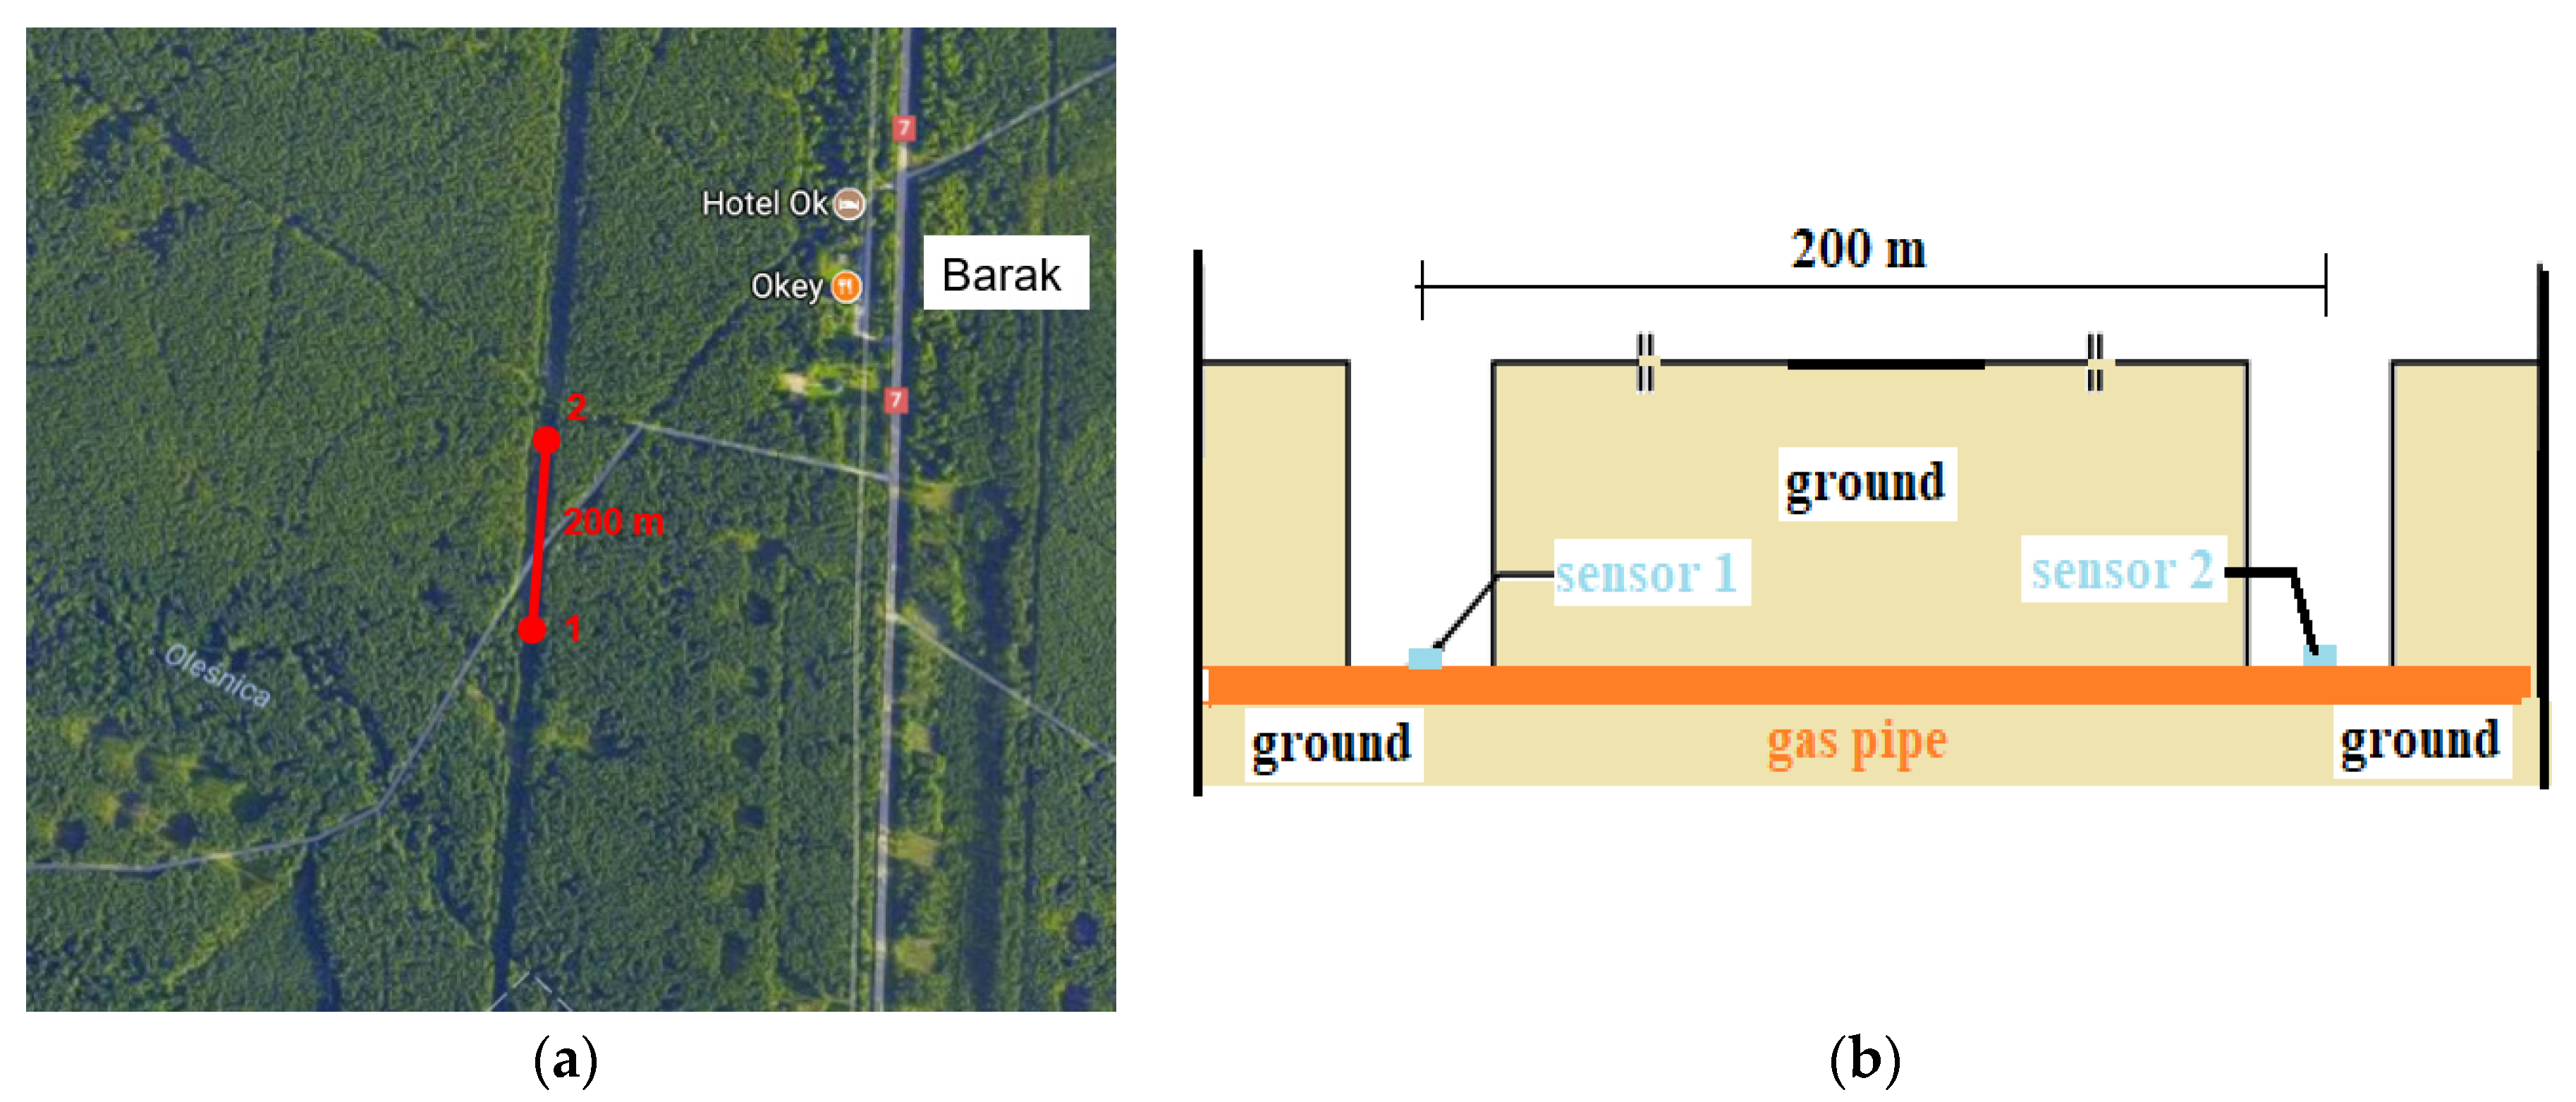
Figure 6.
Energy–time relationship for the bottom chord of the truss in span 1 with the numbers of signal classes marked.
Figure 6.
Energy–time relationship for the bottom chord of the truss in span 1 with the numbers of signal classes marked.
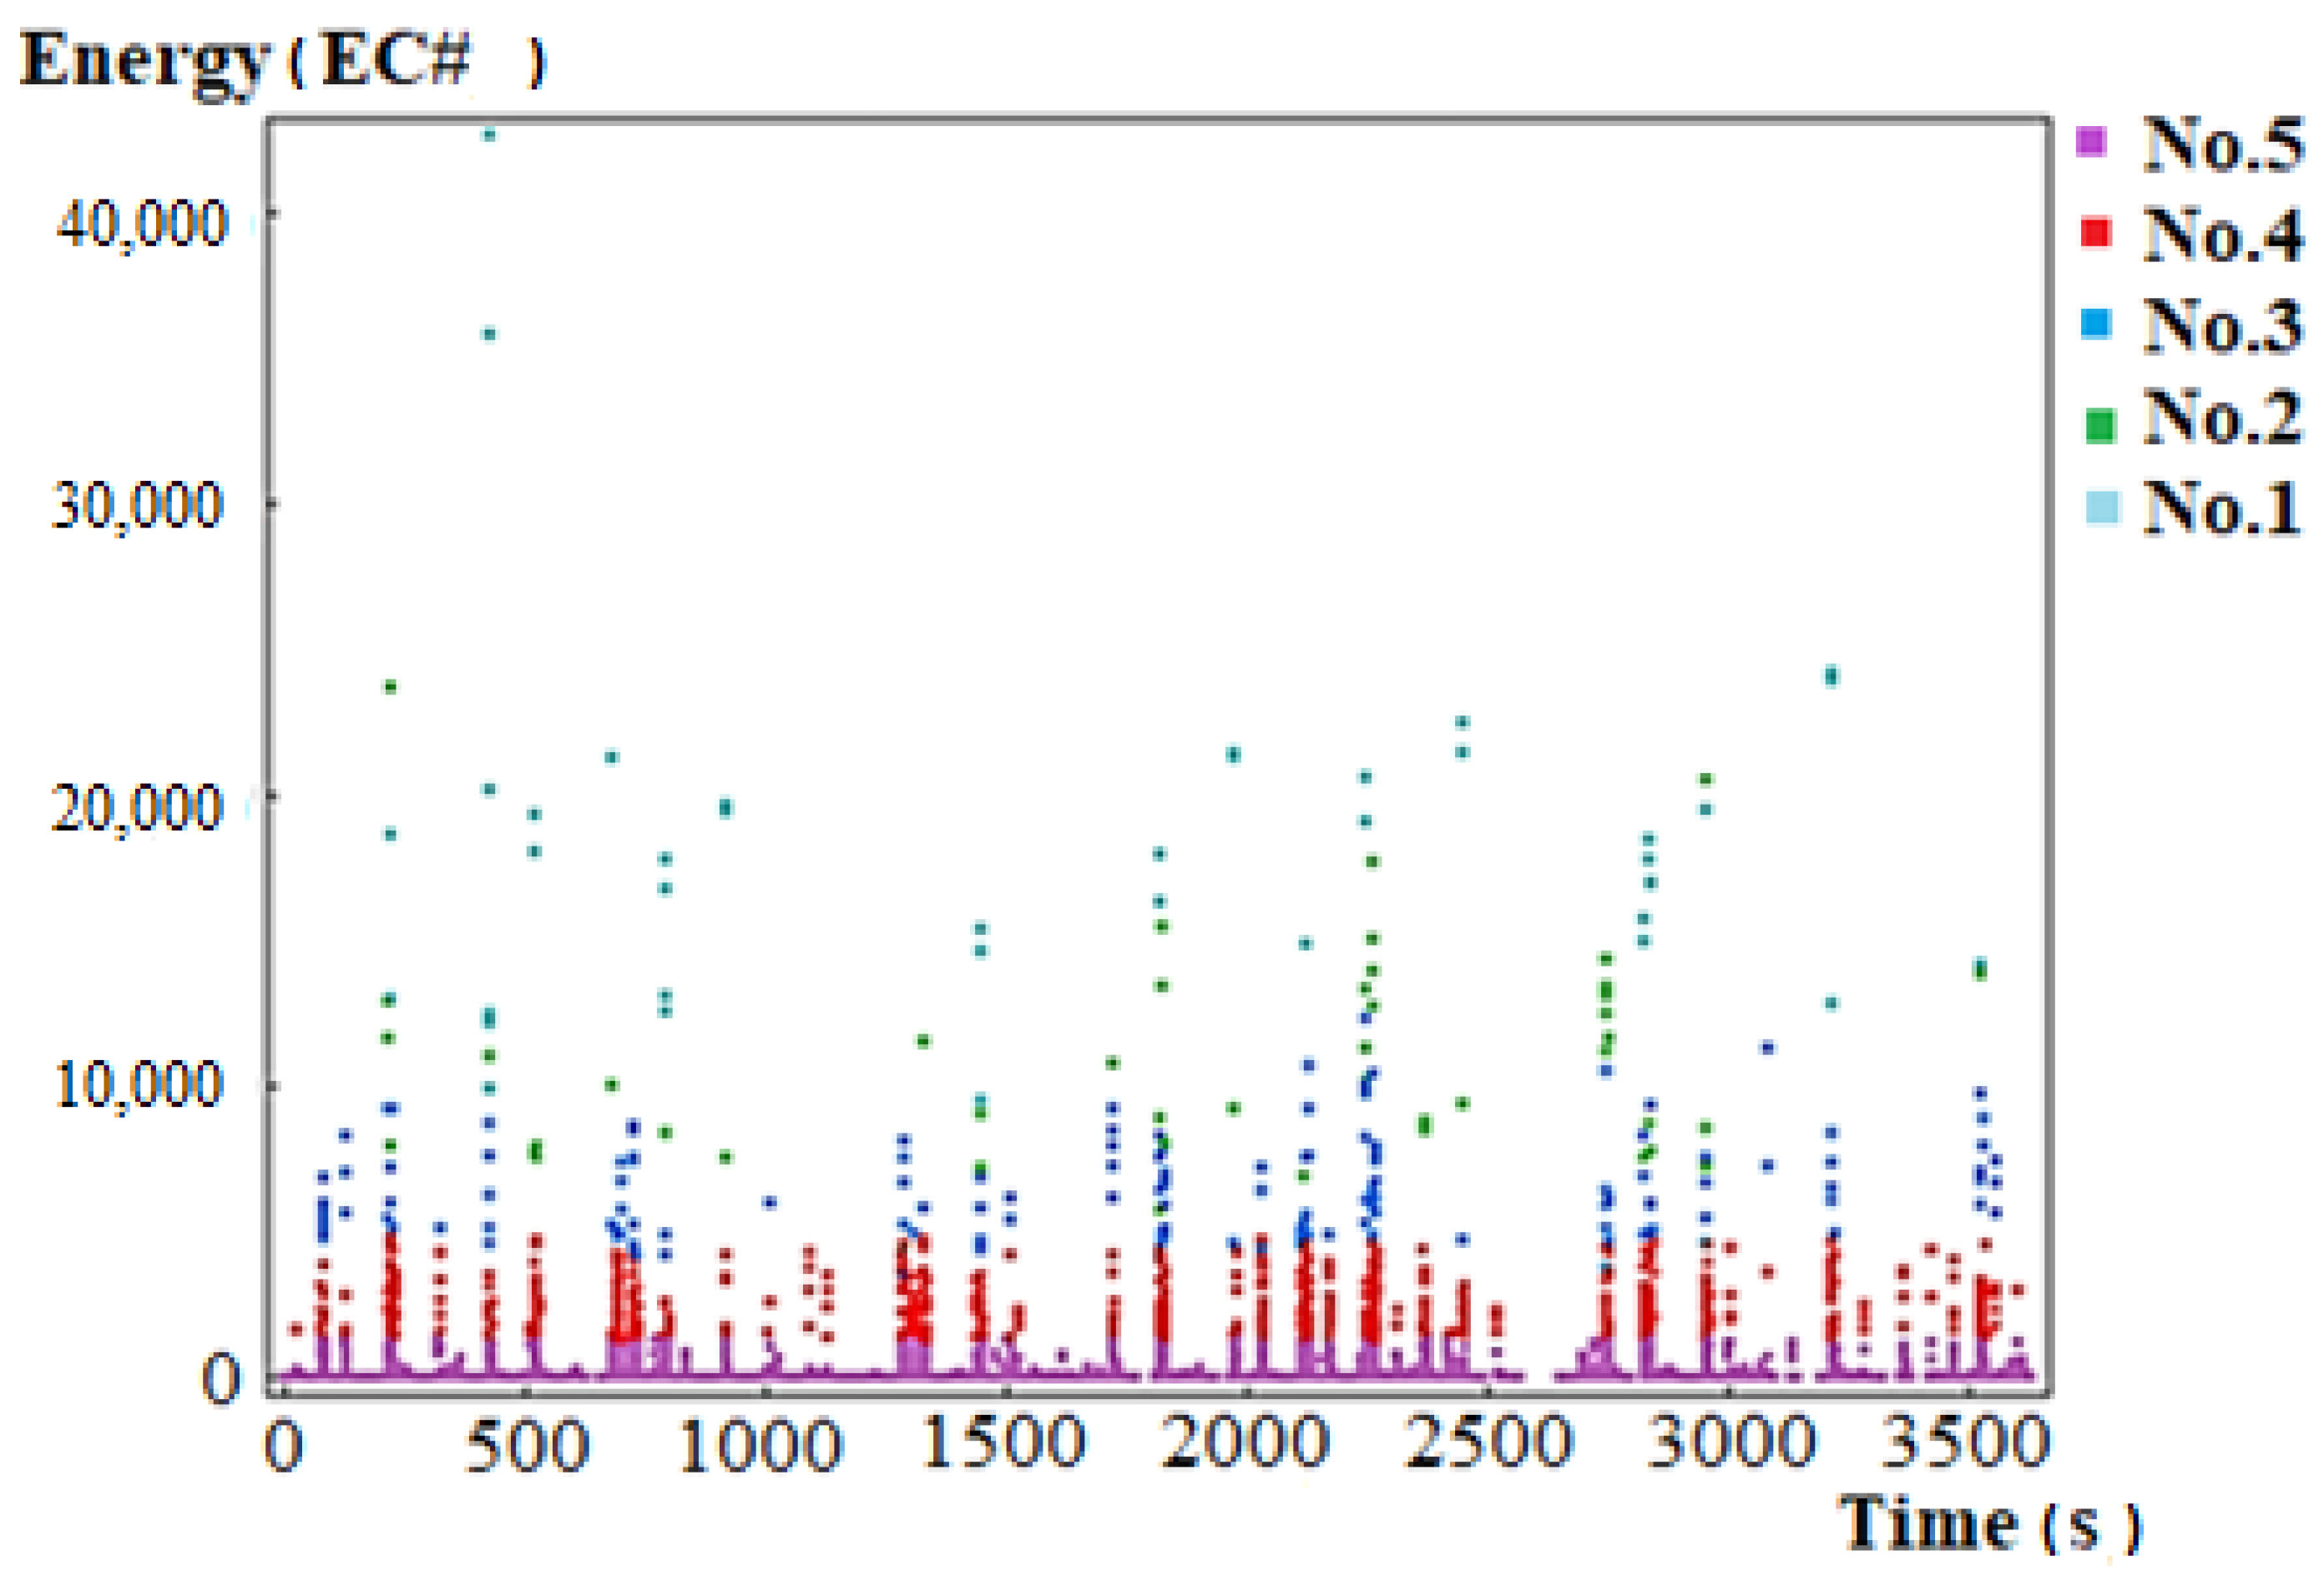
Figure 7.
Energy–time relationship for node 1 in span 1 with the numbers of signal classes marked.
Figure 8.
Energy-time relationship for stringer 2 in the span 1 with the numbers of signal classes marked.
Figure 8.
Energy-time relationship for stringer 2 in the span 1 with the numbers of signal classes marked.
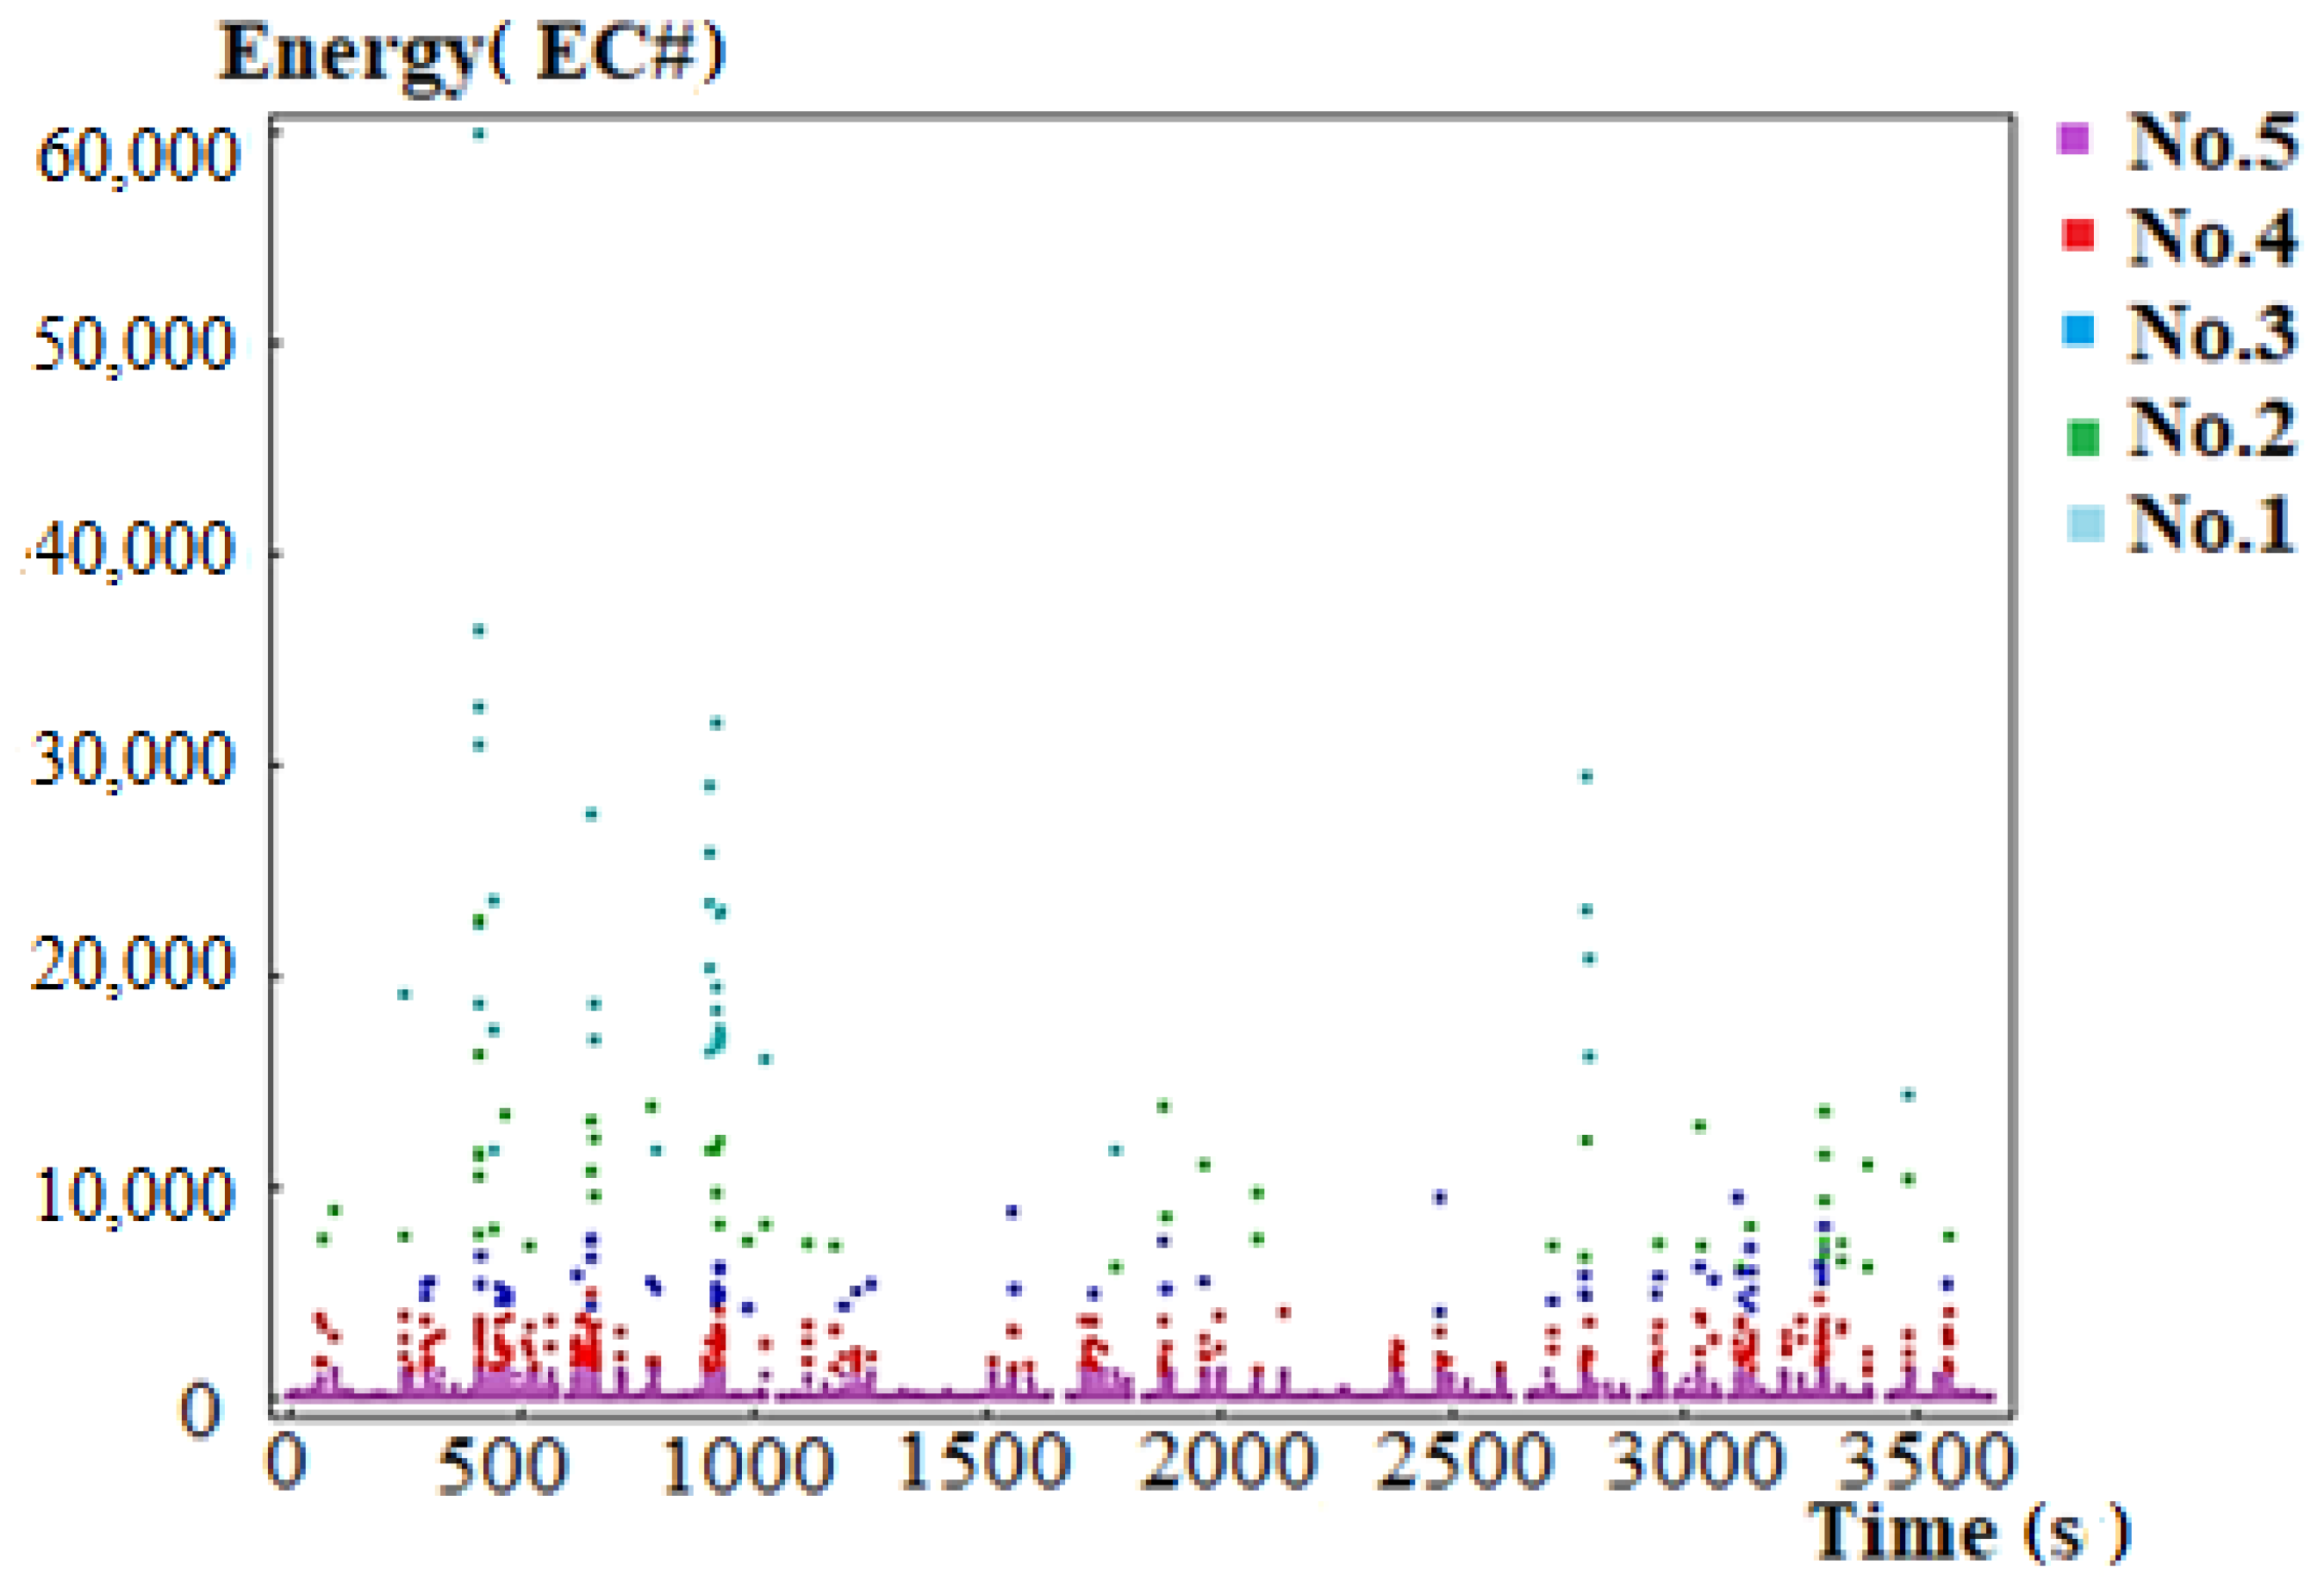
Figure 9.
Energy–time relationship for stringer 8 in span 2 with the numbers of signal classes marked.
Figure 9.
Energy–time relationship for stringer 8 in span 2 with the numbers of signal classes marked.
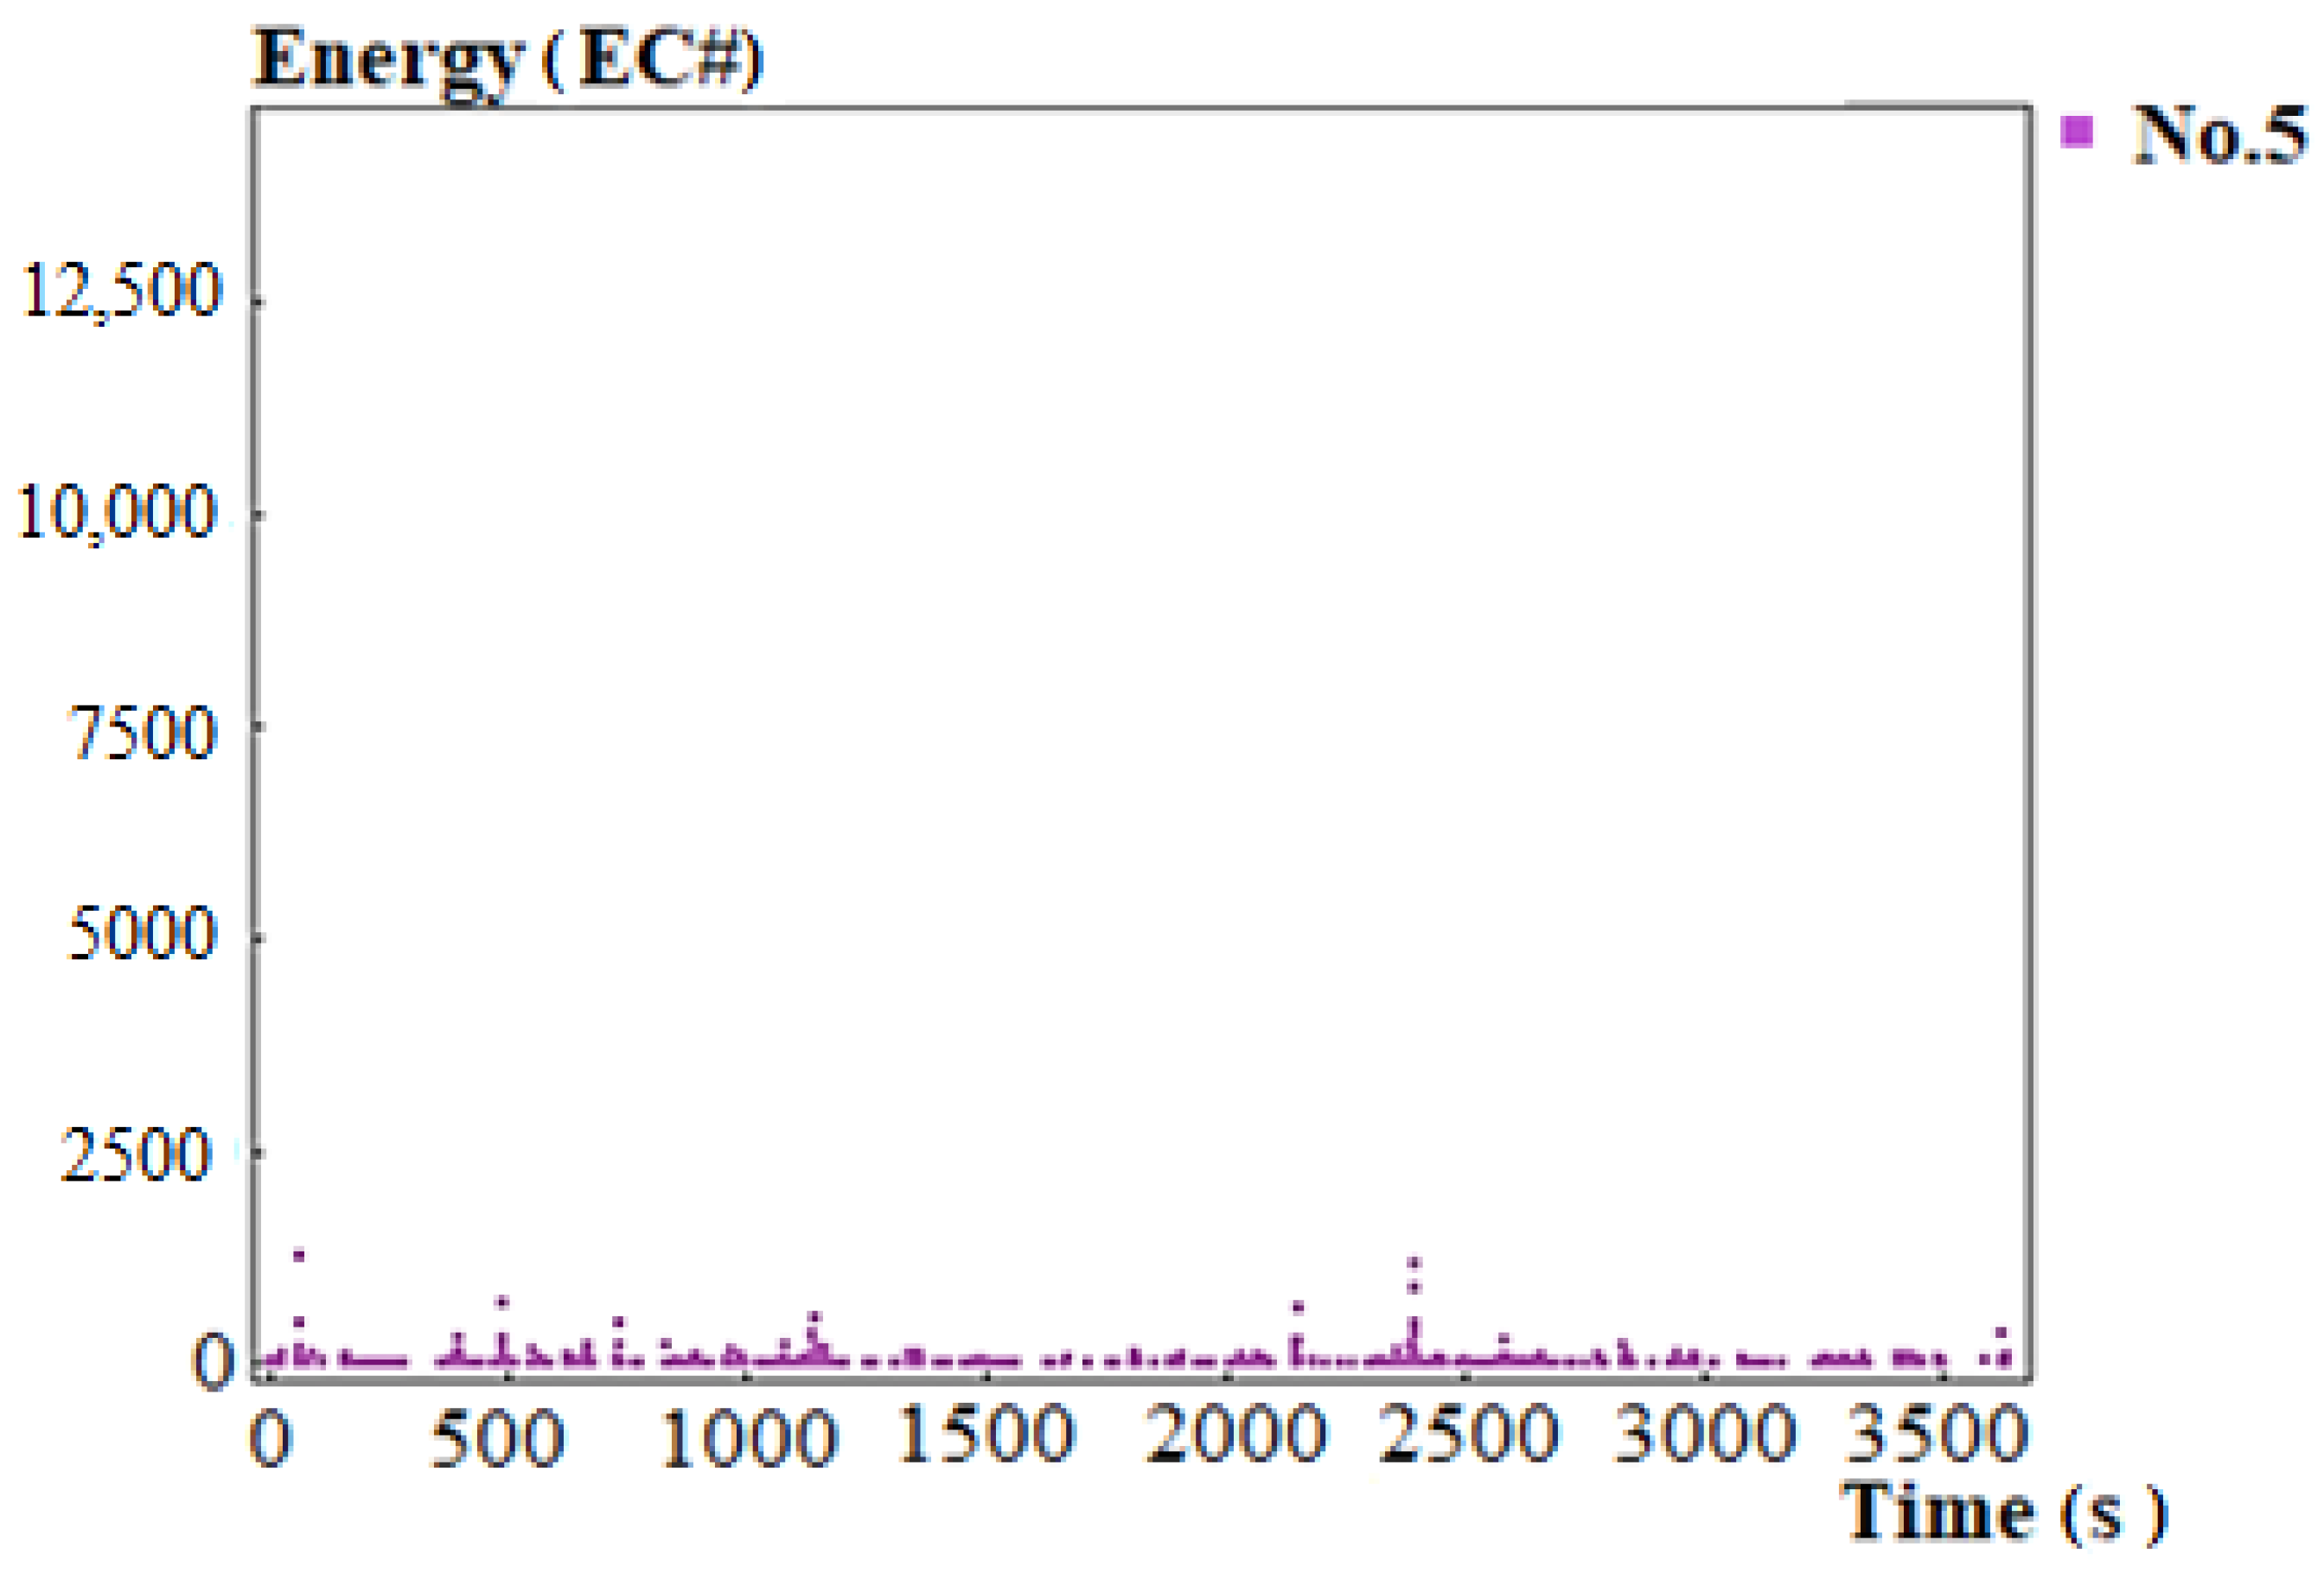
Figure 10.
Signal strength versus time for sensors 1–12 on column 1 with the numbers of signal classes marked.
Figure 10.
Signal strength versus time for sensors 1–12 on column 1 with the numbers of signal classes marked.
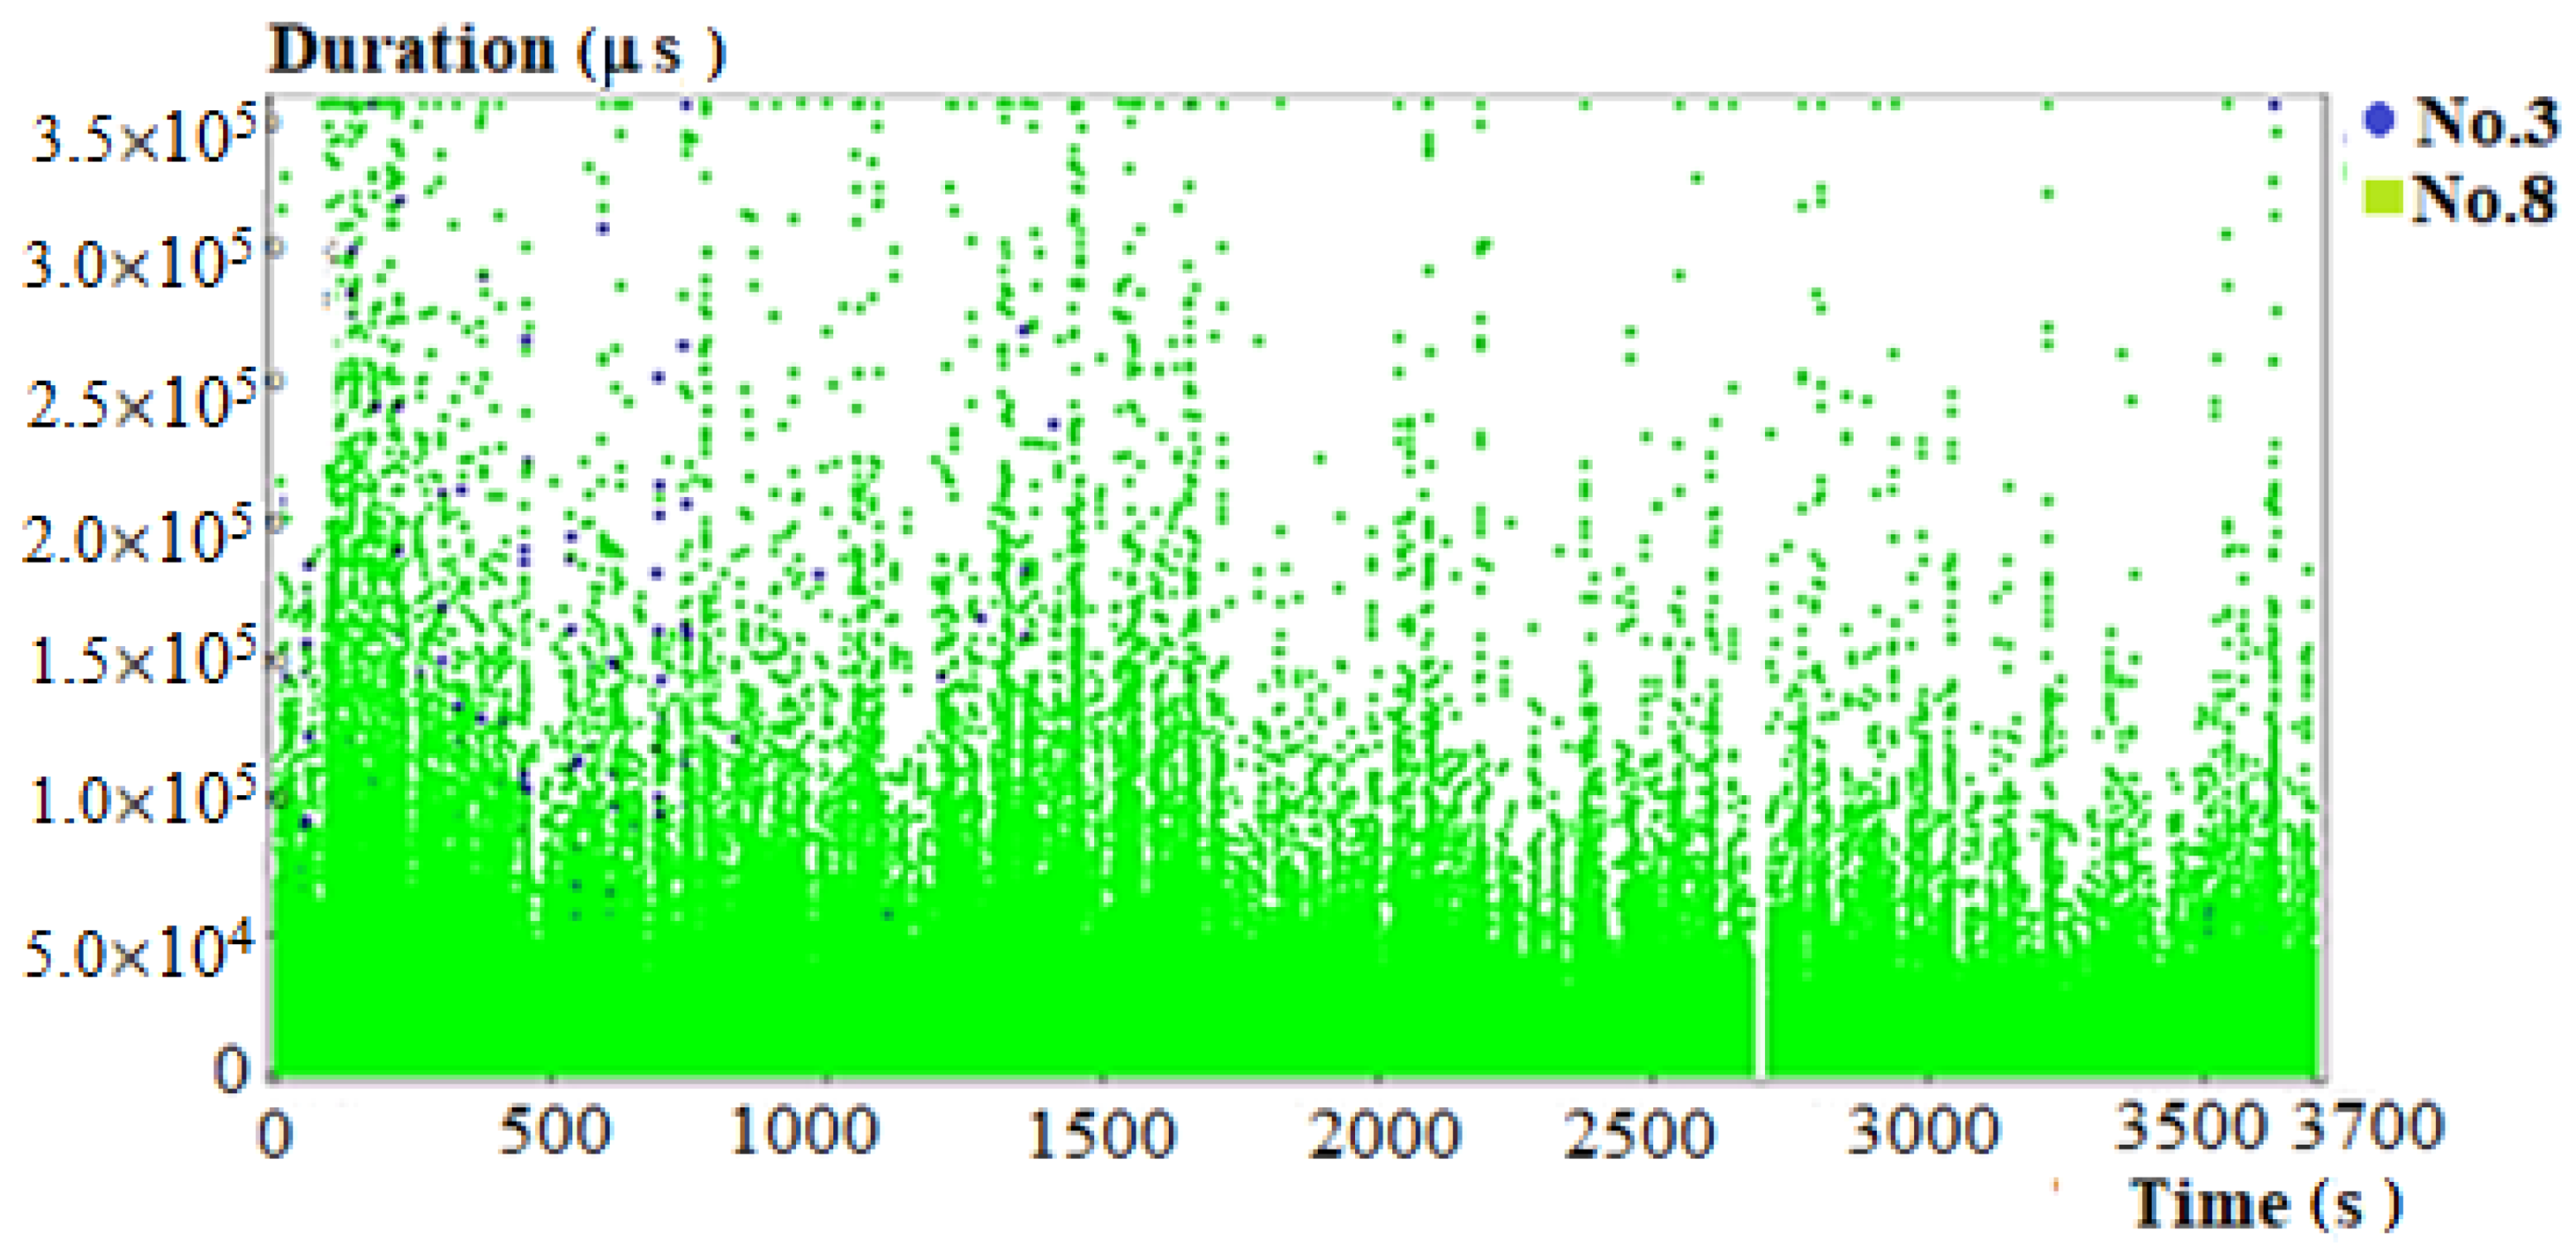
Figure 11.
(a) Photograph of the tested node. on column 1 (b) A photograph of the crack detected on column 1.
Figure 11.
(a) Photograph of the tested node. on column 1 (b) A photograph of the crack detected on column 1.

Figure 12.
Energy versus time for sensors 1–12 on column 2 with the numbers of signal classes marked.
Figure 12.
Energy versus time for sensors 1–12 on column 2 with the numbers of signal classes marked.
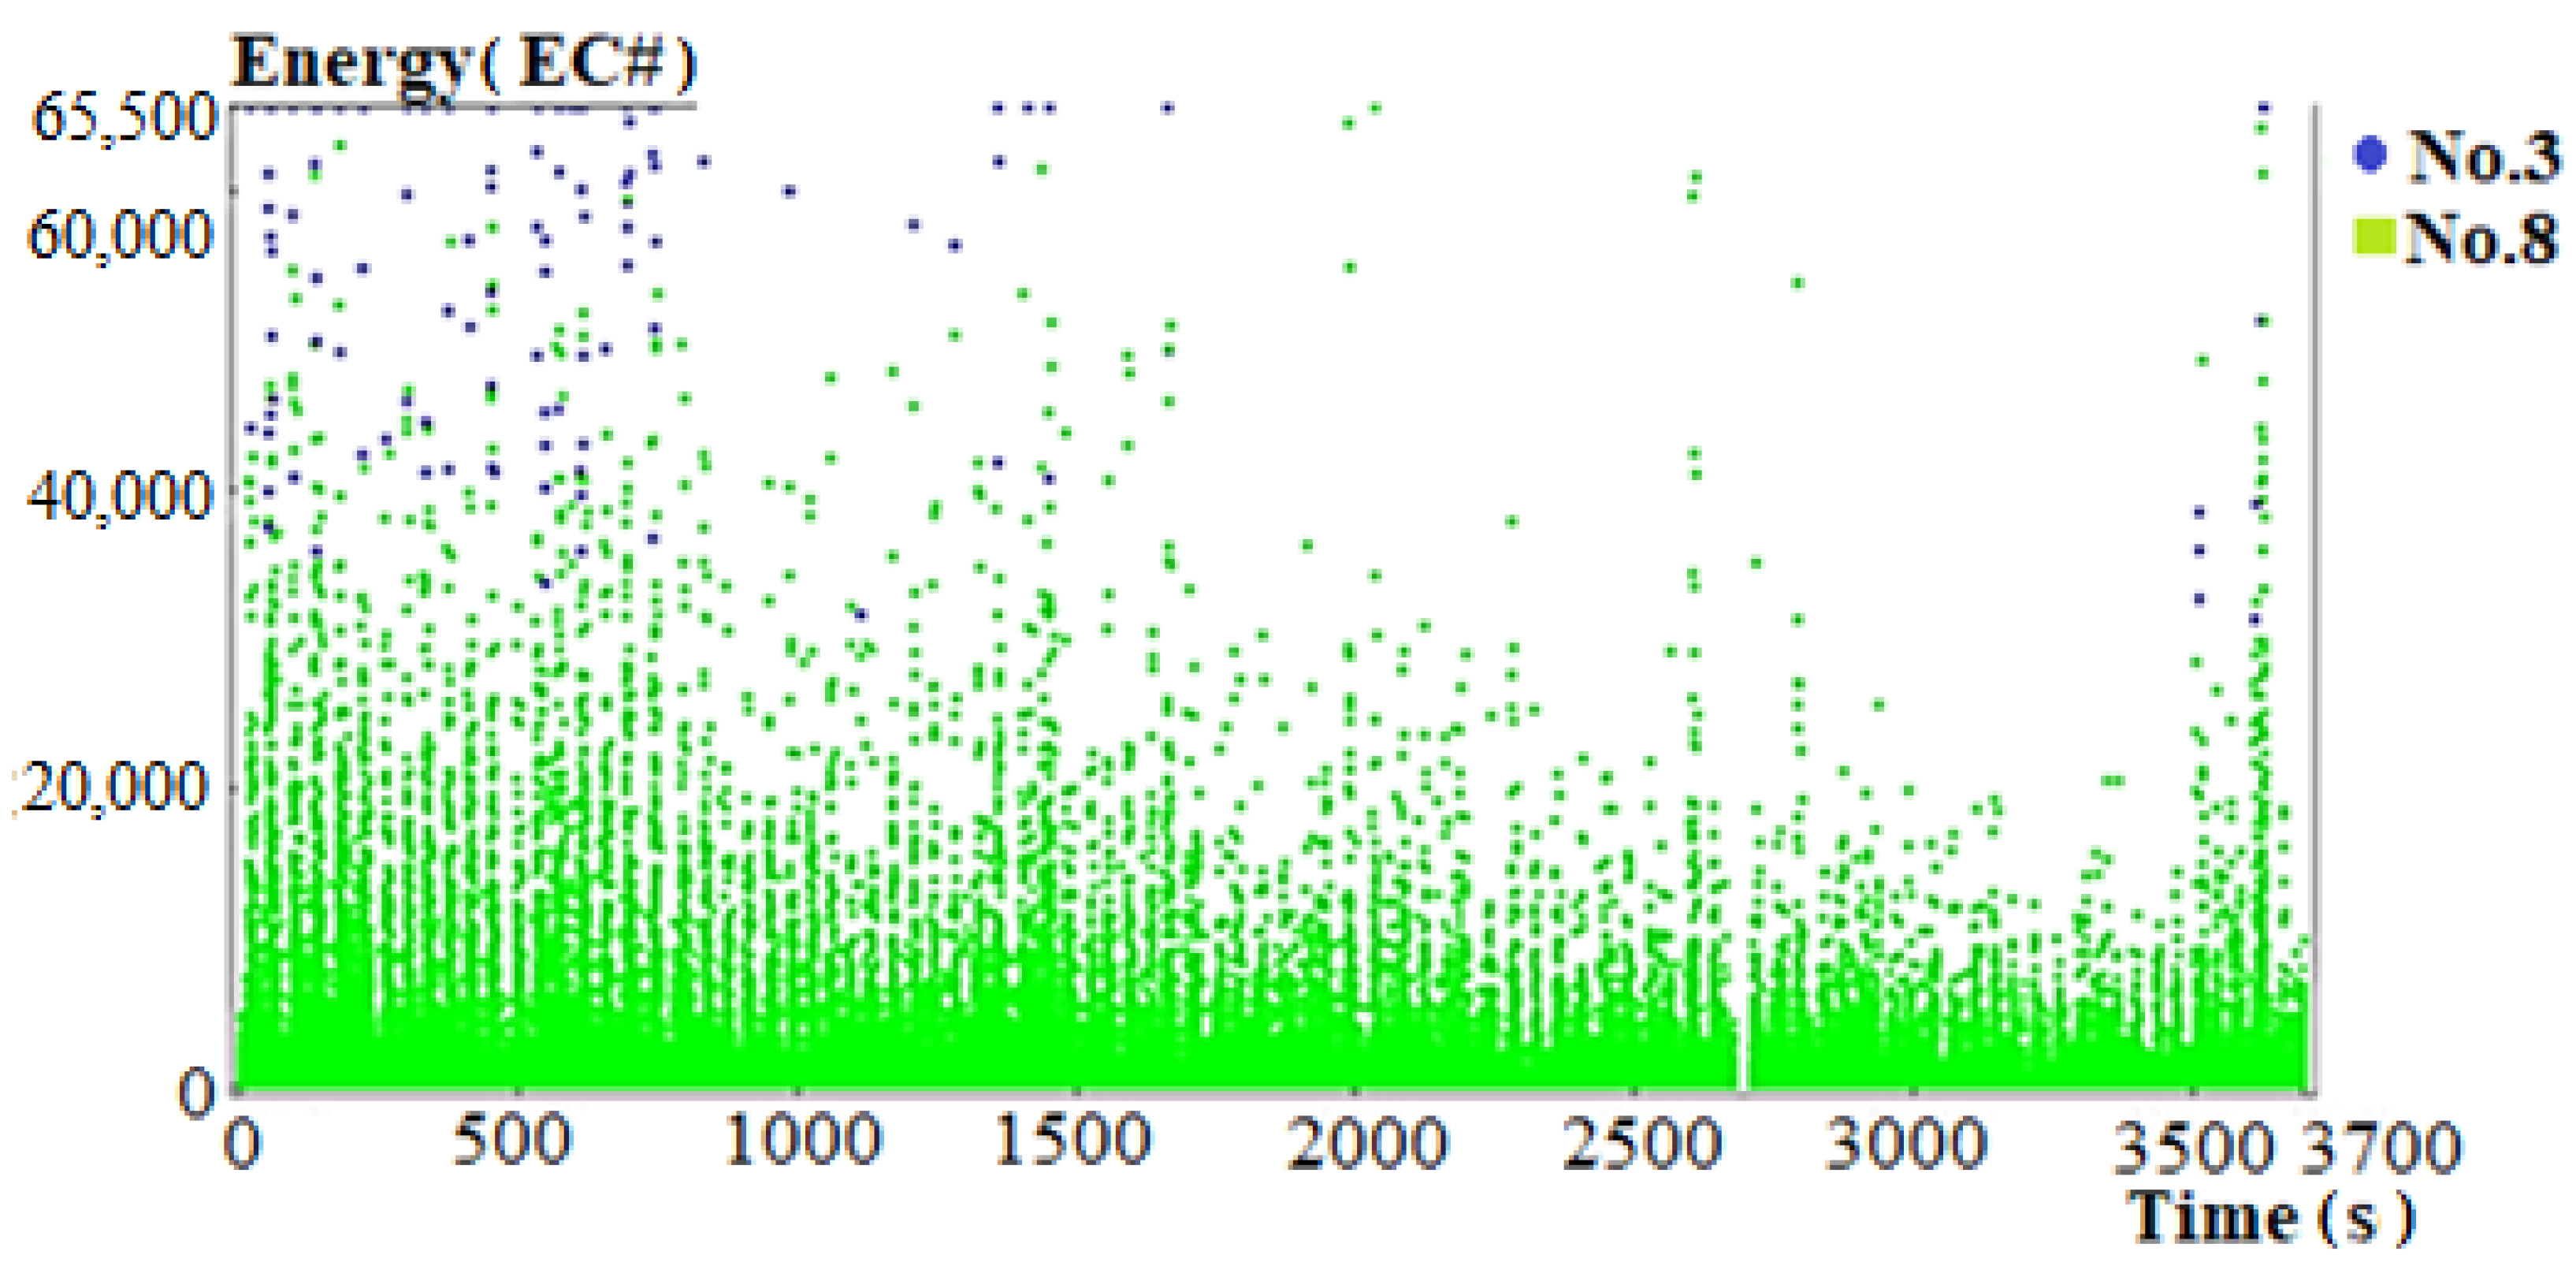
Figure 13.
Acoustic emission (AE) signal duration versus time for sensors 1–2 on column 2 with the numbers of signal classes marked.
Figure 13.
Acoustic emission (AE) signal duration versus time for sensors 1–2 on column 2 with the numbers of signal classes marked.

Figure 14.
AE signal energy as a function of time for the gas pipeline with the numbers of signal classes marked.
Figure 14.
AE signal energy as a function of time for the gas pipeline with the numbers of signal classes marked.

Figure 15.
Exact location of destructive process sources.
Figure 16.
Examples of localized concrete cracks within the compression cables on My Thuan Bridge.
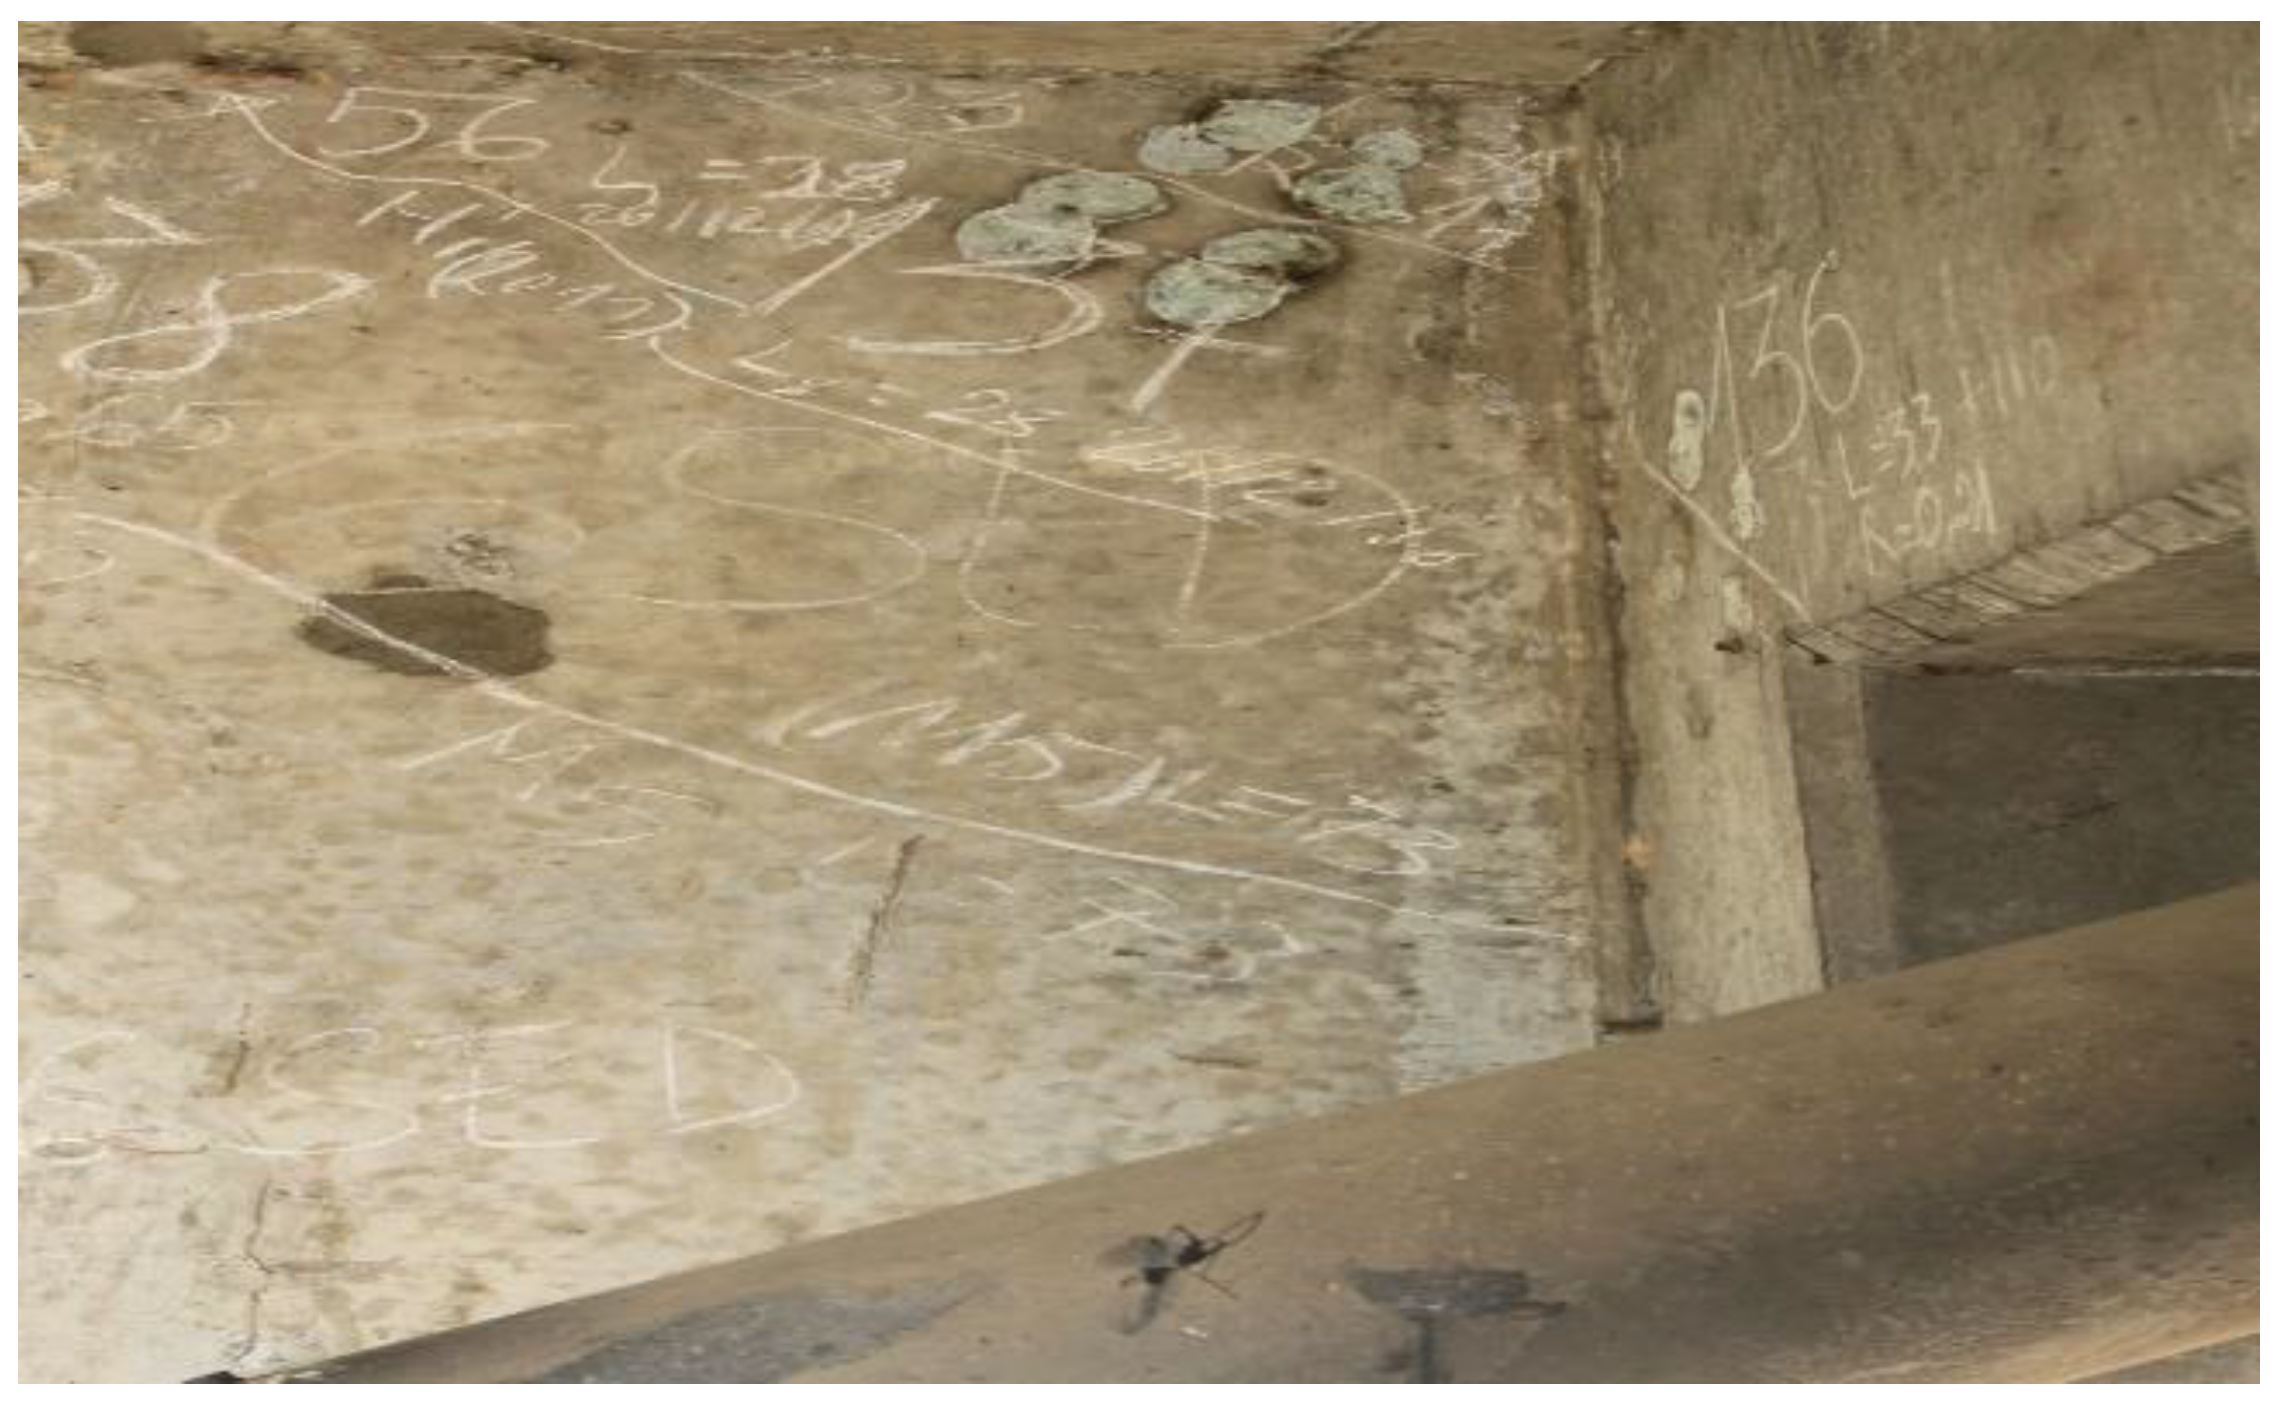
Figure 17.
Arrangement of measurement points in the vertical displacements system.
Figure 18.
Arrangement of measurement points in the strain measurement system.

Figure 19.
Energy versus time for the first measurement period—March 2016.
Figure 20.
Energy versus time for the second measurement period—October 2016.
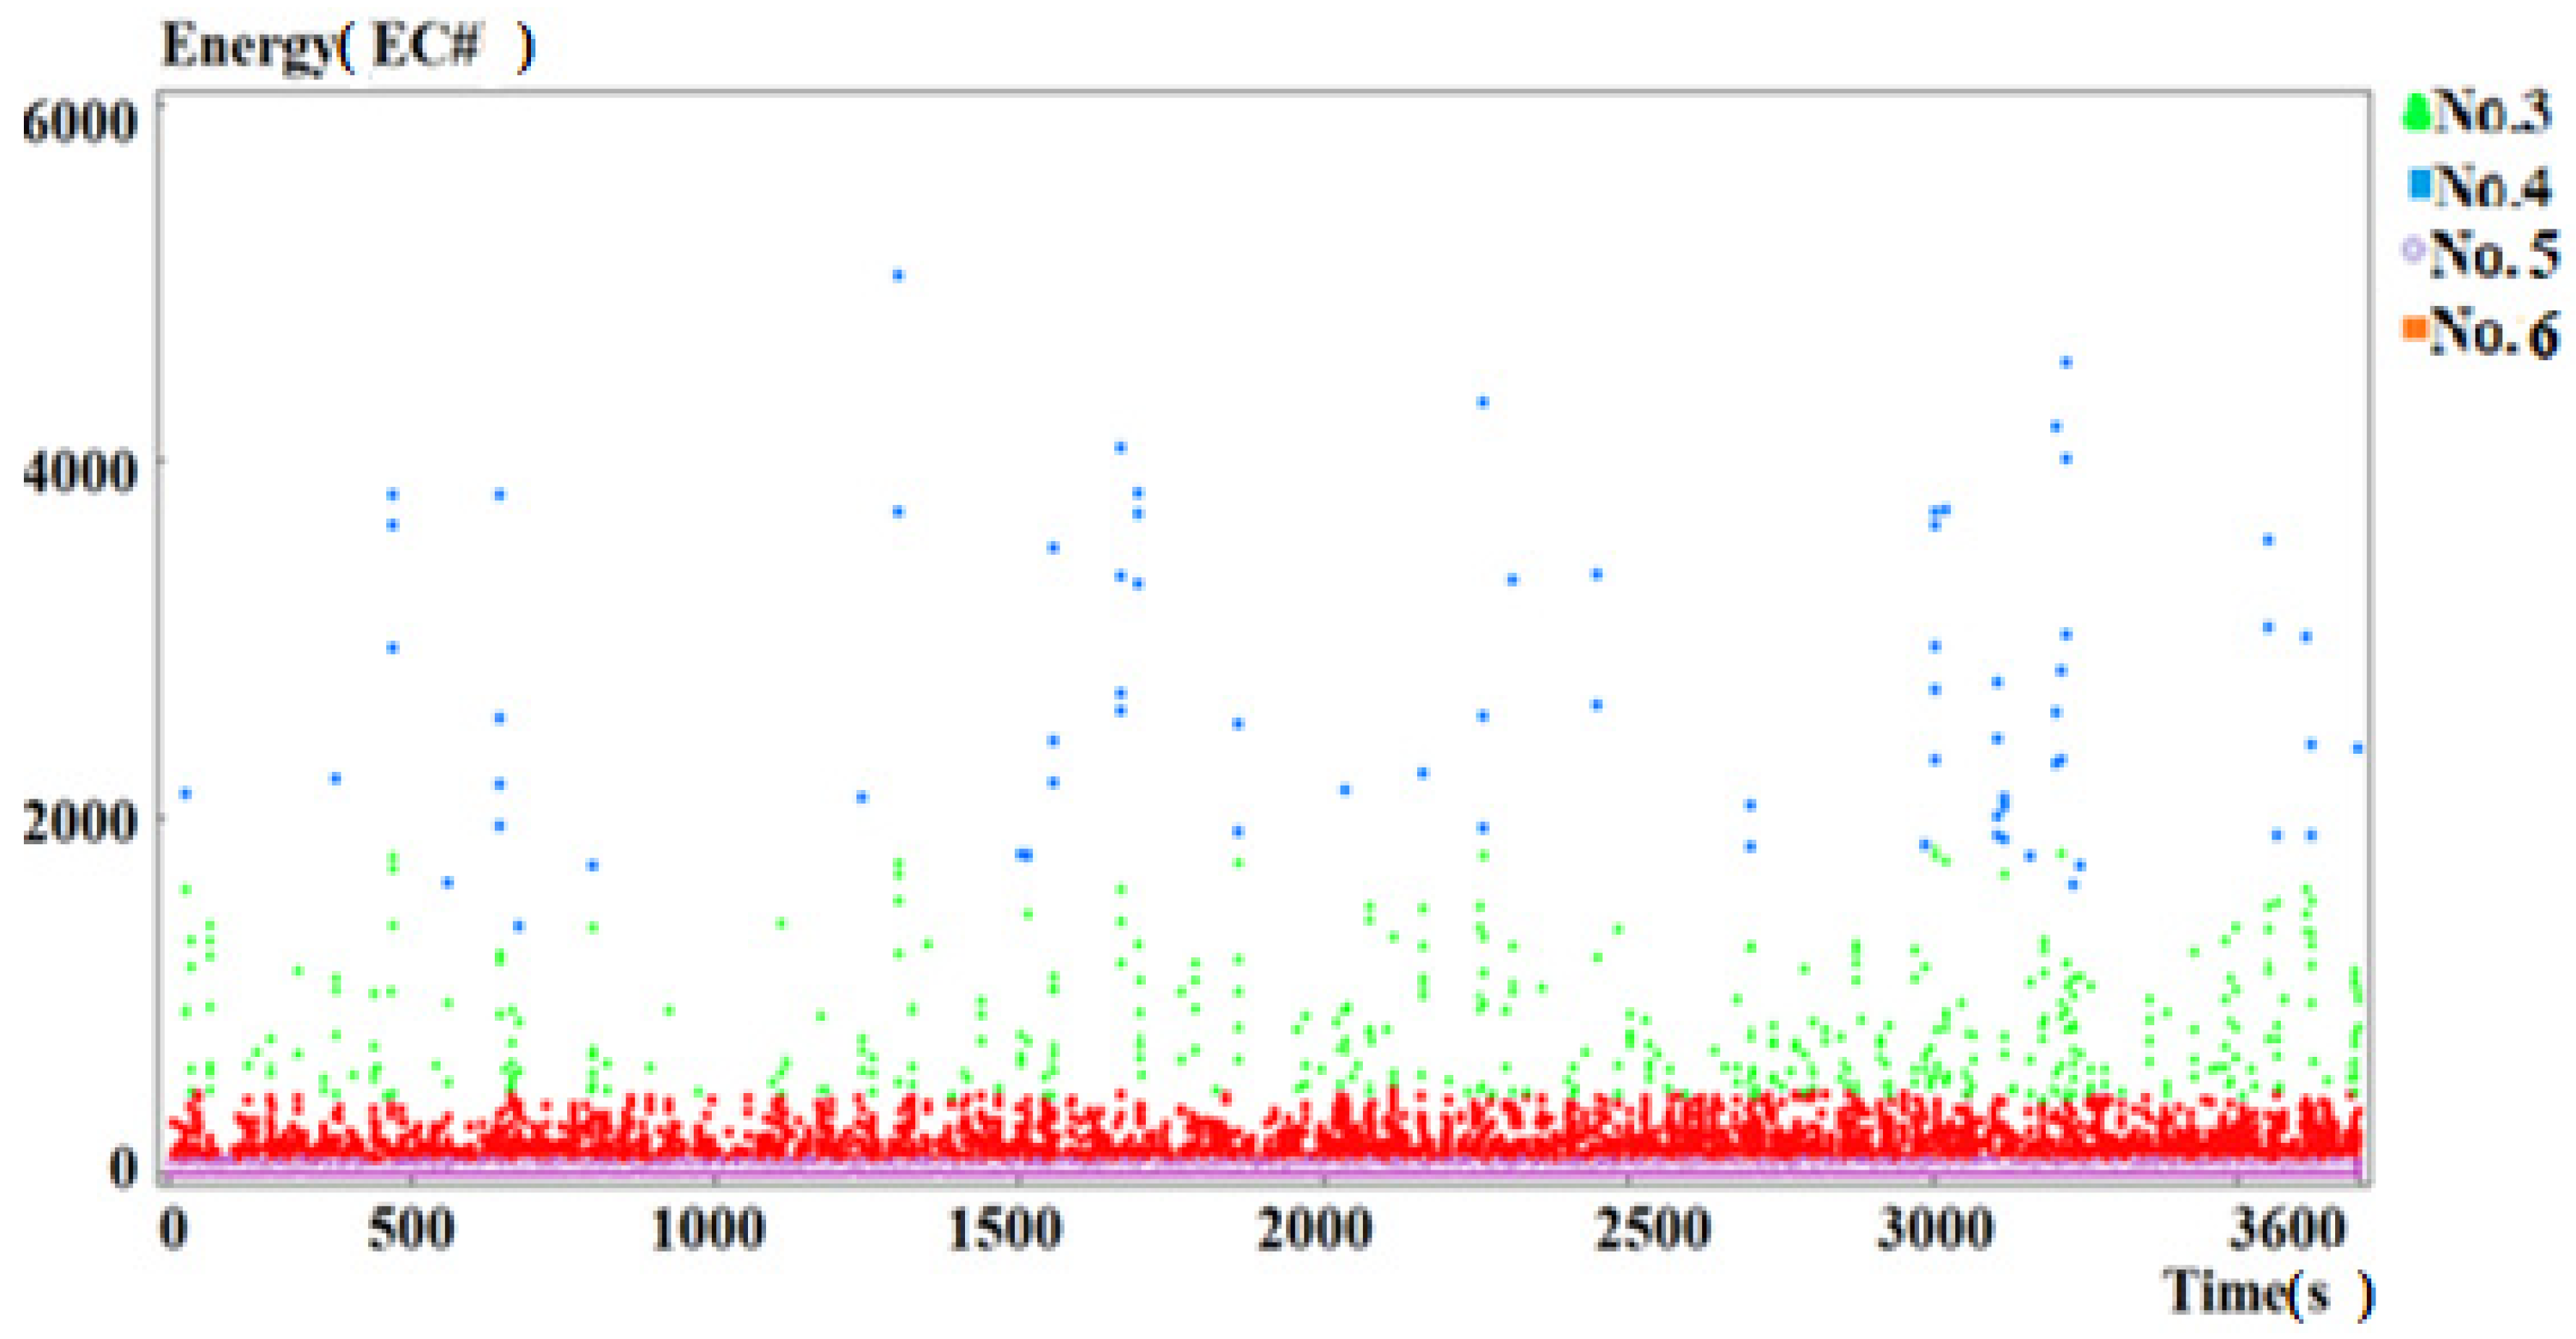
Figure 21.
Energy versus time for the third measurement period—March 2017.

Figure 22.
Signal duration versus time for three measurements.

Table 1.
Classes, symbols, and risk codes for steel bridges.
| Colour |  |  |  |  |  |
|---|---|---|---|---|---|
| Class | No.1 | No.2 | No.3 | No.4 | No.5 |
| Risk code | 0 | 1 | 2 | 3 | 4 |
| Risk | Very high | High | Medium | Low | No risk |
Table 2.
Classes, symbols, and risk codes for steel engineering constructions.
| Colour |  |  |  |  |  |  |  |  |
|---|---|---|---|---|---|---|---|---|
| Class | No.1 | No.2 | No.3 | No.4 | No.5 | No.6 | No.7 | No.8 |
| Risk code | 0 | 1 | 1 | 2 | 3 | 3 | 4 | 5 |
| Risk | Very high | High | High | Mid-to-high | Medium | Medium | Low | No risk |
Table 3.
Classes, symbols, and risk levels for steel gas pipelines.
| Colour | | | | | | | | |
|---|---|---|---|---|---|---|---|---|
| Class | No.1 | No.2 | No.3 | No.4 | No.5 | No.6 | No.7 | No.8 |
| Code | 0 | 1 | 1 | 2 | 2 | 3 | 4 | 5 |
| Risk | Very high | High | High | Mid-to-high | Mid-to-high | Medium | Low | No risk |
Table 4.
Classes, symbols, and risk levels for reinforced concrete structures.
| Colour |  |  |  |  |  |  |
|---|---|---|---|---|---|---|
| Class | No.1 | No.2 | No.3 | No.4 | No.5 | No.6 |
| Code | 0 | 1 | 2 | 3 | 4 | 5 |
| Risk | Very high | High | Medium | Medium | Low | No risk |
© 2018 by the author. Licensee MDPI, Basel, Switzerland. This article is an open access article distributed under the terms and conditions of the Creative Commons Attribution (CC BY) license (http://creativecommons.org/licenses/by/4.0/).
Share and Cite
MDPI and ACS Style
Świt, G. Acoustic Emission Method for Locating and Identifying Active Destructive Processes in Operating Facilities. Appl. Sci. 2018, 8, 1295. https://doi.org/10.3390/app8081295
AMA Style
Świt G. Acoustic Emission Method for Locating and Identifying Active Destructive Processes in Operating Facilities. Applied Sciences. 2018; 8(8):1295. https://doi.org/10.3390/app8081295
Chicago/Turabian StyleŚwit, Grzegorz. 2018. "Acoustic Emission Method for Locating and Identifying Active Destructive Processes in Operating Facilities" Applied Sciences 8, no. 8: 1295. https://doi.org/10.3390/app8081295
Note that from the first issue of 2016, this journal uses article numbers instead of page numbers. See further details here.