Performance of Resource Allocation in Device-to-Device Communication Systems Based on Evolutionally Optimization Algorithms †

1
Department of Electrical Engineering, National Taipei University of Technology, Taipei City 106, Taiwan
2
Department of Information and Communication Engineering, Chaoyang University of Technology, Taichung City 413, Taiwan
*
Author to whom correspondence should be addressed.
†
This paper is an extended version of our 2 papers published in 1. 2017 IEEE International Conference on Systems, Man, and Cybernetics (SMC2017), pp. 5–8, Banff, AB, Canada, 5–8 October 2017. and 2. International Conference on Genetic and Evolutionary Computing (ICGEC 2017): Genetic and Evolutionary Computing, Advances in Intelligent Systems and Computing book series (AISC), Vol. 579, pp. 26–33, Springer-Verlag: Berlin/Heidelberg, 6–8 November 2017.
Appl. Sci. 2018, 8(8), 1271; https://doi.org/10.3390/app8081271
Submission received: 17 June 2018
/
Revised: 23 July 2018
/
Accepted: 27 July 2018
/
Published: 31 July 2018
(This article belongs to the Special Issue Selected Papers from IEEE ICASI 2018)
Abstract
:In this study, the resource blocks (RB) are allocated to user equipment (UE) according to the evolutional algorithms for long-term evolution (LTE) systems. Particle Swarm Optimization (PSO) algorithm is one of these evolutionary algorithms, which imitates the foraging behavior of a flock of birds through learning and grouping the best experience. In previous works, the Simple Particle Swarm Optimization (SPSO) algorithm was proposed for RB allocation to enhance the throughput of Device-to-Device (D2D) communications and improve the system capacity performance. Genetic algorithm (GA) is another evolutionary algorithm, which is based on the Darwinian models of natural selection and evolution. Therefore, we further proposed a Refined PSO (RPSO) and a novel GA to enhance the throughput of UEs and to improve the system capacity performance. Simulation results show that the proposed GA with 100 populations can converge to suboptimal solutions in 200 generations. The proposed GA and RPSO can improve system capacity performance compared to SPSO by 2.0 and 0.6 UEs, respectively.
1. Introduction
Orthogonal frequency division multiple access (OFDMA) combines the orthogonal frequency division multiplexing (OFDM) and frequency division multiple access (FDMA) technology for multiple access of multiple users at a high data rate. The OFDMA scheme in the fourth generation mobile communication system (4G) long-term evolution (LTE) technology has not only upgraded spectrum efficiency but also provided high resistance for frequency-selective fading channels [1]. The Device-to-Device (D2D) is a developing key technique for next generation (5G) mobile communication systems [2]. The D2D technique allows unauthorized users equipment (UEs) to access unused authorized cellular UE bands, thereby improving the utilization efficiency of bandwidth resources.
The D2D can maximize communications services in adjacent areas due to the transfer of data without going through the base station. For example, the regional transmission and Wi-Fi combined [3,4] can provide more neighboring users with multimedia services; allow them to find a nearby friend; allow for real-time communications conversations; and permit product advertising. It also has the potential to be applied in settings of emergency medicine [5] and disaster situations [6] where patients far outnumber healthcare providers and the outreaching communication bandwidth is limited.
Several resource allocation algorithms have been developed to allocate system’s subcarriers and users’ transmission powers in the uplink of Single-carrier Frequency-Division Multiple Access (SC-FDMA) wireless networks [7]. The various resource allocation algorithms are categorized into four major classes based on the ultimate goal/objective of the resource allocation process as follows: (i) throughput optimization, (ii) fairness, (iii) satisfaction of users’ QoS requirements and (iv) joint power and subcarriers allocation [7]. Moreover, the multi-sharing D2D communication allows any cellular user equipment to share its radio resource with multiple D2D devices [8]. In reference [9], the maximum independent set based and Stackelberg game based (MISS) algorithm has been developed by jointly considering resource block reuse and power control. In reference [10], the maximum independent set based and Stackelberg power based (MiSo) algorithm has been developed for the radio resource share of cellular user equipment to multiple D2D devices with joint spectrum reuse and power control.
In this study, the resource blocks (RBs) are allocated to UEs according to the evolutional algorithms for LTE systems. The advantages of D2D techniques include increased energy efficiency of transmission, energy saving [11] and coverage rate improvement [6]. When there is serious interference from the environments of communication systems, most UEs with direct transmission cannot reach the transmission rate requirement when the UEs is far from the base station. However, with the addition of a relay station for transmission, most UEs can reach the minimum requirements of transmission rate [10]. Therefore, after the application of a relay station for transmission in the serious interference environment, the performance of the system outperforms the direct transmission systems.
Particle Swarm Optimization (PSO) algorithm [12] is one of the evolutionary algorithms, which imitates the foraging behavior of a flock of birds through learning and grouping the best experience. PSO for lowering Service Delay in Edge Cloud Computing has been proposed for improvement while still maintaining a low execution time for scenarios of multiple cloudlets [12]. In reference [13], a Simple PSO (SPSO) algorithm was developed for resources allocation to achieve a high quality of service (QoS) and to maximize system capacity. Therefore, in this paper, we further proposed a Refined PSO (RPSO) to enhance the throughput of UEs and to improve the system capacity performance.
The GA is a stochastic search algorithm whose procedures are based on the Darwinian models of natural selection and evolution [14]. Given some arbitrary initial solutions, the GA will generate the better solution through a series of genetic operations, including selection, crossover and mutation. Furthermore, the GA searches the solution space in parallel, which essentially involves a set of possible solutions being manipulated in the same generation so multiple local optimum can be reached simultaneously. Thus, the likelihood of finding the global optimum is increased. In reference [15], we proposed a novel redundancy-saving genetic algorithm (RSGA), which is based on the cost value of the fitness function to improve the complexity in terms of the bit error rate (BER) requirement for direct-sequence code division multiple access (DS-CDMA) systems. However, it is not suitable for OFDMA systems. Moreover, in reference [16], the GA has been applied for preliminary investigation of the RB allocation for D2D communications. Therefore, in this study, we further proposed the GA to compare the RPSO in the system capacity and throughput of the RB allocation for D2D systems.
2. System Models
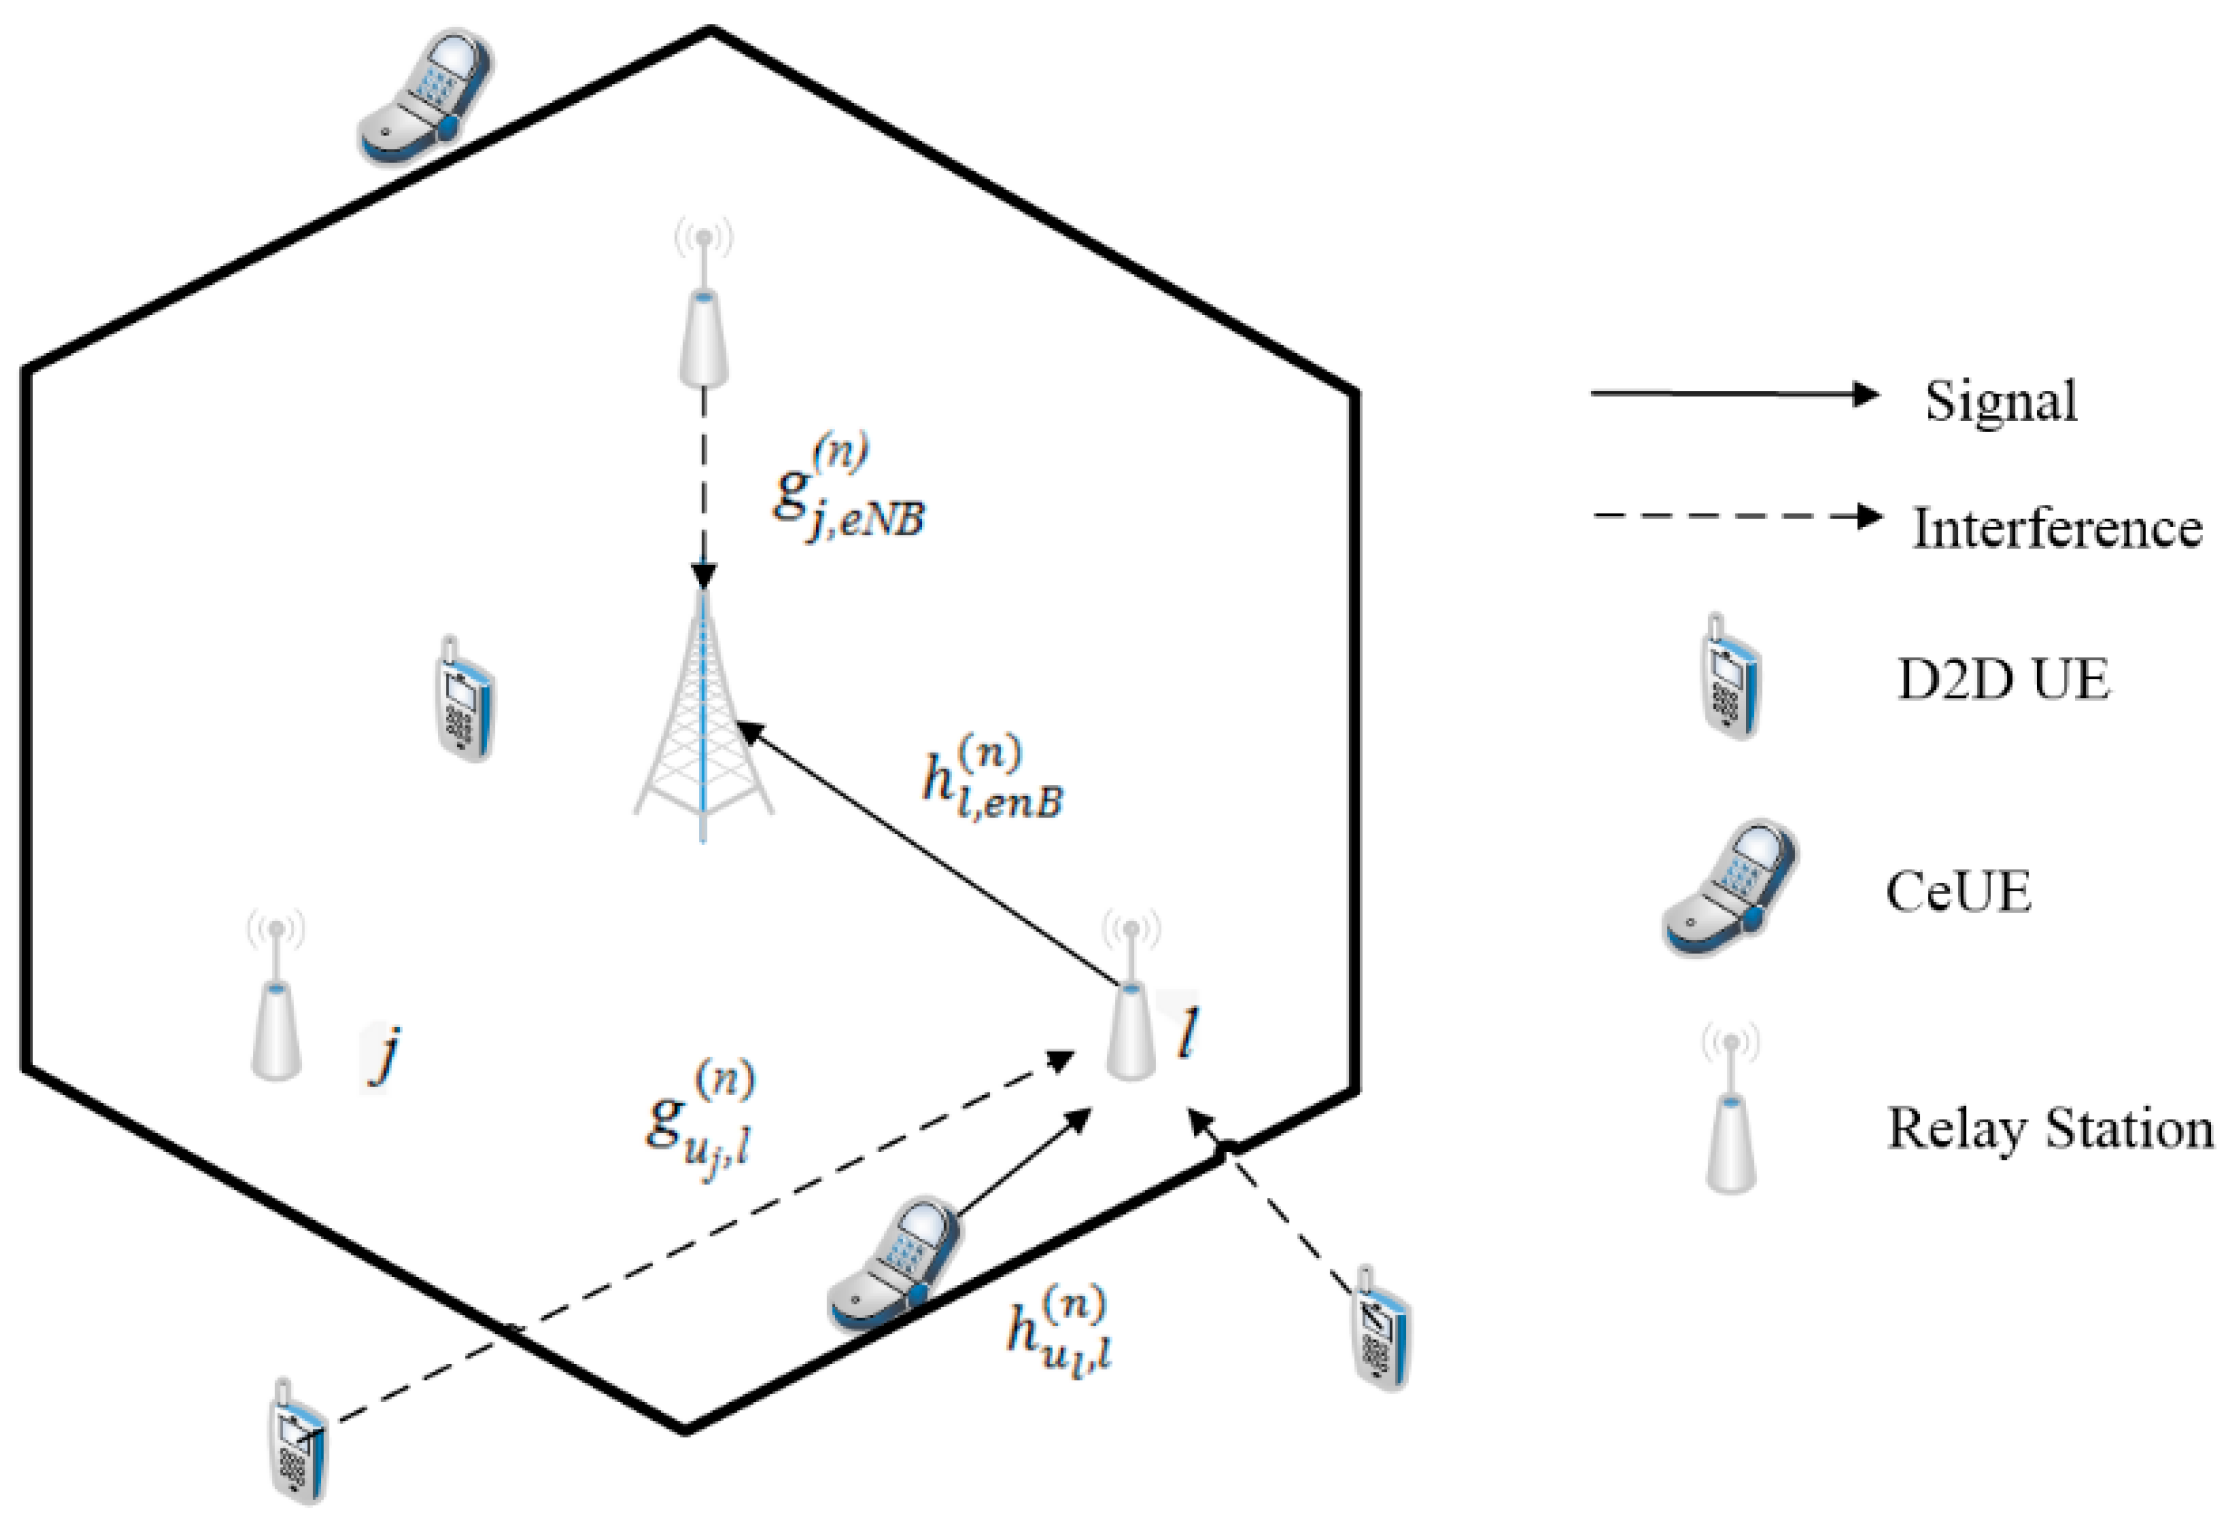
In this paper, the LTE communication systems-based resources allocation issues are investigated. The architecture of the systems is shown in Figure 1. In this hybrid system, D2D UEs and traditional cellular users’ equipment (CeUEs) share all resources. In Figure 1, three relay stations are deployed in the cellular system, where UEs are uniformly and randomly distributed into relay stations. In this study, the base station is located in the center, while the three relay stations form a triangle around the base station. Each relay station signal has a coverage with a radius of 200 m. The CeUEs are uniformly and randomly distributed in each relay station within range. Each D2D pair includes a receiver UE and a transmitter UE distributed at a distance of 80 m from the relay station. The channel models include Raleigh fading, shadowing fading and path loss [17].
In Figure 1, each uplink data transfer includes two hops. In the first hop, the ul-th UE transmits the signal to the lth relay station by the channel gain . The lth relay station relays the transmission to the base station using the nth resource block (RB). However, when the uj-th D2D UE transmits signal to the lth relay station, the interference link gain will be transmitted to the lth relay station.
In this study, the channel models include path loss and shadowing fading. Thus, the fading channel model from UE to relay station (UE-relay) can be expressed by:
where 103.8 is the antenna gain; is shadowing fading with a log-normal distributed random variable where the standard deviation σ = 10; 10log(ζ) is the Rayleigh fading effect; and is the distance between UE to relay station. Similarly, the fading channel model from relay station to BS (relay-BS) can be expressed by [12]:
It is assumed that Base Station (BS) knows the Channel State Information (CSI) of all channels. Thus, the unit Power Signal-to-Interference-Plus-Noise Ratio (Unit Power SINR) of the first hop can be expressed by:
where is the channel gain from the ul-th UE to the lth relay with the nth RB; and or 0. Each UE can only use one RB, with indicating one RB and indicating no RB. Furthermore, is the set of D2D UEs in the jth relay area; and are the transmission power of the ul-th UE and the uj-th CeUE, respectively; is the interference link gain from the uj-th CeUE to the lth relay; . is power spectral density of the added white Gaussian noise (AWGN); and is bandwidth of a RB. Similarly, the unit power SINR of the second hop can be expressed by:
where is the channel gain from the lth relay to the Base Station (eNB) with the nth RB; and are the transmission power of the l-th relay and the j-th relay, respectively; and is the interference link gain from the jth relay to the eNB with the nth RB.
In this study, there are two links in the second hop. Equation (4) expresses the SINR of the lth relay station to BS. Similarly, the SINR of the lth relay station to the receiver of D2D pair can be expressed by:
In Equations (3) and (5), the SINR for all links will be obtained. After this, After this, the throughput (Kbps) of the first hop can be derived by:
Similarly, the throughput of the second hop can be obtained by:
Thus, the throughput for the nth RB by the user ul can be obtained by:
According to Equation (8), the total throughput of N RBs is . All UEs are desired to obtain the RBs to reach the maximal throughput. Therefore, to avoid deterioration of the communication quality, a threshold is set to meet the required throughput for most UEs. Some constraints are set to perform the optimization problem as:
where Equation (9) set the constraints for that each UE use only one RB and the constraints on the minimum power for UEs and relay stations. Moreover, Equation (9) is the minimum throughput requirements of QoS for UEs
Moreover, the interference of the first hop and the second hop for system is expressed by:
and
respectively.
In the system model, it is assumed that the base station coverage area is a circle with a radius of 175 m. In this area, there are three relay stations that are uniformly deployed with a triangle, as shown in Figure 1. The coverage area of each relay station is a circle with a radius of 100 m. The cellular UEs are uniformly and randomly distributed around the relay station. D2D pairs are deployed on a circle with a radius of 80 m around each relay station as shown in Figure 2. The numbers of UEs in the relay station are the same. It is assumed that the CSI of the links are known to the base station. The simulation parameters are listed in Table 1.
3. PSO-Based Resource Allocation
PSO algorithms are used to simulate the bird swarm foraging situation, which involves the search for food space with particles. Each particle simulates a bird in addition to its own normal movement, which also follows its own best moving experience. The personal best experience is denoted by spbest. After this, the global experience is referred from the group’s best moving experience as the global best, which is denoted by sgbest. According to the above-mentioned types of data with an iterative evolution, the final convergence obtains the optimal solution.
In this study, the number of particles is M and the value of the particle’s target function points to the efficiency of the iteration. The particle with the highest target function value is the best solution. A simplified formula for particle swarm optimization, which is called SPSO, is proposed to improve the performance of the resource allocation for D2D communication systems. The SPSO algorithm performs the optimization of resource block allocation, while all the relay stations cover the UEs of the allocated RB as the particle si. The particle is uniformly distributed in the solution space. A total of 13 RBs and 3 relay stations are available. The moving velocity of the first particle in the (g + 1)-generation is expressed by:
where is the position vector of the ith particle in g-generation; ; and is the position of the ith particle of the lth relay station. The local optimal positions of all particles are denoted by , where is the local optimal position of the lth relay station. is the global optimal positions of all particles in the nearest generation. Both c1 and c2 are the acceleration coefficients, which is called the individual factor and social factor, respectively. Generally, the factors are set by and . The rand() is the random function that is uniformly distributed in the range of [0,1].
Moreover, the position updating at (g + 1)-generation can be expressed by:
In SPSO, all the K UEs distributed in the coverage area of relay station are allocated RBs and composited as a particle with an array of 1 × K. The M particles are uniformly distributed in the solution space, while a total of 13 RBs are available to be allocated to the UEs in three relay stations.
In SPSO, the object function is defined by:
where is the system capacity and is defined by:
The procedure of SPSO algorithms applied in this study can be described by the following example with K = 18 and M = 3:
- (1)
- Initialization (g = 1): Generate the positions of M particles with , i = 1, ..., M and velocity; and , i = 1, ..., M. One example of the position of a particle can expressed by = [1 1 3 4 5 6│ 2 8 3 11 11 13│1 6 7 8 4 9].
- (2)
- Calculate the objective function value of all particles according to Equation (8) and find the and for this generation. One example of and can be = [1 1 3 4 5 6]; = [7 8 9 10 11 12]; = [1 3 4 5 7 6] and = [3 4 5 6 7 5│7 8 9 10 11 12│1 3 4 5 7 6], respectively.
- (3)
- Let g = g + 1. According to step (2), we calculate the speed and position of the next generation (g + 1) particle after one generation calculation. After this, One example of the position can be = [2 3 1 4 5 6│9 7 6 11 13 10│1 6 7 8 4 9].If the number of generations g < G, return to step (2) to update the individual optimal solution and the population optimal solution. One example can be: no change in the previous by = [1 1 3 4 5 6]. However, the other two individual optimal solutions is updated by = [9 7 6 11 13 10] and = [2 7 8 9 3 5], respectively. Moreover, the new is updated according to the object function by = [2 3 1 4 5 6│ 9 7 6 11 13 10│1 6 7 8 4 9].
- (4)
- If the number of generations is g = G, the calculation ends.
After this, After N(N < G) generations, one of the positions is selected by = [8 4 5 7 3 2│ 7 8 9 10 11 12│1 5 4 9 6 7]. The global optimal solution is obtained by = [2 3 1 4 5 6│9 7 6 11 13 10│1 6 7 8 4 9]. Hence, in this PSO calculation, the solution is = [2 3 1 4 5 6│9 7 6 11 13 10│1 6 7 8 4 9].
To upgrade the effectiveness of SPSO, according to the system schema of the relay station partition characteristics of SPSO for optimization, the learning factor with weight parameters cw1 and cw2 are added to Equation (13) to speed up optimization searching in this present study. This PSO is called Refined PSO (RPSO). After this, its next generation of evolution speed of particle can be obtained by:
where and are 1 × K vectors, where K is the number of UE. Both are weighted for adjusting the searching efficiency of particles.
The modifying rule of is as follows:
- (1)
- for when the RB of the ul-th UE in does not conflict with the RBs of other relay stations.
- (2)
- for when the RB of the ul-th UE in conflicts with the RBs of other relay stations once.
- (3)
- for when the RB of the ul-th UE in conflicts with the RBs of other relay stations more than once.
The modifying rule of is as follows:
- (1)
- for when the RB of the ul-th UE in does not conflict with the RBs of UEs of other relay stations. for g > 10.
- (2)
- for when the RB of the ul-th UE in conflicts with the RBs of other relay stations once or more times in g ≤ 10.
4. RB Allocation with GA Discussion
In genetic algorithms (GAs) [16,18,19], the main idea is to follow the evolutionary laws of fitness in nature by the procedures of selection, crossover and mutation to improve the fitness value of chromosomes. With GA, there are random searches and other ways to search for the optimal solution. Therefore, the GA is often applied for resolving optimization issues. In this study, the GA is applied for optimization of resources allocation with the objective functions for maximizing system capacity and throughput.
The procedures in GA are as follows: (1) data coding, (2) producing initial population, (3) calculation fitness values, (4) selection, (5) crossover and (6) mutation. The procedures are proceeded as shown in Equation (3)–(6) until meeting the terminated conditions. After this, the solution are obtained as the optimal results.
The accordance of the parent group with the fitness value of chromosomes is used to determine whether it will be retained or eliminated. In the selected operation in this study, the ranking method ranks the fitness value of each chromosome. This method can avoid inbreeding [10].
The crossover of GA involves selecting two chromosomes from the mating pool and swapping the genes into two new chromosomes. It is expected that crossover procedures can generate better offspring chromosomes. Higher crossover rate in GA will bring the higher evolutional rate for the chromosomes.
The mutation can increase the ethnic diversity of GA operations. The aforementioned selection, crossover and other procedures in both groups search for better children but its genetic characteristics must be associated with the parent. Because there are no new chromosomes joining the group in each generation, it means that the searching area cannot be expanded. It will result in the evolution converging earlier. However, through mutation, some new chromosomes will join the search space to avoid GA early convergence problems.
In GA the object function is defined by:
where is the system capacity and is defined by
5. Simulation Results
5.1. PSO
The simulation parameters that are based on SPSO and RPSO are shown in Table 2. In Figure 3, simulation results show that when the total number of UEs are K = 12, the system capacity reaches 12 UEs. However, when K = 18, the system capacity reaches 16.5 UEs. Moreover, when K = 24, the system capacity is 18.3 UEs.
Figure 4 shows the comparisons between the proposed SPSO with c1 = c2 = 2, M = 10 and random allocation methods. The random method (Rand) is performed by randomly allocating the RBs to the UEs in each generation. However, the system retains the best results for the next generation based on the same object function as SPSO. From Figure 4, it is easy to observe that the proposed SPSO outperform the Rand at the 20th iterations and significantly improve the system capacity to 16 UEs at the 100th iterations, which is 2 UEs more than that of Rand.
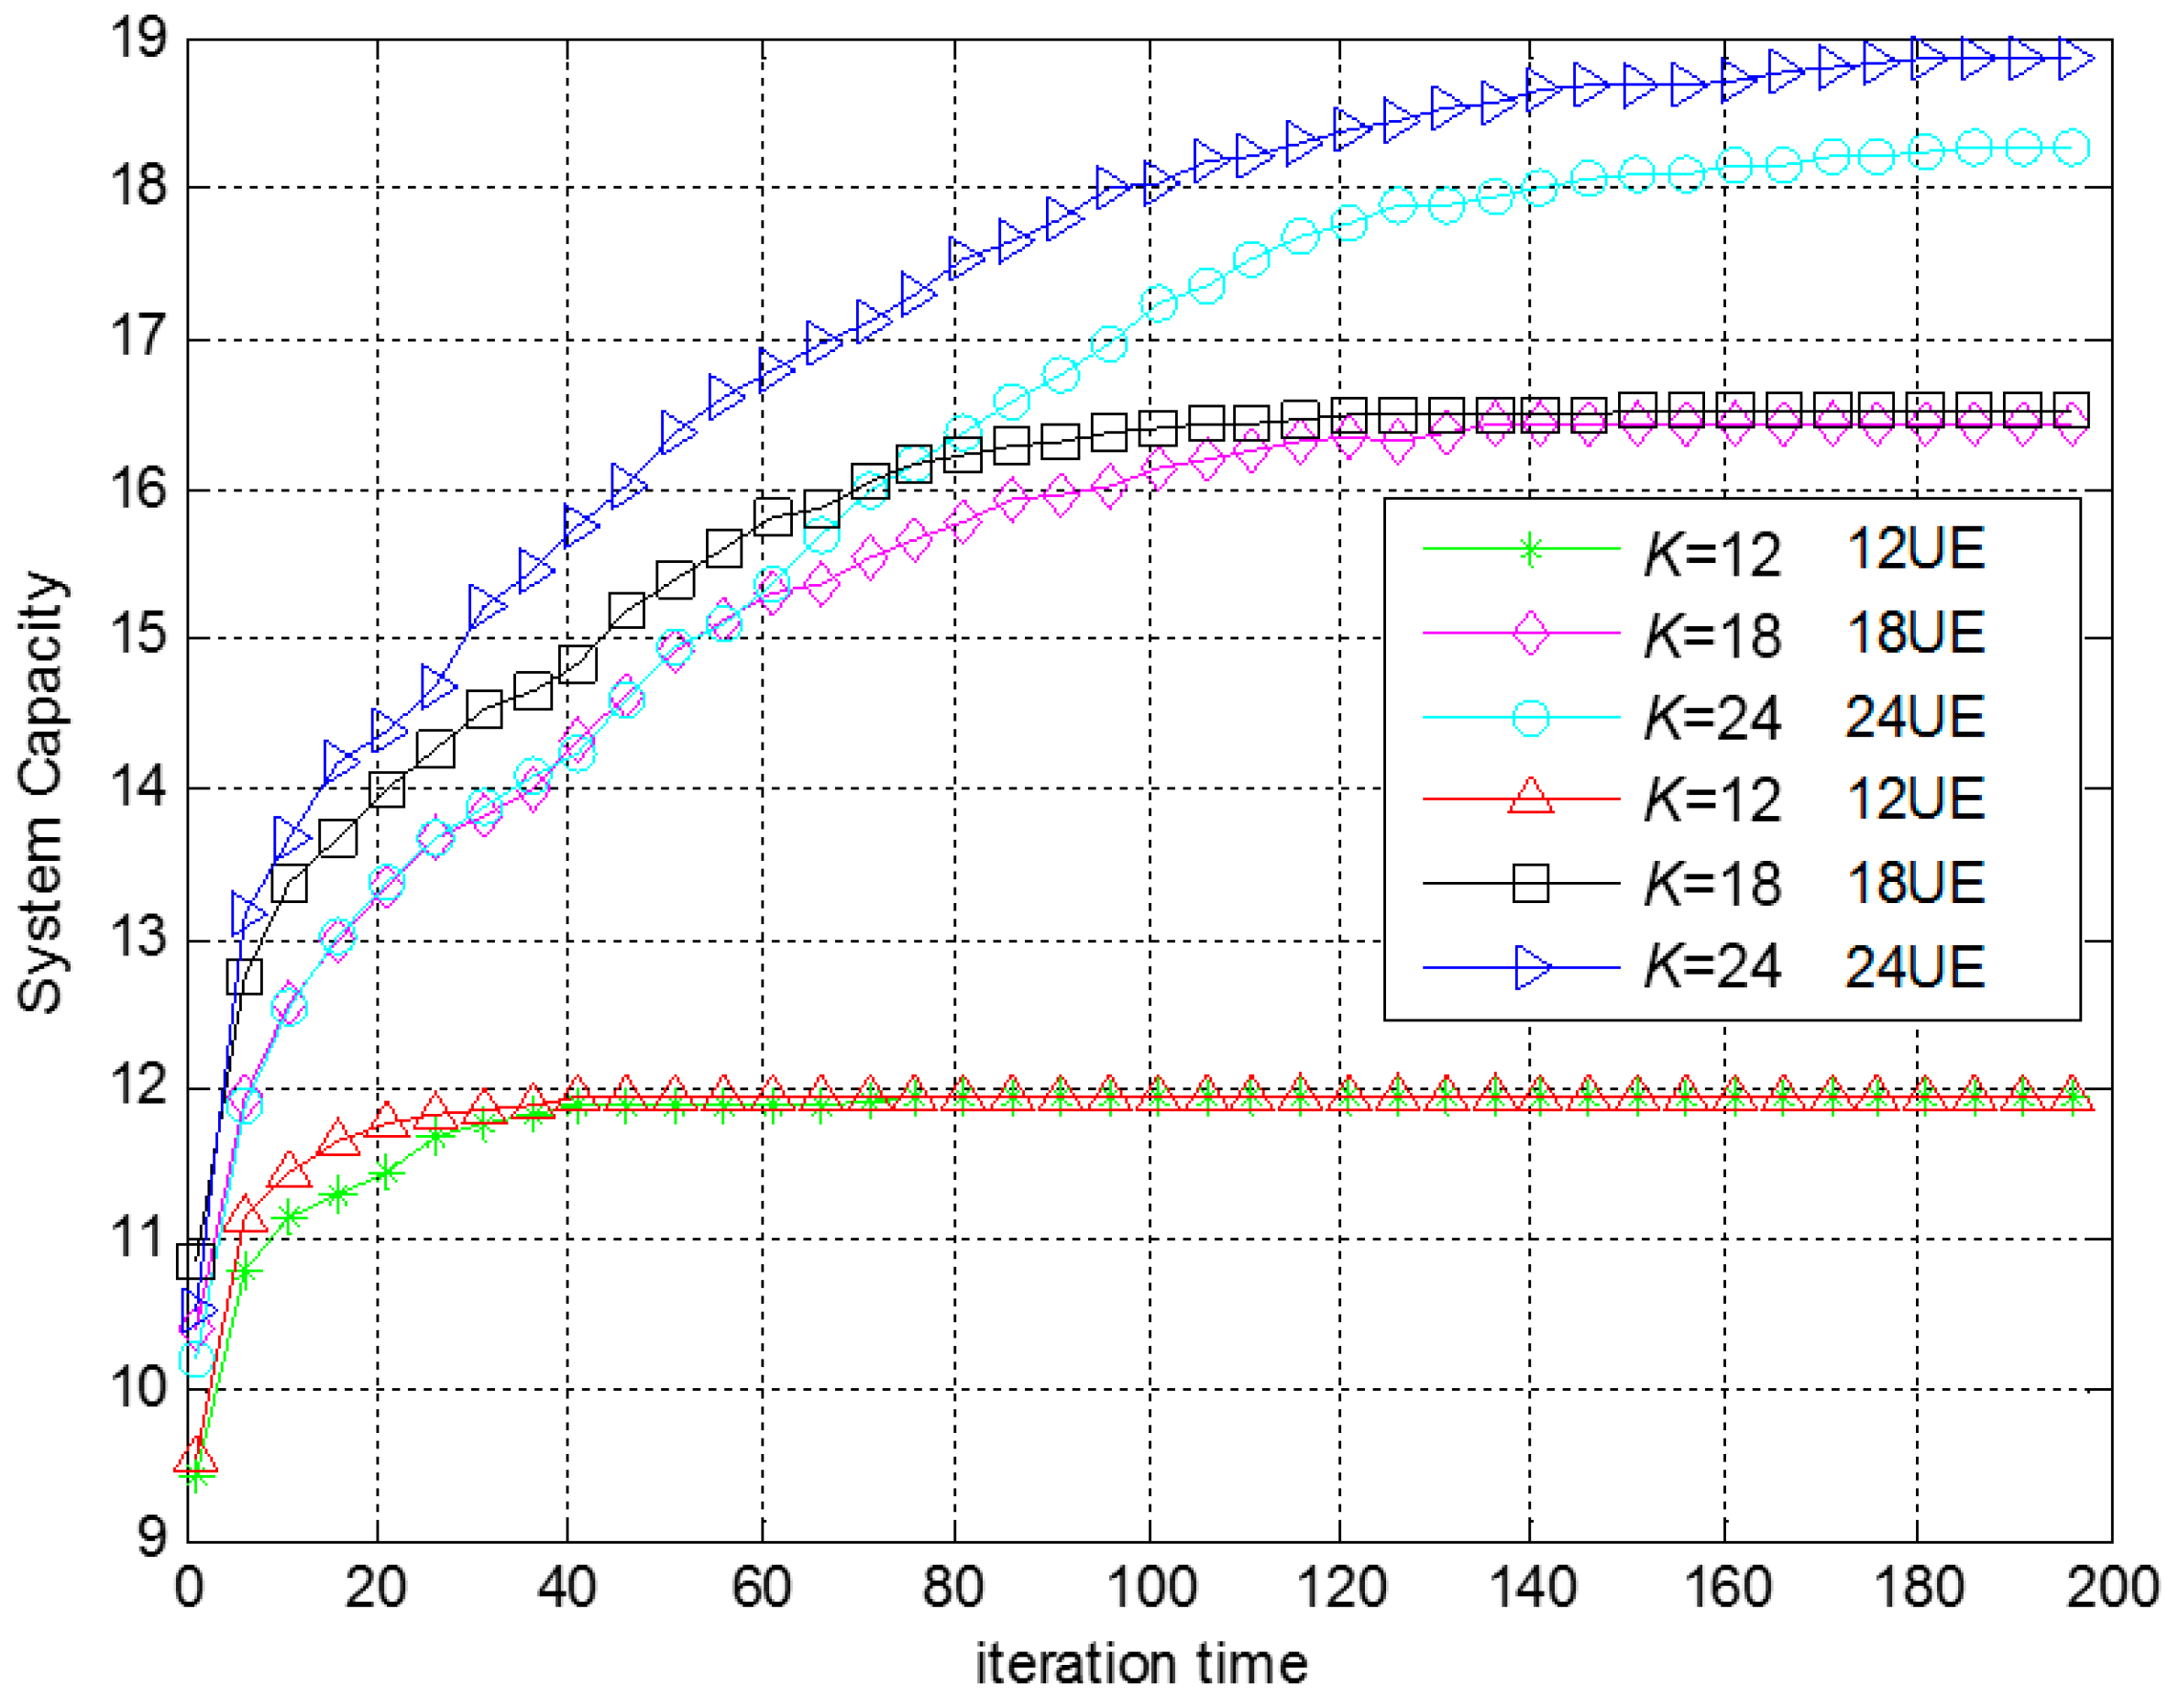
Figure 5 shows the comparisons between RPSO and SPSO. In Figure 5, it is shown that RPSO converge to the optimal solution more quickly compared to the SPSO algorithm for K = 12. Moreover, for K = 18 and K = 24, the system capacity of RPSO outperforms SPSO.
Table 3 shows the performance comparisons of SPSO, RPSO and random allocation (Rand) for K = 12, 18 and 24, with M = 10 and c1 = c2 = 2. Compared with the Rand, SPSO algorithm can improve the efficiency by about 17–20% for K = 18 and 24. Moreover, the proposed RPSO algorithm can improve the efficiency by 18–24% compared to Rand.
5.2. GA
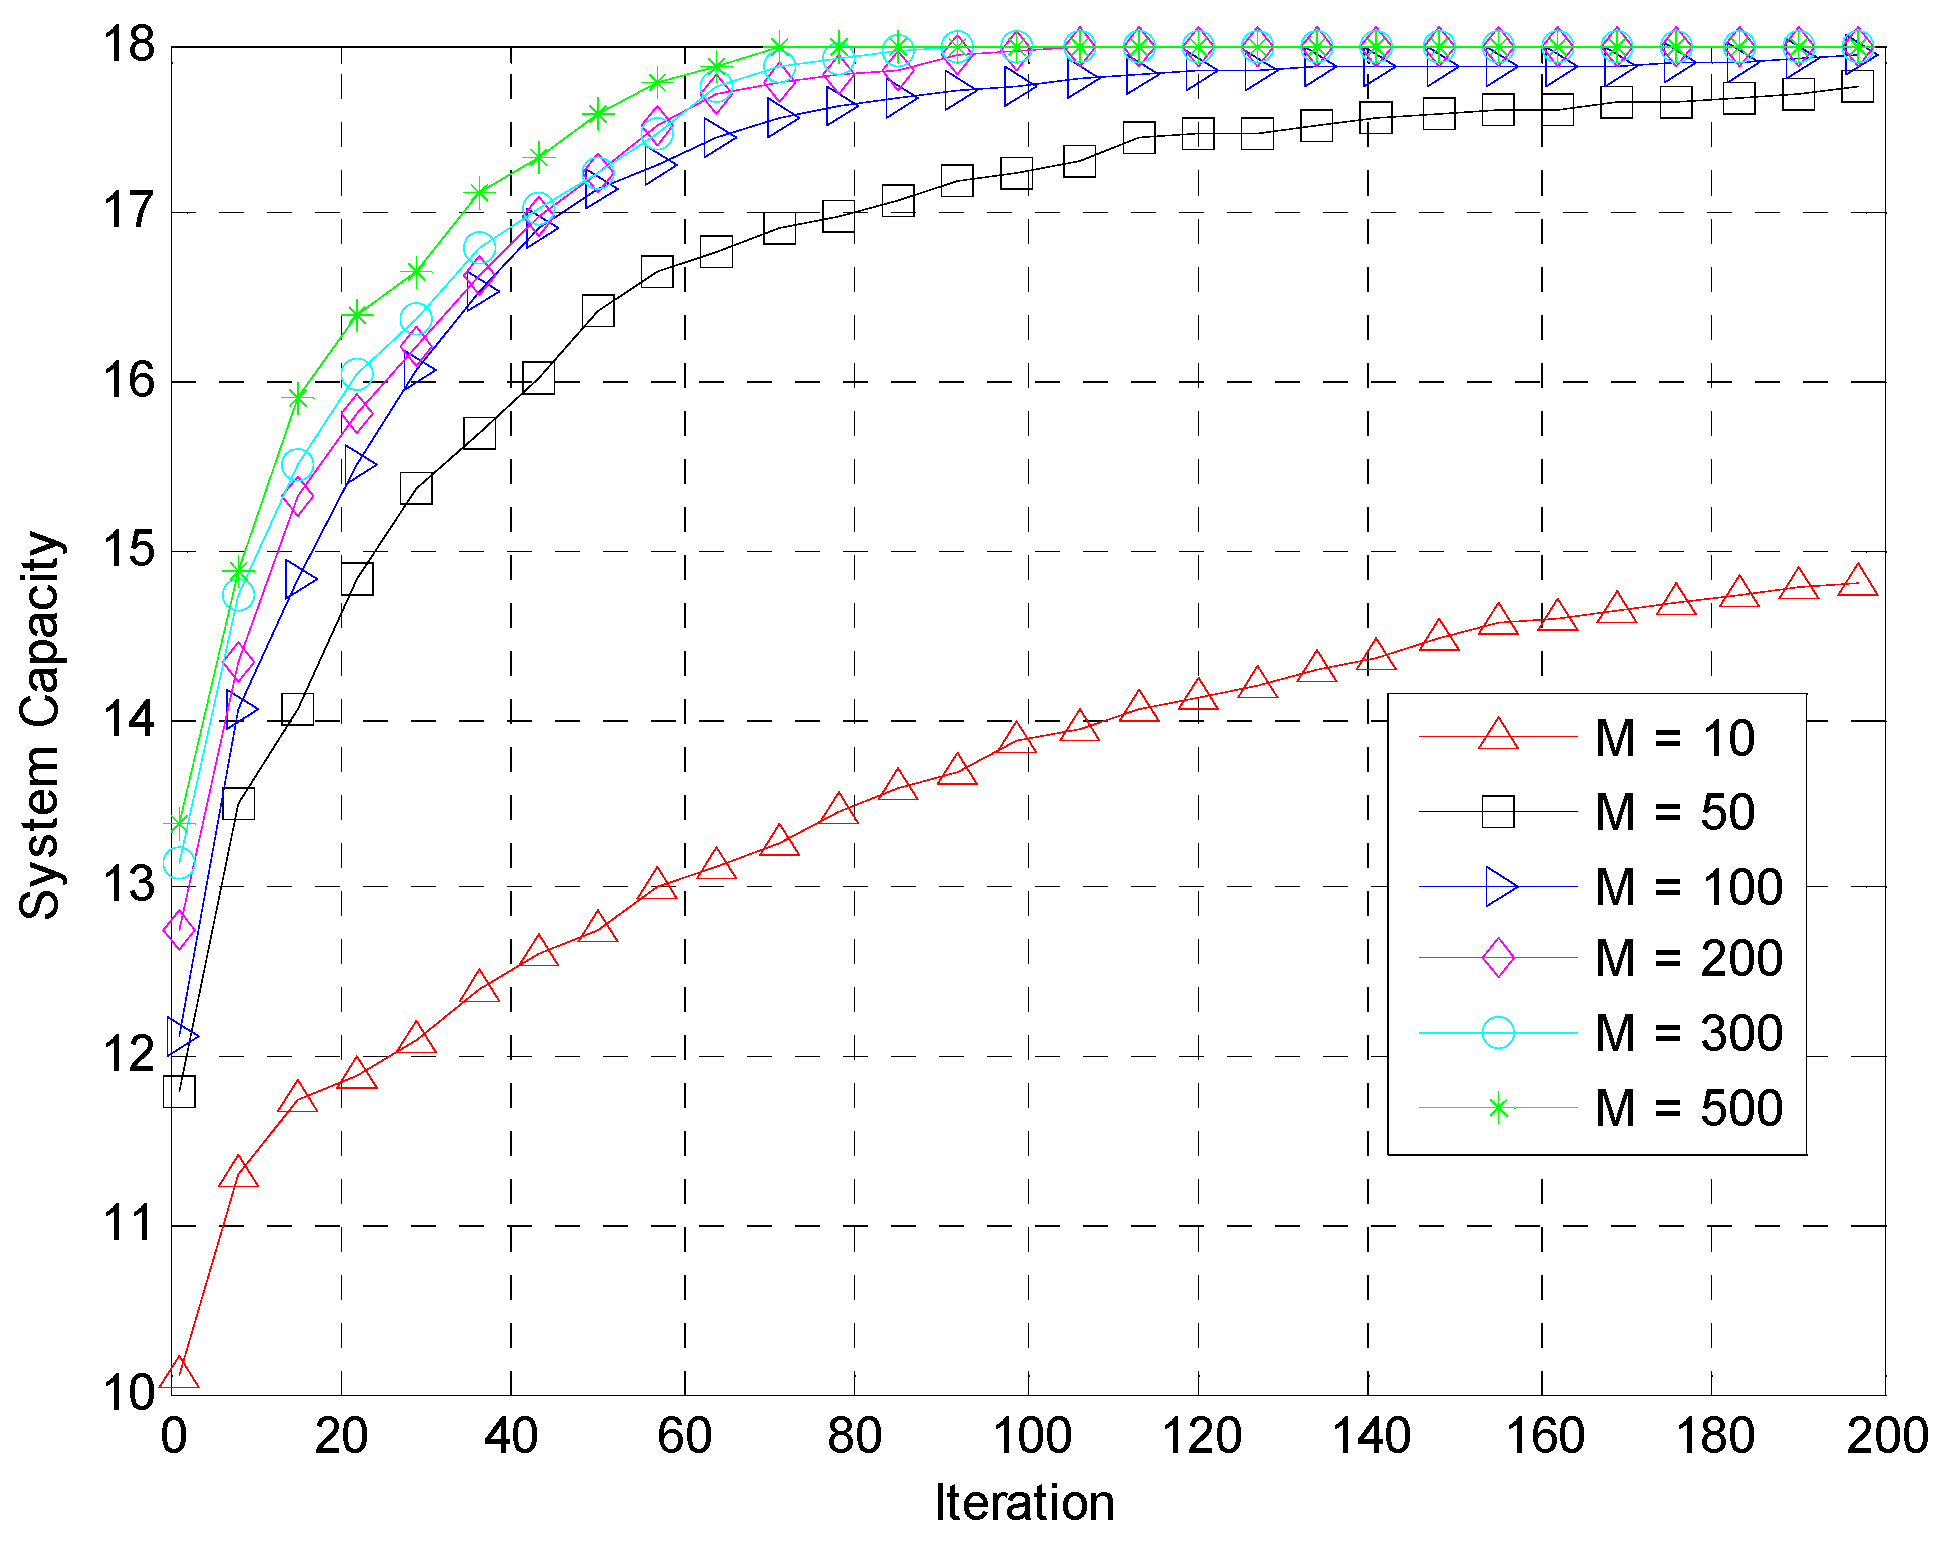
The simulation parameters based on GA are shown in Table 4. Figure 6 shows the system capacity for different population sizes in GA with K = 18. The objective function is in Equation (13). When M = 10, the system capacity performance can reach 15 UEs. However, when M ≥ 100, the system capacity reaches saturation with a near optimal solution with 18 UEs. From Figure 6, it is observed that the large population size can reach the optimal solution.
5.3. QoS Based Capacity Maximization
In this section, the Quality of Service (QoS) based system capacity maximization are investigated by the proposed RPSO. The QoS based multi-object function can be written as:
where α is the weighting factor for the balance between capacity and throughput, while the object function for system throughput is defined by:
where or 0. Each UE can only use one RB, where indicates one RB and is the throughput for the nth RB used by the user ul.
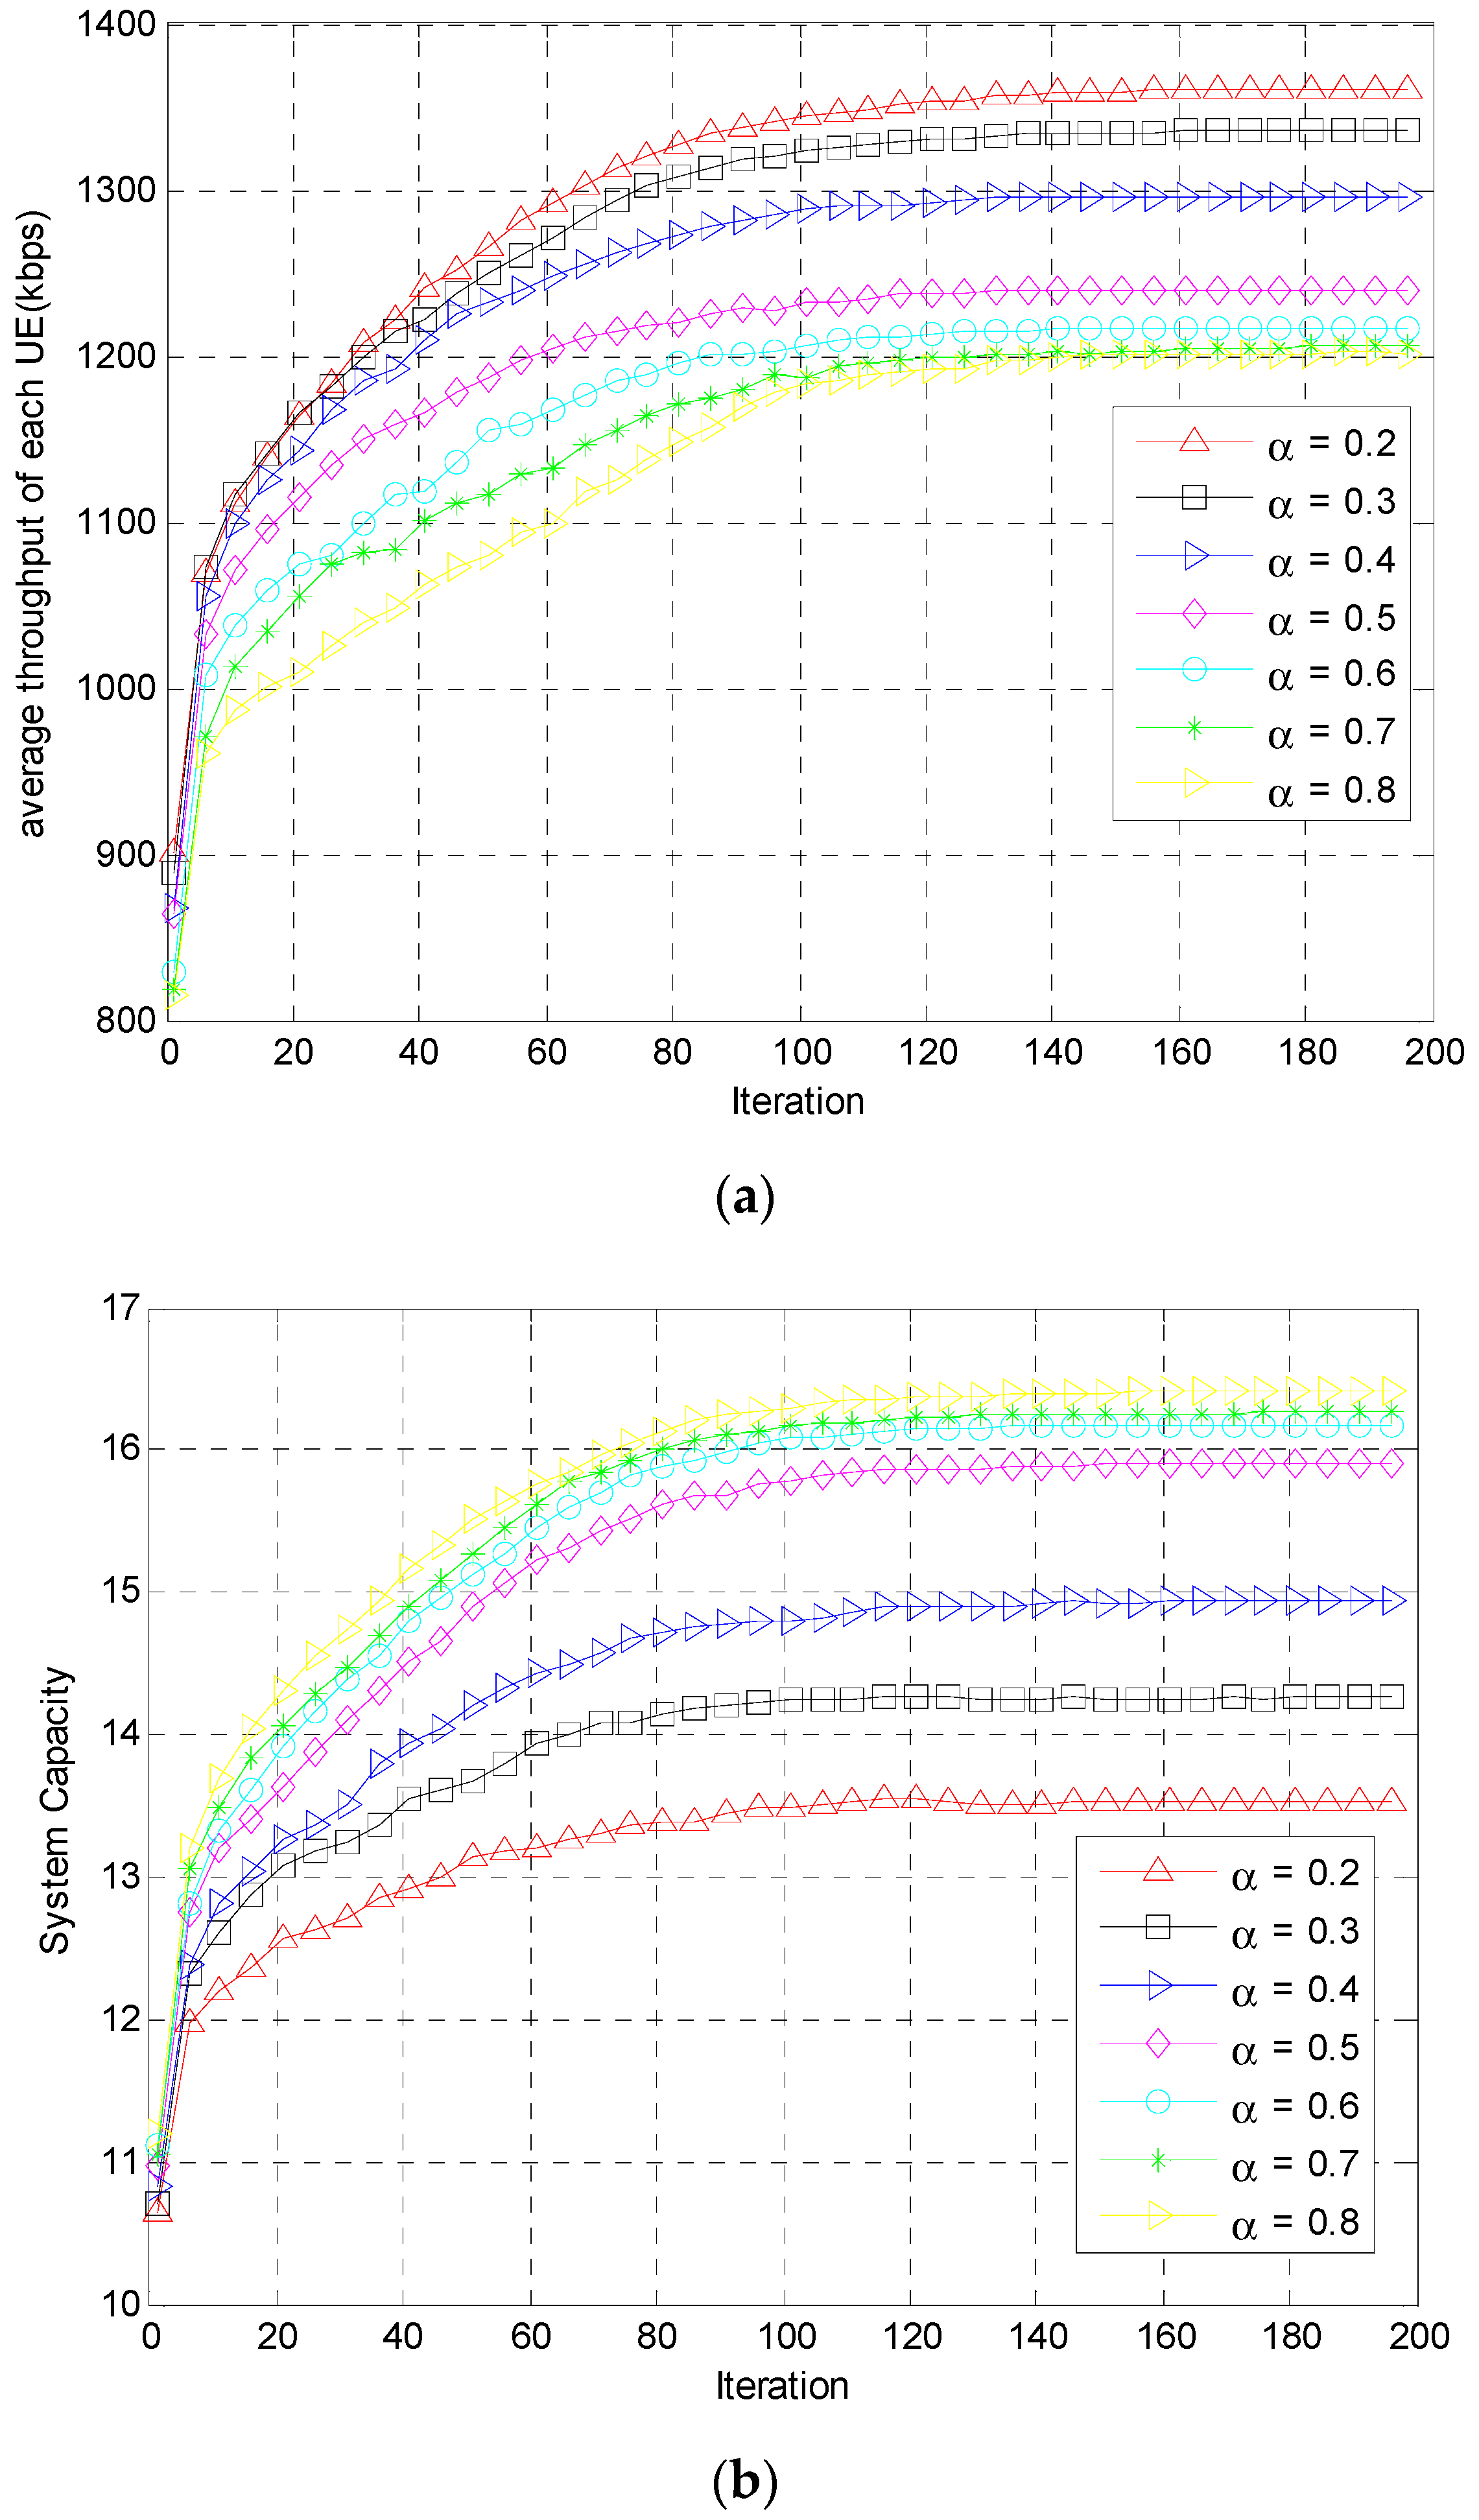
Figure 7 shows the simulated results with different weight values for UE = 18, which respectively represent the transmission capacity and system capacity of each UE. In Figure 7a, during the period of about the first 10 generations of this period, the rate of increase in the average throughput is similar regardless of the numerical value, indicating that the weight value has little effect. However, after the number of generations exceeds 10 generations, the weighting starts to have an effect. A smaller weight value results in a larger amount of transmission. Figure 7b shows that after more than 10 generations, a larger weight results in a larger system capacity. This result indicates that there is a conflict between maximizing the system capacity and the individual throughput of UEs.
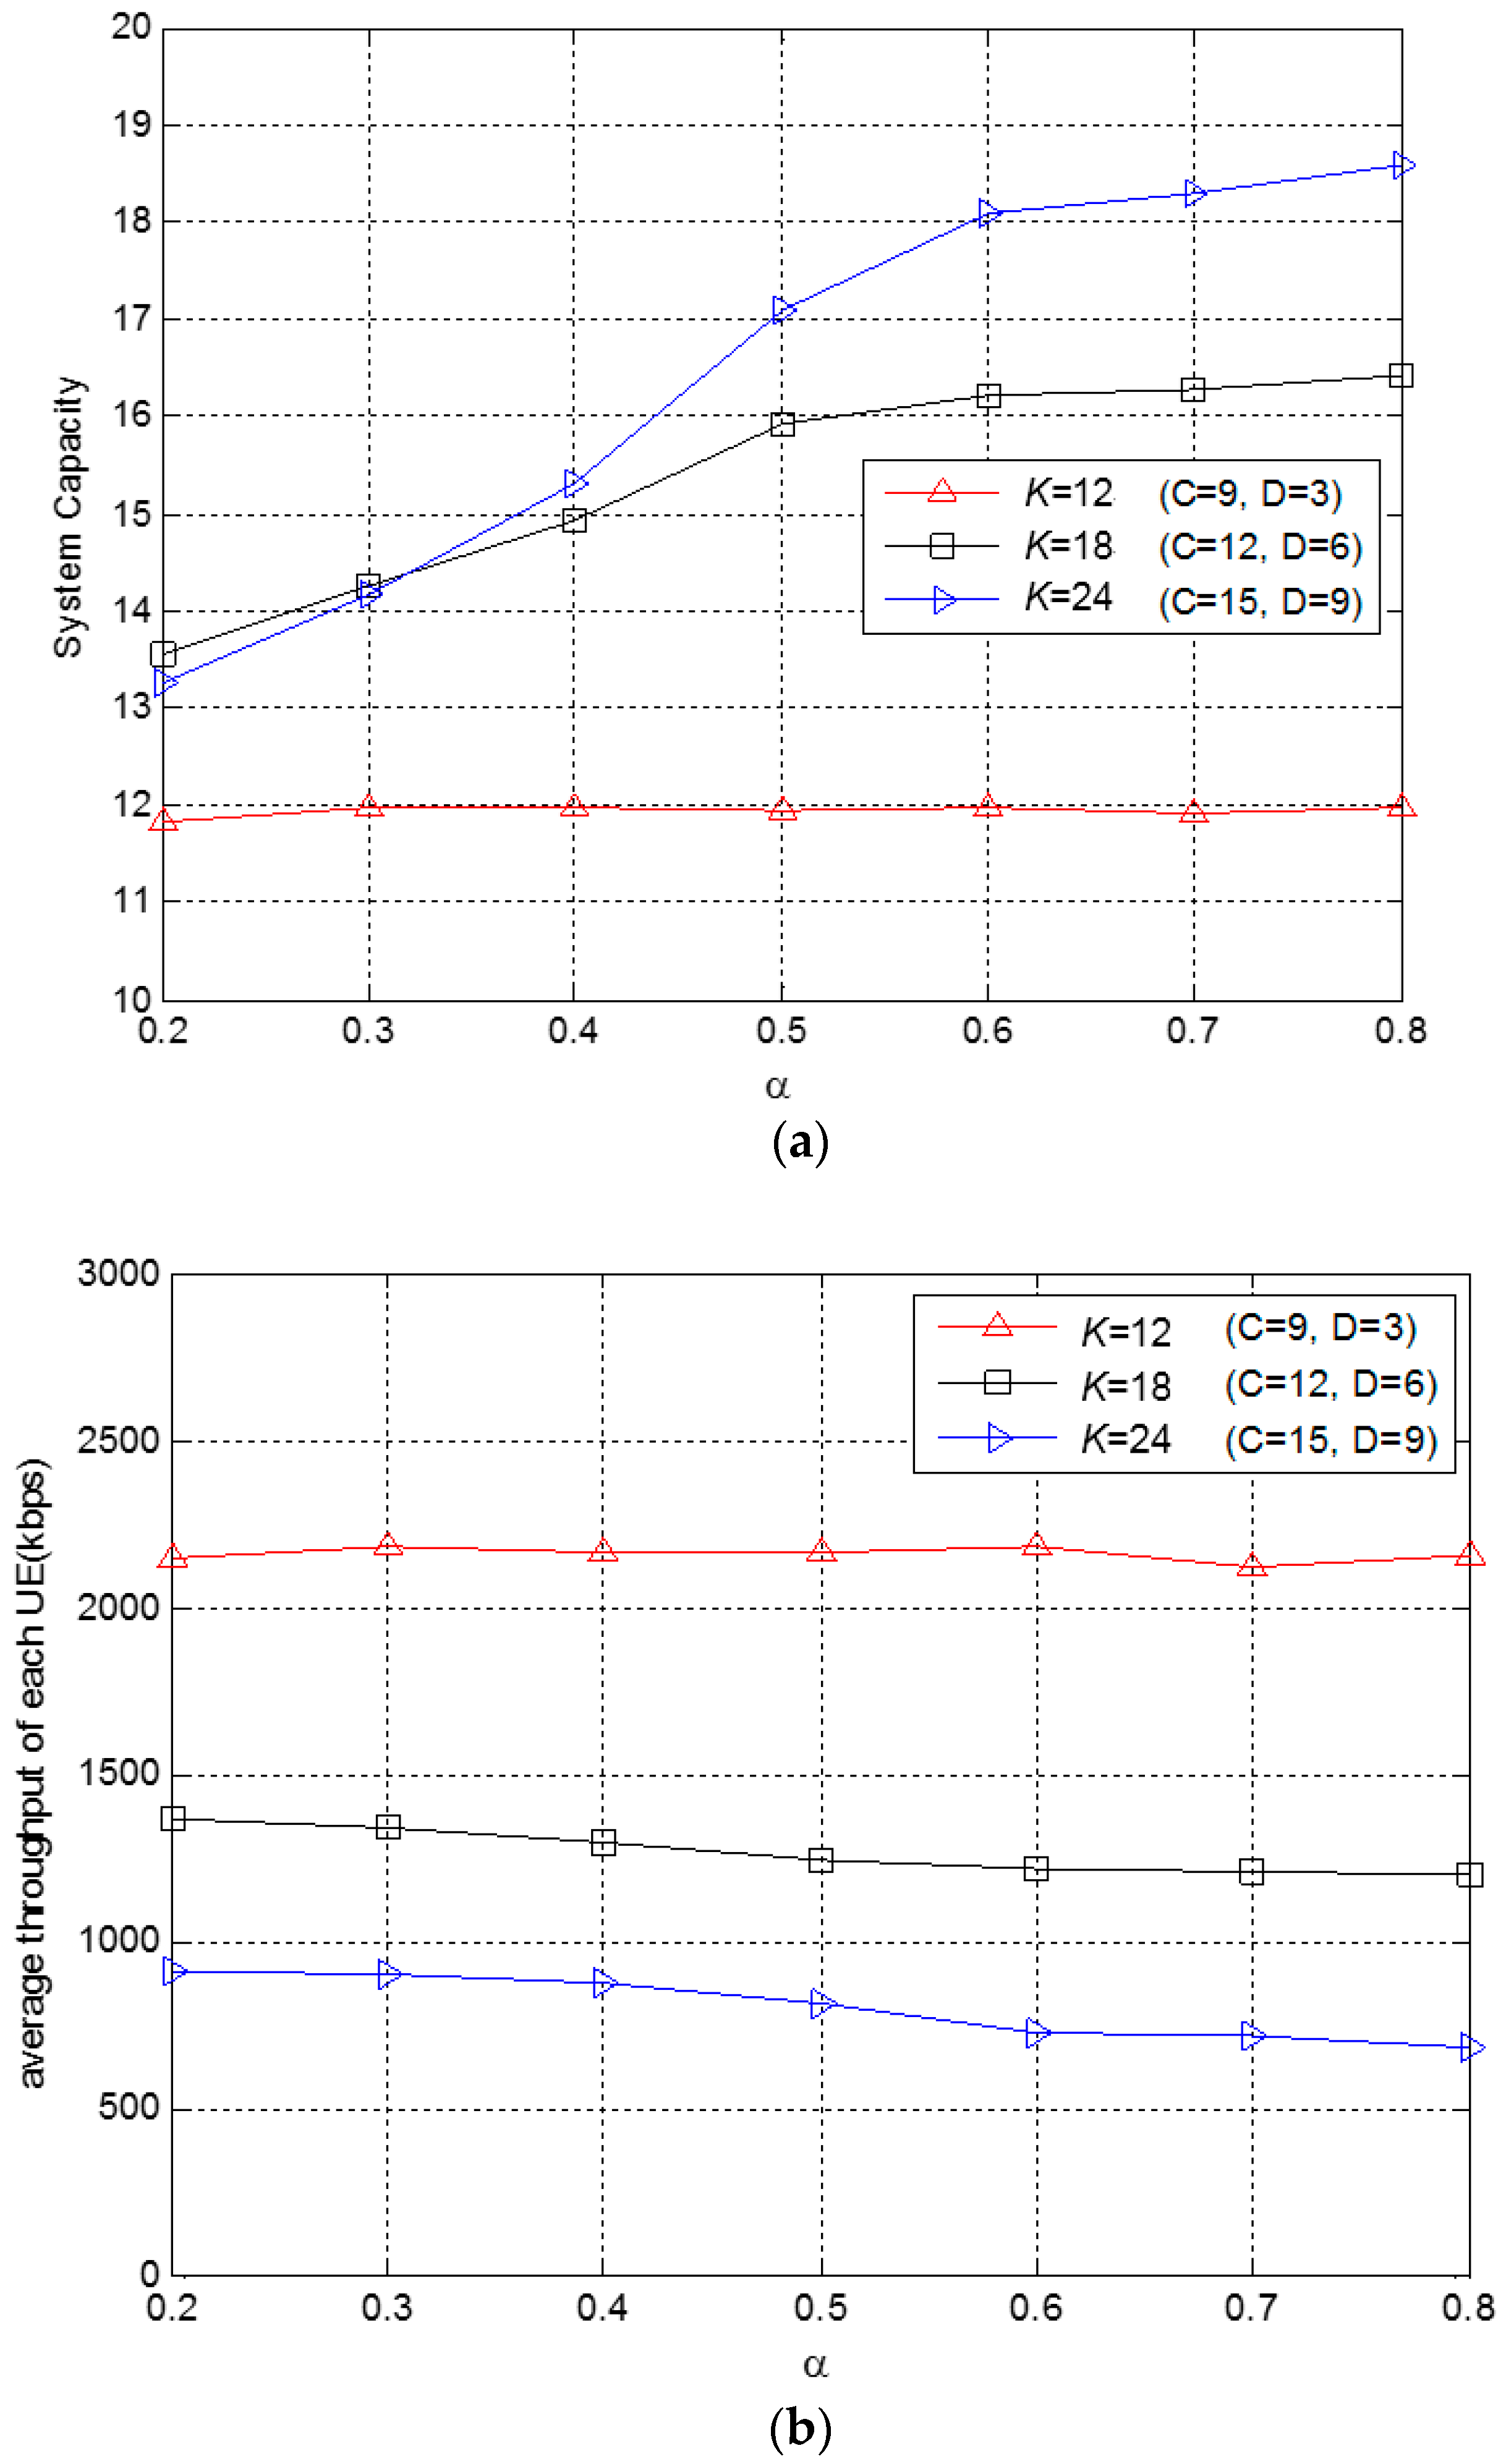
Figure 8 shows the comparison between the system capacity and the throughput obtained for K = 12, 18 and 24. In Figure 8a, if more UEs are found, there is a greater difference in the performance, indicating that the transmission capacity and system capacity are increasing. After the complex situation is raised to a certain value, the mutual influence is greater and the difference is the largest at 0.5–0.6.
In this study, the system capacity is taken as the higher priority requirement and the weighting is set to 0.6 according to Figure 8. Under this weighting parameter, the system capacity can reach close to 16 UEs when K = 18. Moreover, Figure 8b shows the comparison of the throughput of each UE under the condition of α = 0.2–0.8. When α = 0.6 and K = 18, the throughput can still reach 1300 Kbps and the system capacity can reach 16 UEs. Therefore, with the proposed multi-objective function, there is a throughput of approved transmission and guaranteed system capacity.
6. Discussion
In this section, we compare the computational complexity of each algorithm. We compare the total calculations by the number of times that the multiplication and addition operations were used. We assume that there are N UEs with G generations and the number of population sizes is M. Thus, for the complexity of one-generation PSO with an object function of (13), 4N × M multiplication operations and addition operations are needed. In updating the local best of pbest and the global best of gbest, in the objective function (15), it requires 117N × M multiplication operations and (26N + 38) × N × M addition operations. Moreover, (3M − 1) addition operations are required for the loop operation. Thus, the total computational complexity of applied PSO can be obtained by ((26N + 42) × N + 3) × M × G addition operations and 121N × M × G multiplication operations.
Similarly, the complexity of one-generation of GA can be found. For the complexity of objective function for all genes, you need 117N × M multiplication operations and (26N + 38) × N × M addition operations. For the selecting operation, an addition operation is required. With the crossover operation, 0.9 (crossover rate) × M addition operation is required. With the mutation operation, 0.07 (mutation rate) × M addition operation is required. Thus, the total computational complexity for applied GA is 117N × M × G multiplication operations and (0.97(26N + 38) × N) × M × G addition operations.
According to the above analysis, the computational complexity of the two applied algorithms mainly depends on the execution number of the objective function. When the execution number of the objective functions is the same, the computational complexity of the two algorithms can be considered to be nearly the same. Compared to the comprehensive search method, it is necessary to perform 13N× (26N + 38) addition and 13N× 117 multiplication operations to find the optimal solution. The computational complexity of these two applied algorithms is far less than the comprehensive search method but a sub-optimal solution can be obtained.
7. Conclusions
In this paper, the PSO algorithm is proposed to optimize the resource allocation in the D2D system. Simulation results show that resource allocation optimization is achieved using the proposed RPSO as this can significantly improve the system capacity performance. In this paper, the GA is proposed to optimize resource allocation in D2D systems. Simulation results show that the proposed GA can improve the system capacity performance. With a population size of M = 100 and number of generations of g = 200, the proposed GA can outperform the proposed SPSO 1.8 users for system capacity.
Author Contributions
T.-H.T. and Y.-F.H. conceived and designed the experiments; B.-A.C. performed the experiments; T.-H.T. and Y.-F.H. analyzed the data; T.-H.T. contributed analysis tools; Y.-F.H. wrote the paper.
Funding
This research was funded by Ministry of Science and Technology of Taiwan under Grant MOST 106-2221-E-324-020 and MOST 107-2221-E-027-106.
Conflicts of Interest
The founding sponsors had no role in the design of the study; in the collection, analyses, or interpretation of data; in the writing of the manuscript, and in the decision to publish the results.
References
- Yun, L.; Le, Z.; Xin, T.; Bin, C. An advanced spectrum allocation algorithm for the across-cell D2D communication in LTE network with higher throughput. China Commun. 2016, 13, 30–37. [Google Scholar]
- Camps-Mur, D.; Garcia-Saavedra, A.; Serrano, P. Device-to-device communications with Wi-Fi direct: Overview and experimentation. IEEE Wirel. Commun. 2013, 20, 96–104. [Google Scholar] [CrossRef]
- 3GPP-The Mobile Broadband Standard (Rel. 14). Available online: http://www.3gpp.org/ (accessed on 30 March 2018).
- Hara, S.; Prasad, R. Multicarrier Techniques for 4G Mobile Communications; Artech House: Boston, MA, USA; London, UK, 2003. [Google Scholar]
- Hasan, M.; Hossain, E. Resource Allocation for Network-Integrated Device-to-Device Communications Using Smart Relays. In Proceedings of the IEEE Globecom Workshops, Atlanta, GA, USA, 9–13 December 2013; pp. 591–596. [Google Scholar]
- Babun, L. Extended Coverage for Public Safety and Critical Communications Using Multi-Hop and D2D Communications. Master’s Thesis, Department of Electrical Engineering, Florida International University, Miami, FL, USA, March 2015. [Google Scholar]
- Tsiropoulou, E.E.; Kapoukakis, A.; Papavassiliou, S. Energy-Efficient Subcarrier Allocation in SC-FDMA Wireless Networks Based on Multilateral Model of Bargaining. In Proceedings of the IFIP Networking Conference, Brooklyn, NY, USA, 22–24 May 2013; pp. 1–9. [Google Scholar]
- Tsiropoulou, E.E.; Kapoukakis, A.; Papavassiliou, S. Uplink resource allocation in SC-FDMA wireless networks: A survey and taxonomy. Comput. Netw. 2016, 96, 1–28. [Google Scholar] [CrossRef]
- Chen, K.-Y.; Kao, J.-C.; Ciou, S.-A.; Lin, S.-H. Joint Resource Block Reuse and Power Control for Multi-Sharing Device-to-Device Communication. In Proceedings of the 2016 IEEE 84th Vehicular Technology Conference (VTC-Fall), Montreal, QC, Canada, 18–21 September 2016; pp. 1–6. [Google Scholar]
- Lin, S.-H.; Chen, K.-Y.; Kao, J.-C.; Hsiao, Y.-F. Fast Spectrum Reuse and Power Control for Device-to-Device Communication. In Proceedings of the 2017 IEEE 85th Vehicular Technology Conference (VTC Spring), Sydney, Australia, 4–7 June 2017; pp. 1–5. [Google Scholar]
- Wang, L.; Peng, T.; Yang, Y.; Wang, W. Interference Constrained D2D Communication with Relay Underlaying Cellular Networks. In Proceedings of the IEEE Vehicular Technology Conference, Las Vegas, NV, USA, 2–5 September 2013. [Google Scholar]
- Rodrigues, T.G.; Suto, K.; Nishiyama, H.; Kato, N. A PSO Model with VM Migration and Transmission Power Control for Low Service Delay in the Multiple Cloudlets ECC Scenario. In Proceedings of the IEEE International Conference of Communications, Paris, France, 21–25 May 2017. [Google Scholar]
- Huang, Y.-F.; Tan, T.-H.; Chen, B.-A.; Liu, S.-H.; Chen, Y.-F. Performance of Resource Allocation in Device-to-Device Communication Systems Based on Particle Swarm Optimization. In Proceedings of the 2017 IEEE International Conference on Systems, Man, and Cybernetics (SMC2017), Banff, AB, Canada, 5–8 October 2017. [Google Scholar]
- Goldberg, D.E. Genetic Algorithm in Search, Optimization, and Machine Learning; Addison-Wesley: Boston, MA, USA, 1989. [Google Scholar]
- Tan, T.-H.; Huang, Y.-F.; Liu, F.-T. Multi-user detection in DS-CDMA systems using a genetic algorithm with redundancy saving strategy. Int. J. Innov. Comput. Inf. Control 2010, 6, 3347–3364. [Google Scholar]
- Huang, Y.-F.; Tan, T.-H.; Chen, B.-A. A Novel Genetic Algorithm for Resource Allocation Optimization in Device-to-Device Communications. In International Conference on Genetic and Evolutionary Computing (ICGEC 2017): Genetic and Evolutionary Computing, Advances in Intelligent Systems and Computing Book Series (AISC); Springer: Singapore, 2017; Volume 579, pp. 26–33. [Google Scholar]
- Hasan, M.; Hossain, E. Distributed resource allocation for relay-aided device-to-device communication: A message passing approach. IEEE Trans. Wirel. Commun. 2014, 13, 6326–6341. [Google Scholar] [CrossRef]
- Chen, S.-H.; Chen, M.-C. Operators of the Two-Part Encoding Genetic Algorithm in Solving the Multiple Traveling Salesmen Problem. In Proceedings of the International Conference on Technologies and Applications of Artificial Intelligence, Chung-Li, Taiwan, 11–13 November 2011; pp. 331–336. [Google Scholar]
- Tang, K.S.; Man, K.F.; Kwong, S.; He, Q. Genetic algorithms and their applications. IEEE Signal Process. Mag. 1996, 13, 22–37. [Google Scholar] [CrossRef]
Figure 1.
Architecture of systems with deployment of three relay stations.

Figure 2.
D2D pairs deployed on the circle around the relay station.
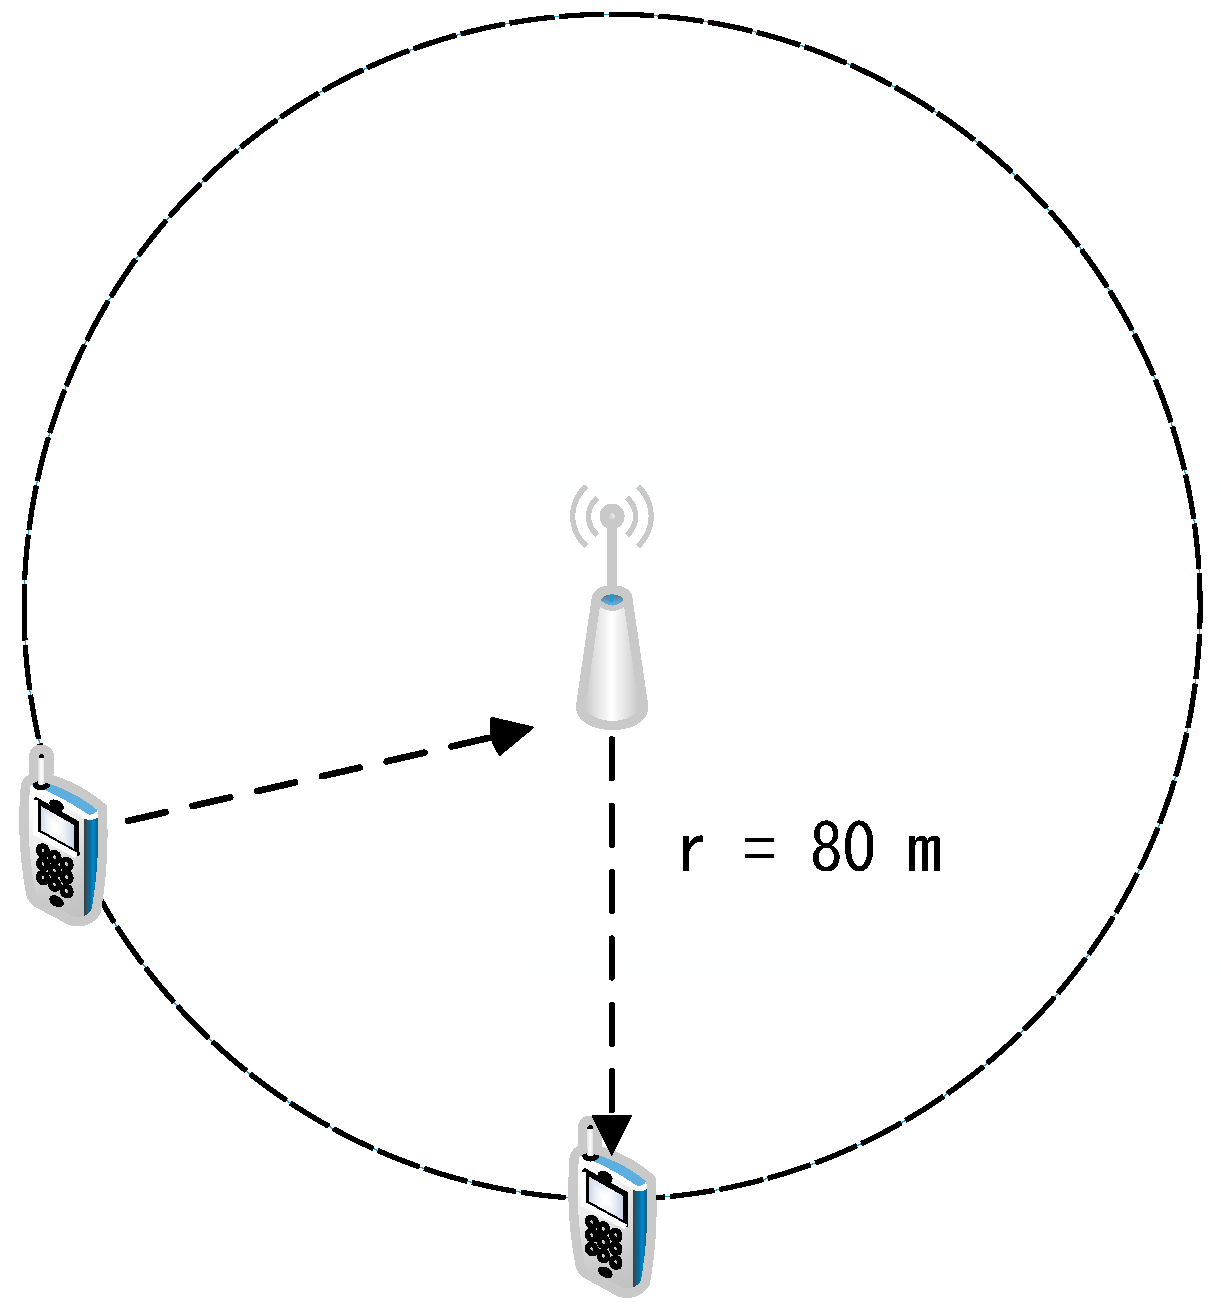
Figure 3.
Simulation results of SPSO method with M = 10.
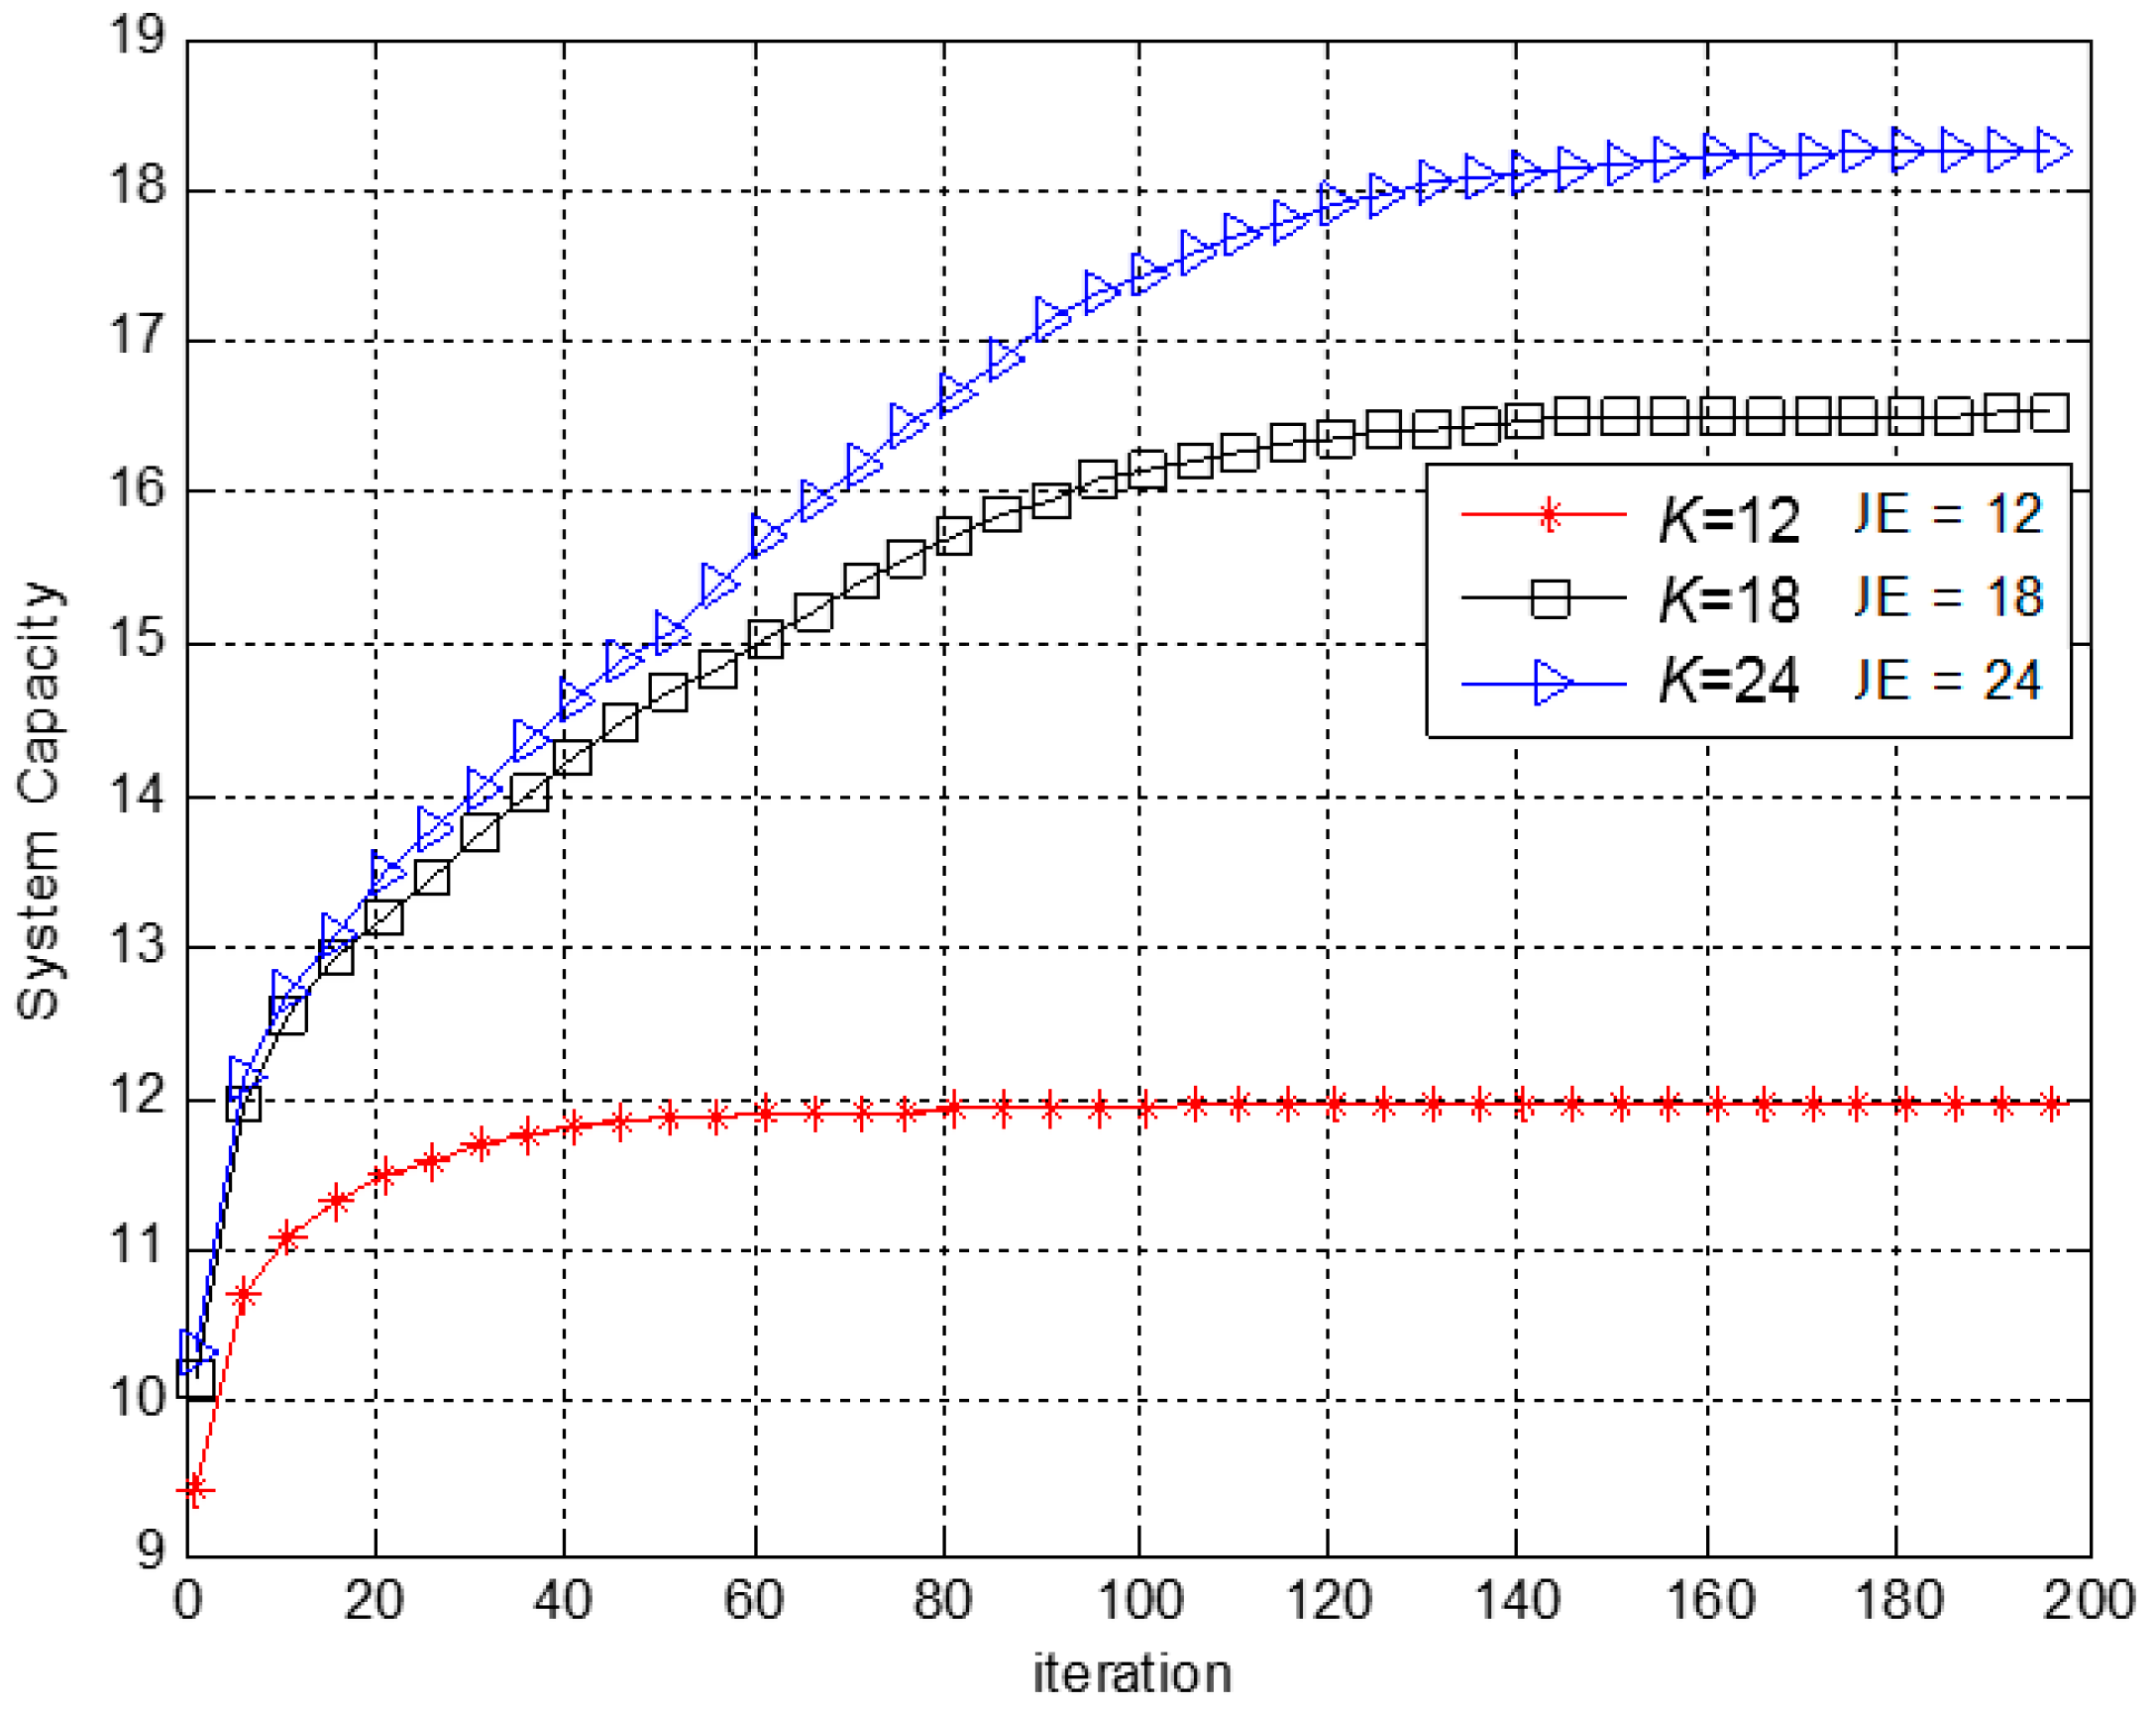
Figure 4.
Simulation results comparisons between SPSO and random allocation method with M = 10 and K = 18.
Figure 4.
Simulation results comparisons between SPSO and random allocation method with M = 10 and K = 18.
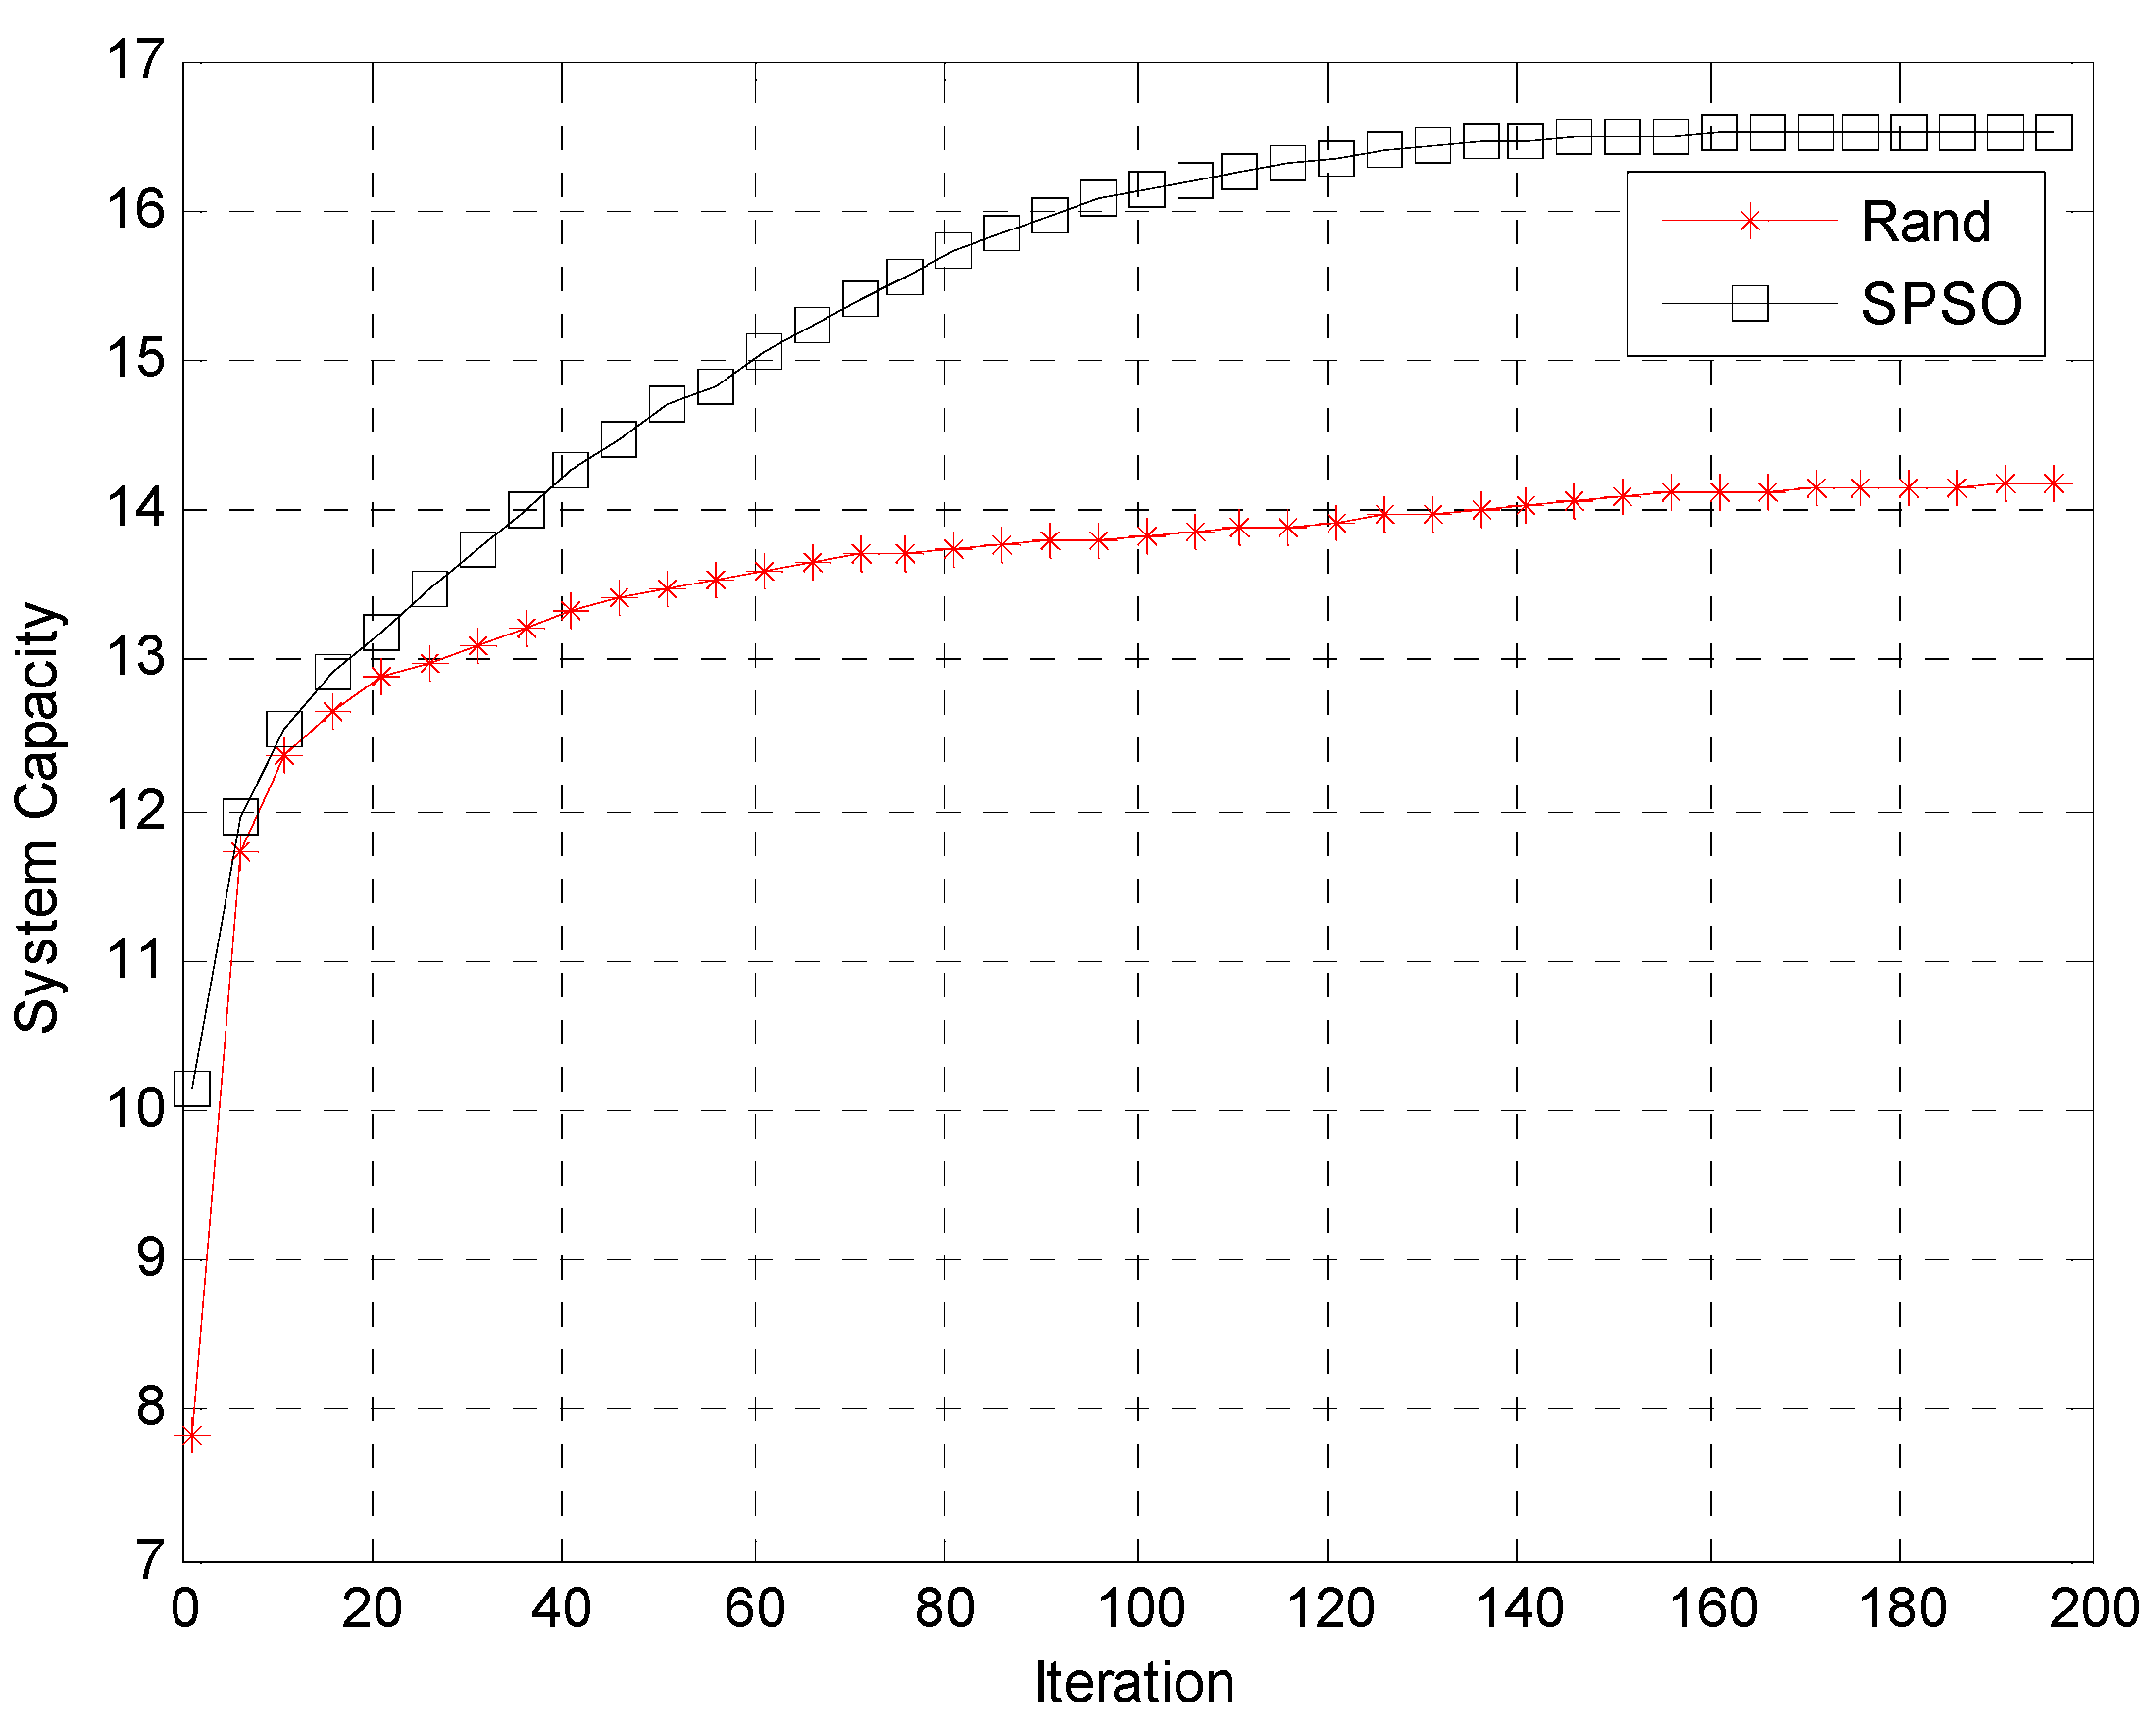
Figure 5.
The comparisons of convergence between RPSO and SPSO.

Figure 6.
System capacity for various population sizes with K = 18.

Figure 7.
System performance comparisons in 200 generations for (a) throughput and (b) system capacity with K = 18.
Figure 7.
System performance comparisons in 200 generations for (a) throughput and (b) system capacity with K = 18.

Figure 8.
The comparisons of (a) system capacity and (b) throughput for different weighting α.


Table 1.
System simulation parameters.
| System bandwidth (MHz) | 2.5 |
| Bandwidth of subcarrier (Hz) | 1500 |
| Number of RBs | 13 |
| Radius of the coverage area of relay station (meter) | 200 |
| Distance between base station and relay station (meter) | 125 |
| Number of CeUE | 9, 12, 15 |
| Number of D2D pairs | 3, 6, 9 |
| Minimum distance between base station and UEs (meter) | 10 |
| Power of relay station (Pl, dBm) | 30 |
| Power of UEs (Pu, dBm) | 23 |
| Minimum throughput requirements of CeUEs (Rth_C, Kbps) | 128 |
| Minimum throughput requirements of D2D pairs (Rth_D, Kbps) | 256 |
| Standard deviation of Shadowing fading between relay and BS (dB) | 6 |
| Standard deviation of Shadowing fading between UEs and relay station (dB) | 10 |
| Power Spectral density of AWGN (dBm/Hz) | −174 |
Table 2.
Simulation parameters of PSO.
| Maximal generations (G) | 200 |
| Number of particles (M) | 10 |
| Learning factors (c1 = c2) | 2 |
| Number of user equipment (K) (Including CeUE and D2D UEs) | 12, 18, 24 |
| Number of relay station | 3 |
| ID of RBs | 1–13 |
Table 3.
The comparisons between RPSO, SPSO and Rand.
| Number of UE (K) | 12 | 18 | 24 |
|---|---|---|---|
| a. ROSO | 12 | 16.66 | 18.89 |
| b. SPSO | 12 | 16.52 | 18.3 |
| c. Rand | 11.8 | 14.1 | 15.2 |
| Gain1 (a−c)/c | 1.69% | 18.16% | 24.28% |
| Gain2 (a−c)/c | 1.69% | 17.16% | 20.39% |
Table 4.
Simulation parameters in GA.
| Generations (G) | 200 |
| Number of chromosomes (M) | 10–500 |
| Crossover rate (Rc) | 0.9 |
| Mutation rate (Rm) | 0.07 |
Table 5.
System capacity comparisons of RPSO, GA and Rand methods with M = 100 and G = 200.
| K | 12 | 18 | 24 |
| GA | 12 | 17.96 | 21.8 |
| RPSO | 12 | 17.86 | 20.41 |
| Rand | 12 | 15.08 | 16.27 |
© 2018 by the authors. Licensee MDPI, Basel, Switzerland. This article is an open access article distributed under the terms and conditions of the Creative Commons Attribution (CC BY) license (http://creativecommons.org/licenses/by/4.0/).
Share and Cite
MDPI and ACS Style
Tan, T.-H.; Chen, B.-A.; Huang, Y.-F. Performance of Resource Allocation in Device-to-Device Communication Systems Based on Evolutionally Optimization Algorithms †. Appl. Sci. 2018, 8, 1271. https://doi.org/10.3390/app8081271
AMA Style
Tan T-H, Chen B-A, Huang Y-F. Performance of Resource Allocation in Device-to-Device Communication Systems Based on Evolutionally Optimization Algorithms †. Applied Sciences. 2018; 8(8):1271. https://doi.org/10.3390/app8081271
Chicago/Turabian StyleTan, Tan-Hsu, Bor-An Chen, and Yung-Fa Huang. 2018. "Performance of Resource Allocation in Device-to-Device Communication Systems Based on Evolutionally Optimization Algorithms †" Applied Sciences 8, no. 8: 1271. https://doi.org/10.3390/app8081271
Note that from the first issue of 2016, this journal uses article numbers instead of page numbers. See further details here.