Article

Experimental Study on an Optimized-Section Precast Slab with Structural Aesthetics

1
Department of Civil and Environmental Engineering, Nazarbayev University, Astana 010000, Kazakhstan
2
Department of Architectural Engineering, University of Seoul, Seoul 02504, Korea
3
Yunwoo Structural Engineers Co., Ltd., 4F, Seoul 05854, Korea
*
Author to whom correspondence should be addressed.
Appl. Sci. 2018, 8(8), 1234; https://doi.org/10.3390/app8081234
Submission received: 5 July 2018 / Revised: 18 July 2018 / Accepted: 24 July 2018 / Published: 26 July 2018
(This article belongs to the Special Issue Emerging Construction Materials and Sustainable Infrastructure)

Abstract

:
The optimized-section precast slab with structural aesthetics (OPS) is a half precast concrete slab with multi-ribs that optimizes the cross-section by eliminating the unnecessary bottom flanges at mid-span and has good structural performance by utilizing prestressing strands and truss-type shear reinforcements. In addition, it is a member that is designed to highlight the structural aesthetics through the curved shape of a variable cross-section at the bottom of the flange which is created from a natural shape that is formed in the section optimization process. In this study, experimental research was carried out to examine the structural performance of the OPS, which includes flexure and shear tests on the precast concrete unit members for resisting construction loads, the composite members with cast-in-place concrete, and the continuous end section. The experiment results confirm that, in accordance with the current design code, the flexural performance of OPS is on the safe side regardless of the member type, whereas the shear performance of the precast concrete unit member differs slightly from that of the composite member due to the differences in the contributions of the shear reinforcement as the effective depth varies.

1. Introduction

The precast concrete (PC) construction method can reduce construction costs by shortening the construction period and can improve the member quality by prefabricating the members at the factory [1,2,3]. It has thus been widely applied to underground parking lots, parking towers, warehouses, and large sales facilities [4,5]. Some PC structures, however, have often had problems with cracks or water leakages in the connections of the PC members due to their lack of integrity. For this reason, a half PC system that typically consists of lower PC parts that are prefabricated in a factory and upper parts that are cast in place has been widely used [6]. For PC slab systems, flat, hollow core, and double Tee types are also often utilized with the half PC method. In the half PC method, the external loads in the construction stage should be resisted by the PC members only; otherwise, it requires supporting posts which is costly and therefore reduces a huge advantage of PC construction methods. Many alternatives have thus been developed to enhance the load carrying capacity of PC slab members at the construction stage [7,8,9,10] and PC slabs with vertical ribs, such as a modified double tee slab (DTS) and a multi-ribbed slab (MRS), are some examples [11,12,13,14,15]. In addition, many efforts have been made to develop slender half PC members with a long span-to-height ratio ( l / h ) to maximize space utilization while ensuring efficient structural resistance performance.
In this regard, this study developed an optimized-section precast slab with structural aesthetics (OPS) that can reduce the quantity of materials through the efficient configuration of cross-sections, and one that is suitable for long-span implementation as a type of half PC slab. As shown in Figure 1a,b, the OPS has a flange on the top in the center of the span and on the bottom at the end of the span and can thus effectively resist the bending moment, as shown in Figure 1c. In addition, it is designed to ensure shear performance by increasing the cross-section as an in situ concrete topping is placed between the end ribs, and also to highlight the structural aesthetics by making the variable cross-section at the bottom of the member curved in the section optimization process, as shown in Figure 1d. Figure 2 shows the manufacturing process of the OPS at a precast plant. The steel form is installed on the prestress bed and work for the prestressing strands is performed. Then, prefabricated reinforcements are placed in the steel form and concrete is poured and cured by steam, thereby completing the PC unit. Figure 2e shows a PC unit member and a composite member with topping concrete placed on top of the PC unit. The projecting height of the shear reinforcement truss bar was sufficiently secured and rough surface treatment was applied to the upper part of the PC unit to ensure interfacial horizontal shear performance with the topping concrete.
This study mainly aimed to verify the structural performance of OPS and to examine the validity of the current design codes. An experimental study was conducted to investigate the flexure and shear behavior of the PC unit specimens and the composite PC specimens with topping concrete that were designed according to the ACI 318-14 [16] and KCI 2012 [17] codes. To achieve this goal, a framework was also established, as shown in Figure 3, in which the study is summarized with the three phases. Firstly, as described in the introduction, the existing PC slabs were reviewed and the OPS slab system was introduced with an emphasis on the basic concept and the novelty of the OPS. In the next stage, the experimental study was designed and was conducted to investigate the flexure and the shear behavior of the OPS. The test results are then discussed and are compared with the current design codes and non-linear analysis results. Based on the findings of this research, the summary of this study is presented with a suggestion on the possible applications of the OPS.

2. Test Program

2.1. Specimen Details

In this study, flexural and shear test specimens were fabricated for the PC unit member, the composite member with the topping concrete placed on its top, and the continuous composite slab member simulating the negative moment section, as shown in Figure 4. In particular, Figure 4c shows the test specimen that was produced to examine the performance of the half-PC-type OPS in resisting the negative moment at the continuous ends. Figure 4d shows the notation that was used for each specimen name.
Table 1 shows a summary of the concrete compressive strengths and the reinforcement details for the test specimens. There was a total of five test specimens, including PC unit flexural and shear specimens, composite PC flexural and shear specimens, and a negative moment specimen. As the shear tests were conducted at both ends of the specimens, a and b were added to their names for identification purposes. In the case of the negative moment test, one flexural test was conducted on the web section specimen (NFW) with a small compression flange area and on the end section specimen (NFE) with a sufficient compression flange area, respectively, and the two test results were obtained accordingly. All of the PC unit members were made of concrete with the same mix proportion and the material test results showed that the compressive strength of the PC concrete was 47 MPa and that of the topping concrete was 34 MPa. In addition, the yield strength of the reinforcing bars that were used in the test specimens ranged from 462 to 529 MPa, depending on the type of reinforcement that was used, as shown in Table 2.
Figure 5 shows the section details of each specimen. The PC unit and the composite PC specimens were 7 m long and 800 mm wide. The height of the PC unit was 350 mm, while that of the topping concrete was 120 mm, and the inclination angle of the variable cross-section where the positions of the top and bottom flanges change was 60°. The tensile strength of the seven-wire strands that were used in the PC unit production was 1860 MPa and two strands with 15.2 and 9.5 mm diameters were placed at the bottom and top, respectively. The prestressing forces that were introduced into the specimens were 137.3 and 63.8 kN for the 15.2 and 9.5 mm strands, respectively, and the magnitude of the effective prestress ( f p e ) was about 70% of the tensile strength ( f p u ) of the strand (i.e., f p e = 0.7 f p u ). Figure 5a,b show that a total of two D16 rebars were placed at the bottom of each rib in the UF specimens and a total of four D16 tensile rebars were placed in the US specimens to increase the flexural strength and thus, to induce shear failure. Figure 5c,d show that the PC unit member details of the CF specimen were the same as those of the UF specimen and that two D10 rebars were placed inside the upper topping concrete. In the case of the CS specimen, two D19 tensile rebars were added to the same section details as the CF specimen to induce shear failure. For the NF specimen that is shown in Figure 5e, the same PC unit as the UF and the CF specimens with a length of 3 m was produced, and its length ranged up to 100 mm on each side of the stub with a width of 800 mm. Topping concrete was poured to make a 6.6 m long continuous composite member. In the NF specimen, two D13 connecting rebars were placed across the negative moment region, and D10 longitudinal rebars were placed inside the topping concrete throughout the whole sections of the specimens. In addition, five D19 rebars with 3000 mm lengths were placed at 300 mm spacing to resist the tensile force due to the negative moment.
Figure 6 shows the details of the stirrups that are arranged on the PC unit ribs of each member. D10 truss bars were placed at 300 mm spacing in the UF specimen and at 400 mm spacing in the US, CF, and CS specimens. The height of the truss bar was 420 mm, the net cover thickness of the lower part was 25 mm, and the truss bar protruded 95 mm from the upper surface of the PC unit. In the NF series specimens, D13 truss bars were placed at 300 mm spacing to resist the large shear forces that were acting in the negative moment region. In addition, the angles of the truss bars were 70.35°, 64.54°, and 54.46° with respect to the longitudinal axis of the member, according to the spacing of the truss bars.

2.2. Test Setup and Measurement

Figure 7 shows the loading plans of each specimen. The flexural specimens, UF and CF specimens, were simply supported and were subjected to two-point loading with a shear span length of 2750 mm, as shown in Figure 7a. The shear specimens, US and CS specimens, were also simply supported, however they were subjected to one-point loading with a shear span length of 1200 mm, as shown in Figure 7b. After the shear test was performed at one end, the same shear test was carried out at the other end. As a result, two shear test result sets were obtained from the US and CS specimens, respectively. The continuous composite slab specimens that resist the negative moment, NFW and NFE specimens, were placed upside down, as shown in Figure 7c,d, and were simply supported with a one-point load. The NFW specimen with a span length of 5.6 m was intended to fail in flexure at the section where the 5-D19 tensile rebars are cut; that is, 1.5 m away from the loading point. On the other hand, the NFE specimen was planned to have a span length of 2.8 m in order to investigate the maximum negative moment resistance performance near the stub-slab interface. All of the specimens were loaded under displacement control with a 1000 kN capacity actuator.
Figure 8 shows the locations of the linear variable differential transformers (LVDTs) and the strain gauges that were installed in the reinforcements of each specimen. The thick solid line indicates the positions of the cross-sections where the gauges are installed. For all of the specimens, gauges were attached to the tensile reinforcements at the bottom and the upper strands and also to the shear reinforcements that were placed at the same locations as the longitudinal reinforcement gauges. In the case of the UF and CF specimens, gauges were installed in a total of four cross-sections, including the section around the variable cross-section and the central section, which was the maximum-moment cross-section. The cross-sections were located 600, 800, 1000, and 3500 mm away from the end of the members, respectively. For the US and CS specimens, gauges were installed intensively in the four cross-sections where the failure was expected and the cross-sections were located 400, 600, 800, and 1000 mm away from the end of the members, respectively. Even in the case of the NF series specimens, the gauges were attached to the longitudinal reinforcement in the lowest part of the cross-section, the shear reinforcement, the upper strand, and the longitudinal reinforcement placed in the topping concrete, as is the case for the composite PC members.
In order to measure the deflection of the member during loading, a total of three LVDTs were installed at the center of the member span and the two other locations (Refer to Figure 8). For the NFW specimen, a total of three LVDTs were installed at the center of the member span and the locations that were 1400 mm away from the mid-span on both sides. In the case of the NFE specimen, only one LVDT was installed at the position of the loading section. The loads, deflections, and strains for each specimen were measured and collected through a data logger.

3. Test Results and Discussion

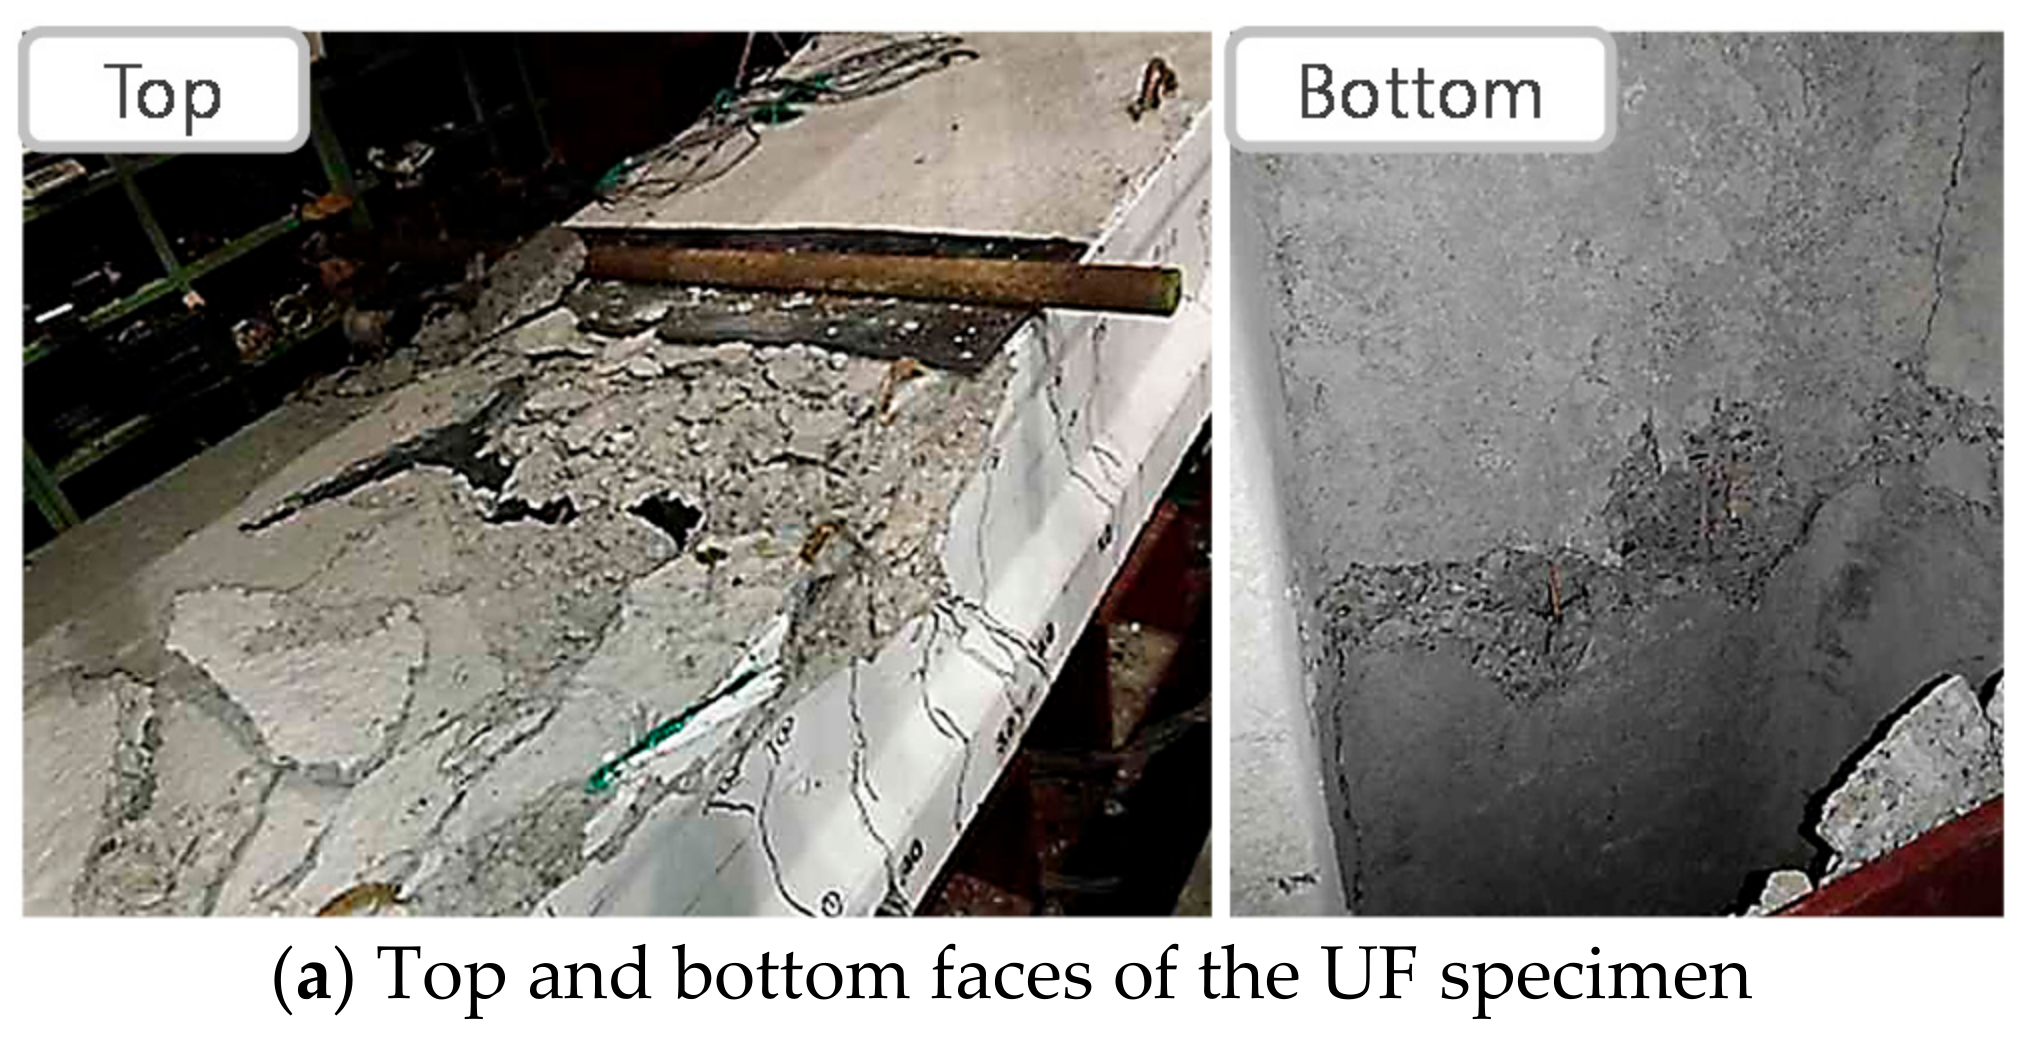
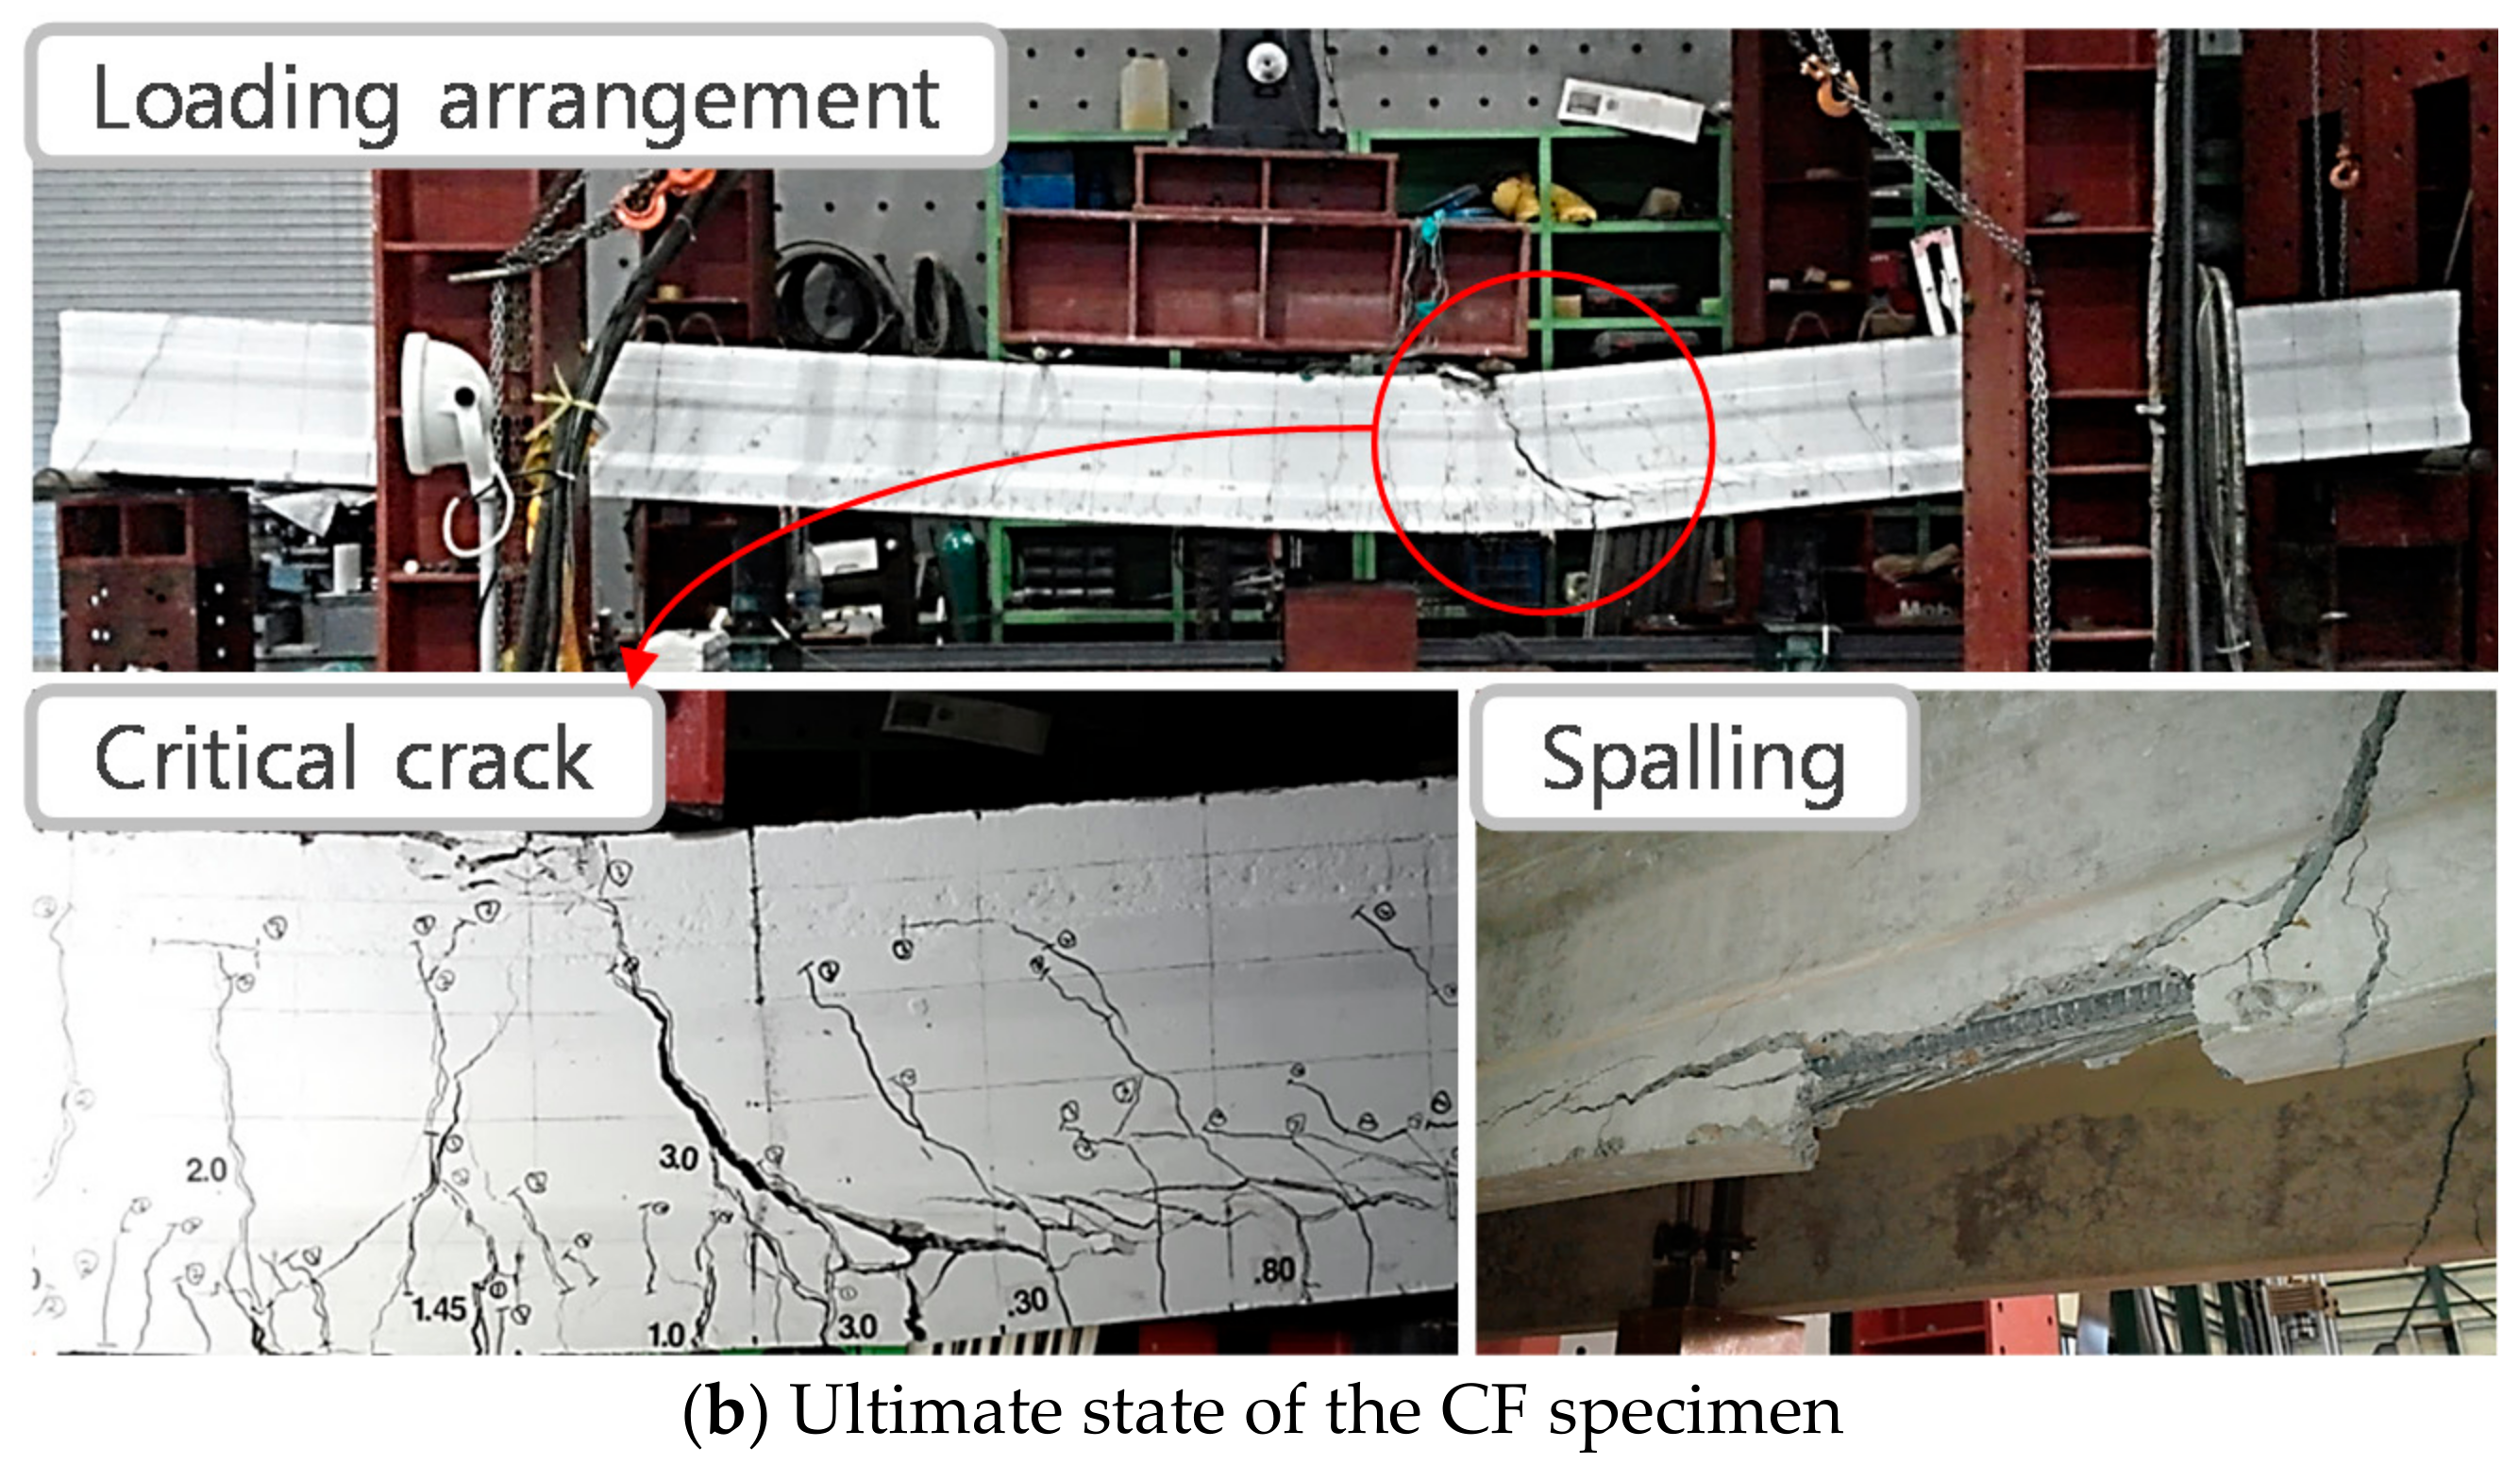
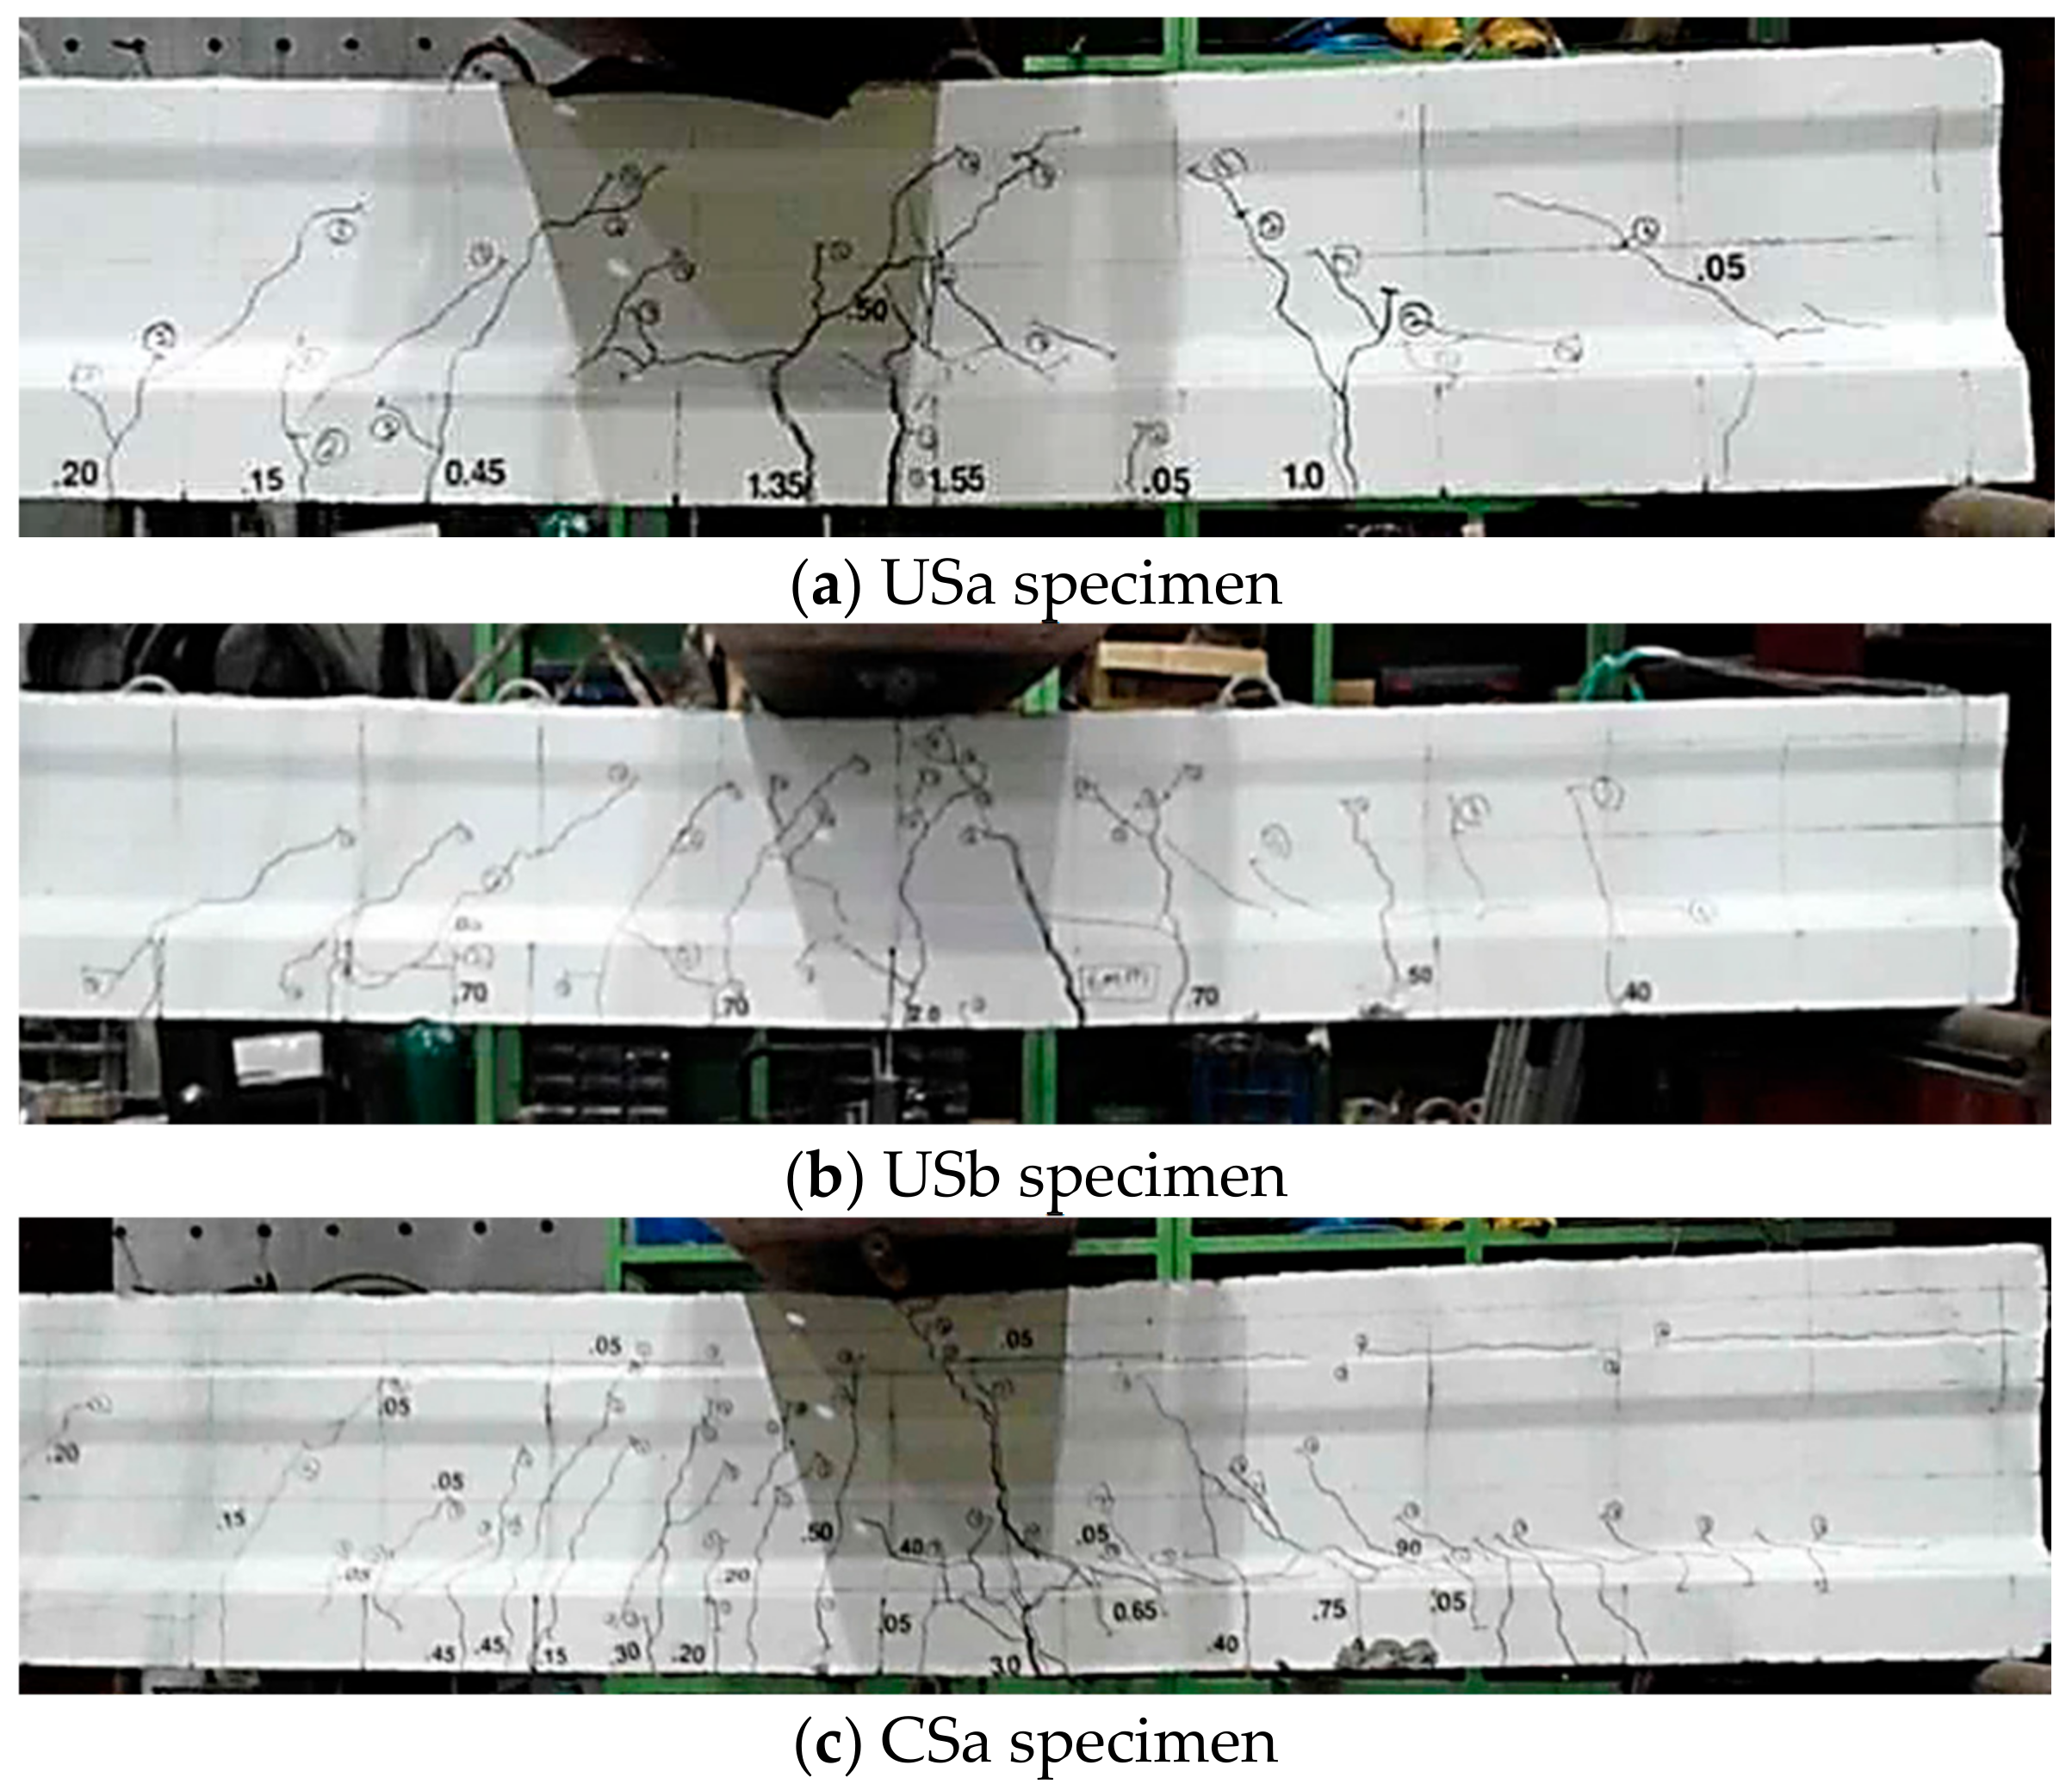
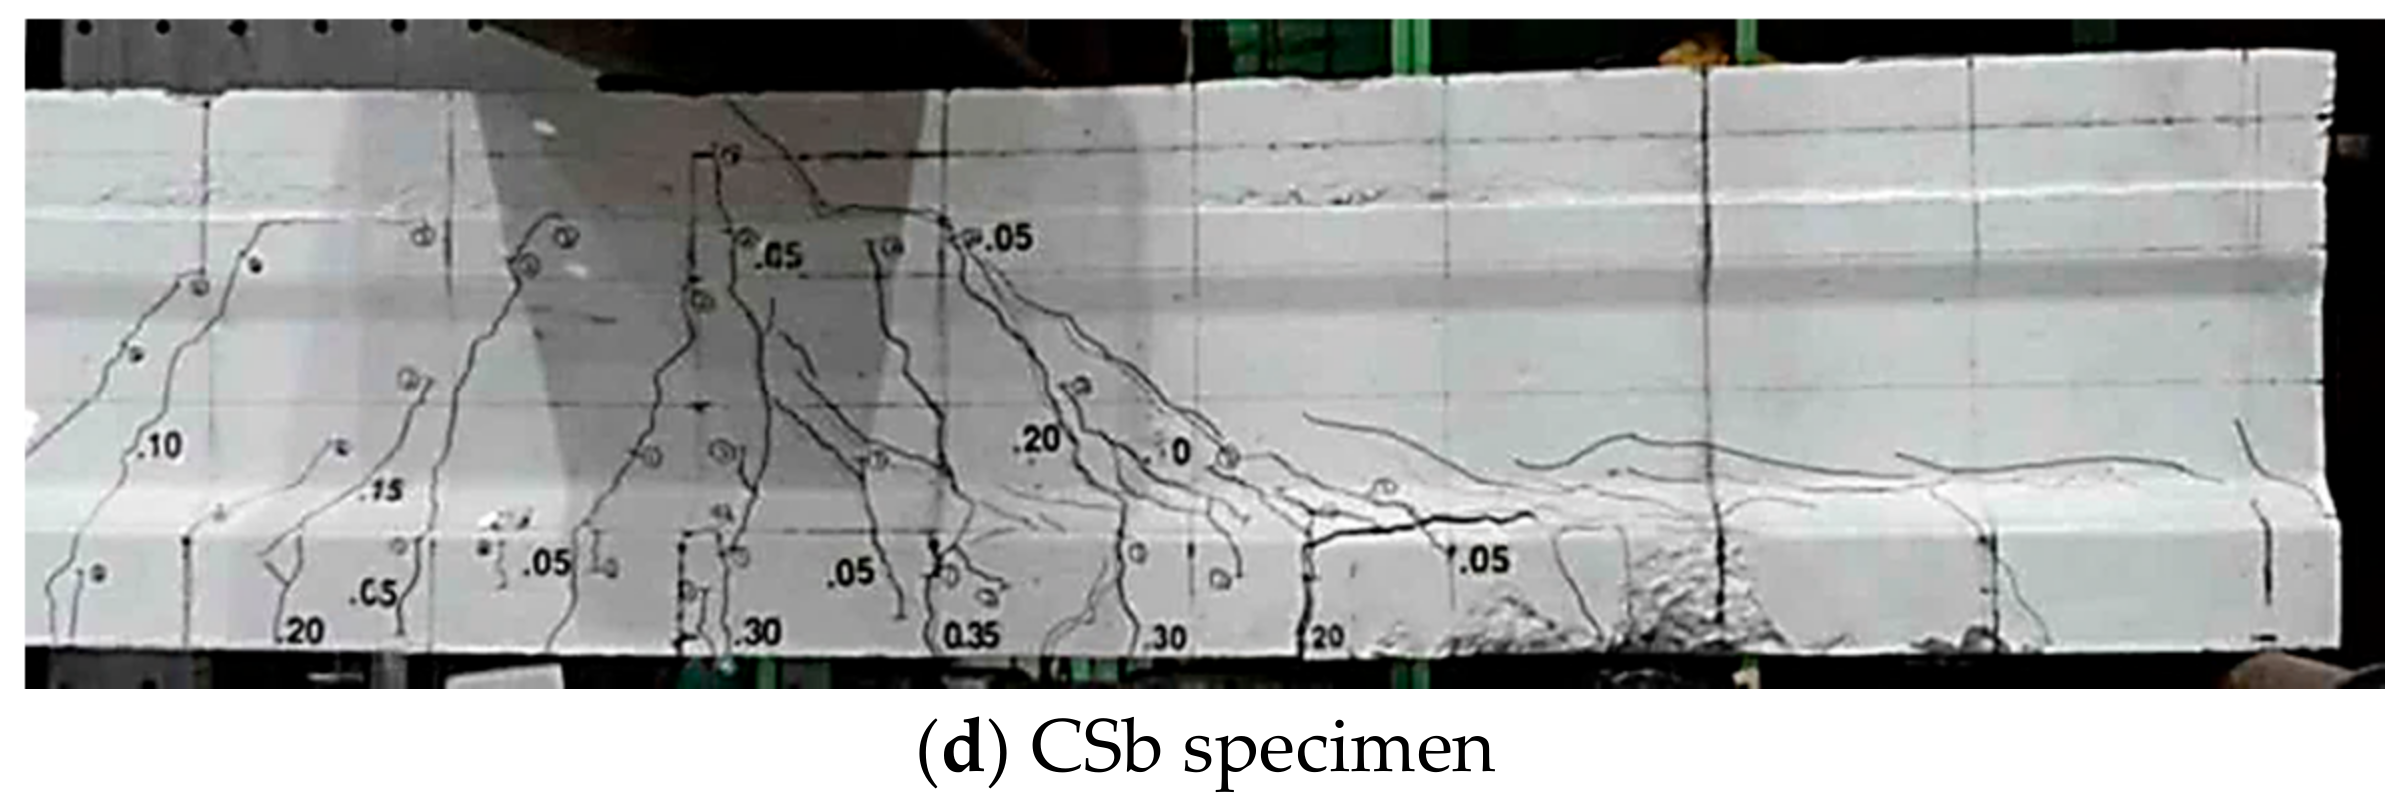
3.1. Load Deflection Responses and Failure Patterns

Figure 9 shows the load-deflection responses of the specimens. Figure 9a shows the vertical deflections that were measured from the LVDTs shown in Figure 9a,b for the UF and CF specimens. The initial flexural cracks occurred at 61 and 85 kN, respectively in the UF and CF specimens, and the difference is because the member height and the moment of inertia of the CF specimen were greater due to the topping of concrete. After the flexural cracks, the two specimens showed a reduction in stiffness and exhibited ductile behavior until failure. Figure 10 shows that both the UF and CF specimens revealed typical flexural failure modes. However, in the CF specimen, which was a composite PC slab member, a slightly larger deflection was measured in the LVDT that was located on the right after the maximum load was reached, and the failure occurred as the critical crack between the right loading point and the tension zone progressed.
The US and CS shear specimens were divided into USa, USb, CSa, and CSb based on the results of the experiments that were conducted at the left and the right ends of the members, as shown in Figure 8b,d, and Figure 9b shows their load-deflection curves. In the USa and USb PC unit specimens, the initial shear cracks occurred at the 85 and 72 kN loads, respectively. The USa and USb specimens, which were PC unit members, were observed to have developed critical cracks around the variable cross-section, where the positions of the top and bottom flanges changed. In addition, due to the influence of the variable cross-section, a relatively high crack angle was observed, as cracks were concentrated on the web between the loading point and the variable cross-section, as shown in Figure 11a,b, which is different from general shear crack patterns. In the CSa and CSb composite PC specimens, the initial flexural cracks were observed at loads of 109 and 133 kN and shear cracks occurred in the member web at the loads of 186 and 195 kN, respectively. After reaching the maximum load, the CS specimens that were composite PC members showed more brittle behavior compared to the US specimens that were non-composite PC units. This suggests that as the flexural performance was improved due to the topping concrete and as the influence of the variable cross-section was relatively small in the composite PC members (i.e., the CSa and CSb specimens), the shear dominant failure pattern seemed to be more apparent compared to the PC unit specimens, as shown in Figure 11c,d.
Figure 9c shows the load-deflection responses of the NFW specimens. Figure 12 shows that the region of the NFW specimen can be divided into Section 1 where the compression flange was formed in the section where the longitudinal tensile reinforcement was placed (moment strength in this section: M n = M n 1 ); Section 2, where the longitudinal tensile reinforcement was placed, but the compressive force is resisted by the rib section without a compression flange (moment strength in this section: M n = M n 2 ); and Section 3, where there was no longitudinal tensile reinforcement, and the compressive force is resisted by the rib section (moment strength of cross-section in this section: M n = M n 3 ). Figure 13a,b show that the failure section of the NFW specimen was located at a distance 1425 mm from the center of the member, not at the maximum-moment region. This is because the flexural failure occurred at the section with the lowest moment strength (i.e., M u = M n 3 ) before the external moment ( M u ) that was caused by one-point loading reached the maximum moment capacity (i.e., M u = M n 1 ), as shown in Figure 12. The failure section of the NFW specimen also coincided with the location where the 5-D19 tensile rebars were cut as well as the location of the variable cross-section, as mentioned earlier. In other words, it was the location where the influence of the stress concentration and the anchorage loss resulting from the cutting of the reinforcement and the rapid change of the cross-section that were significant. Therefore, it should be noted that it is very important to place the tensile reinforcement at the continuous end with sufficient length beyond the variable cross-section by considering the applying load and the flexural moment distribution and to design the flange section of the PC end considering the negative moment region. The NFE specimens were designed to examine the maximum-moment resistance performance ( M n 1 ) of the member cross-section with a compression flange by adjusting the supports, as shown in Figure 7d, after the completion of the NFW test. Due to the effect of existing cracks that developed during the NFW test, it exhibited linear behavior without stiffness degradation at the initial loading stage, as shown in Figure 9d. Then, the stiffness decreased rapidly after the tensile reinforcement yielded and the specimen showed very ductile behavior until failure. Figure 13c shows that flexural cracks developed intensively at the interface between the PC slab and the stub section and that flexural failure occurred with the crushing of the concrete on the compression side.

3.2. Strain Measured from the Longitudinal and Shear Reinforcement

Figure 14 shows the strains that were measured from the gauges that attached to the reinforcements of the specimens. In the graphs, “Tension” and “Stirrup” refer to the gauges that were attached to the longitudinal and shear reinforcements, respectively, while “Topping” refers to the gauge that was attached to the longitudinal reinforcement that was placed in the topping concrete. In addition, the numbers attached are the positions of the cross-sections with the gauges which are arranged in ascending order from the end to the center of the member, as shown in Figure 8.
Figure 14a,b show that in the UF specimen and the CF specimen, the strains of the flexural tensile reinforcement in the maximum-moment region increased significantly with increasing load, whereas the strains in the shear reinforcement were very small, even until failure. Therefore, it can be confirmed that the two specimens failed in flexure.
Figure 14c,d show the load-reinforcement strain responses of the USb specimen and of the CSb specimen, respectively. However, some strain data could not be presented in the graphs due to damage in the gages. In the USb specimen, the strain that was measured from the longitudinal reinforcement was very small and the shear reinforcement (i.e., stirrup 3) that was located 800 mm away from the member end showed a strain that was close to the yield strain at the maximum strength. In the CSb specimen, the shear reinforcement also experienced a very large strain, as can be seen in Figure 14d, and the strains that were measured from the longitudinal reinforcement were very small compared to those of the shear reinforcement.

3.3. Comparison of the Test and Analysis Results

To determine if the OPS member design can be properly done in accordance with the current standards, flexural and shear performance evaluation of the OPS was performed by applying the ACI318-14 [16] and KCI 2012 [17] code equations, as shown in Table 3. In addition to these code equations, layered sectional analysis (LSA) [18,19] considering the strain compatibility and force equilibrium conditions was performed for the evaluation of flexural strength. For the shear strength evaluation, a detailed comparative analysis of the test and the analysis results was conducted using RESPONSE2000 (R2K) [20], a program that was developed at the University of Toronto that is based on the shear analysis model MCFT [21,22,23]. Since horizontal shear cracks at the interface between the PC unit and the topping concrete did not occur in any of the composite specimens, the interface was considered as a full-composite interface when the layered sectional analysis was performed. In addition, the compressive strengths of the topping concrete, rather than those of the PC unit, were applied as in practical design when the shear strengths were calculated for the composite PC specimens.
Table 4 and Figure 15 show the comparison of the test and the analysis results with respect to the flexural and shear strengths of the specimens. Figure 15a shows the strength evaluation results of the UF and CF flexural specimens. LSA showed a very accurate evaluation of the flexural strength of the UF specimen, however it somewhat overestimated the flexural strength of the CF specimen. It seems that the CF specimen reached failure at a lower load because the loading was somehow concentrated at one of the two loading points, as shown in Figure 10c. However, the nominal moment capacity ( M n ) that was calculated using the design equation very accurately evaluated the flexural capacity of the UF and CF members and thus, it was confirmed that when the member is designed with the strength reduction factor ( ϕ ) of 0.90 [16], sufficient flexural strength can be secured.
Figure 15b shows the strength evaluation results of the shear specimens. R2K [20], based on MCFT [21,22,23], gave somewhat conservative results. The code equation evaluated the shear strengths of the CS series specimens close to the test results, however it overestimated the shear strengths of the USa and USb specimens that were PC unit members. This is because the shear reinforcement of the OPS was designed not to secure the shear performance of the PC unit member, but to ensure the shear performance of the composite member, and the resistance of the shear reinforcement that was placed in the PC unit member was not sufficiently activated, as the shear reinforcement was placed at a spacing of 400 mm which was wider than the PC unit member height of 350 mm. However, when the 0.75 of strength reduction factor was applied [16], the shear strength was found to be on the safe side for the USa and USb specimens. Therefore, the design can be made possible by the current design codes, however there is still a need to secure the reliability of the member design through further research on the shear performance of the OPS unit.
Figure 15c shows the results of the evaluation of the negative moment resistance capacities of the NFW and NFE specimens which were continuous composite members. It was confirmed that LSA and the code equations provided considerably accurate evaluations of the moment strengths of the specimens and that the appropriate safety can be secured in design when the strength reduction factor 0.9 is applied.

4. Conclusions

This study presented the newly developed OPS system that has structural aesthetics resulting from the optimization process of the cross-section to effectively resist external forces. An experimental investigation was conducted to analyze the structural performance and the behavior characteristics of the OPS and the test results were compared with the nonlinear analysis results to examine the applicability of the current design codes. Below are the conclusions that were derived from this study.
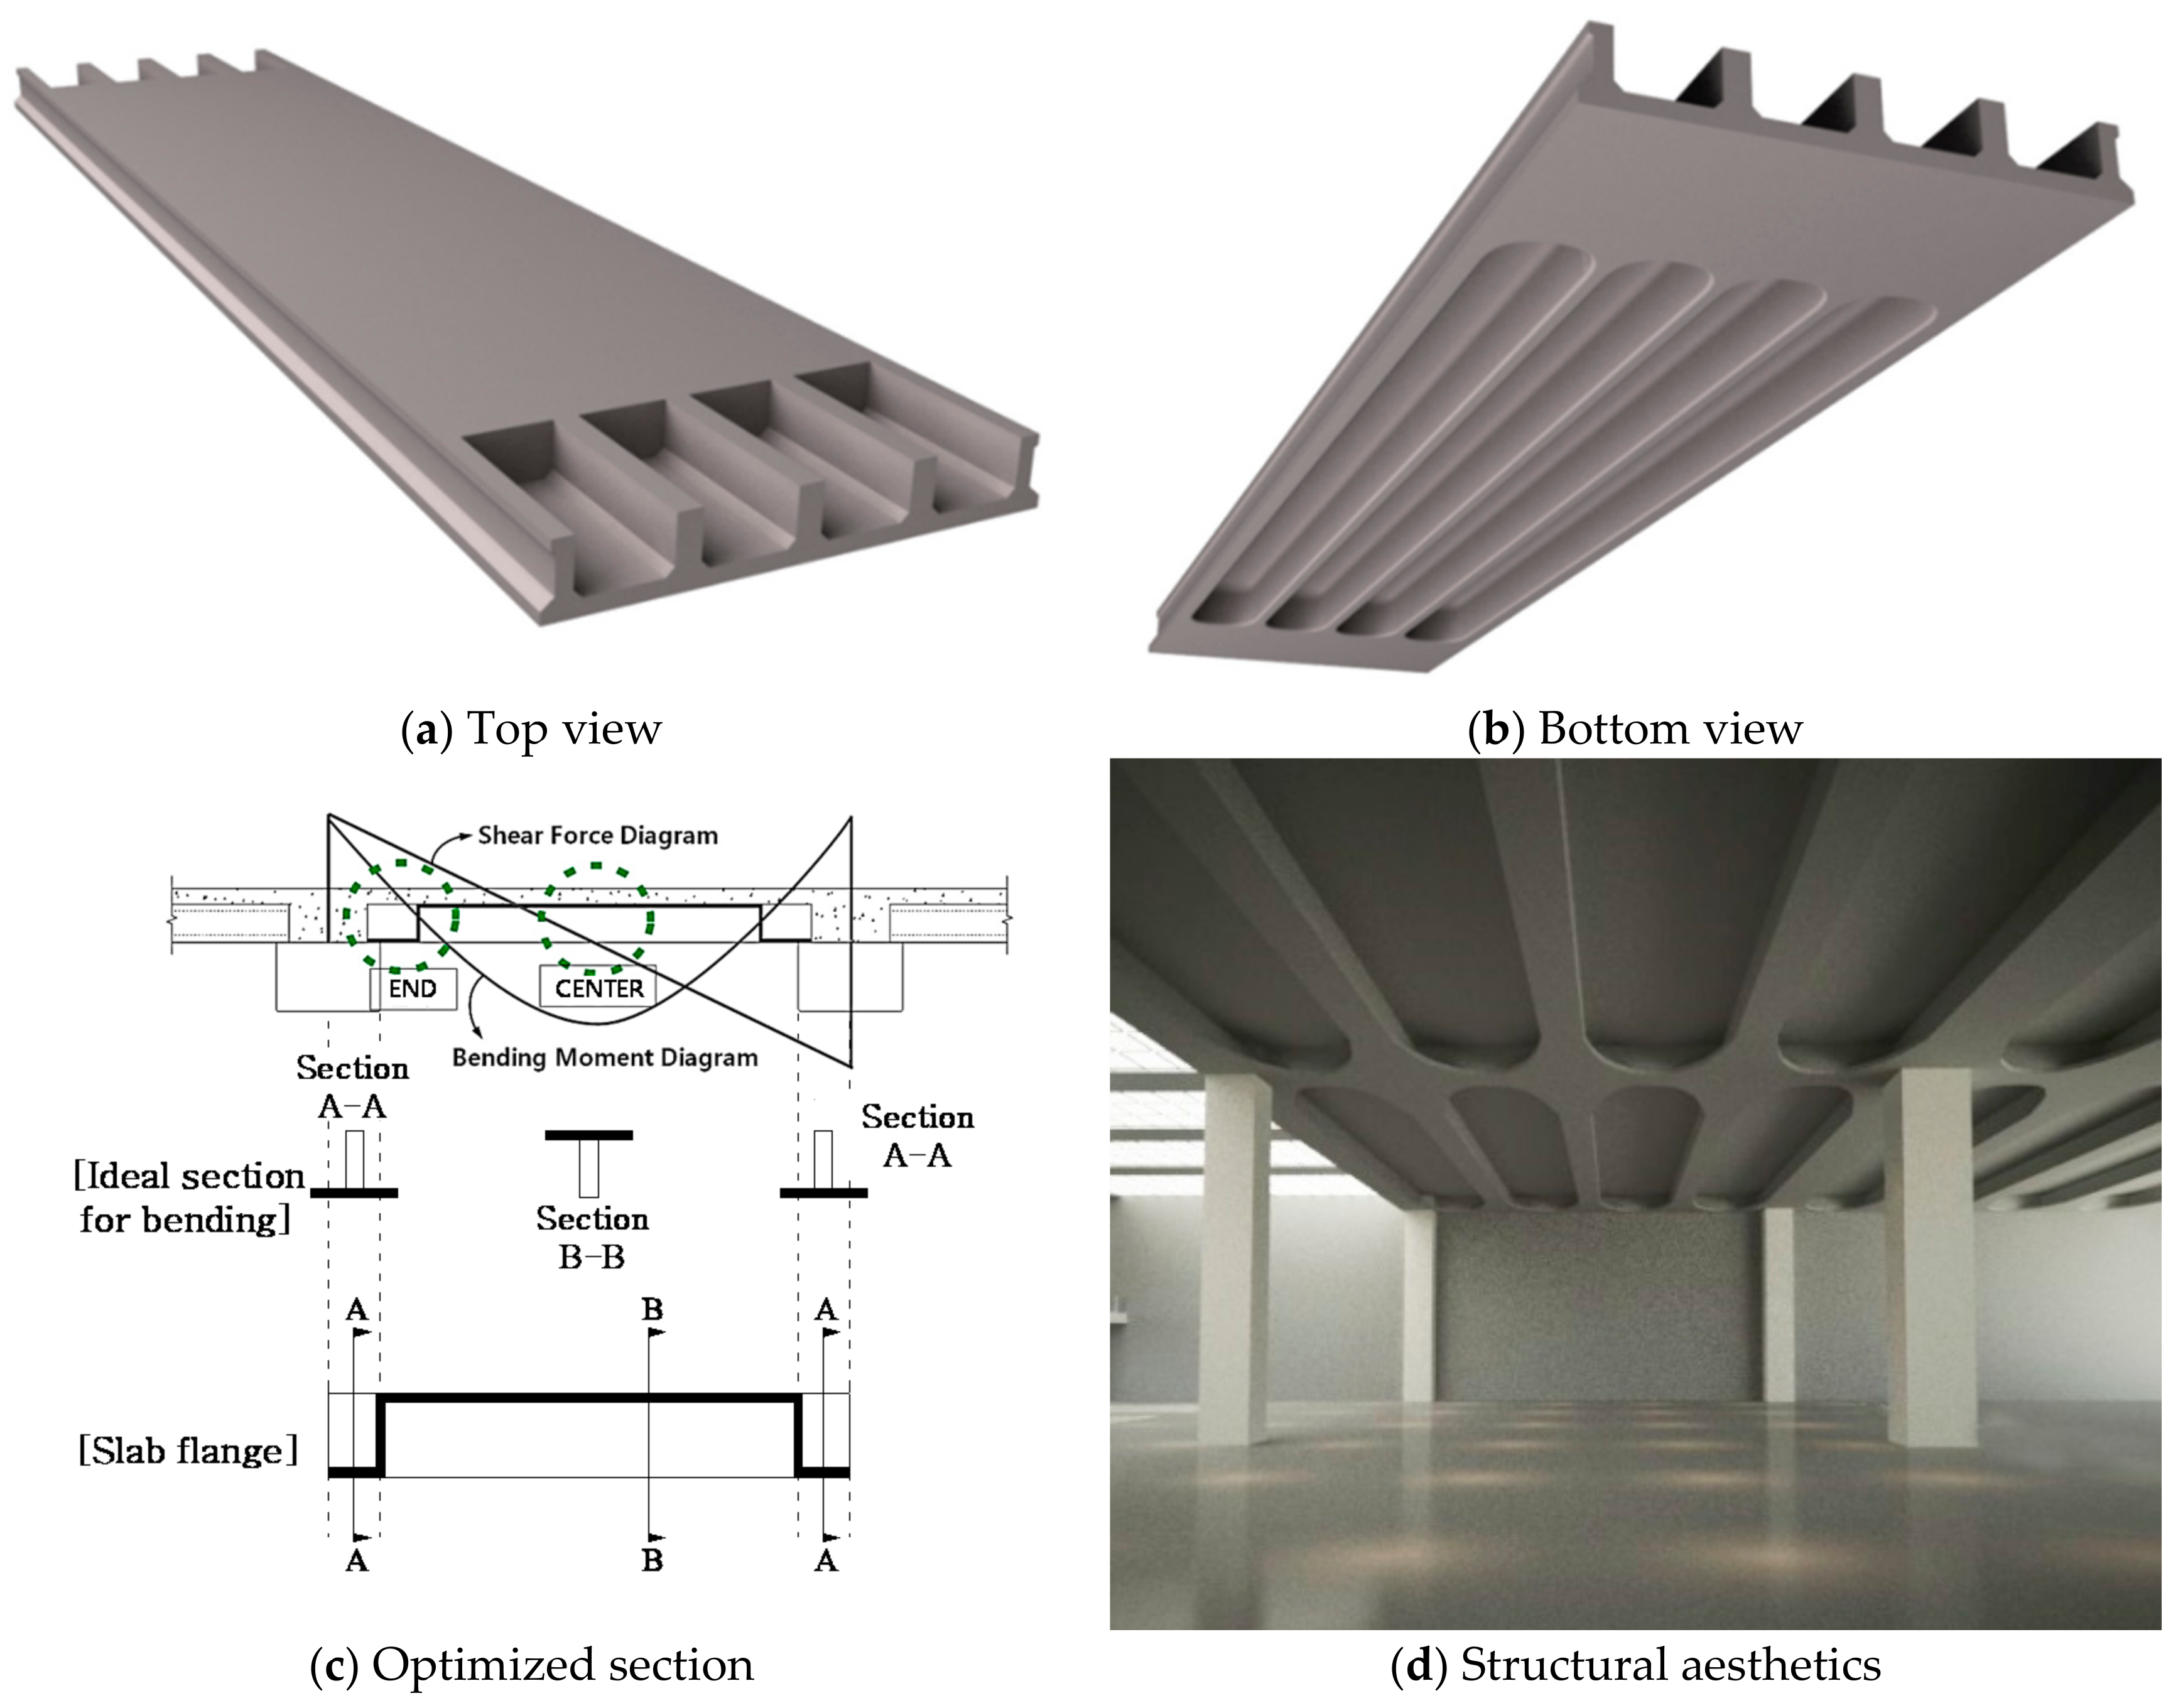
  • The OPS has an optimized cross-section that can effectively resist both positive and negative moments with the flange positioned on the top in the center and on the bottom at the end portion of the PC unit and is a member that has been developed to introduce a curved shape into the variable cross-section and thus, to highlight the structural aesthetics.
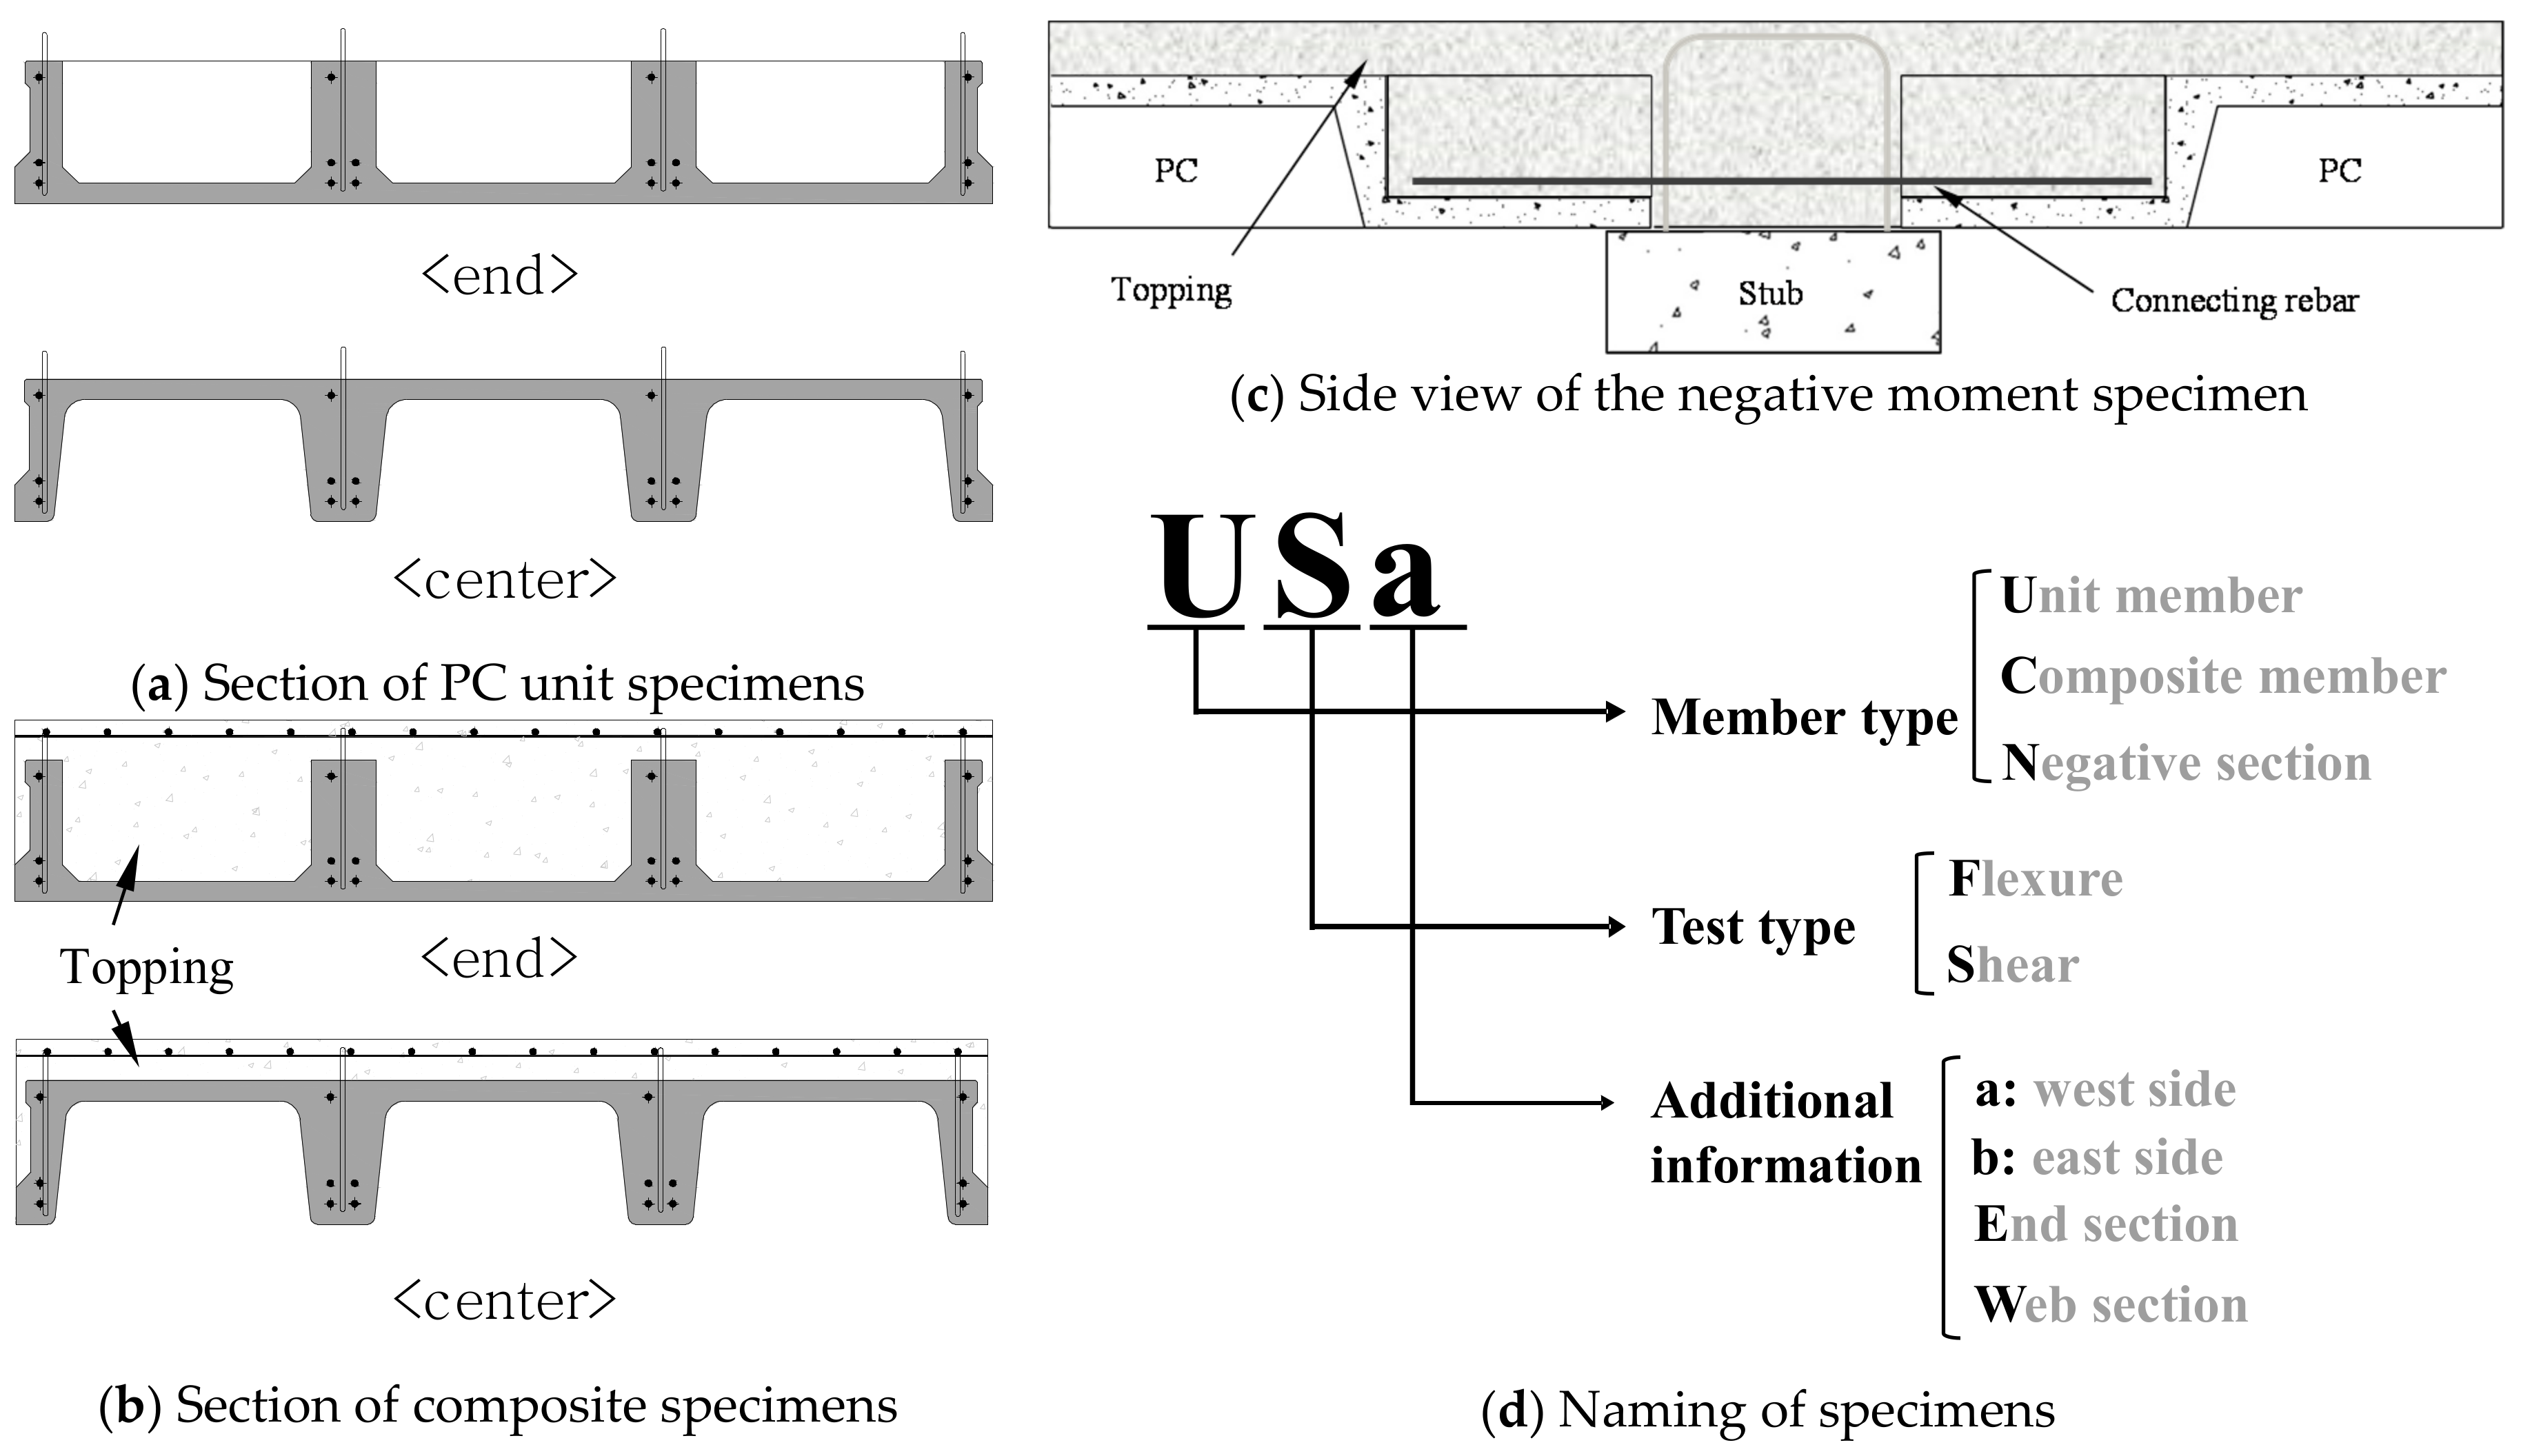
  • According to the test results, no damage was observed at the interface between the PC unit and the topping concrete, and the composite specimens exhibited full-composite behavior.
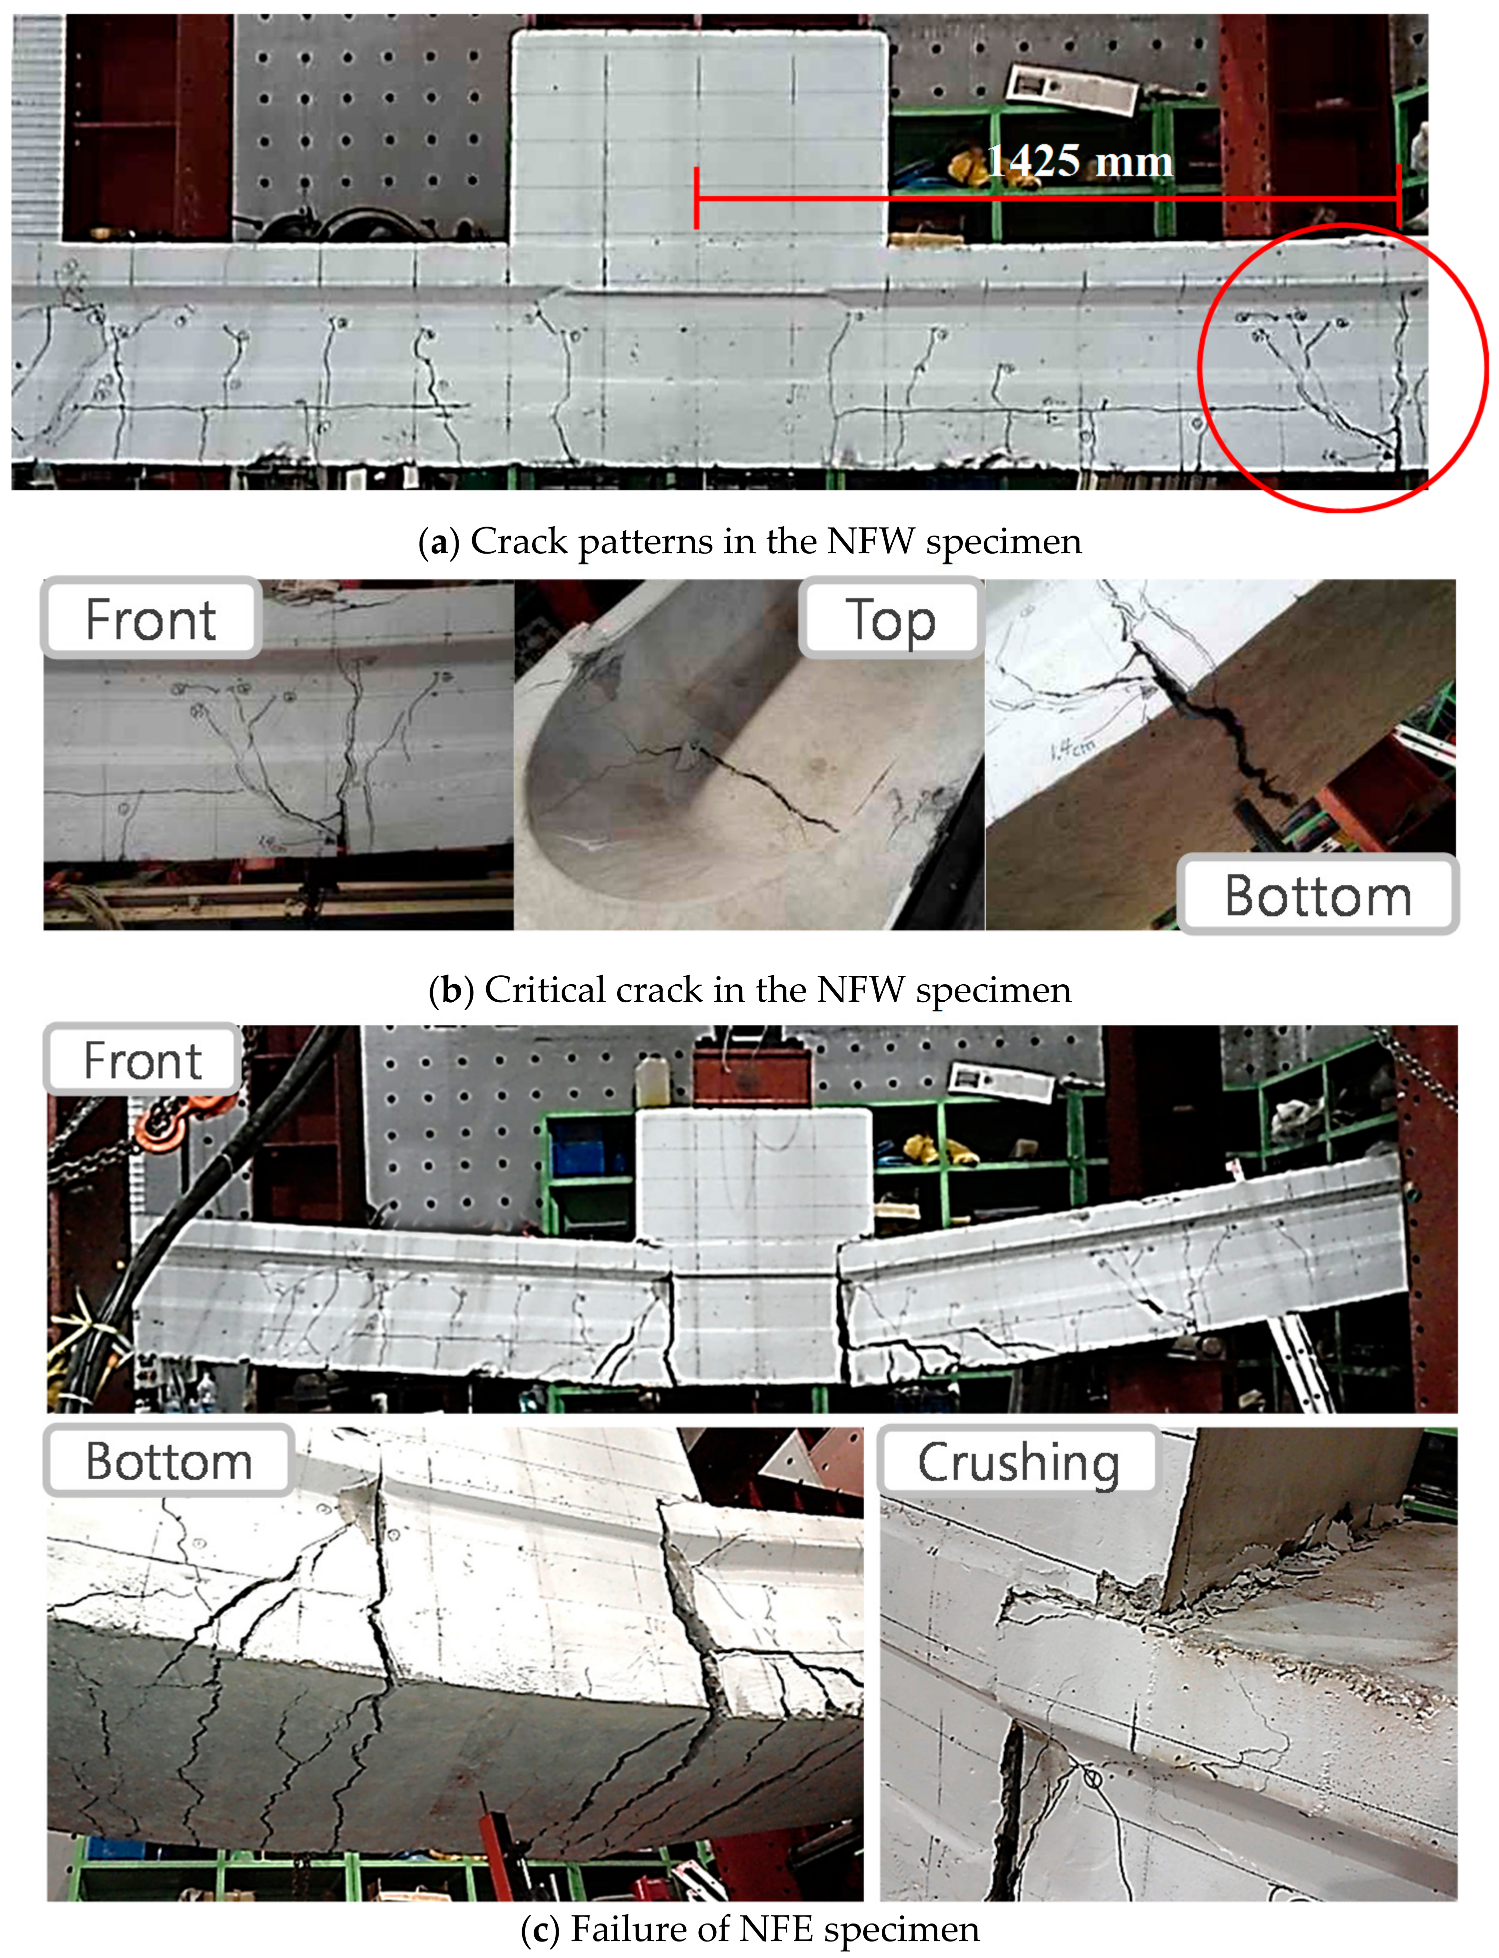
  • In the PC unit shear specimens, critical cracks progressed near the variable cross-section and shear cracks were formed at an angle that was higher than that of the typical horizontal members. On the other hand, in the composite PC shear specimens, the flexural performance was improved due to the topping concrete and shear dominant failure modes were more apparent as the influence of the variable cross-section was relatively small compared with that of the PC unit specimens.
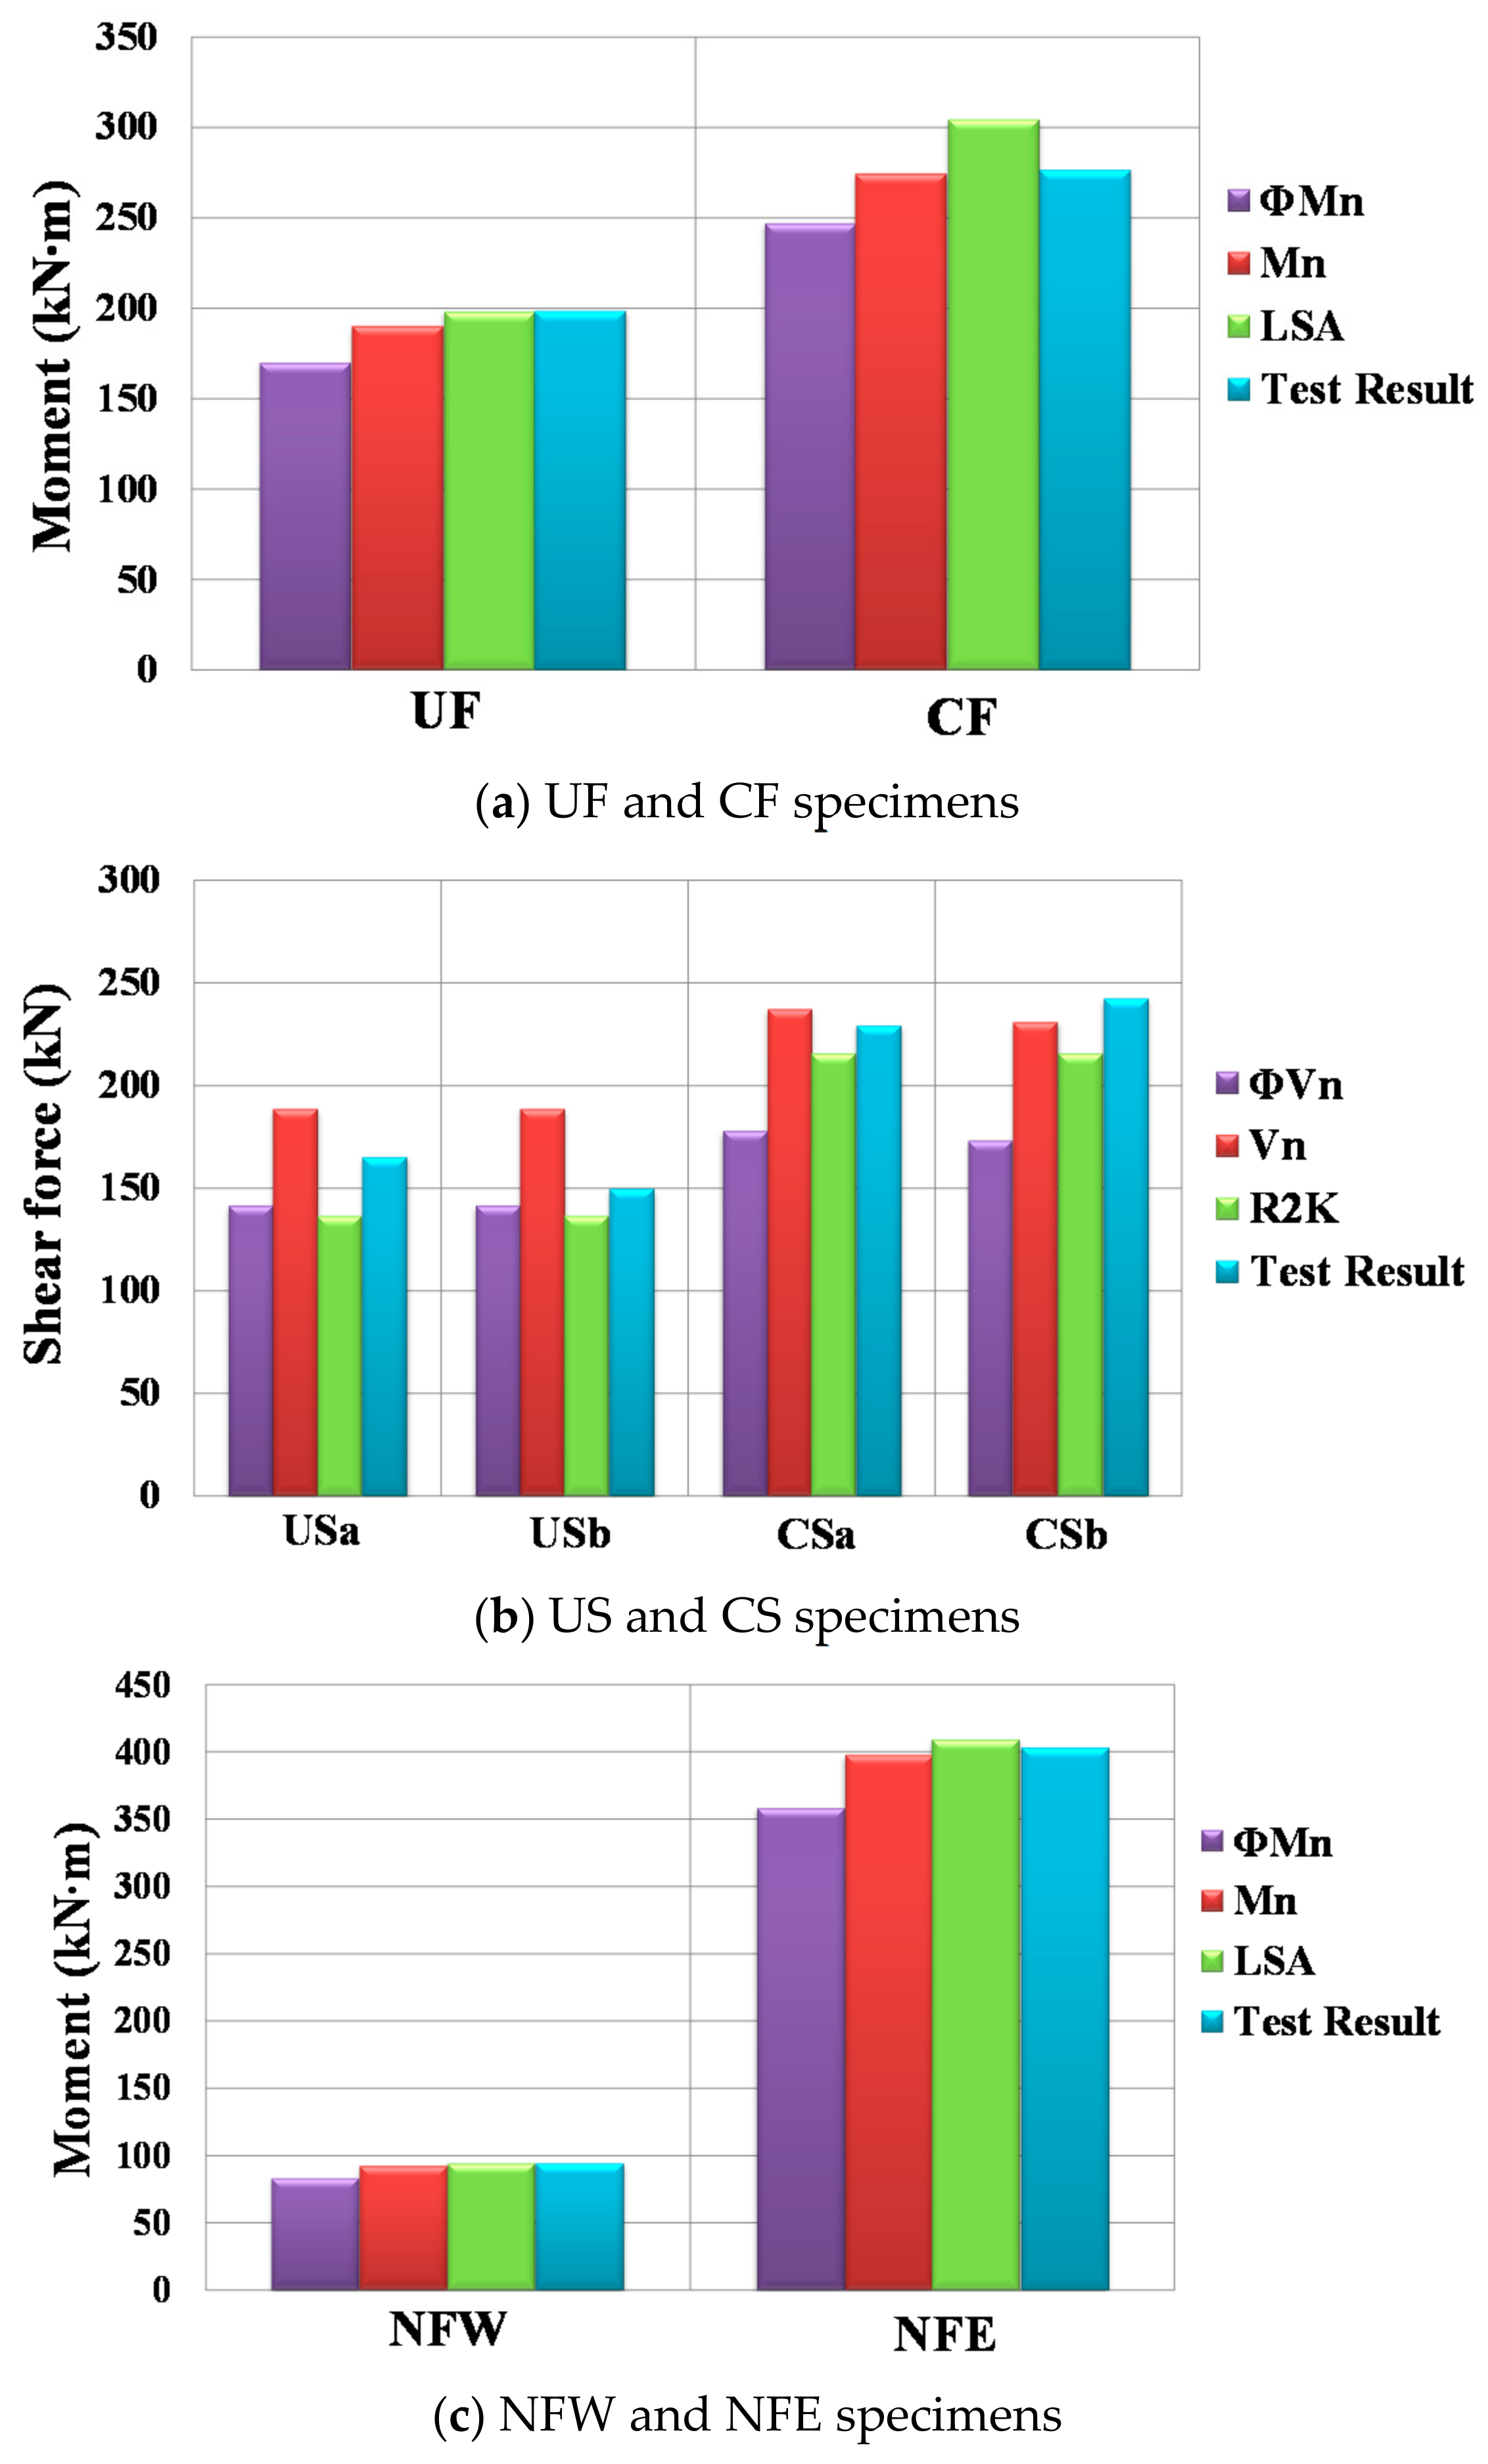
  • The current design codes were found to provide a very accurate evaluation of the flexural capacities of the PC unit and the composite PC members and, in particular, could also properly evaluate the negative moment resistance capacity at the continuous ends. However, it should be mentioned that to secure the required negative moment resistance capacity, the location of the variable cross-section and the cutting point of the tensile reinforcement that was placed at the continuous ends should be properly determined considering the applied loads and the flexural moment distribution.
  • It is expected that the OPS can be utilized to long span structures, such as underground parking lots and logistics warehouses which require high load carrying capacities with economic feasibility and structural aesthetics.

Author Contributions

Original draft manuscript, H.J.; Validation, S.-J.H. and M.-K.P.; Investigation, I.S.C. and S.C.; Supervision and Review Writing, K.S.K.

Acknowledgments

This research was supported by a grant (18TBIP-C125047-02) from the Technology Business Innovation Program that was funded by the Ministry of Land, Infrastructure and Transport of the Korean government.

Conflicts of Interest

The authors declare no conflict of interest.

References

  1. Elliot, K.S.; Colin, K.J. Multi-Storey Precast Concrete Framed Structures, 2nd ed.; Wiley Blackwell: Hoboken, NJ, USA, 2013. [Google Scholar]
  2. Lee, D.H.; Park, M.K.; Oh, J.Y.; Kim, K.S.; Im, J.H.; Seo, S.Y. Web-Shear Capacity of Prestressed Hollow-Core Slab Unit with Consideration on the Minimum Shear Reinforcement Requirement. Comput. Concr. 2014, 14, 211–231. [Google Scholar] [CrossRef]
  3. Ghosh, S.K. Shear Reinforcement Requirements for Precast Prestressed Double-Tee Member. Struct. J. 1987, 84, 287–292. [Google Scholar] [CrossRef]
  4. Industry Hand Book Committee. PCI Design Handbook, 7th ed.; Precast/Prestressed Concrete Institute: Chicago, IL, USA, 2010. [Google Scholar]
  5. Anderson, A.R. Composite Designs in Precast and Cast-in-Place Concrete. Progress. Archit. 1960, 41, 172–179. [Google Scholar]
  6. Ju, Y.K.; Kim, S.D. Structural Behavior of Alternative Low Floor Height System using Structural “Tee,” Half Precast Concrete, and Horizontal Stud. Can. J. Civ. Eng. 2005, 32, 329–338. [Google Scholar] [CrossRef]
  7. Yang, L. Design of Prestressed Hollow-Core Slabs with Reference to Web-Shear Failure. J. Struct. Eng. 1994, 120, 2675–2696. [Google Scholar] [CrossRef]
  8. Park, R.; Gamble, W.L. Reinforced Concrete Slab, 2nd ed.; Wiley: Hoboken, NJ, USA, 2000. [Google Scholar]
  9. Palmer, K.D.; Schultz, A.E. Factors Affecting Web-shear Capacity of Deep Hollow-Core Units. PCI J. 2010, 55, 123–146. [Google Scholar] [CrossRef]
  10. Palmer, K.D.; Schultz, A.E. Experimental Investigation of the Web-Shear Strength of Deep Hollow-Core Units. PCI J. 2011, 56, 83–104. [Google Scholar] [CrossRef]
  11. Arockiasamy, M.; Badve, A.P.; Rao, B.V.; Reddy, D.V. Fatigue Strength of Joints in a Precast Prestressed Concrete Double Tee Bridge. PCI J. 1991, 36, 84–99. [Google Scholar] [CrossRef]
  12. Naito, C.J.; Cao, L.; Peter, W. Precast Concrete Double-tee Connections, Part I: Tension Behavior. PCI J. 2009, 54, 49–66. [Google Scholar] [CrossRef]
  13. Mejia-McMaster, J.C.; Park, R. Test on special reinforcement for the end support of hollow-core slabs. PCI J. 1994, 39, 90–105. [Google Scholar] [CrossRef]
  14. Rosenthal, I. Full scale test of continuous prestressed hollow-core slab. PCI J. 1978, 23, 74–81. [Google Scholar] [CrossRef]
  15. Tan, K.H.; Zheng, L.X.; Paramasivam, P. Designing hollow-core slabs for continuity. PCI J. 1996, 41, 82–91. [Google Scholar] [CrossRef]
  16. ACI Committee 318. Building Code Requirements for Reinforced Concrete and Commentary; (ACI 318-14); American Concrete Institute: Farmington Hills, MI, USA, 2014. [Google Scholar]
  17. Korea Concrete Institute. Concrete Design Code; Kimoondang Publishing Company: Seoul, Korea, 2012. [Google Scholar]
  18. Collins, M.P.; Mitchell, D. Prestressed Concrete Structures; Prentice-Hall: Upper Saddle River, NJ, USA, 1991. [Google Scholar]
  19. MacGregor, J.G.; Wight, J.K. Reinforced Concrete Mechanics and Design, 4th ed.; Prentice-Hall: Upper Saddle River, NJ, USA, 2006. [Google Scholar]
  20. Bentz, E.C. Sectional Analysis of Reinforced Concrete Members. Ph.D. Dissertation, University of Toronto, Toronto, ON, Canada, 2000. [Google Scholar]
  21. Vecchio, F.J.; Collins, M.P. Modified Compression-Field Theory for Reinforced Concrete Elements Subjected to Shear. ACI J. 1986, 83, 219–231. [Google Scholar] [CrossRef]
  22. Vecchio, F.J.; Collins, M.P. Predicting the Response of Reinforced Concrete Beams Subjected to Shear Using Modified Compression Field Theory. ACI Struct. J. 1988, 85, 258–268. [Google Scholar] [CrossRef]
  23. Bentz, E.C.; Vecchio, F.J.; Collins, M.P. Simplified Modified Compression Field Theory for Calculating Shear Strength of Reinforced Concrete Elements. ACI Mater. J. 2006, 103, 614–624. [Google Scholar] [CrossRef]
Figure 1. Concept of an optimized-section precast slab with structural aesthetics (OPS).
Applsci 08 01234 g001
Figure 2. Manufacturing process of OPS.
Applsci 08 01234 g002
Figure 3. Framework of this study.
Applsci 08 01234 g003
Figure 4. Summary of the test specimens.
Applsci 08 01234 g004
Figure 5. Section details of the specimens (Unit: mm).
Applsci 08 01234 g005
Figure 6. Details of the shear reinforcement (Units: mm and degree).
Applsci 08 01234 g006
Figure 7. Test setup.
Applsci 08 01234 g007
Figure 8. Measurement of the strains and deflection (Unit: mm).
Applsci 08 01234 g008
Figure 9. Load-deflection responses.
Applsci 08 01234 g009
Figure 10. Failure crack patterns of the flexural specimens.
Applsci 08 01234 g010aApplsci 08 01234 g010b
Figure 11. Failure crack patterns of the shear specimens.
Applsci 08 01234 g011aApplsci 08 01234 g011b
Figure 12. Moment diagram and moment capacity of the NFW specimen.
Applsci 08 01234 g012
Figure 13. Failure crack patterns of the NFW and NFE specimens.
Applsci 08 01234 g013
Figure 14. Measured strains from the longitudinal and shear reinforcements.
Applsci 08 01234 g014
Figure 15. Strength evaluation results.
Applsci 08 01234 g015
Table 1. Summary of specimens.
SpecimenCompressive Strength of the Concrete, f c   ( MPa )   Longitudinal Reinforcement in the Top ( mm 2 ) Longitudinal Reinforcement in the Bottom ( mm 2 ) Shear Reinforcement ( mm 2 )
PCToppingRebarTendonRebarTendon
UF47-- 2 - ϕ 9 . 5 (110) 2 - D 16 (397) 2 - ϕ 15.2 (280) D 10 @ 300
USa and USb47-- 2 - ϕ 9 . 5 (110) 4 - D 16 (794) 2 - ϕ 15.2 (280) D 10 @ 400
CF4734 2 - D 10 (143) 2 - ϕ 9 . 5 (110) 2 - D 16 (397) 2 - ϕ 15.2 (280) D 10 @ 400
CSa ans CSb4734 2 - D 10 (143) 2 - ϕ 9 . 5 (110)   2 - D 16 + 2 - D 19 (970) 2 - ϕ 15.2 (280) D 10 @ 400
NFW and NFE *4734Center 2 - D 10 (143)End   2 - D 10 + 5 - D 19 (1575) 2 - ϕ 9 . 5 (110) 2 - D 16 (397) 2 - ϕ 15.2 (280) D 13 @ 300
* The specimens NFW and NFE have connecting steel bars of 2-D13 (253 mm2).
Table 2. Material test results of the reinforcements.
Diameter of RebarYield Strength, f y   ( MPa ) Yield Strength, f u   ( MPa )
D10505628
D13472590
D16462575
D19473636
D25529661
Table 3. Code equations for estimating the flexural and shear strength of the OPS [6,7].
TypeCode Equation *
Flexural strength M n = A p f p s ( d p a 2 ) + A s f y ( d a 2 ) + A s f y ( a 2 d )
Shear strength V c w = ( 0.29 f c k + 0.3 f p c ) b w d p (contribution of concrete)
V s = A v f y d s ( sin α cot β + cos α ) (contribution of stirrup)
* Note: A p = the sectional area of the prestressing strands (mm2); A s = the sectional area of the tension reinforcement (mm2); A s = the sectional area of the compression reinforcement (mm2); A v = the sectional area of the stirrup (mm2); a = the depth of the equivalent rectangular stress block (mm); b w = the web width (mm); d p = the depth of the prestressing strands (mm); d s = the depth of the tension reinforcement (mm); d = the depth of the compression reinforcement (mm); f p s = the stress in the prestressing strands at nominal flexural strength (MPa); f c k = the compressive strength of the concrete (MPa); f p c = the compressive stress at the centroid of the cross section after prestress release (MPa); s = the stirrup spacing (mm); α = the angle of the inclined sturrup (rad); β = the angle of the inclined critical crack (rad).
Table 4. Comparison of the test and analysis results.
Specimen (Flexure) M n , test
(kN·m)
M n , analysis
(kN·m)
Specimen (Shear) V n , test
(kN)
V n , analysis
(kN)
LSA *CodeR2K *Code
UF198198190USa165137189
CF277305275USb150137189
NFW949492CSa229216237
NFE403409398CSb242216231
* Note: LSA = Layered Sectional Analysis; R2K = RESPONSE2000.

