Strength, Permeability, and Freeze-Thaw Durability of Pervious Concrete with Different Aggregate Sizes, Porosities, and Water-Binder Ratios


College of Transportation, Jilin University, Changchun 130025, China
*
Author to whom correspondence should be addressed.
Appl. Sci. 2018, 8(8), 1217; https://doi.org/10.3390/app8081217
Submission received: 6 July 2018
/
Revised: 20 July 2018
/
Accepted: 20 July 2018
/
Published: 25 July 2018
(This article belongs to the Section Materials Science and Engineering)
Abstract
:Pervious concrete (PC), as an environmental friendly material, can be very important in solving urban problems and mitigating the impact of climate change; i.e., flooding, urban heat island phenomena, and groundwater decline. The objective of this research is to evaluate the strength, permeability, and freeze-thaw durability of PC with different aggregate sizes, porosities, and water-binder ratios. The orthogonal experiment method is employed in the study and nine experiments are conducted. The compressive strength, flexural strength, permeability coefficient, porosity, density, and freeze-thaw durability of PC mixtures are tested. Range analysis and variance analysis are carried out to analyze the collected data and estimate the influence of aggregate size, porosity, and water-binder ratio on PC properties. The results indicate that porosity is the most important factor determining the properties of PC. High porosity results in better permeability, but negatively affects the mechanical strength and freeze-thaw durability. PC of 15% porosity can obtain high compressive strength in excess of 20 MPa and favorable freeze-thaw durability of 80 cycles without sacrificing excessive permeability. Aggregate size also has a significant effect on freeze-thaw durability and mechanical strength. Small aggregate size is advantageous for PC properties. PC with 4.75–9.5 mm coarse aggregate presents excellent freeze-thaw durability. The influence of the water-binder ratio on PC properties is not as significant as that of aggregate size and porosity. An optimal mix ratio is required to trade-off between permeability, mechanical strength, and freeze-thaw durability.
1. Introduction
With rapid economic development, global urbanization has reached an unprecedented level. High urbanization generates excessive resource consumption and increased carbon emissions, which results in great changes in the global climate [1]. Cities are increasingly feeling the effects of extreme weather and many urban problems are caused by climate change, such as flooding and urban heat island phenomena [2]. It is extremely urgent to seek solutions for the mitigation of climate change impact and urban water management [3]. Pervious concrete, also called porous concrete, has been used since the 1970s in the United States and Japan. It is a kind of porous lightweight concrete made of aggregate, cement, and water. It has a honeycomb structure with uniformly distributed pores formed by coarse aggregate and a thin layer of cement paste [4,5]. With little or no fine aggregate, pervious concrete (PC) has the characteristics of high permeability, high noise absorption, and high heat dissipation [6,7,8]. Compared to traditional impervious concrete pavement, PC pavement is a functionally and environmentally friendly material [9]. It allows rainwater to permeate into the ground and replenish groundwater, which effectively alleviates the rapid decline of groundwater. In addition, PC pavement can solve other urban environmental problems [10,11,12]. With the development of Chinese sponge city construction, PC will be widely applied in road structure [13]. Therefore, PC is of great significance for mitigating climate change, solving urban problems, and promoting the development of human society [14,15,16].
The main properties of PC are strength, permeability, and durability. A porous structure is the key feature of PC, and porosity is the most important factor influencing mechanical strength, permeability, and durability. In general, the porosity of PC mixtures is 15–30% and the corresponding permeability coefficient lies in the range of 1–15 mm/s [17,18]. Higher porosity produces higher permeability, but is disadvantageous to mechanical strength and durability. Due to the absence of fine aggregate and the existence of high porosity, the strength of PC is lower than that of traditional impervious concrete. The compressive strength of PC is 5–30 MPa and tensile strength is 1.5–4.0 MPa [19,20]. In addition, the freeze-thaw durability of PC is a very important property, especially for PC used in seasonally frozen regions. However, the freeze-thaw durability of PC is significantly lower than that of conventional concrete. Based on the characteristics of PC, it is widely used in low-volume areas such as parks, sidewalks, squares, airports, and residential roads.
A large number of laboratory studies have been conducted focusing on properties of PC. Li et al. [21] used the orthogonal test method to study the influences of aggregate type, cementitious material dosage, and molding pressure on the permeability coefficient of PC. The experimental results showed that the aggregate type had no effect on the permeability coefficient, and the permeability coefficient decreased with an increased amount of cementitious material and forming pressure. Nguyen et al. [22] proposed an improved design method for PC based on the aggregate surface area and cement mortar layer thickness. The PC designed with this method had a compressive strength of 28.6 MPa and a permeability coefficient of 1 mm/s. The compressive strength was higher than what was reported in other studies.
Kayhanian et al. [23] studied the permeability of PC pavement in parking lots. It was concluded that age was the most important factor affecting permeability. Chandrappa and Biligiri [24] produced 18 groups of PC specimens with different aggregate sizes and the permeability coefficients were measured with a falling head permeability test. Based on scanning electron microscopy (SEM), the effects of pore size, connectivity, and distribution on permeability were analyzed and the relationship between hydraulic gradient, flow velocity, and pore distribution was established. Zhong et al. [25] studied the effect of pore tortuosity on the permeability of PC and proposed relative pore size and pore tortuosity indices. Relative pore size and pore tortuosity were introduced into the Kozeny–Carman model to assess permeability. At the same time, the effect of mortar workability, aggregate size, and aggregate-binder ratio on permeability was tested. The experimental results showed that the workability of cement affected the porosity tortuosity and aggregate size affected the connectivity of pores. The aggregate-binder ratio was directly related to effective porosity.
Gaedicke et al. [26] studied the relationship between the split tensile strength and compressive strength of PC. The strength experiment was conducted with specimens molded in the lab and core samples obtained from actual pavement. The results showed that the type of aggregate had a great influence on the strength of PC. Based on the experimental data, a relationship between split tensile strength and compressive strength was proposed. Zhong and Wille [27,28] analyzed the influencing factors of compressive strength with different aggregate sizes and aggregate-binder ratios. The results indicated that strength decreased with increased aggregate size. The aggregate-binder ratio affected strength by affecting porosity. A semi-empirical prediction equation for PC compressive strength was established. The effects of cementitious material strength, total porosity, aggregate size, and average pore size on compressive strength were also studied. Li et al. [29] produced a high-strength PC that was formed by making a certain number of vertical cylindrical holes 4 mm in diameter on high-strength concrete specimens. In the test, porosity was 1.3–2.8%, measured compressive strength was over 70 MPa, tensile strength was 10 MPa, and the water permeability coefficient reached 13–22 mm/s.
Akand et al. [30] studied the relationship between microscopic pore structure and macroscopic properties of PC through scanning technology and the finite element method. 20% porosity concrete specimens were made in the lab. The pore size, distribution, and shape were obtained. Based on scanning images, the finite element model of PC was established. Strength and elastic modulus calculated by finite element model were compared with the measured values. The results showed that the accuracy of the established model was satisfied. Pieralisi et al. [31] established PC discrete element constitutive law based on cementation between aggregate and cement paste. The effectiveness of the method was verified by the experiments with different aggregate types, grading curves, and aggregate-to-binder ratios. Based on the mathematical approach and the finite element method, Samuel et al. [32] established the prediction model of permeability with the microstructure parameters (pore size, pore distribution) of PC. The predicted values of the model were consistent with the measured values.
The existing studies are mainly focused on the design of mixed ratios, mechanical properties, and permeability. The test parameters (such as aggregate size, water-binder ratio, and porosity) adopted are different, which results in a great difference among studies. For example, most researchers use mono-sized coarse aggregate, but some researchers adopt continuous-graded coarse aggregate. However, there are few studies concentrating on the influence of coarse aggregate size, water-binder ratio, and porosity on mechanical strength, permeability, and freeze-thaw durability of PC. It is necessary to carry out systematic and comprehensive research. Based on the current literature, this article studies the influence of aggregate size, porosity, and water-binder ratio on compressive strength, tensile strength, permeability coefficient, and freeze-thaw durability based on an orthogonal experiment.
2. Materials and Methods
2.1. Materials
The main materials used in the experiments were Portland cement, natural granite coarse aggregate (NGCA), and superplasticizer. Portland cement (P.II 52.5) was produced by Jilin Yatai Cement Co., Ltd. (Jilin, China), and its properties are shown in Table 1. NGCA of 5–25 mm was acquired from a concrete mixing station in Jilin Province and sieved to obtain three sizes: 4.75–9.5 mm, 9.5–13.2 mm, and 13.2–16 mm. Physical properties of NGCA are shown in Table 2. In order to improve the workability of PC, a polycarboxylic acid superplasticizer was applied. The amount of polycarboxylic acid superplasticizer was 1% of the mass of cement.
2.2. Mix Design
The volumetric method was used to design the mixtures according to the national standard [33]. The aggregate size, porosity, and water-binder ratio were chosen as the orthogonal factors in the mixture design based on the orthogonal experiment. Every factor had three levels of aggregate size: 4.75–9.5 mm, 9.5–13.2 mm, and 13.2–16 mm. For the designed porosity, the first to third levels were 15%, 20%, and 25%. For the water-binder ratio, the first to third levels were 0.25, 0.30, and 0.35. The mix ratio is shown in Table 3. The cement paste encapsulating aggregate method was adopted to make mixtures, and the procedures were as follows: (1) put all coarse aggregate and half the water into a standard mixer and stir for 30 s; (2) add all cement and stir for 40 s; (3) add the rest of the water and superplasticizer and stir for 50 s. The rodding method was adopted to form specimens, and the specimens were demolded after 24 h. Then all specimens were cured for 28 days with relative humidity 95% and temperature 20 ± 2 °C.
2.3. Testing Methods
The density of specimens was calculated by measuring the mass and volume with 100 × 100 × 100 mm3 specimens. Before the measurement, all specimens were dried in an oven at 105 °C for 24 h.
Porosity is an important index for PC. In general, there is open pore, semi-open pore, and closed pore. Only open pore and semi-open pore are effective for concrete permeability, but all three kinds influence the microstructure and macroproperties of PC. In this study, total porosity (open pore, semi-open pore, and closed pore) and effective porosity (open pore and semi-open pore) were measured with 100 × 100 × 100 mm3 specimens in every group and calculated by the following equations:
where Pt is the total porosity of the specimen (%); Pe is the effective porosity of the specimen (%); m0 is the mass of the specimen submerged in water (g); m1 is the mass of the oven-dried specimen (g); m2 is the saturated surface-dry mass of the specimen (g); ρw is the water density (g/cm3), and V is the volume of the specimen (cm3).
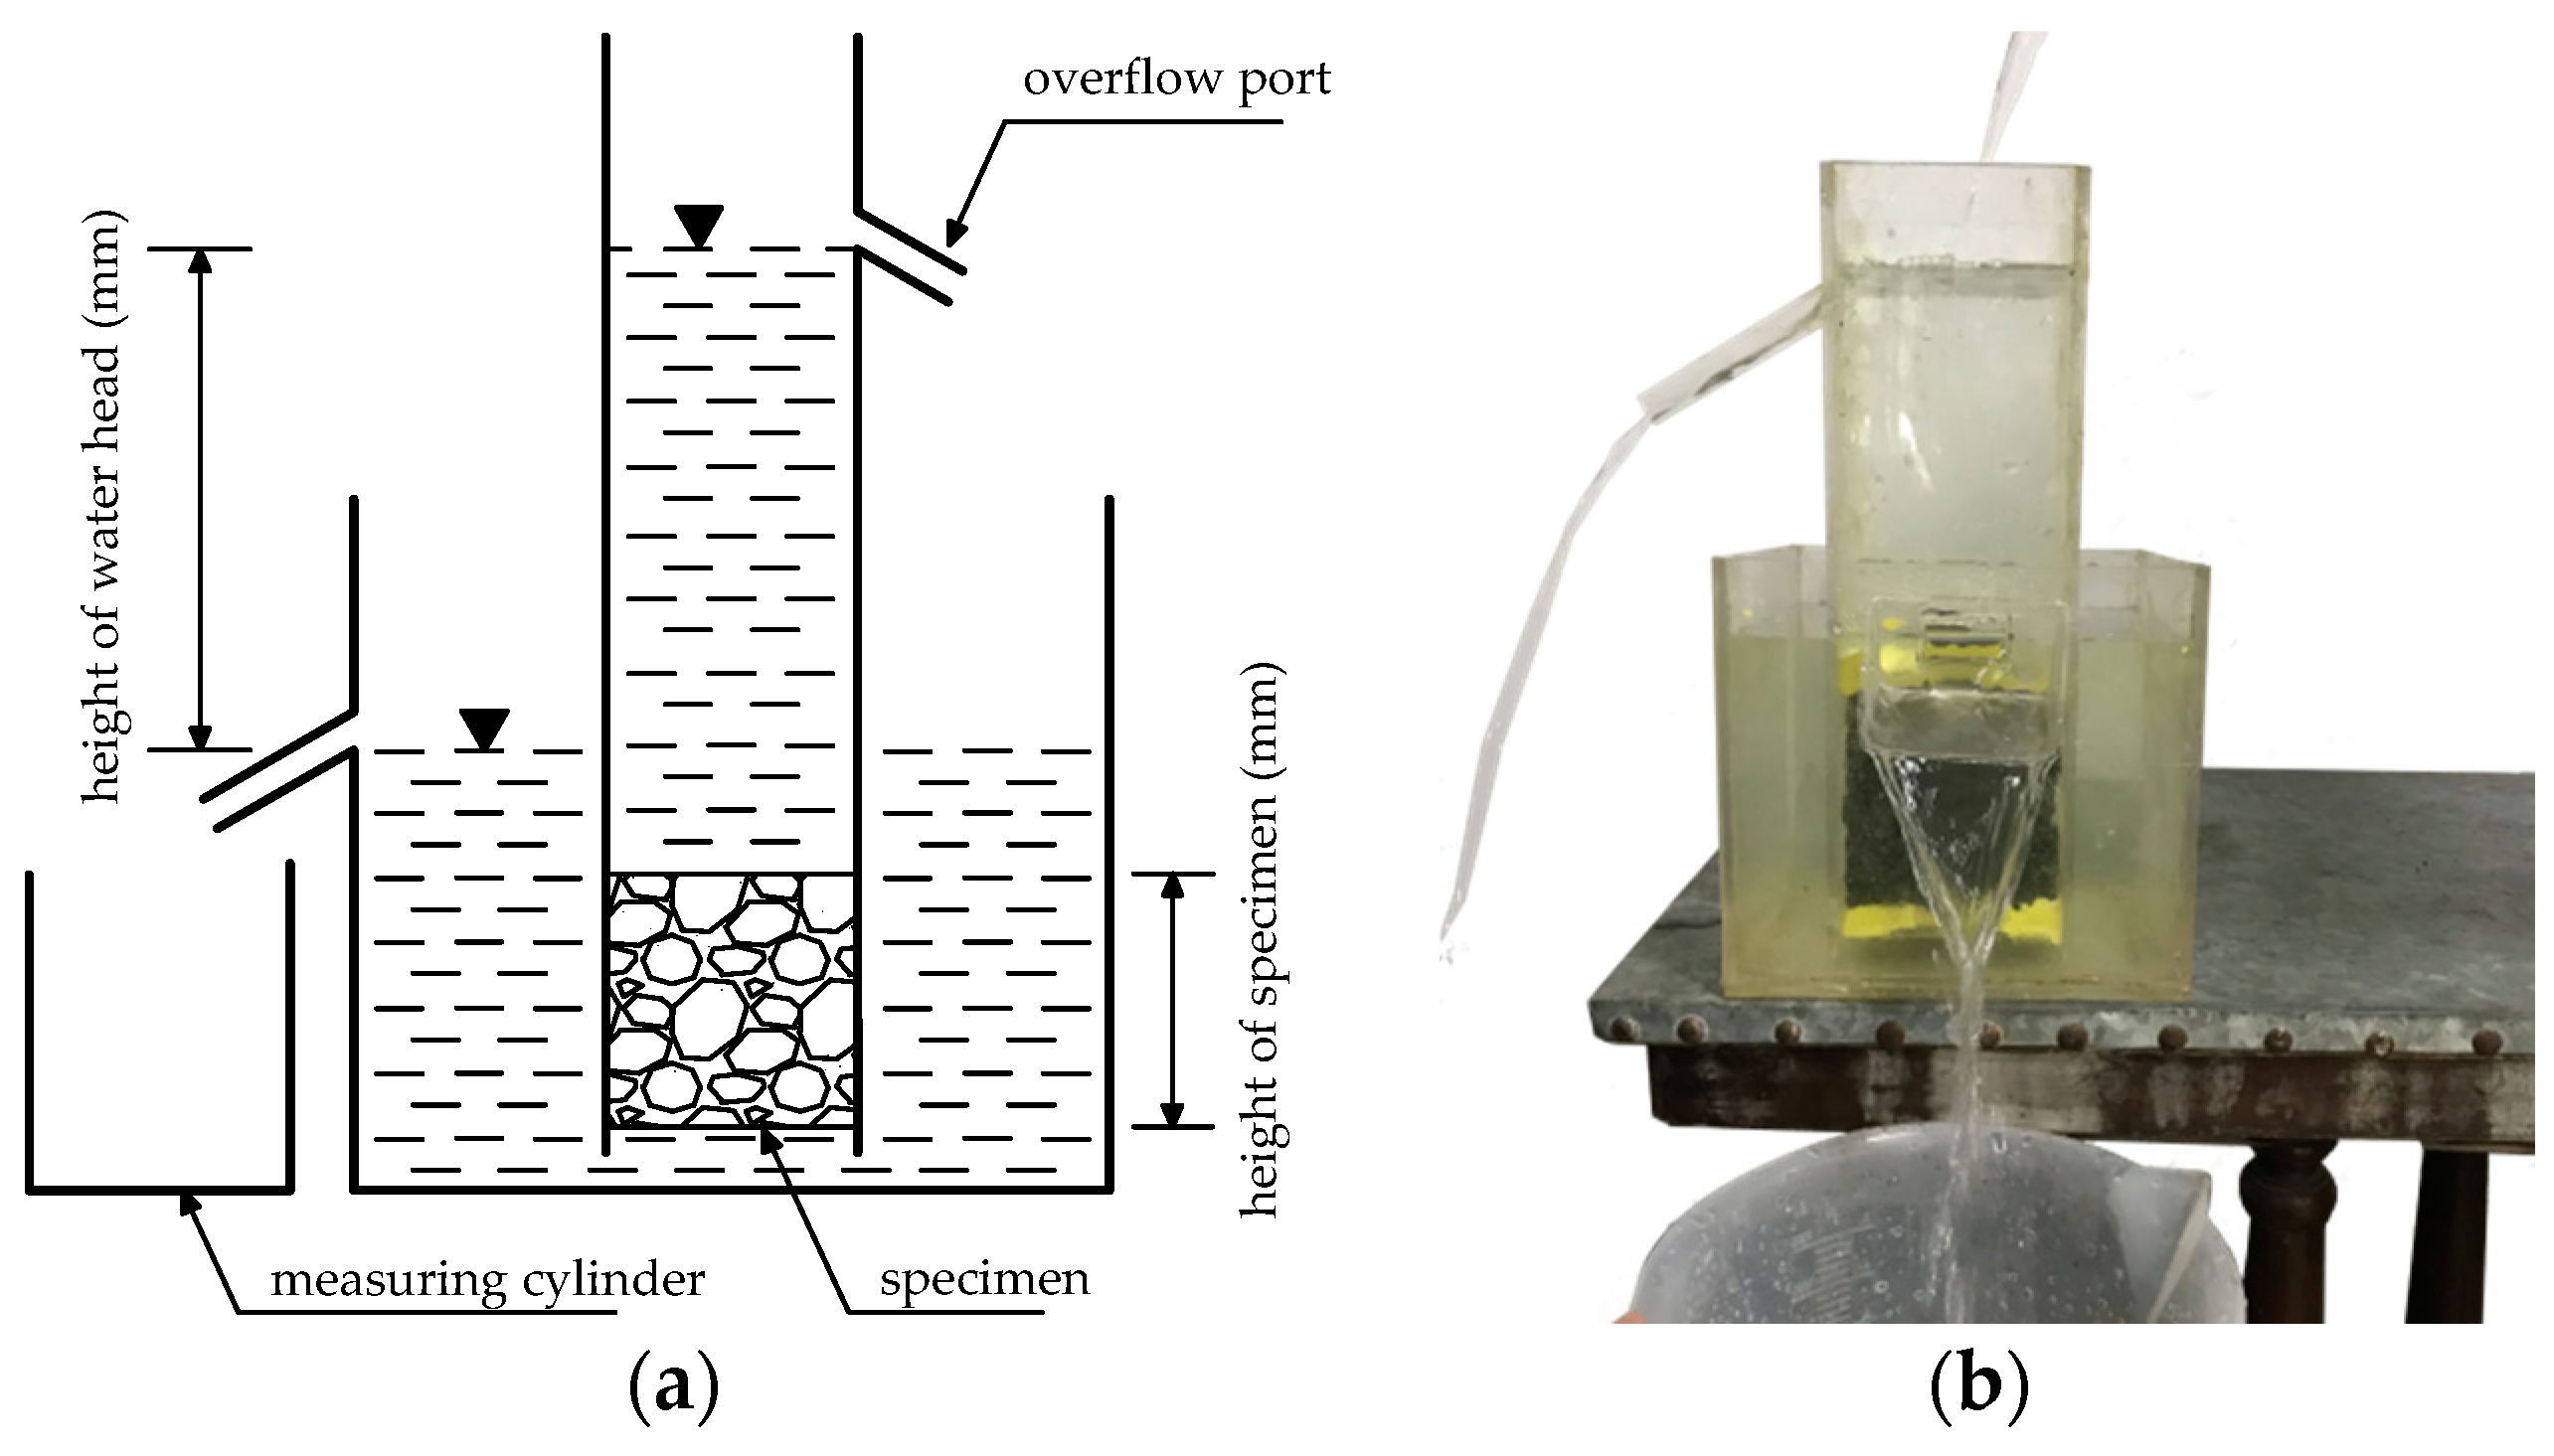
Generally, the constant head permeability test and falling head permeability test are used to measure the permeability coefficient of PC. In this study, the permeability coefficient was determined by the constant head permeability test according to the national standard [33]. In every group, 100 × 100 × 100 mm3 specimens were used to measure the permeability coefficient. The test method for PC permeability coefficient is shown in Figure 1. In order to prevent leakage around the specimen, the specimen was sealed with plasticine and plastic wrap. The permeability coefficient can be calculated by the following equation:
where k is the permeability coefficient (mm/s); Q is the discharged amount of water in t time (mm3); L is the height of the specimen (mm); A is the upper surface area of the specimen (mm2); H is the height of water head (mm), H = 150 mm; t is the time (s), t = 300 s.
The compressive strength and flexural strength of PC specimens were measured according to the national standard [34]. The specimen for the compressive strength test was 100 × 100 × 100 mm3. Three-point bending test was adopted to determine flexural strength with 100 × 100 × 400 mm3 specimen. The equations to calculate strength are as follows:
where fc is the compressive strength of the specimen (MPa); ff is the flexural strength of the specimen (MPa); A is the pressure-bearing surface area of the specimen, A = 104 mm2; F is the failure load (N); L is the distance between two supporting points (mm), L = 300 mm; b is the section width of the specimen (mm), b = 100 mm; and h is height of the specimen (mm), h = 100 mm.
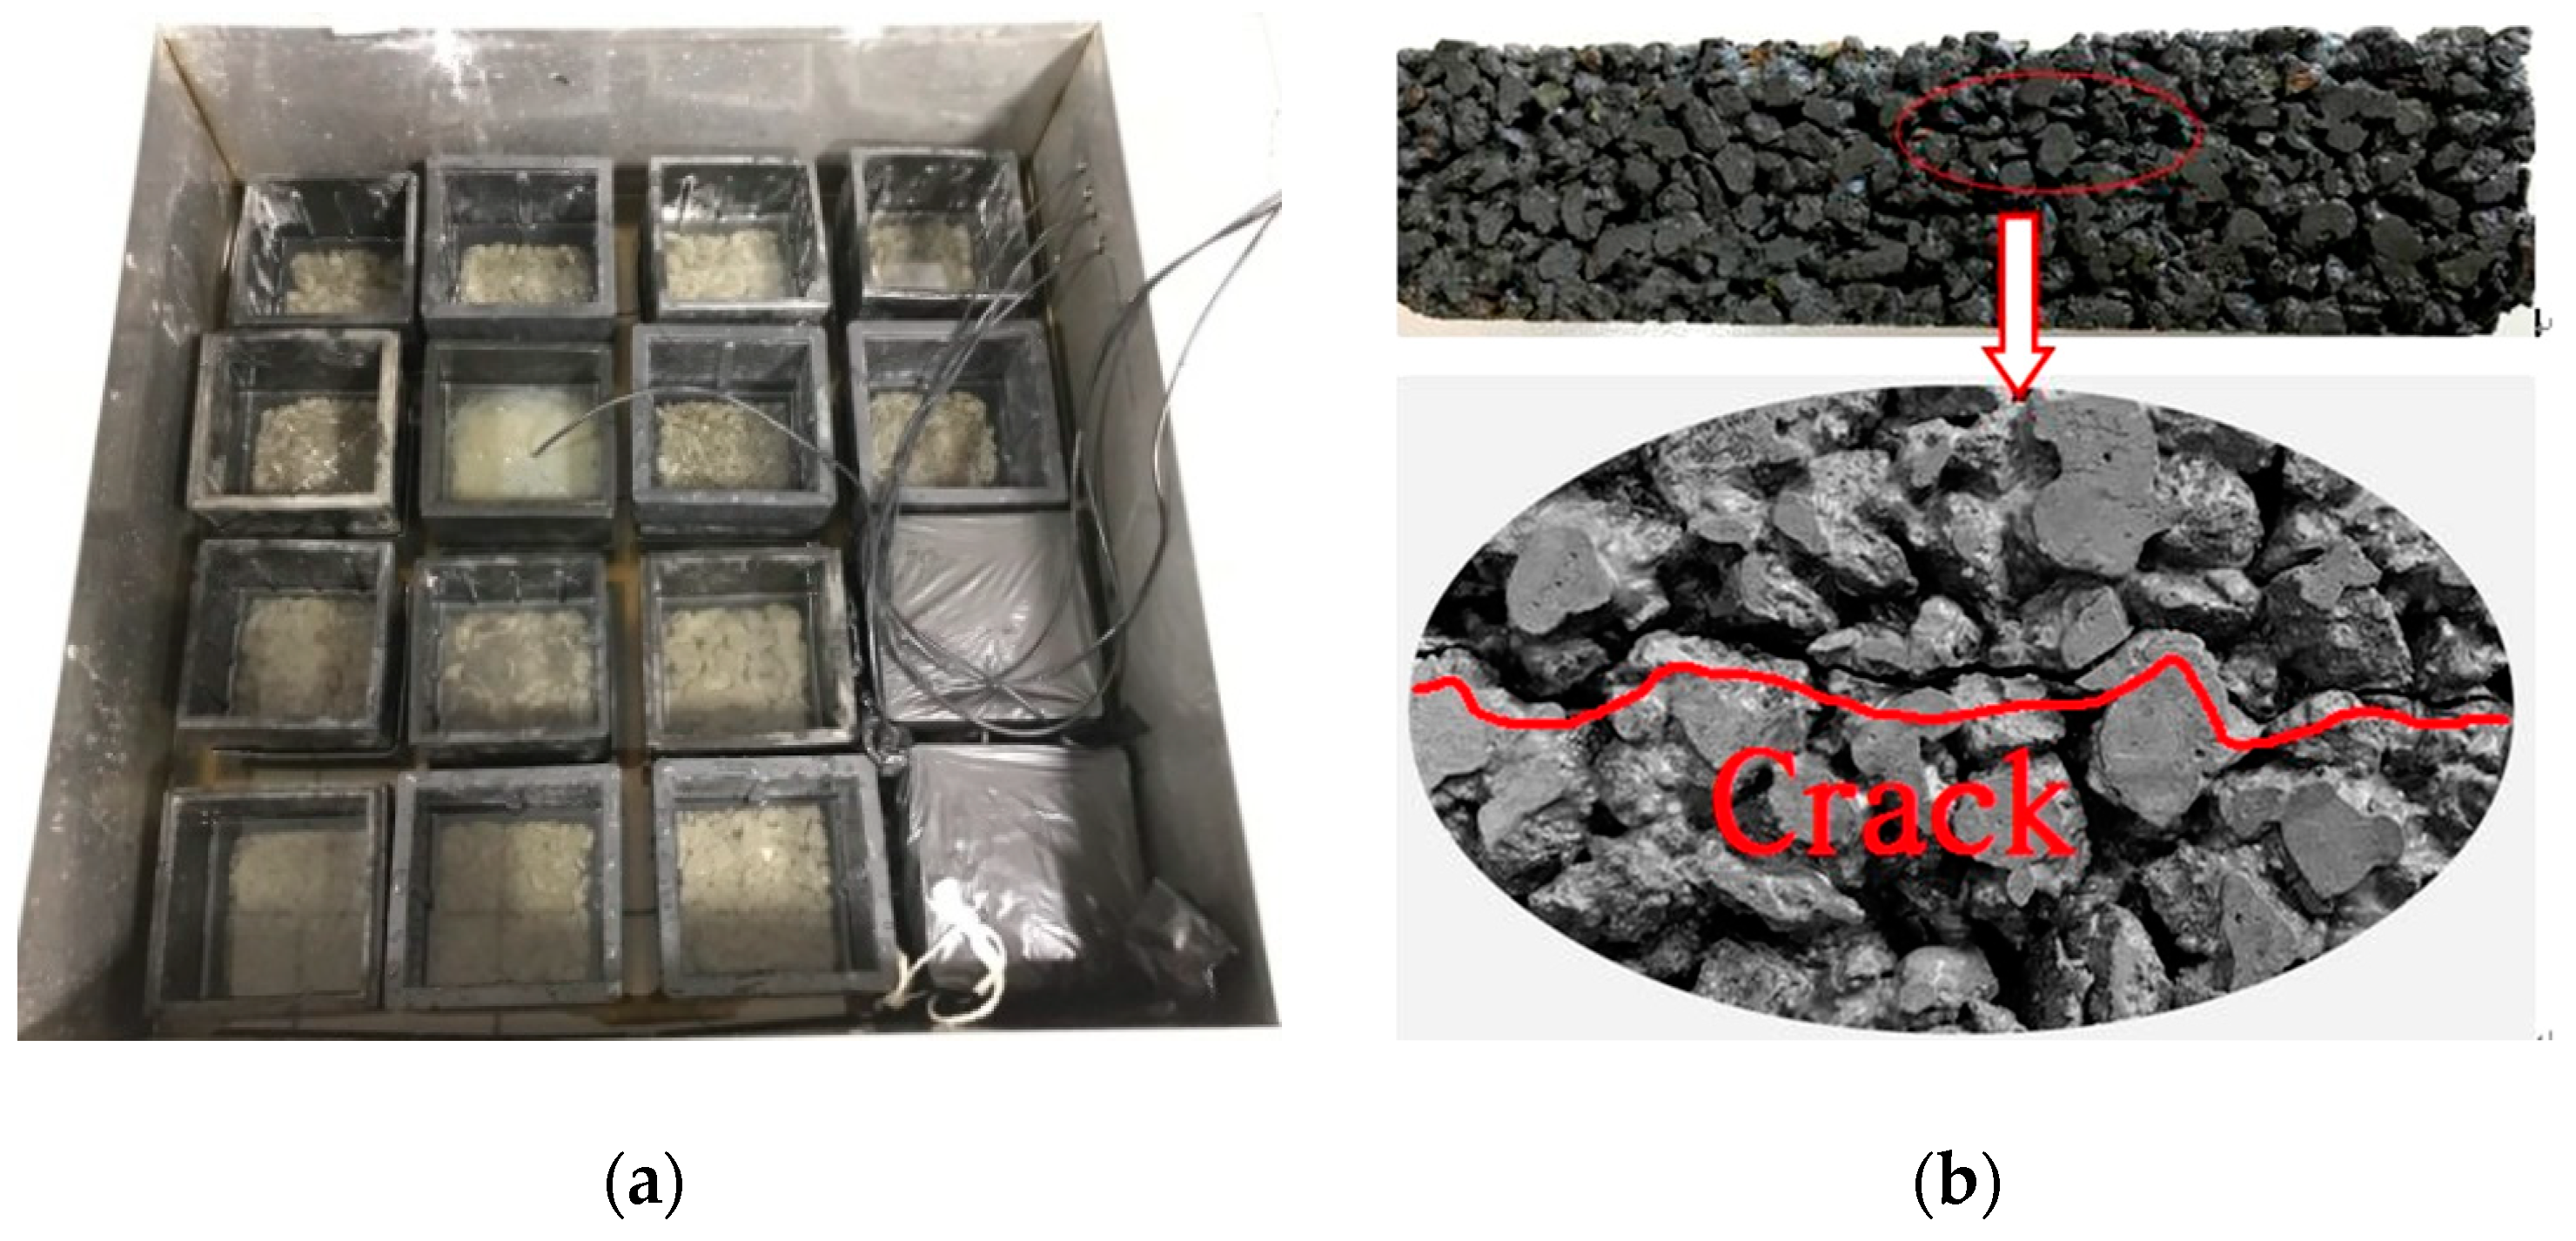
The freeze-thaw test was conducted according to national standard [35]. In the test, 100 × 100 × 400 mm3 specimens were used. Based on the concrete spalling on the surface of specimens in the experiment, it was found that the damage pattern of PC specimen under freeze-thaw cycles was different from ordinary concrete. For ordinary concrete, spalling occurs on the surface of specimen under the freeze-thaw cycles, and the spalling increases with increased freeze-thaw cycles. The loss of mass is usually used as evaluation index. PC has higher porosity than ordinary concrete. Under the action of the freeze-thaw cycles, a large amount of moisture enters into the interior pores of the specimen. The pore water freezes and expands, which causes cracks. From the actual results of the freeze-thaw cycles, the PC produced obvious cracks and lost bearing capacity even though the mass loss was very small (or there was no mass loss). The freeze-thaw cycles were recorded when the specimen cracked. The specimens were checked every 10 freeze-thaw cycles and the crack development was recorded. The freeze-thaw cycles test is shown in Figure 2.
3. Results and Discussion
All parameters of PC were tested with three specimens in each group. Except for the result of freeze-thaw cycles, which is expressed by the mode, the other test results are expressed by the mean. The experimental results with standard deviation (Sd) are listed in Table 4.
3.1. Analysis of Orthogonal Test Results
3.1.1. Range Analysis
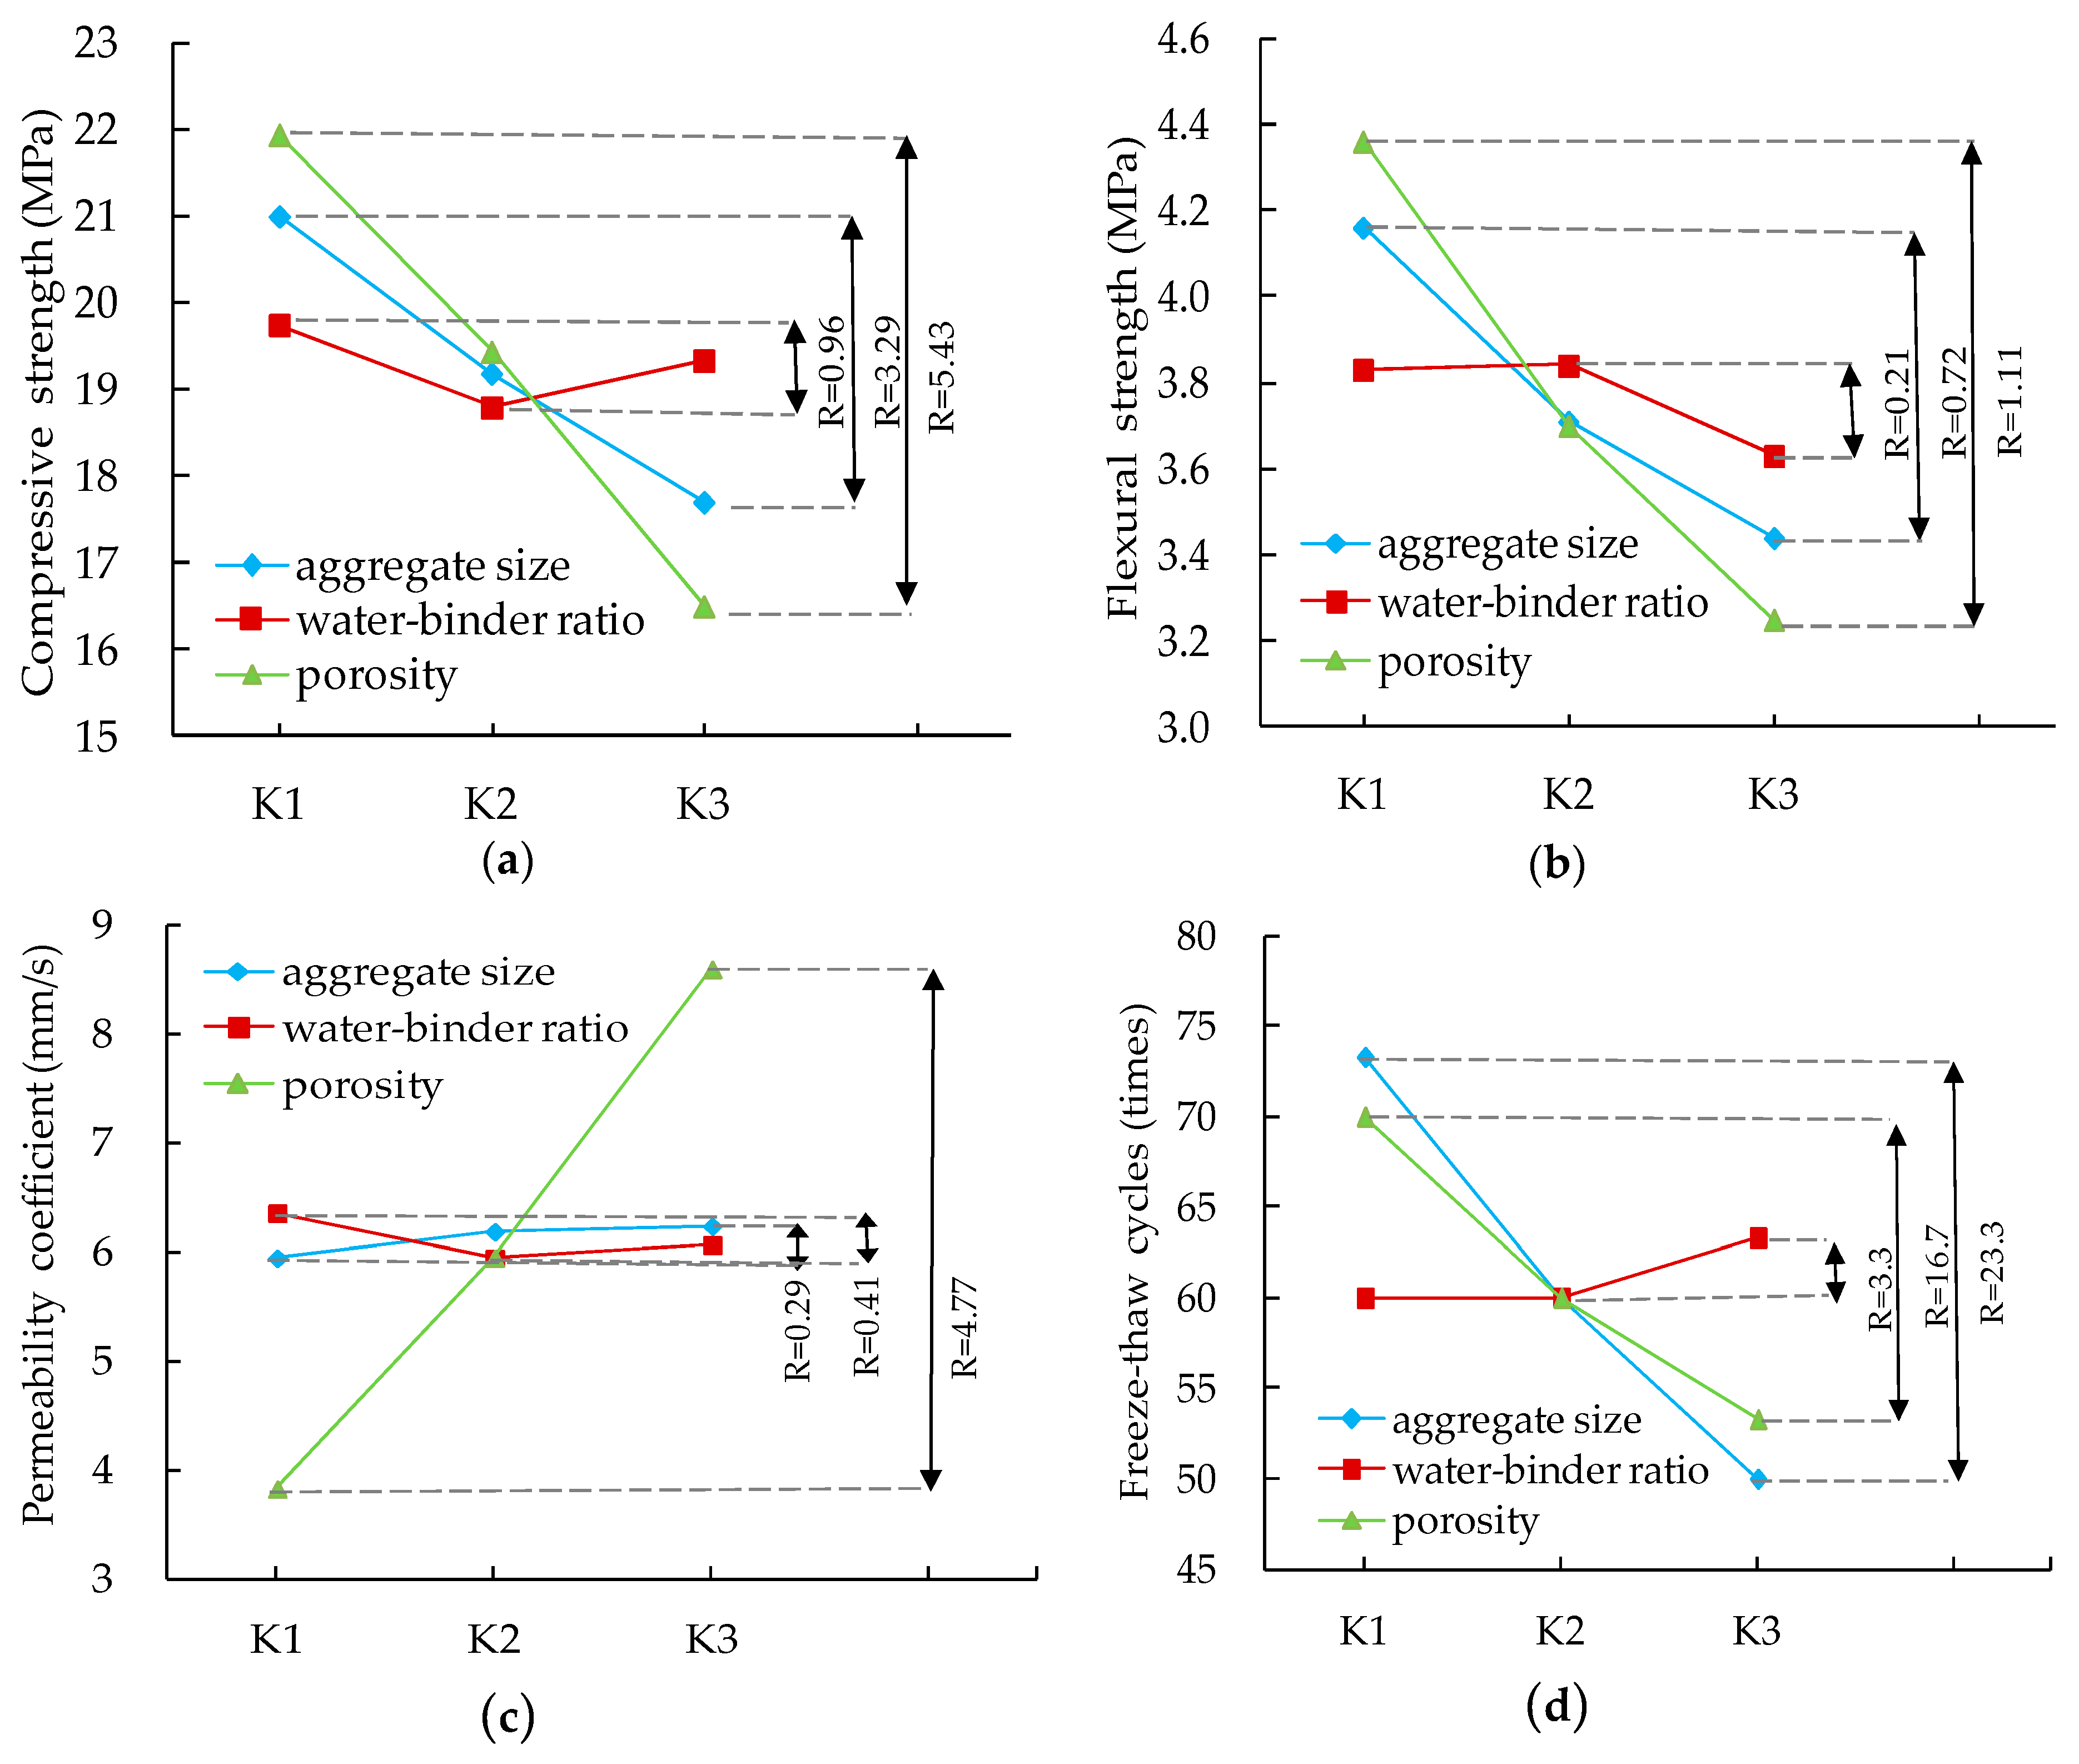
The range analysis results are listed in Table 5. K represents the average value of performance indices at a certain level of factor. K1, K2, and K3 represent the average value of performance indices at the first level of factor, the second level of factor, and third level of factor, respectively. R is the difference between maximum and minimum K. The larger the R value, the greater the influence of the factor on the corresponding performance indices. In Table 5, A represents aggregate size, W/B represents water-binder ratio, and P represents porosity. The relationships between property indices and K values are shown in Figure 3.
Figure 3a shows the influence of factors on the compressive strength of PC. Based on the size of R and K values, we can conclude that the primary and secondary order of influence factors is porosity, aggregate size, and water-binder ratio. The optimal combination is porosity 15%, aggregate size 4.75–9.5 mm, and W/B 0.25. Figure 3b shows the influence of factors on flexural strength. Based on R and K values, the primary and secondary order of the influence factors is porosity, aggregate size, and water-binder ratio. The optimal combination is porosity 15%, aggregate size 4.75–9.5 mm, and W/B 0.30. Figure 3c shows the influence of various factors on permeability coefficient. Based on R and K values, the primary and secondary order of the influence factors is porosity, water-binder ratio, and aggregate size. The optimal combination is porosity 25%, W/B 0.25, and aggregate size 13.2–16.0 mm. Figure 3d shows the influence of various factors on freeze-thaw cycles. Based on R and K values, the primary and secondary order of the influence factors is aggregate size, porosity, and water-binder ratio. The optimal combination is aggregate size 4.75–9.5 mm, porosity 15%, and W/B 0.35.
3.1.2. Variance Analysis
A variance analysis for the orthogonal experiment was conducted. The significance levels of F0.01 (2,2) and F0.05 (2,2) were used to evaluate the significance of factors. The variance analysis results are listed in Table 6. From Table 6, following conclusions can be drawn: (a) F-values of porosity for flexural strength and permeability coefficient are larger than F0.01 (2,2), which means there is a 99% probability that porosity has a significant influence on flexural strength and the permeability coefficient. F-value for the permeability coefficient is larger than that for flexural strength, which means the influence of porosity on the permeability coefficient is larger than that on flexural strength. F-values of porosity for compressive strength and the freeze-thaw cycles are between F0.01 (2,2) and F0.05 (2,2), which means there is a 95% probability that porosity has a significant influence on compressive strength and the freeze-thaw cycles. The F-value for compressive strength is larger than that for the freeze-thaw cycles, which means the influence of porosity on compressive strength is larger than that on the freeze-thaw cycles. (b) F-values of aggregate size for compressive strength, flexural strength, and the freeze-thaw cycles are between F0.01 (2,2) and F0.05 (2,2), which means there is a 95% probability that aggregate size has a significant influence on compressive strength, flexural strength, and the freeze-thaw cycles. F-value for flexural strength is larger than that for compressive strength and the freeze-thaw cycles, which means the influence of aggregate size on flexural strength is larger than that on compressive strength and the freeze-thaw cycles. F-value of aggregate size for the permeability coefficient is smaller than F0.05 (2,2), which means the influence of aggregate size on the permeability coefficient is not significant. (c) F-values of the water-binder ratio for PC properties (compressive strength, flexural strength, permeability coefficient, and freeze-thaw cycles) are smaller than F0.05 (2,2), which means the influence of the water-binder ratio on PC properties is not significant. The reason may be that the addition of superplasticizer weakens the influence of the water-binder ratio.
3.2. Influence Factor Analysis for PC Properties
3.2.1. Density and Porosity
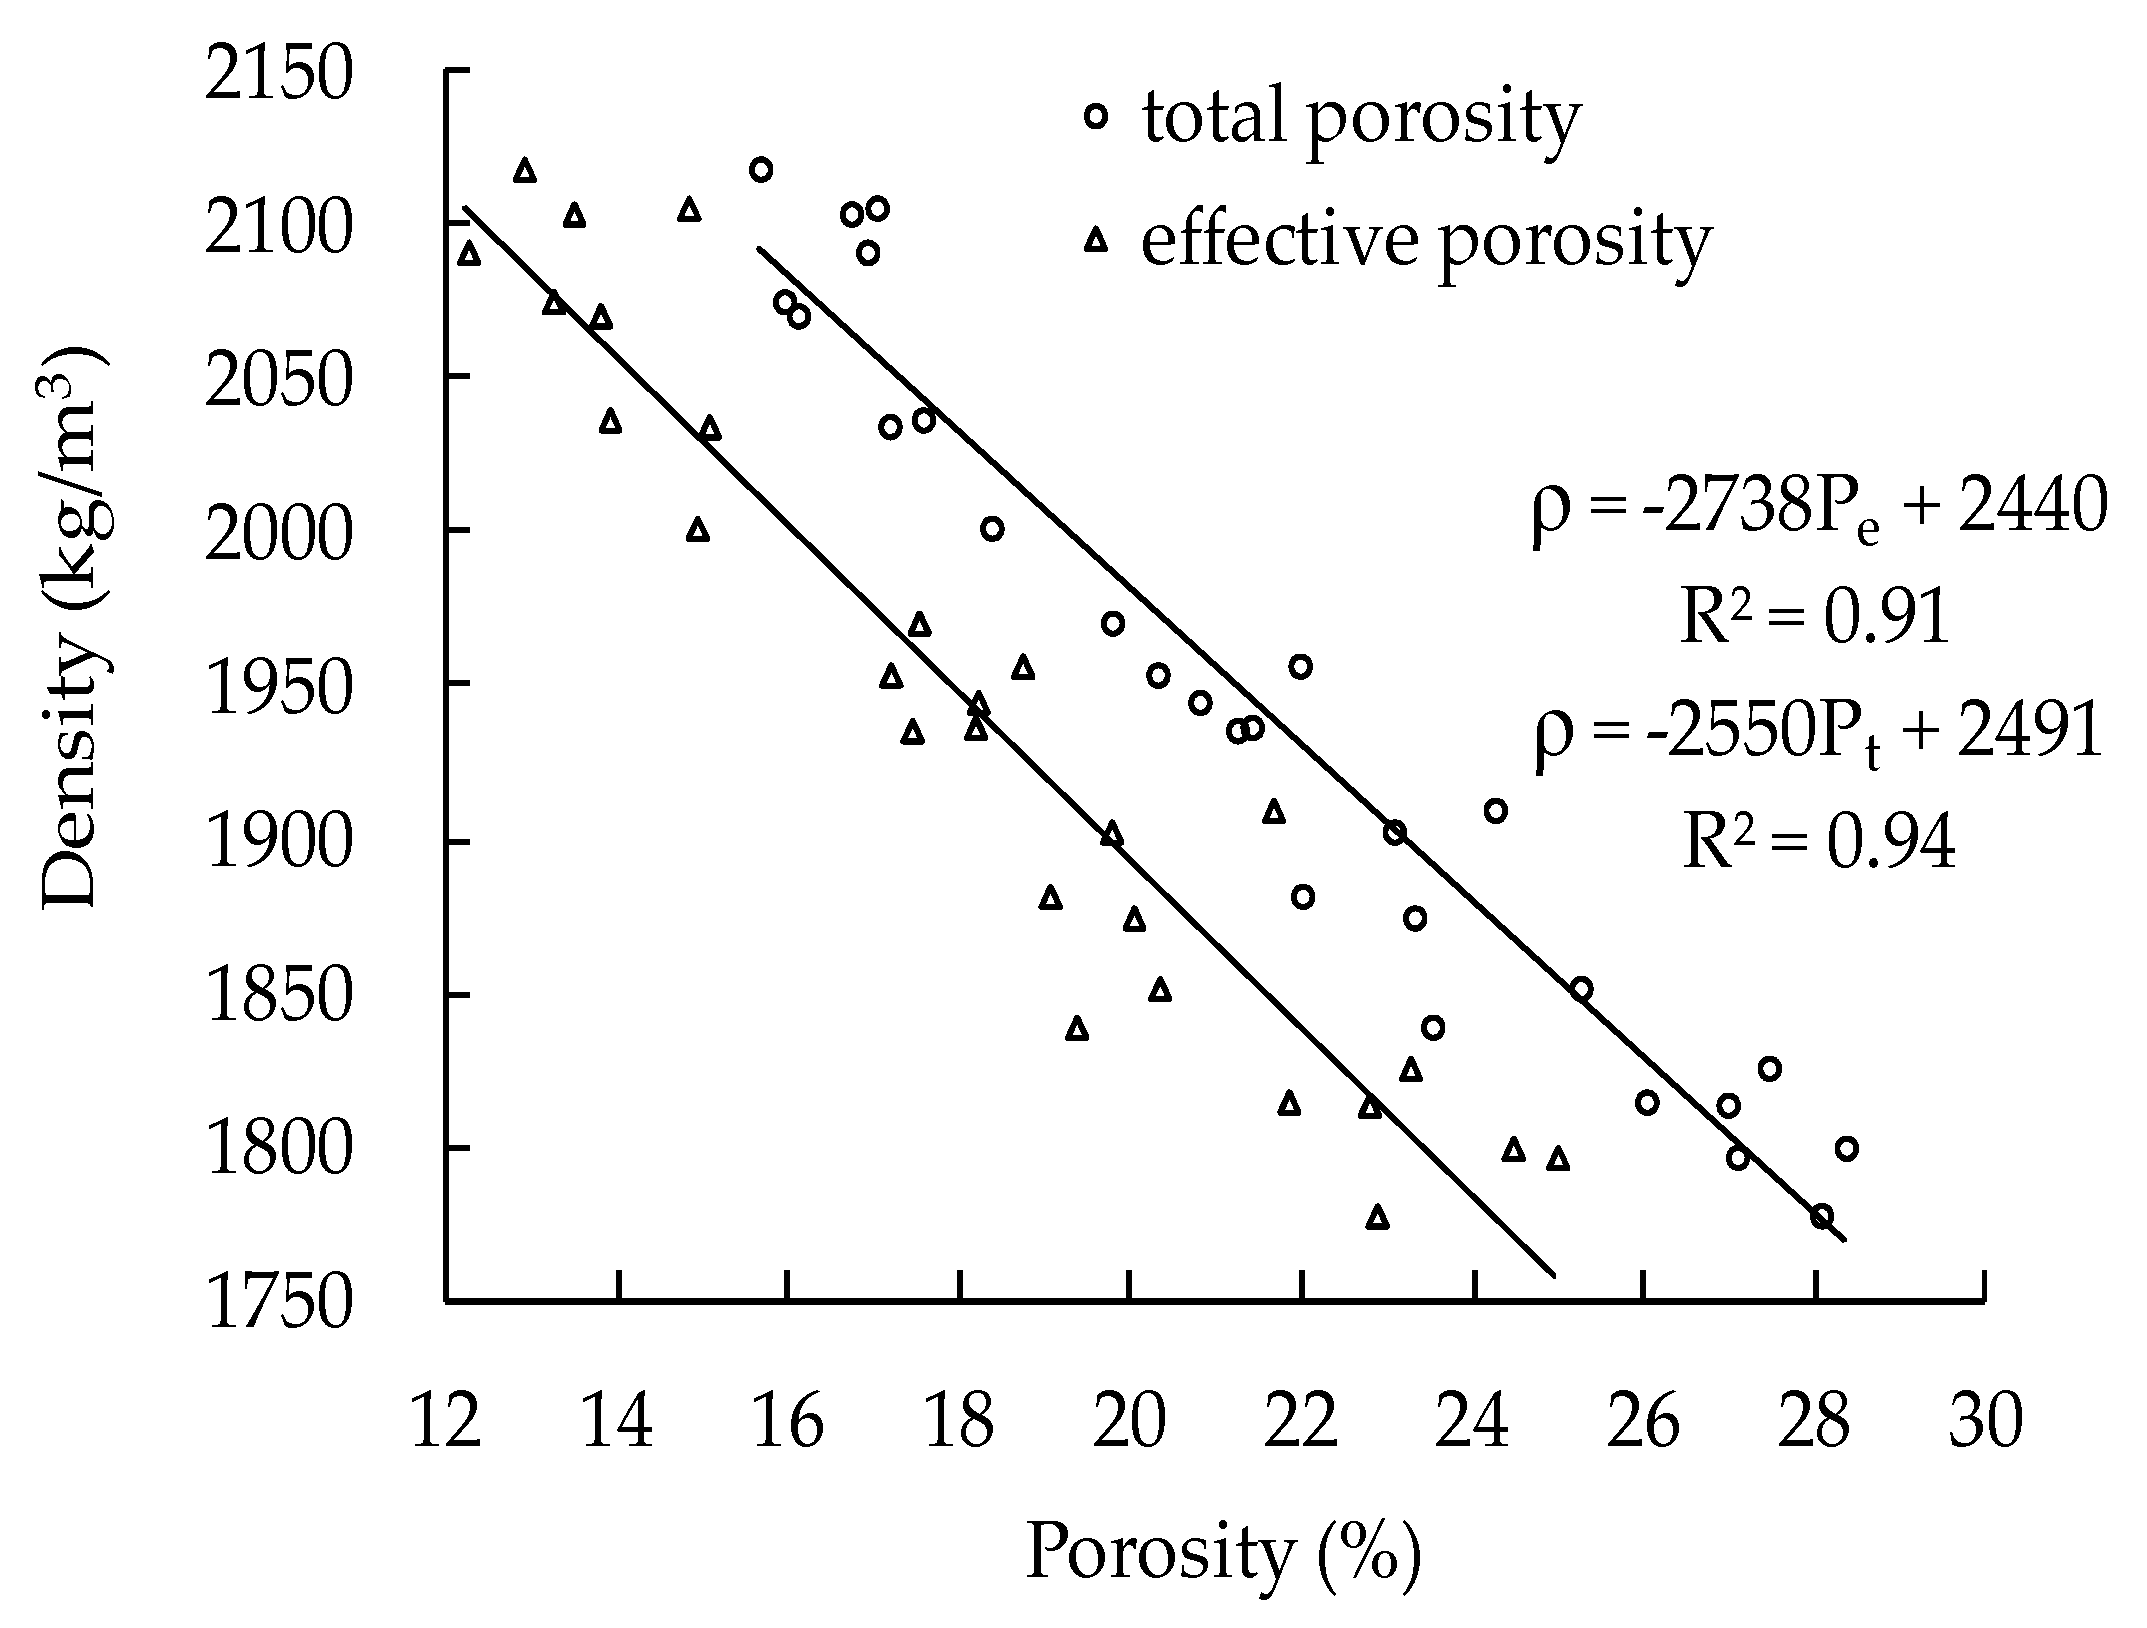
The measured data in Table 4 indicate that the density of PC is about 1800–2100 kg/m3, which is less than that of traditional impervious concrete. Due to porosity, PC becomes lighter. We can conclude that density decreases by 306 kg/m3 as the corresponding total porosity increases by 10.7%, which means that density changes by 28.6 kg/m3 with 1% porosity change. The relationship between density and measured porosity of all specimens is shown in Figure 4. From Figure 4 it can be concluded that density decreases with the increase of total porosity and effective porosity. The linear function can be used to describe the relationship. The correlation coefficient between density and total porosity is 0.94. The correlation coefficient between density and effective porosity is 0.91.
The relationship between measured average porosity and designed porosity is shown in Figure 5. We can conclude that measured porosity is very close to designed porosity. Total porosity is a little larger than designed porosity, and effective porosity is less than designed porosity. Effective porosity is about 80–90% of total porosity, which means a closed pore makes up about 10–20% of a total pore.
3.2.2. Permeability Coefficient
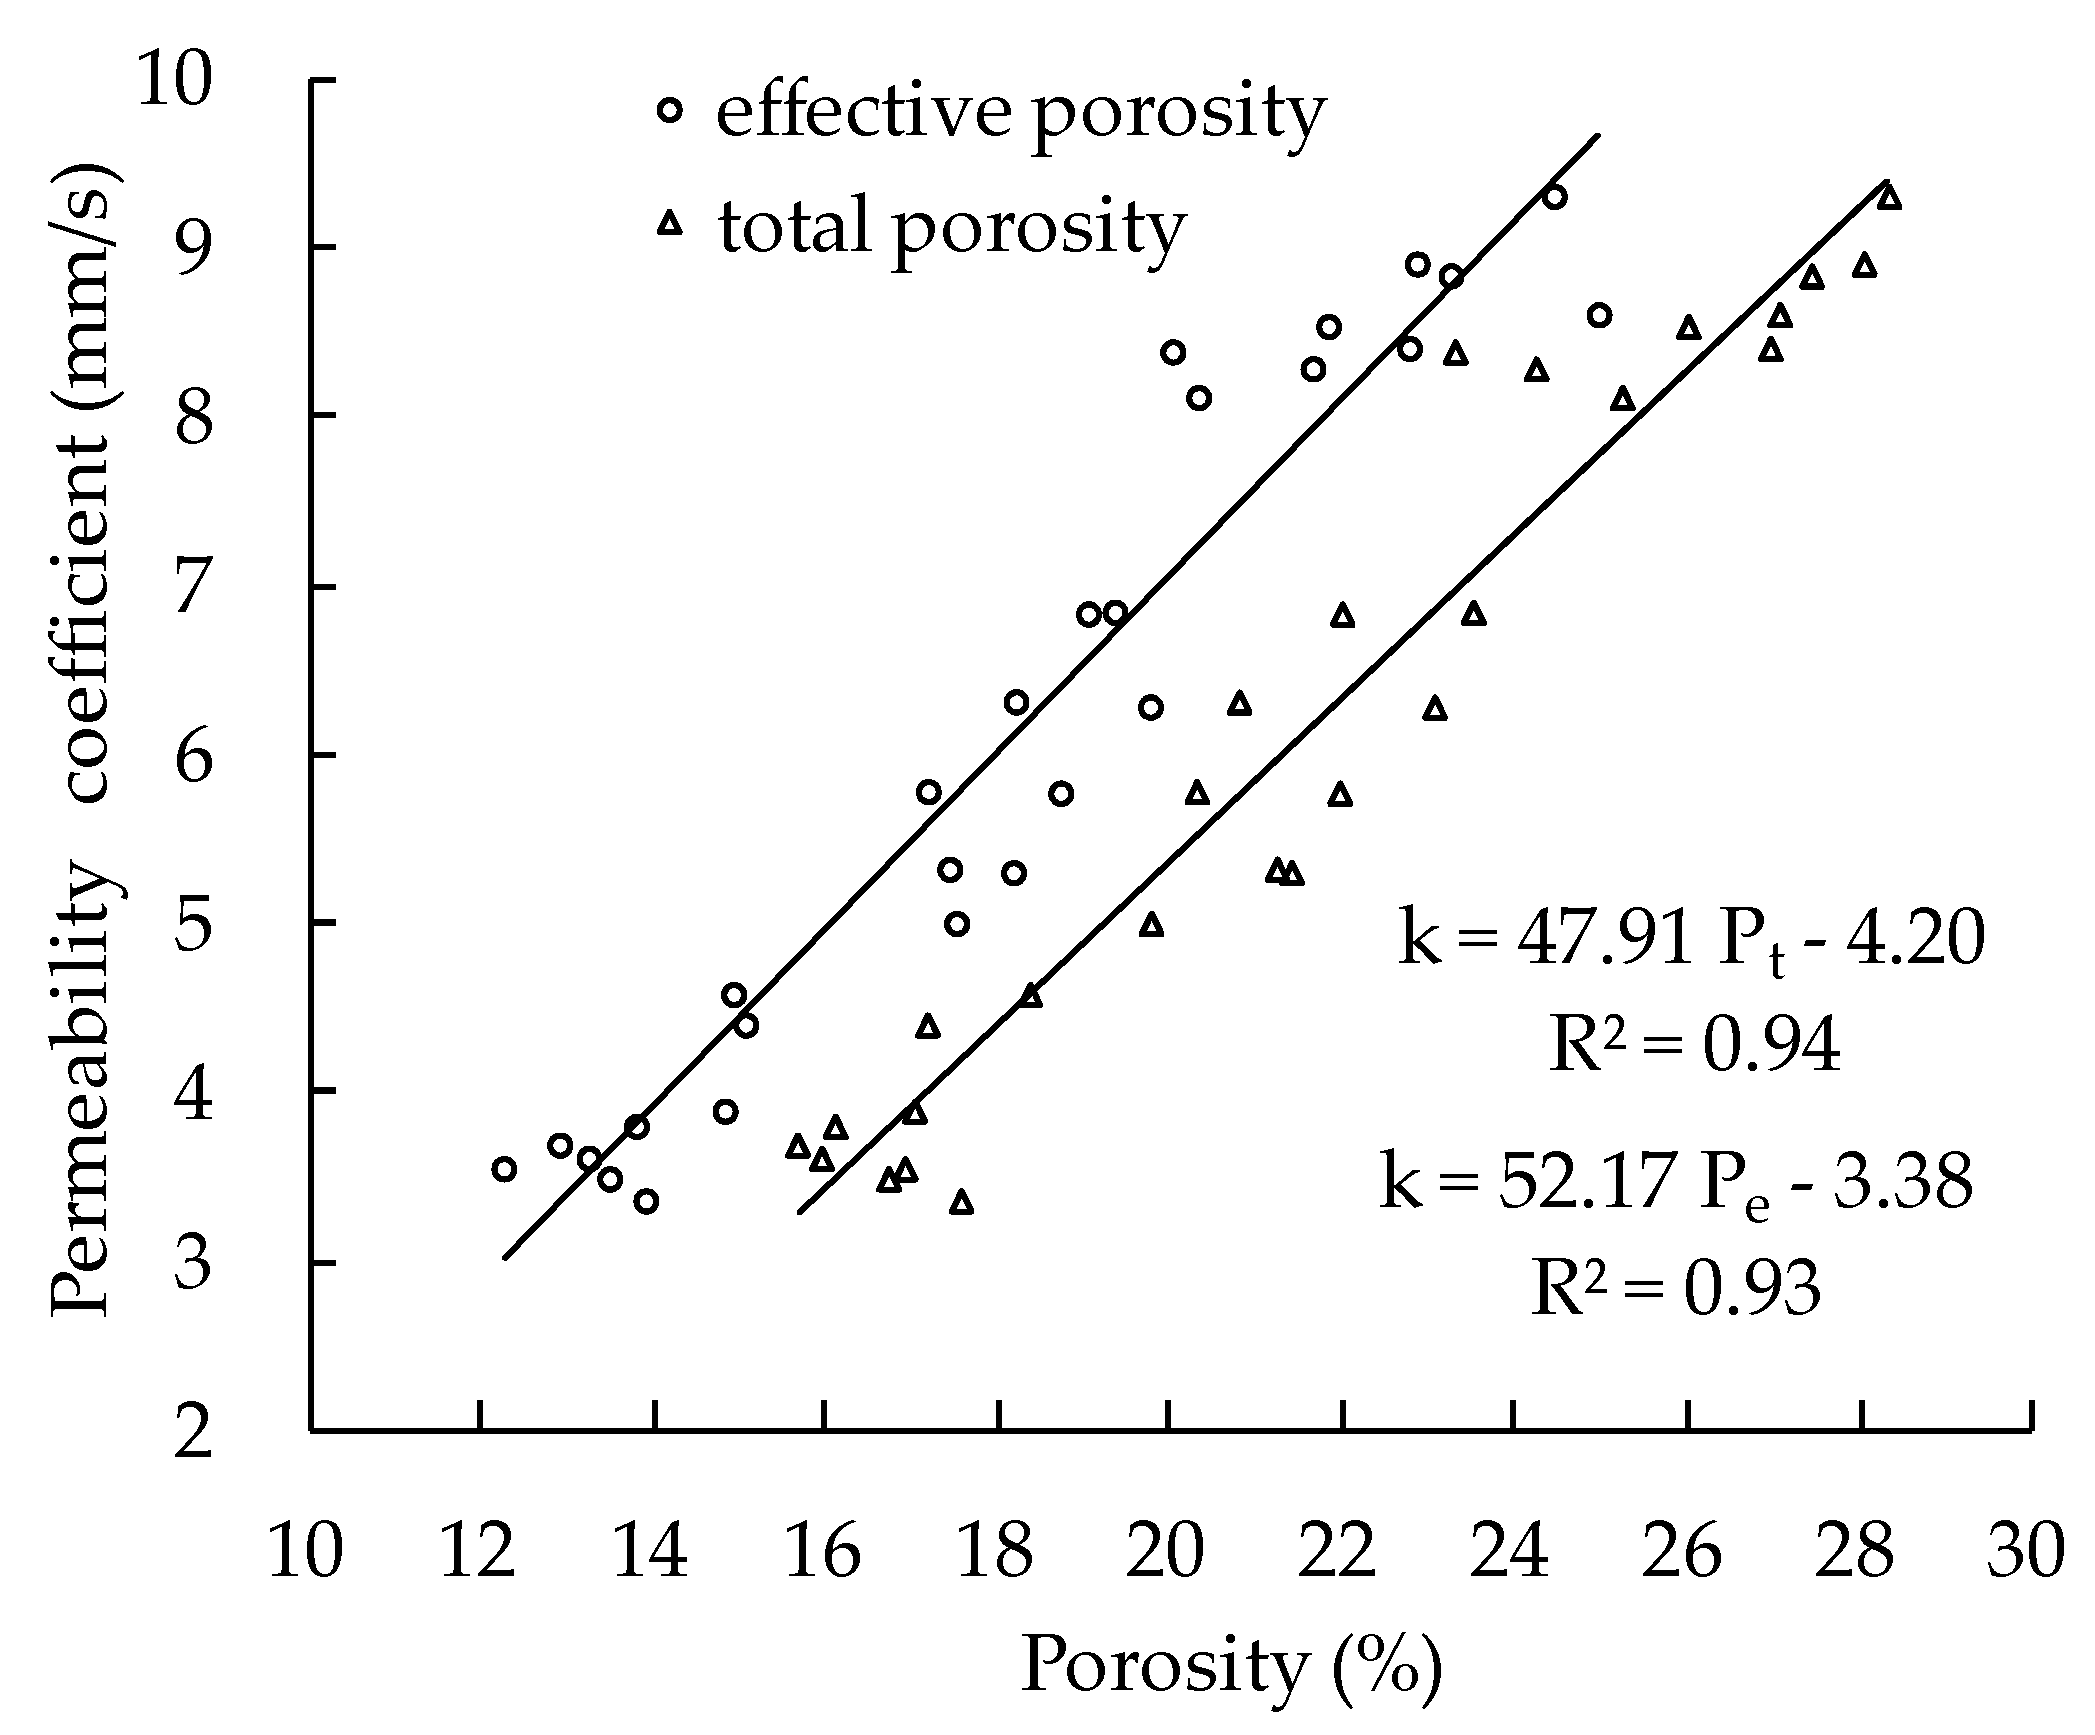
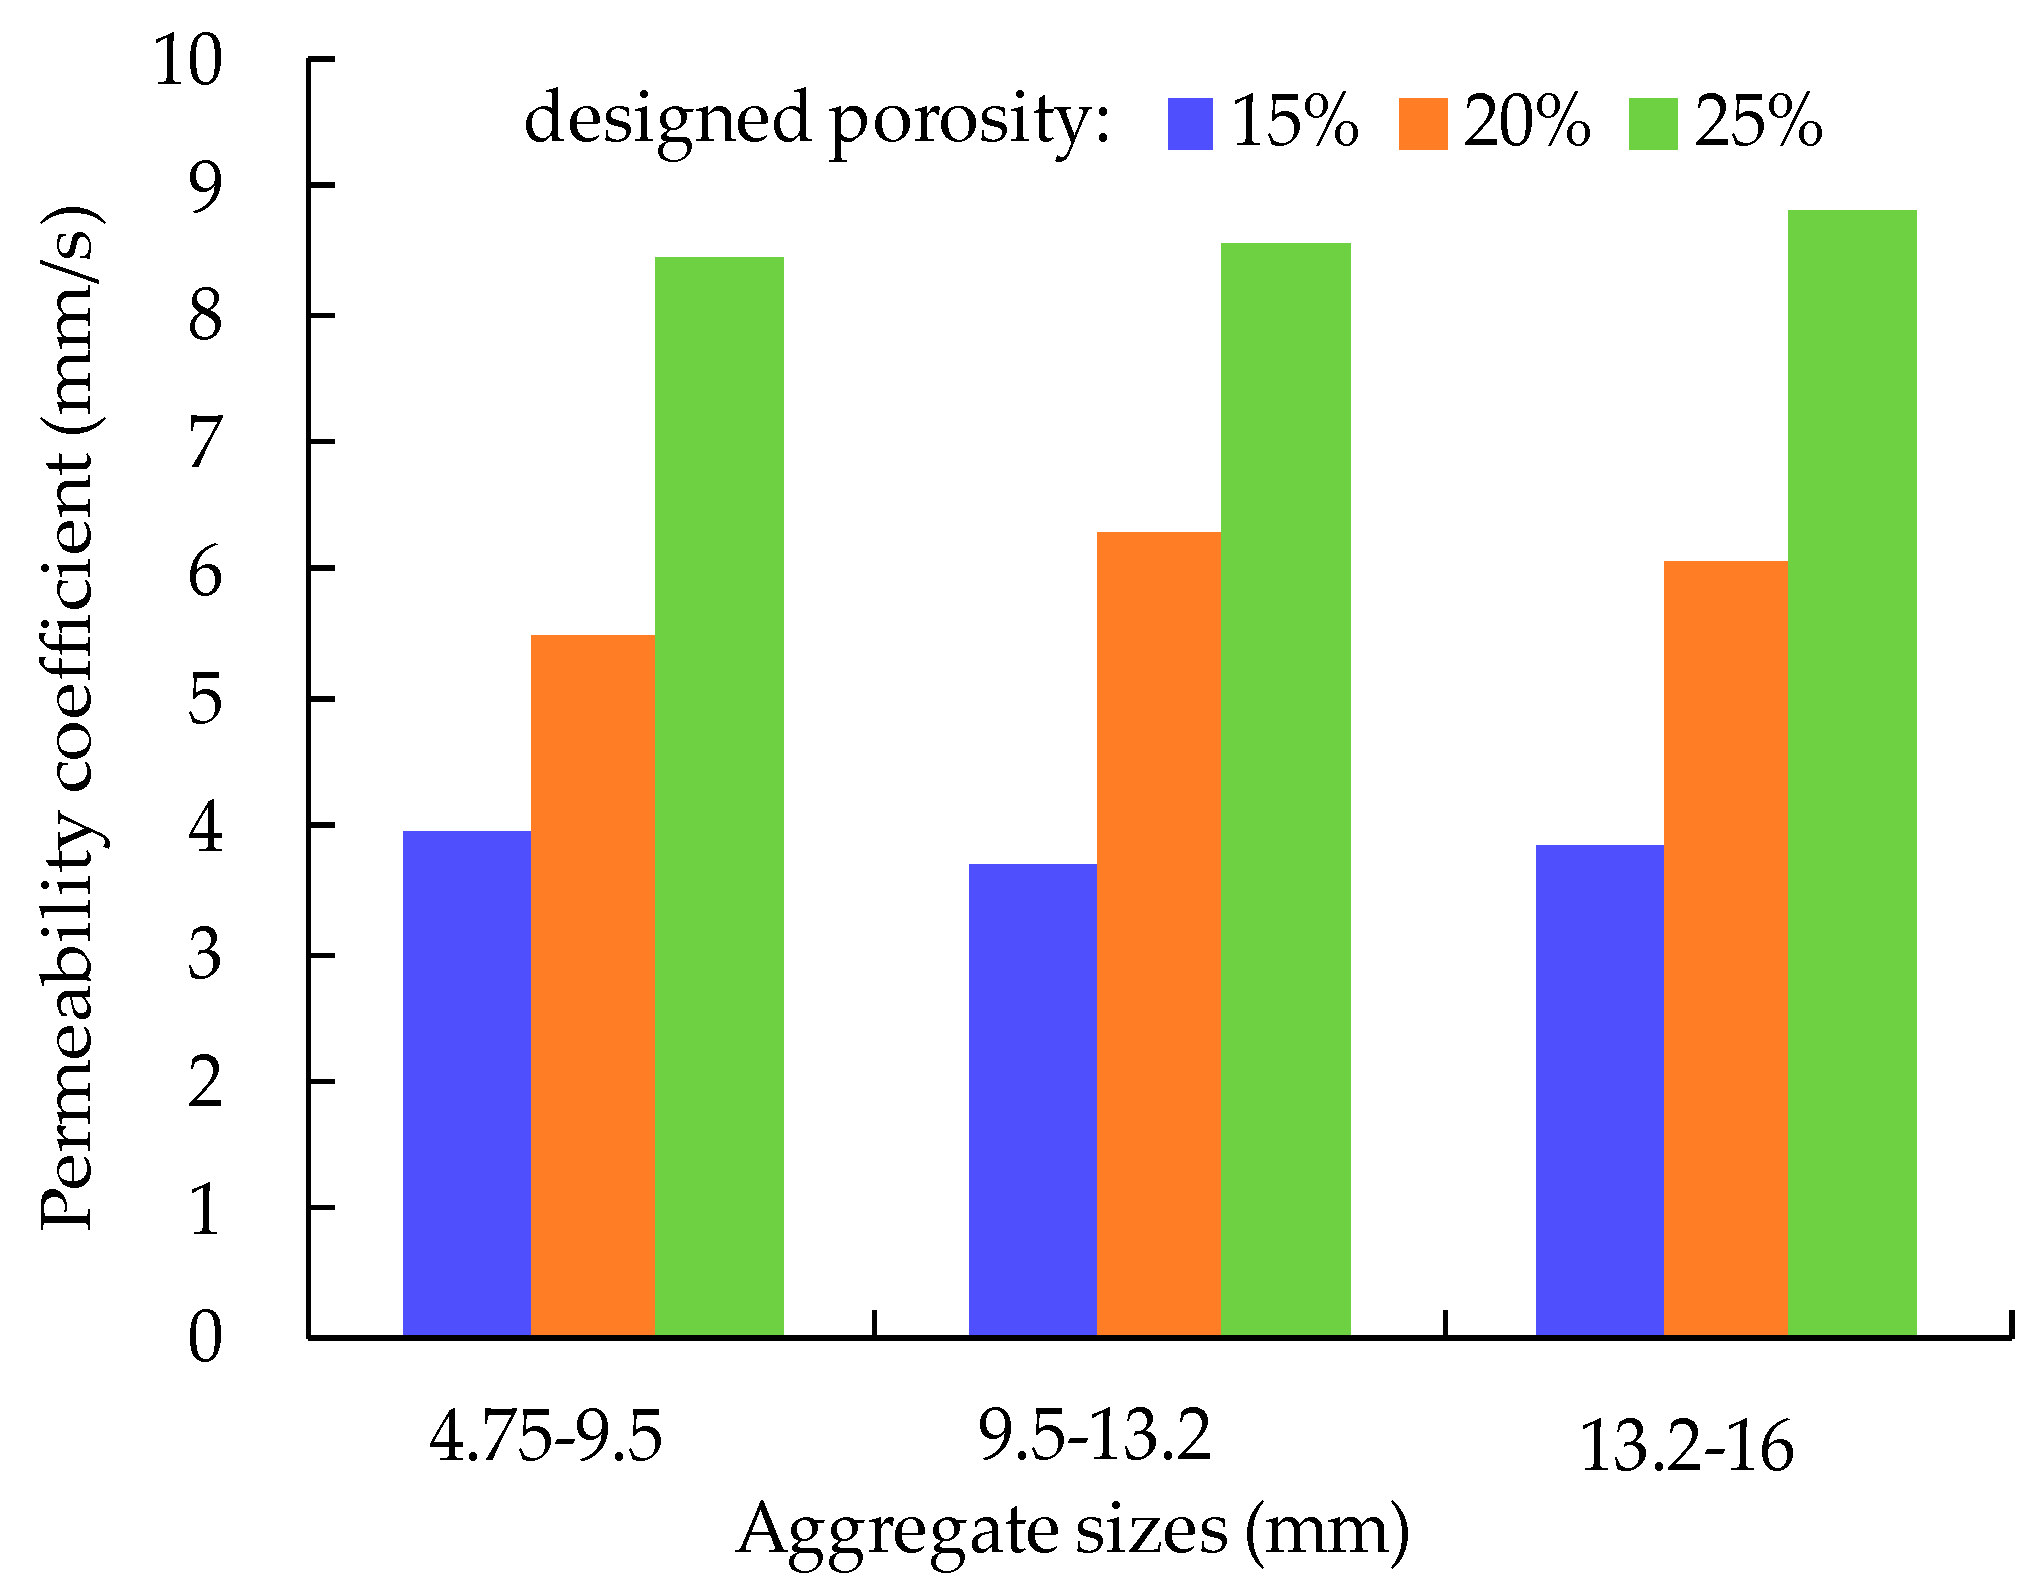
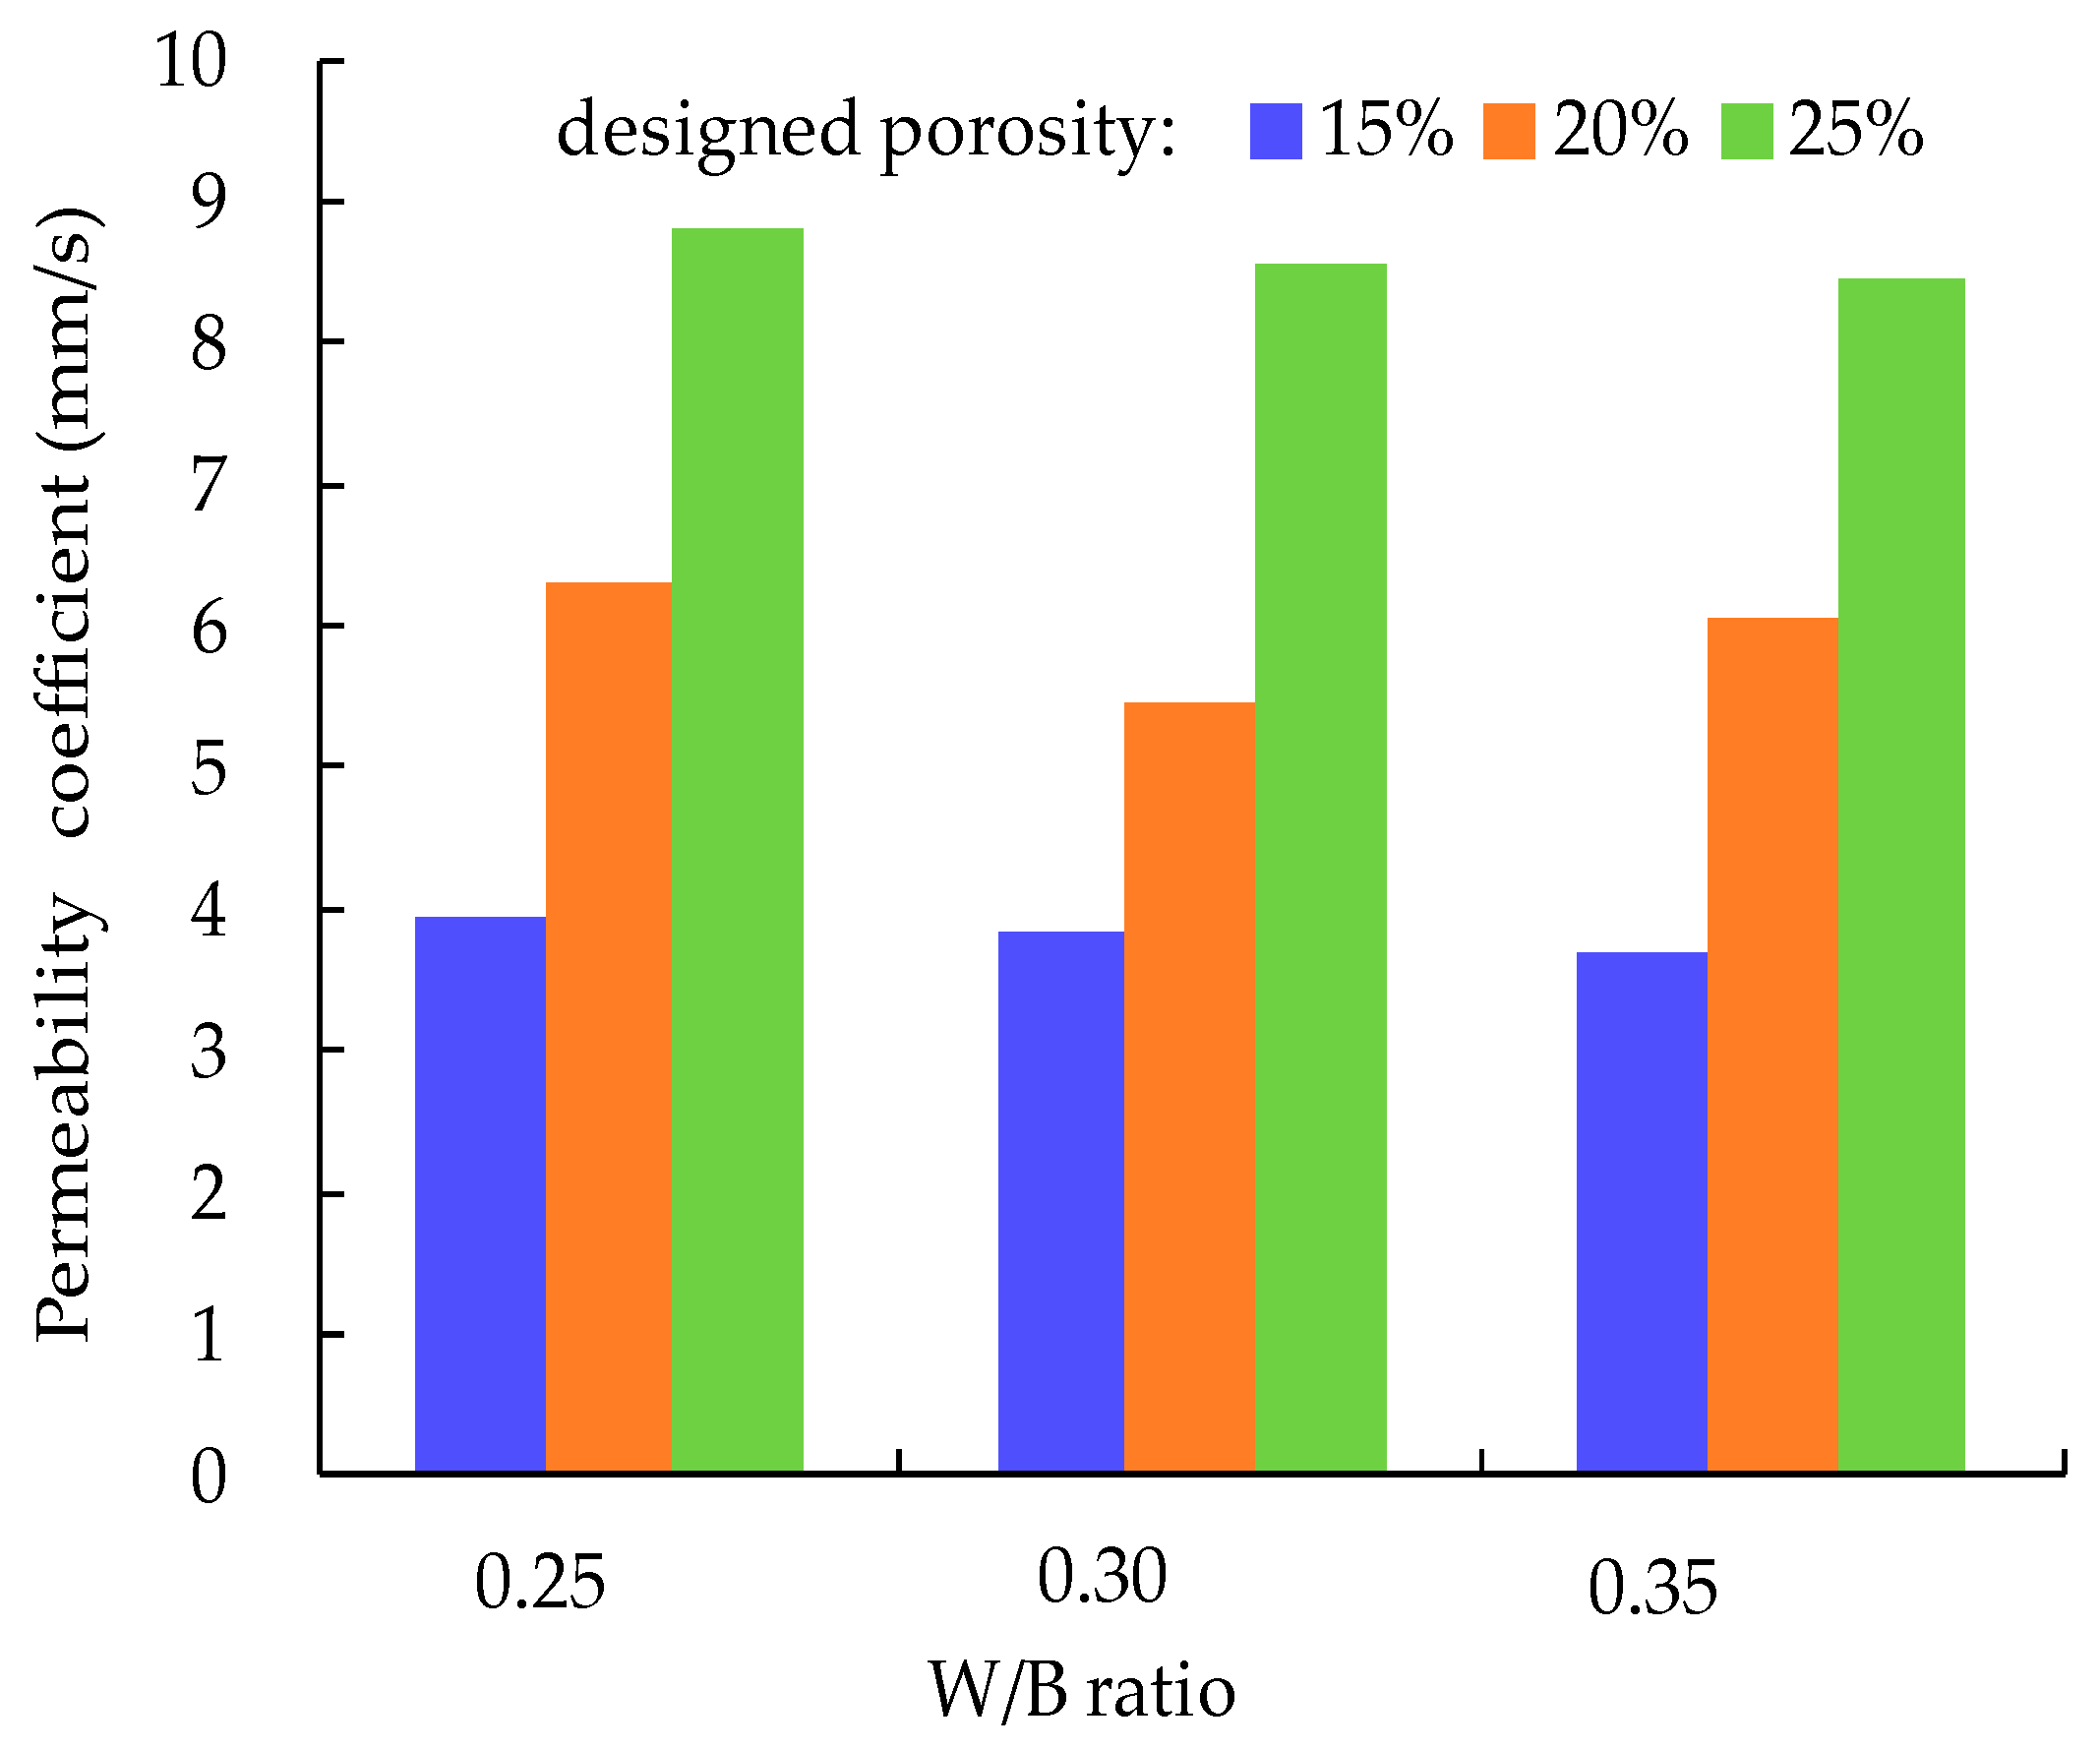
Effective porosity is the determining factor for the permeability of PC. With effective porosity changing from 13.7% to 23.8%, the measured permeability coefficient increases from 3.70 mm/s to 8.82 mm/s, which meets the standard requirement of 0.5 mm/s in the national standard [33]. The permeability coefficient changes about 0.51 mm/s with 1% effective porosity change. The relationship between the permeability coefficient and designed porosity is shown in Figure 6. It can be seen that the permeability coefficient increases with the increase of effective porosity and the linear correlation coefficient is 0.93. The relationship between the permeability coefficient, designed porosity, and the aggregate size is shown in Figure 7. It indicates that when the designed porosity is the same, the permeability coefficient is not affected by the aggregate size. The relationship between the permeability coefficient, designed porosity, and the W/B ratio is shown in Figure 8. It shows that the W/B ratio does not have an effect on the permeability coefficient. Therefore, it can be concluded that the permeability of PC is hardly affected by aggregate size and W/B ratio. It depends only on porosity.
3.2.3. Compressive Strength
The influence of total porosity on compressive strength is shown in Figure 9. Compressive strength decreases with the increase of total porosity. There is an inverse relationship between compressive strength and total porosity and the linear correlation coefficient between the two is 0.78. The linearity between compressive strength and porosity of PC is consistent with the ordinary concrete reported in reference [36]. The mixture has a maximum compressive strength of 24.4 MPa with 16.4% porosity and a minimum compressive strength of 15.4 MPa with 27.1% porosity. The relationship between compressive strength, designed porosity, and aggregate size is shown in Figure 10. The following conclusions can be obtained from Figure 10: (a) when the aggregate size is the same, compressive strength decreases about 24% as designed porosity changes from 15% to 25%; (b) when the designed porosity is the same, compressive strength decreases about 15% as aggregate size changes from 4.75 mm to 16 mm. There is no obvious relationship between W/B ratio and compressive strength.
3.2.4. Flexural Strength
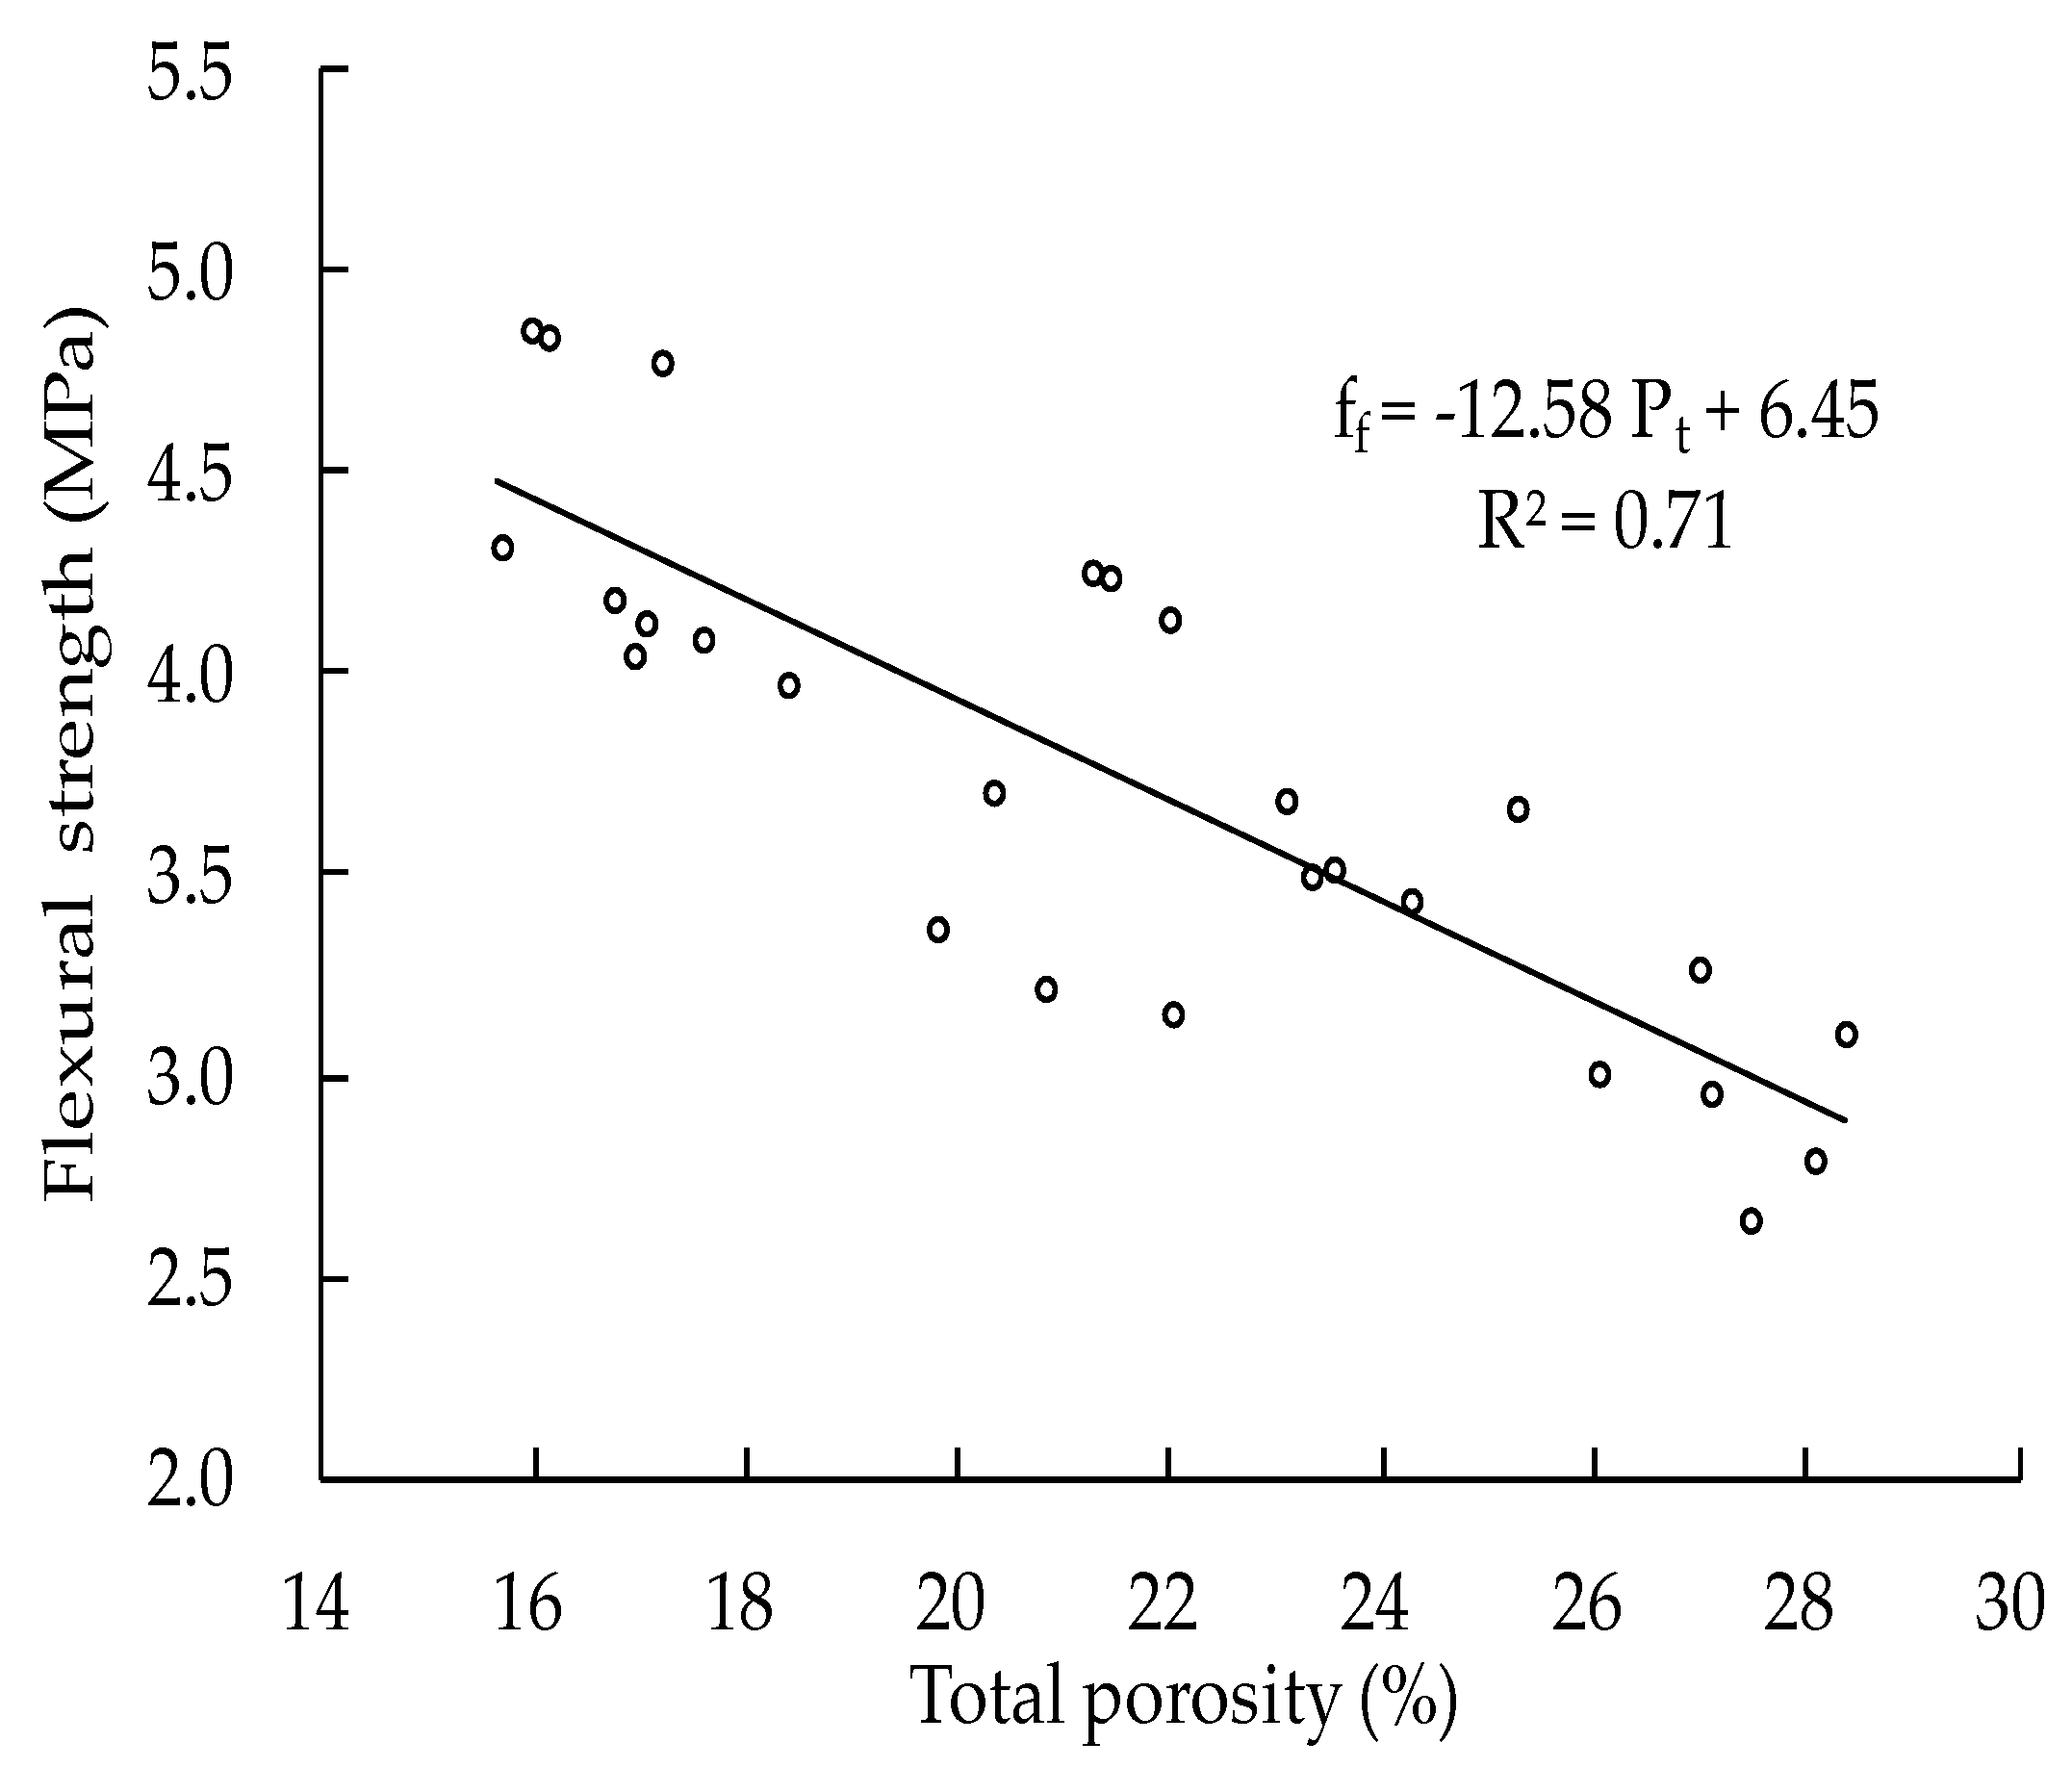
There is a general reduction in the flexural strength of PC as porosity increases. As shown in Figure 11, the linear function can be used to describe the relationship between flexural strength and total porosity, and the correlation coefficient is 0.71. The flexural strength of PC increases from 3.03 MPa to 4.83 MPa as total porosity decreases from 27.1% to 16.4%. The relationship between flexural strength, designed porosity, and aggregate size is shown in Figure 12. The following conclusions can be obtained based on Figure 12: (a) Flexural strength decreases with the increase of designed porosity when the aggregate size is the same. Flexural strength decreases about 25% as designed porosity changes from 15% to 25%; (b) When designed porosity is the same, flexural strength decreases with the increase of aggregate size. Flexural strength decreases about 17% as aggregate size changes from 4.75 mm to 16 mm. The effect of W/B ratio on flexural strength is not obvious.
3.2.5. Freeze-Thaw Cycles
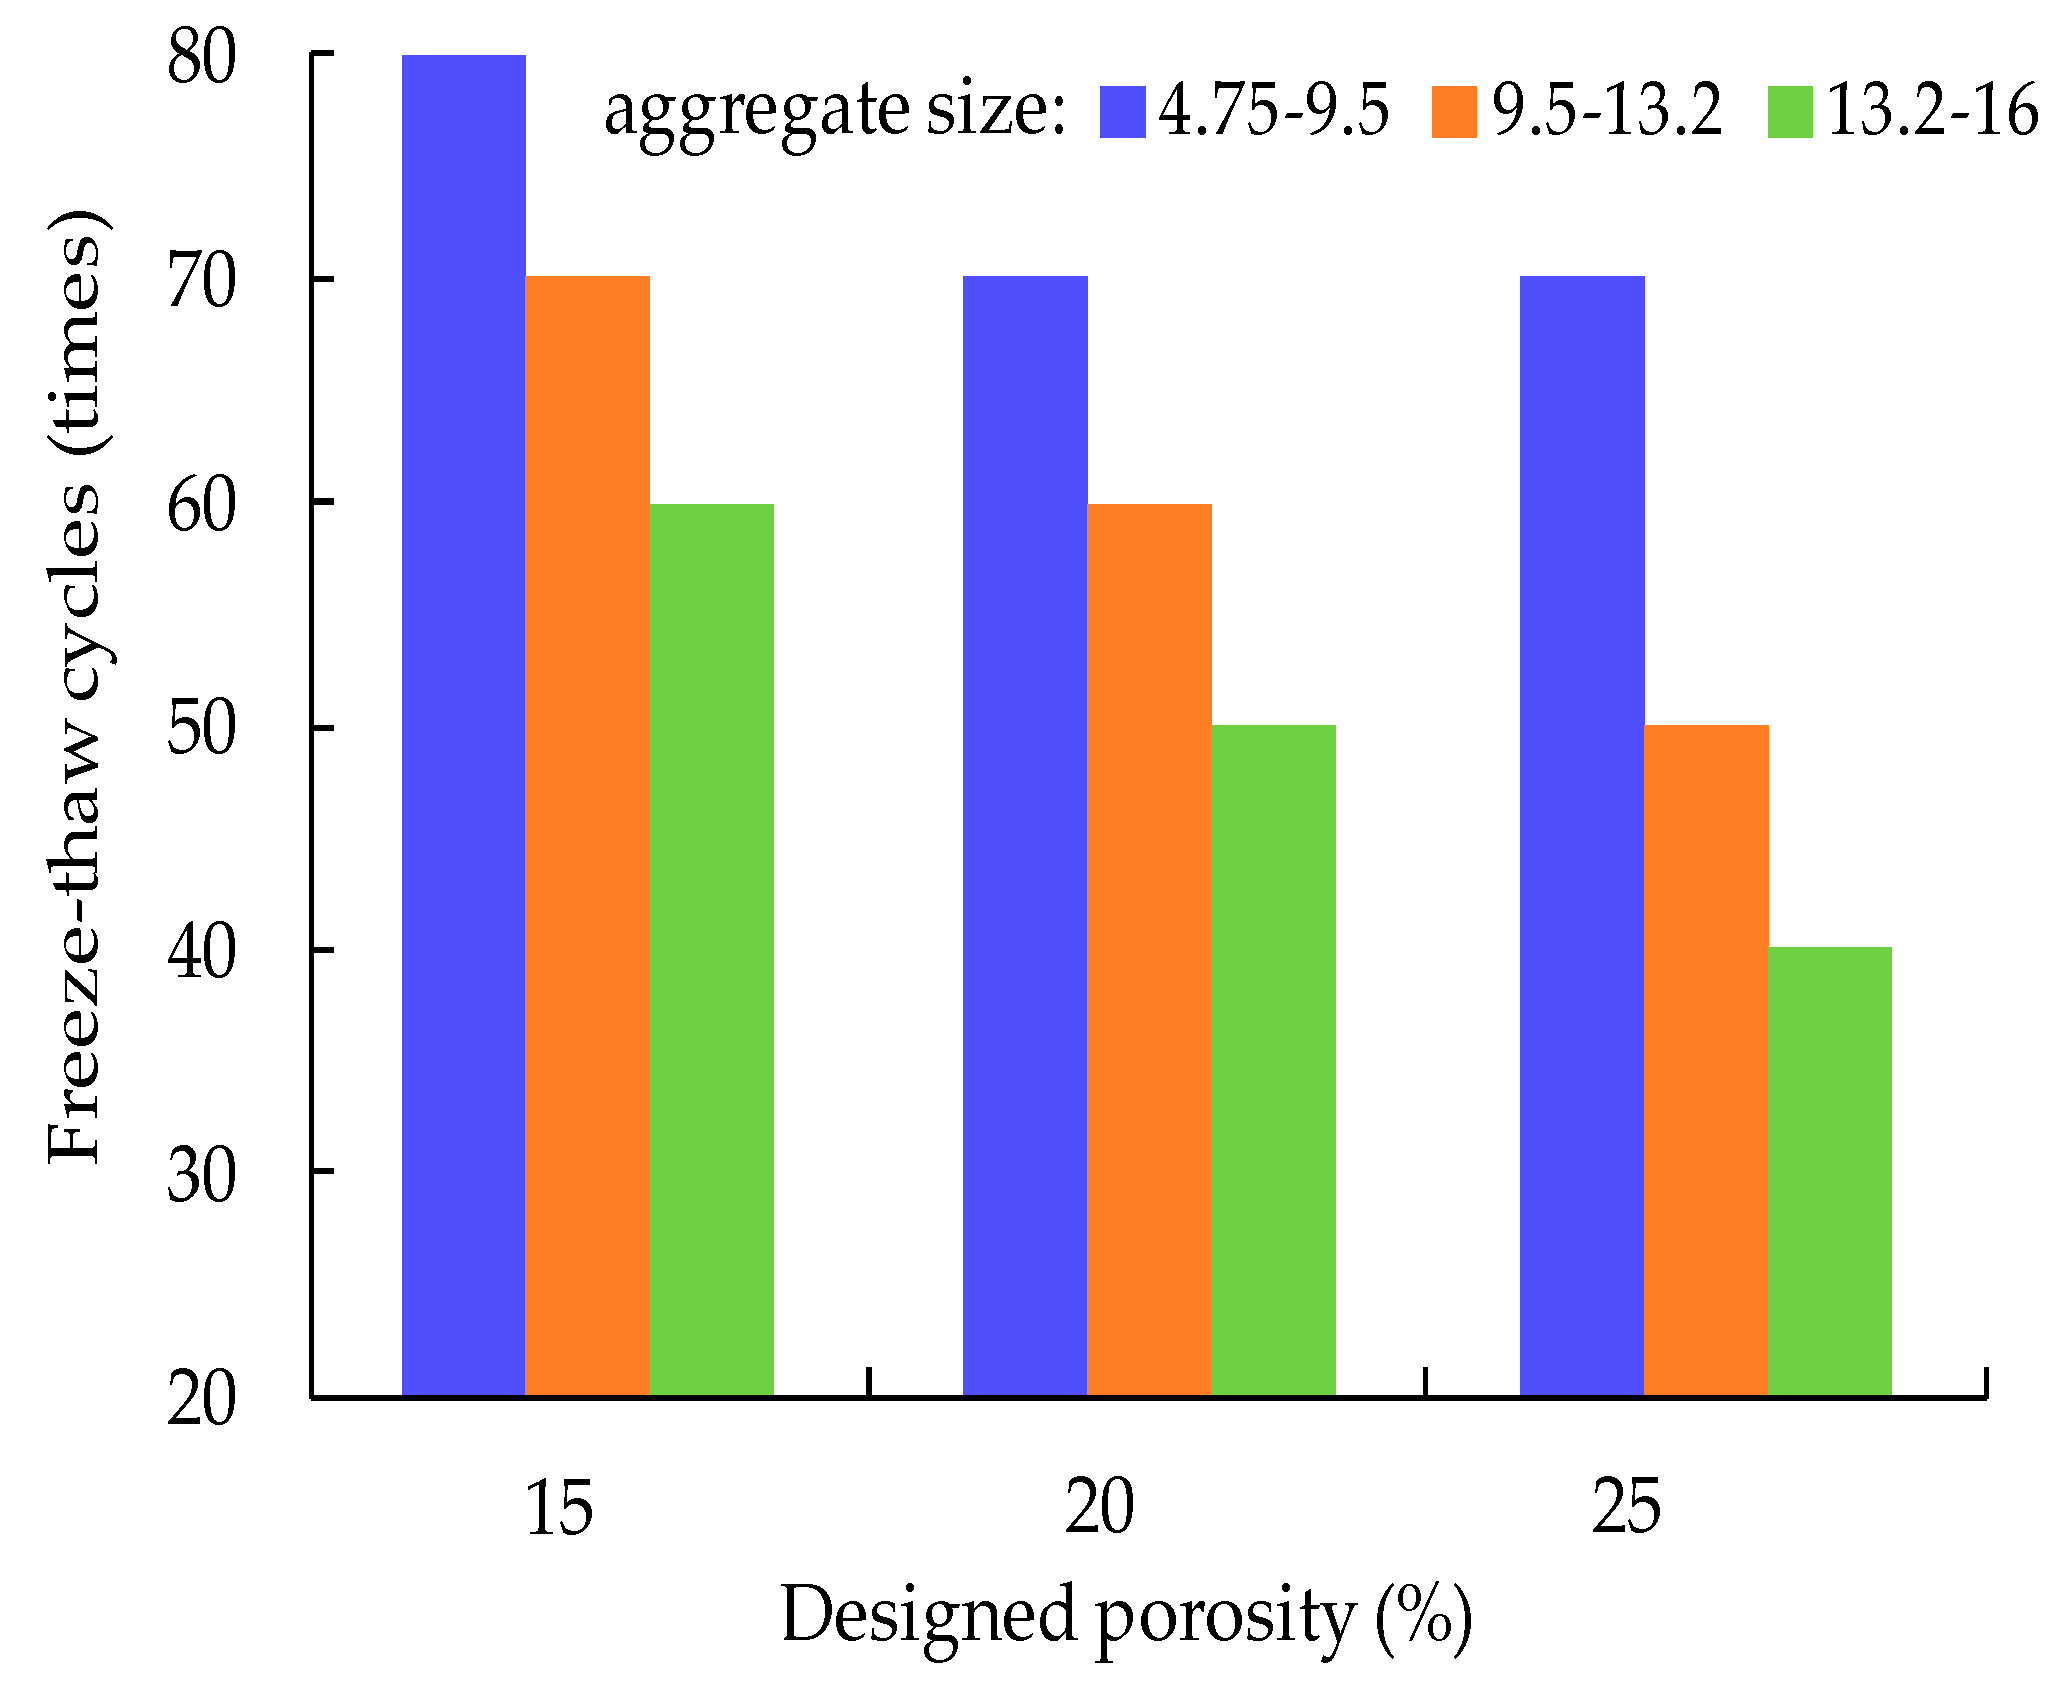
The results of freeze-thaw cycles test are shown in Figure 13. The number of freeze-thaw cycles is 40 to 80 for PC. It can be seen that aggregate size is the primary factor influencing PC freeze-thaw property. A small aggregate is more favorable for the freeze-thaw resistance of PC. Small aggregate provides greater specific surface area and there is more cement mortar between aggregates. Therefore the bonding force is stronger and resistance to the freeze-thaw cycles will be better. The number of freeze-thaw cycles decreases 20 times when the aggregate size changes from 4.75 mm to 16 mm. When aggregate size is the same, the number of freeze-thaw cycles decreases with the increase of designed porosity. High porosity means more water content and larger frost expansion force, which reduces resistance to the freeze-thaw cycles. W/B ratio has no significant impact on the freeze-thaw cycles of PC. Because the void structures of the PC and ordinary concrete are completely different, the freeze-thaw damage patterns of the two are obviously different.
4. Conclusions
The density, porosity, permeability, compressive strength, flexural strength, and freeze-thaw cycle tests of PC were conducted based on an orthogonal experiment with different coarse aggregate sizes, water-binder ratios, and designed porosities. Range analysis and variance analysis were used to evaluate the experimental results. The influences of coarse aggregate size, water-binder ratio, and porosity on PC porosity were analyzed. From the test results, the following conclusions can be drawn.
- The density of PC mixtures changes from 2061 kg/m3 to 1804 kg/m3 as total porosity increases from 16.4% to 27.1%. Density decreases with an increase of total porosity. Linearity can be used to describe the relationship between them, and the correlation coefficient reaches 0.94.
- The permeability of PC is about 3.70 mm/s to 8.82 mm/s when effective porosity is 13.7% to 23.8%. The variance analysis indicates that effective porosity is the determining factor influencing permeability. Coarse aggregate size and water-binder ratio have little contribution to permeability.
- Compressive strength of PC is 15.4 MPa to 24.4 MPa. Compressive strength decreases with the increase of total porosity. Coarse aggregate size also has an influence on compressive strength. Small coarse aggregate size is superior to large coarse aggregate size in improving compressive strength when porosity is the same. Flexural strength changes from 3.03 MPa to 4.83 MPa. The influences of coarse aggregate size and porosity on flexural strength are the same as on compressive strength.
- The freeze-thaw damage pattern of PC is different from that of ordinary concrete. It is not recommended to use the loss of mass as the evaluation index. Freeze-thaw cycles test indicates that coarse aggregate size is the main factor affecting PC freeze-thaw property. Small coarse aggregate size results in better freeze-thaw durability. In addition, porosity is another important factor that contributes to freeze-thaw durability. Higher porosity generates lower freeze-thaw durability.
- Porosity is the most important factor determining PC mixture properties (permeability, compressive strength, flexural strength, and freeze-thaw property). Higher porosity improves permeability but decreases the mechanical properties of PC. When establishing the optimum mix design, it is necessary to make a trade-off between permeability, mechanical strength, and freeze-thaw durability according to the practical engineering requirement.
Author Contributions
H.L. and G.L. designed the experiments and wrote the paper; G.L. and H.W. performed the experiments and analyzed the experimental results; H.Y. wrote a part of the paper.
Funding
This research was funded by Technology Development Program of Jilin Province 3D518E022417”.
Acknowledgments
The authors express their appreciation for the financial support of Technology Development Program of Jilin Province (3D518E022417).
Conflicts of Interest
The authors declare no conflict of interest.
References
- Bai, X.; Dawson, R.J.; Urge-Vorsatz, D.; Delgado, G.C.; Salisu Barau, A.; Dhakal, S.; Dodman, D.; Leonardsen, L.; Masson-Delmotte, V.; Roberts, D.C.; et al. Six research priorities for cities and climate change. Nature 2018, 555, 23–25. [Google Scholar] [CrossRef] [PubMed]
- Richards, D.R.; Edwards, P.J. Using water management infrastructure to address both flood risk and the urban heat island. Int. J. Water Resour. Dev. 2017, 34, 1–9. [Google Scholar] [CrossRef]
- Liu, Y.; Engel, B.A.; Flanagan, D.C.; Gitau, M.W.; McMillan, S.K.; Chaubey, I. A review on effectiveness of best management practices in improving hydrology and water quality: Needs and opportunities. Sci. Total Environ. 2017, 601, 580–593. [Google Scholar] [CrossRef] [PubMed]
- Peng, H.; Yin, J.; Song, W.M. Mechanical and hydraulic behaviors of eco-friendly pervious concrete incorporating fly ash and blast furnace slag. Appl. Sci. 2018, 8, 859. [Google Scholar] [CrossRef]
- Neithalath, N.; Sumanasooriya, M.S.; Deo, O. Characterizing pore volume, sizes, and connectivity in pervious concretes for permeability prediction. Mater. Charact. 2010, 61, 802–813. [Google Scholar] [CrossRef]
- Kim, H.K.; Lee, H.K. Acoustic absorption modeling of porous concrete considering the Gradation and shape of aggregate sand void ratio. J. Sound Vib. 2010, 329, 866–879. [Google Scholar] [CrossRef]
- Gonzalo, C.G.; Roque, B.T.; Luis, A.S.F. Influence of pervious pavement systems on heat dissipation from a horizontal geothermal system. Eur. J. Environ. Civ. Eng. 2013, 17, 956–967. [Google Scholar]
- Ngohpok, C.; Sata, V.; Satiennam, T.; Klungboonkrong, P.; Chindaprasirt, P. Mechanical properties, thermal conductivity, and sound absorption of pervious concrete containing recycled concrete and bottom ash aggregates. KSCE J. Civ. Eng. 2018, 22, 1369–1376. [Google Scholar] [CrossRef]
- Manan, A.; Ahamd, M.; Ahamd, A.; Basit, A.; Khan, M.N.A. Experimental investigation of compressive strength and infiltration rate of pervious concrete by fully reduction of sand. Civ. Eng. J. 2018, 4, 724–731. [Google Scholar] [CrossRef]
- Vadas, T.M.; Smith, M.; Luan, H.W. Leaching and retention of dissolved metals in particulate loaded pervious concrete columns. J. Environ. Manag. 2017, 190, 1–8. [Google Scholar] [CrossRef] [PubMed]
- Shabalalaa, A.N.; Ekolua, S.O.; Diopb, S.; Solomon, F. Pervious concrete reactive barrier for removal of heavy metals from acid mine drainage−column study. J. Hazard. Mater. 2017, 323, 641–653. [Google Scholar] [CrossRef] [PubMed]
- Qin, Y.H.; Hiller, J.E. Water availability near the surface dominates the evaporation of pervious concrete. Constr. Build. Mater. 2016, 111, 77–84. [Google Scholar] [CrossRef]
- Hu, M.; Zhang, X.; Siu, Y.L.; Li, Y.; Tanaka, K.; Yang, H.; Xu, Y. Flood mitigation by permeable pavements in Chinese sponge city construction. Water 2018, 10, 172. [Google Scholar] [CrossRef]
- Ho, H.L.; Huang, R.; Hwang, L.C.; Lin, W.T.; Hsu, H.M. Waste-Based Pervious Concrete for Climate-Resilient Pavements. Materials 2018, 11, 900. [Google Scholar] [CrossRef] [PubMed]
- Andrés-Valeri, V.C.; Marchioni, M.; Sañudo-Fontaneda, L.A.; Giustozzi, F.; Becciu, G. Laboratory assessment of the infiltration capacity reduction in clogged porous mixture surfaces. Sustainability 2016, 8, 751. [Google Scholar] [CrossRef] [Green Version]
- Newman, A.P.; Aitken, D.; Antizar-Ladislao, B. Stormwater quality performance of a macropervious pavement car park installation equipped with channel drain based oil and silt retention devices. Water Res. 2013, 47, 7327–7336. [Google Scholar] [CrossRef] [PubMed] [Green Version]
- Brahim, A.; Mahmoud, E.; Yamin, M.; Patibandla, V.C. Experimental study on Portland cement pervious concrete mechanical and hydrological properties. Constr. Build. Mater. 2014, 50, 524–529. [Google Scholar] [CrossRef]
- Chandrappa, A.K.; Biligiri, K.P. Pervious concrete as a sustainable pavement material—Research findings and future prospects: A state-of-the-art review. Constr. Build. Mater. 2016, 111, 262–274. [Google Scholar] [CrossRef]
- Deo, O.; Neithalath, N. Compressive behavior of pervious concretes and a quantification of the influence of random pore structure features. Mater. Sci. Eng. A-Struct. 2010, 528, 402–412. [Google Scholar] [CrossRef]
- Chen, Y.; Wang, K.J.; Wang, X.H.; Zhou, W.F. Strength, fracture and fatigue of pervious concrete. Constr. Build. Mater. 2013, 42, 97–104. [Google Scholar] [CrossRef]
- Li, Z.Y.; Yang, J.; Li, S.B.; Xu, X.Y.; Song, H.Z. Orthogonal Analysis of Water Permeability of Pervious Concrete. Asian J. Chem. 2014, 26, 1811–1815. [Google Scholar]
- Nguyen, D.H.; Sebaibi, N.; Boutouil, M.; Leleyter, L.; Baraud, F. A modified method for the design of pervious concrete mix. Constr. Build. Mater. 2014, 73, 271–282. [Google Scholar] [CrossRef]
- Kayhanian, M.; Anderson, D.; Harvey, J.T.; Jones, D.; Muhunthan, B. Permeability measurement and scan imaging to assess clogging of pervious concrete pavements in parking lots. J. Environ. Manag. 2012, 95, 114–123. [Google Scholar] [CrossRef] [PubMed]
- Chandrappa, A.K.; Biligiri, K.P. Comprehensive investigation of permeability characteristics of pervious concrete: A hydrodynamic approach. Constr. Build. Mater. 2016, 123, 627–637. [Google Scholar] [CrossRef]
- Zhong, R.; Xu, M.; Netto, R.V.; Wille, K. Influence of pore tortuosity on hydraulic conductivity of pervious concrete: Characterization and modeling. Constr. Build. Mater. 2016, 125, 1158–1168. [Google Scholar] [CrossRef]
- Gaedicke, C.; Torres, A.; Huynh, K.C.T.; Marines, A. A method to correlate splitting tensile strength and compressive strength of pervious concrete cylinders and cores. Constr. Build. Mater. 2016, 125, 271–278. [Google Scholar] [CrossRef]
- Zhong, R.; Wille, K. Compression response of normal and high strength pervious concrete. Constr. Build. Mater. 2016, 109, 177–187. [Google Scholar] [CrossRef]
- Zhong, R.; Wille, K. Linking pore system characteristics to the compressive behavior of pervious concrete. Cem. Concr. Compos. 2016, 70, 130–138. [Google Scholar] [CrossRef]
- Li, J.S.; Zhang, Y.; Liu, G.L.; Peng, X.H. Preparation and performance evaluation of an innovative pervious concrete pavement. Constr. Build. Mater. 2017, 138, 479–485. [Google Scholar] [CrossRef]
- Akand, L.; Yang, M.J.; Gao, Z.L. Characterization of pervious concrete through image based micromechanical modeling. Constr. Build. Mater. 2016, 114, 547–555. [Google Scholar] [CrossRef]
- Pieralisi, R.; Cavalaro, S.H.P.; Aguado, A. Discrete element modelling of the fresh state behavior of pervious concrete. Cem. Concr. Res. 2016, 90, 6–18. [Google Scholar] [CrossRef]
- Samuel, M.; Eric, S.; Fabien, P. Impact of Pervious Concrete Porosity on Permeability by 3D Image Analysis. In Proceedings of the Conference on Pervious Concrete, Tampa, FL, USA, 4 December 2011. [Google Scholar]
- Ministry of Housing and Urban-Rural Construction of the People’s Republic of China. Technical Specification for Pervious Cement Concrete Pavement; Ministry of Housing and Urban-Ural Construction of the People’s Republic of China: Beijing, China, 2009. (In Chinese)
- Ministry of Housing and Urban-Rural Construction of the People’s Republic of China. Standard for Test Method of Mechanical Properties on Ordinary Concrete; Ministry of Housing and Urban-Ural Construction of the People’s Republic of China: Beijing, China, 2002. (In Chinese)
- Ministry of Housing and Urban-Rural Construction of the People’s Republic of China. Standard for Test Methods of Long-Term Performance and Durability of Ordinary Concrete; Ministry of Housing and Urban-Ural Construction of the People’s Republic of China: Beijing, China, 2009. (In Chinese)
- Neville, A.M. Property of Concrete, 4th ed.; China Architecture and Building Press: Beijing, China, 2009; pp. 199–203. ISBN 9787112127436. [Google Scholar]
Figure 1.
Permeability measurement: (a) permeability coefficient tester; (b) laboratory test.

Figure 2.
Freeze-thaw cycles test: (a) laboratory test; (b) specimen with cracks after freeze-thaw cycles.
Figure 2.
Freeze-thaw cycles test: (a) laboratory test; (b) specimen with cracks after freeze-thaw cycles.

Figure 3.
Relationships between various property indices and K values: (a) between compressive strength and K; (b) between flexural strength and K; (c) between permeability coefficient and K; (d) between freeze-thaw cycles and K.
Figure 3.
Relationships between various property indices and K values: (a) between compressive strength and K; (b) between flexural strength and K; (c) between permeability coefficient and K; (d) between freeze-thaw cycles and K.

Figure 4.
Relationship between density and porosity.

Figure 5.
Relationship between measured porosity and designed porosity.

Figure 6.
Relationship between permeability coefficient and porosity.
Figure 7.
Relationship between permeability coefficient, designed porosity and aggregate size.

Figure 8.
Relationship between permeability coefficient, designed porosity and W/B ratio.

Figure 9.
Relationship between compressive strength and total porosity.
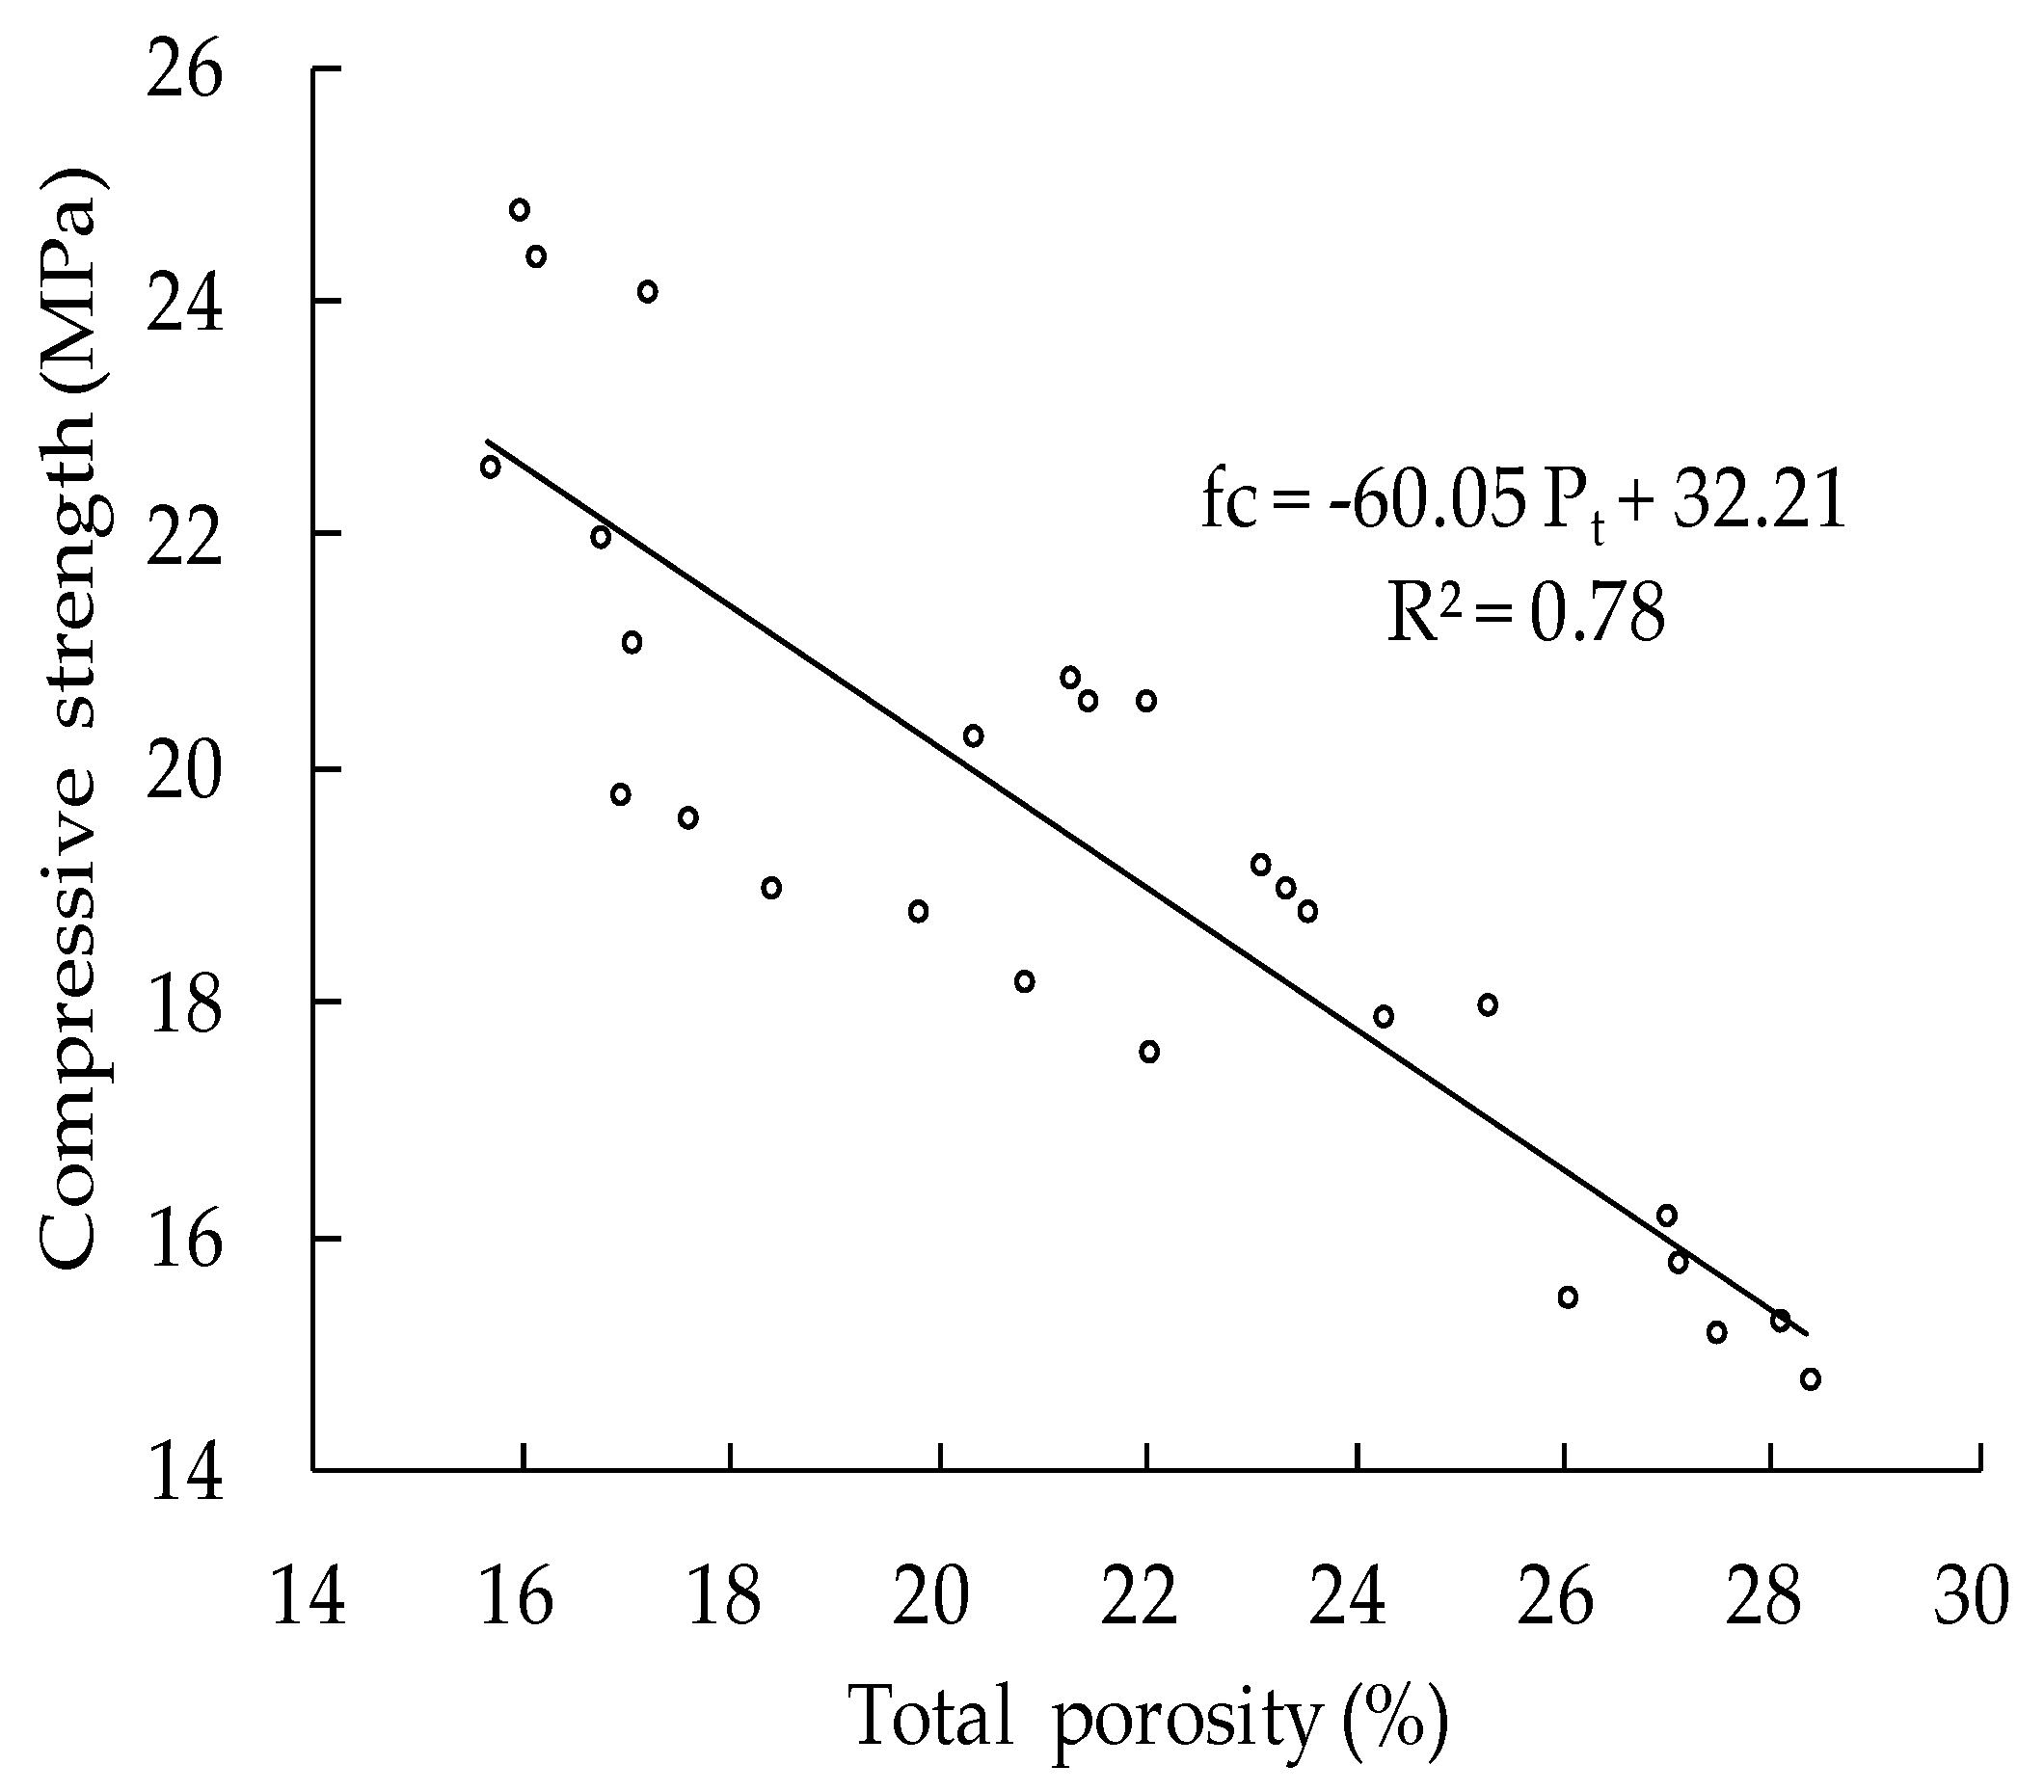
Figure 10.
Relationship between compressive strength, designed porosity, and aggregate size.

Figure 11.
Relationship between flexural strength and total porosity.

Figure 12.
Relationship between flexural strength, designed porosity and aggregate size.

Figure 13.
Relationship between freeze-thaw cycles, designed porosity and aggregate size.


Table 1.
Properties of Portland cement.
| Density (g/cm3) | Specific Surface Area (m2/kg) | Setting Time (min) | Compressive Strength (MPa) | Flexural Strength (MPa) | |||
|---|---|---|---|---|---|---|---|
| Initial Setting | Final Setting | 3d | 28d | 3d | 28d | ||
| 3.16 | 385 | 91 | 145 | 39.3 | 62.2 | 7.0 | 9.1 |
Table 2.
Physical properties of natural granite coarse aggregate (NGCA).
| Size (mm) | Apparent Density (kg/m3) | Bulk Density (kg/m3) | Bulk Porosity (%) | Crushing Value (%) | Needle-Like Particle Content (%) | Water Absorption (%) |
|---|---|---|---|---|---|---|
| 4.75–9.5 | 2749 | 1409 | 48.7 | 9.9 | 7.7 | 1.71 |
| 9.5–13.2 | 2747 | 1459 | 46.9 | 13.4 | 5.4 | 1.66 |
| 13.2–16 | 2726 | 1500 | 45.0 | 14.5 | 4.2 | 1.61 |
Table 3.
Mix ratio of pervious concrete (PC).
| No. | Aggregate Size (mm) | Water-Binder Ratio | Designed Porosity (%) | Coarse Aggregate (kg/m3) | Cement (kg/m3) | Water (kg/m3) | Superplasticizer (kg/m3) |
|---|---|---|---|---|---|---|---|
| 1 | 4.75–9.5 | 0.25 | 15 | 1381 | 590 | 147 | 5.90 |
| 2 | 4.75–9.5 | 0.30 | 20 | 1381 | 465 | 140 | 4.65 |
| 3 | 4.75–9.5 | 0.35 | 25 | 1381 | 359 | 126 | 3.59 |
| 4 | 9.5–13.2 | 0.25 | 20 | 1430 | 475 | 119 | 4.75 |
| 5 | 9.5–13.2 | 0.30 | 25 | 1430 | 359 | 108 | 3.59 |
| 6 | 9.5–13.2 | 0.35 | 15 | 1430 | 478 | 167 | 4.78 |
| 7 | 13.2–16 | 0.25 | 25 | 1470 | 358 | 90 | 3.58 |
| 8 | 13.2–16 | 0.30 | 15 | 1470 | 487 | 146 | 4.87 |
| 9 | 13.2–16 | 0.35 | 20 | 1470 | 379 | 133 | 3.79 |
Table 4.
Test results of pervious concrete (PC) properties.
| No. | Density (kg/m3) | Pt (%) | Pe (%) | k (mm/s) | fc (MPa) | ff (MPa) | Freeze-Thaw Cycles | ||||||
|---|---|---|---|---|---|---|---|---|---|---|---|---|---|
| Mean | Sd | Mean | Sd | Mean | Sd | Mean | Sd | Mean | Sd | Mean | Sd | Mode | |
| 1 | 2061 | 18 | 16.4 | 0.5 | 14.0 | 0.8 | 3.95 | 0.34 | 24.4 | 0.3 | 4.83 | 0.03 | 80 |
| 2 | 1943 | 10 | 21.5 | 0.3 | 18.1 | 0.5 | 5.47 | 0.22 | 20.7 | 0.1 | 4.21 | 0.05 | 70 |
| 3 | 1847 | 54 | 25.8 | 1.6 | 21.6 | 1.0 | 8.44 | 0.34 | 17.9 | 1.2 | 3.44 | 0.37 | 70 |
| 4 | 1899 | 47 | 22.3 | 1.4 | 18.8 | 1.1 | 6.31 | 0.43 | 19.4 | 0.6 | 3.64 | 0.09 | 60 |
| 5 | 1838 | 26 | 25.9 | 1.8 | 22.0 | 1.4 | 8.55 | 0.21 | 16.2 | 1.6 | 3.27 | 0.36 | 50 |
| 6 | 2110 | 7 | 16.5 | 0.6 | 13.7 | 0.8 | 3.70 | 0.16 | 21.9 | 0.6 | 4.21 | 0.08 | 70 |
| 7 | 1804 | 8 | 27.1 | 1.0 | 23.8 | 1.4 | 8.82 | 0.35 | 15.4 | 0.4 | 3.03 | 0.06 | 40 |
| 8 | 2044 | 37 | 17.6 | 0.6 | 13.7 | 1.1 | 3.84 | 0.54 | 19.5 | 0.3 | 4.04 | 0.05 | 60 |
| 9 | 1933 | 37 | 20.9 | 0.9 | 18.3 | 0.6 | 6.06 | 0.77 | 18.2 | 0.5 | 3.25 | 0.09 | 50 |
Table 5.
Range analysis results; A: aggregate size; W/B: water-binder ratio; P: porosity
| Index | fc (MPa) | ff (MPa) | k (mm/s) | Freeze-Thaw Cycles | ||||||||
|---|---|---|---|---|---|---|---|---|---|---|---|---|
| A | W/B | P | A | W/B | P | A | W/B | P | A | W/B | P | |
| K1 | 20.99 | 19.74 | 21.93 | 4.16 | 3.83 | 4.36 | 5.95 | 6.36 | 3.83 | 73.3 | 60.0 | 70.0 |
| K2 | 19.18 | 18.79 | 19.43 | 3.71 | 3.84 | 3.70 | 6.19 | 5.95 | 5.95 | 60.0 | 60.0 | 60.0 |
| K3 | 17.70 | 19.33 | 16.50 | 3.44 | 3.63 | 3.25 | 6.24 | 6.07 | 8.60 | 50.0 | 63.3 | 53.3 |
| R | 3.29 | 0.96 | 5.43 | 0.72 | 0.21 | 1.11 | 0.29 | 0.41 | 4.77 | 23.3 | 3.3 | 16.7 |
Table 6.
Variance analysis for properties of PC.
| Factors | F0.01 (2,2) | F0.05 (2,2) | fc | ff | k | Freeze-Thaw Cycles | ||||
|---|---|---|---|---|---|---|---|---|---|---|
| F | Significance | F | Significance | F | Significance | F | Significance | |||
| A | 99.0 | 19.0 | 24.3 | * | 81.2 | * | 1.8 | – | 37.0 | * |
| W/B | 99.0 | 19.0 | 1.9 | – | 11.0 | – | 3.5 | – | 1.0 | – |
| P | 99.0 | 19.0 | 65.6 | * | 222.3 | ** | 451.6 | ** | 19.0 | * |
** Correlation is significant at the 0.01 level. * Correlation is significant at the 0.05 level. – Correlation is not significant.
© 2018 by the authors. Licensee MDPI, Basel, Switzerland. This article is an open access article distributed under the terms and conditions of the Creative Commons Attribution (CC BY) license (http://creativecommons.org/licenses/by/4.0/).
Share and Cite
MDPI and ACS Style
Liu, H.; Luo, G.; Wei, H.; Yu, H. Strength, Permeability, and Freeze-Thaw Durability of Pervious Concrete with Different Aggregate Sizes, Porosities, and Water-Binder Ratios. Appl. Sci. 2018, 8, 1217. https://doi.org/10.3390/app8081217
AMA Style
Liu H, Luo G, Wei H, Yu H. Strength, Permeability, and Freeze-Thaw Durability of Pervious Concrete with Different Aggregate Sizes, Porosities, and Water-Binder Ratios. Applied Sciences. 2018; 8(8):1217. https://doi.org/10.3390/app8081217
Chicago/Turabian StyleLiu, Hanbing, Guobao Luo, Haibin Wei, and Han Yu. 2018. "Strength, Permeability, and Freeze-Thaw Durability of Pervious Concrete with Different Aggregate Sizes, Porosities, and Water-Binder Ratios" Applied Sciences 8, no. 8: 1217. https://doi.org/10.3390/app8081217
Note that from the first issue of 2016, this journal uses article numbers instead of page numbers. See further details here.