Article

Effect of Platinum Doping on the Morphology and Sensing Performance for CuO-Based Gas Sensor

School of Materials Science and Engineering, South China University of Technology, Guangzhou 510641, China
*
Authors to whom correspondence should be addressed.
Appl. Sci. 2018, 8(7), 1091; https://doi.org/10.3390/app8071091
Submission received: 21 May 2018 / Revised: 11 June 2018 / Accepted: 28 June 2018 / Published: 5 July 2018
(This article belongs to the Section Nanotechnology and Applied Nanosciences)

Abstract

:

Featured Application

This gas sensor can be used for air quality monitoring, food processing and the detection of toxic, flammable and explosive gases.

Abstract

Pristine and Pt-doped CuO nano-flowers were synthesized by a simple water bath heating method in this paper. Highly sensitive hydrogen sulfide (H2S) gas sensors based on Pt-doped CuO nano-flowers were fabricated. Scanning electron microscopy, X-ray diffraction, inductively coupled plasma atomic emission spectrometry, and energy dispersive X-ray spectroscopy were used to examine the characteristics and morphology of materials. The sensing performances of sensors with different concentrations of Pt dopants were evaluated at different operating temperatures. The results indicated that the CuO sensor doped with 1.25 wt % Pt exhibited the highest response (Rg/Ra, where Rg is the resistance in gas, and Ra is the resistance in air) of 135.1 to 10 ppm H2S at 40 °C, which was 13.1 times higher than the response of a pure CuO sensor. Pt doping also plays an important role for the enhancement of H2S selectivity against C2H5OH, NH3, H2, CH3COCH3, and NO2.

Graphical Abstract

1. Introduction

Hydrogen sulfide (H2S) is a toxic, harmful, and malodorous gas, which is usually produced by petroleum refining, as well as agricultural and biogas production [1,2,3]. The threshold limit value for H2S gas (recommended by the American Conference of Government Industrial Hygienists) is 10 ppm [4]. Furthermore, H2S gas is liable to explode at a high temperature. Therefore, it is urgent to develop a new type of sensors for detecting H2S with a low operating temperature. Although researchers have developed some detecting methods, such as fluorescent probes [5], electrogenerated chemiluminescene [6], and chemical methods [7] to detect H2S, these methods still have shortcomings such as complex detection process, and high cost. Among the various detection methods, metal oxide semiconductor gas sensors have been widely used in the detecting of toxic, flammable, and explosive gases; monitoring air quality; and food processing, due to their simplicity, high sensitivity, low cost, and compatibility with modern electronic devices [8,9]. In recent years, many researchers have utilized metal oxide semiconductor sensors to detect H2S gas, including CuO [10,11], In2O3 [12], ZnO [13,14] SnO2 [15], and WO3 [16]. Cupric oxide (CuO), as a typical p-type semiconductor with a band gap of 1.2 eV [17], has been widely investigated in lithium-ion batteries [18], super-capacitors [19], heterogeneous catalysts [20], and particularly in gas detection devices. The gas sensitivity of CuO-based gas sensors has been widely reported. Ramgir et al. [10] reported H2S gas sensors based on CuO thin films, and the results showed that the response of CuO thin films to sub-ppm (100–400 ppb) H2S at room temperature was highly reversible. However, once the concentration was higher than 400 ppb, the response became irreversible. To improve the performance of sensors, loading metal oxides with catalytic metals or noble metals nanoparticles on the surface has proved to be a very effective method [21]. For example, Kang et al. [22] reported that 2.2 wt % Cr added to CuO nanostructures by a solvothermal reaction significantly increased the responses to 100 ppm NO2 from 7.5 to 134.2. Kim et al. [23] prepared Pd functionalized one-dimensional CuO nanostructures, which revealed a high response of 167 at 50 ppm. However, the operating temperature was relatively high (300 °C). Therefore, there is still a great demand to develop a H2S gas sensor with excellent sensing performance, such as fast response/recovery time, good selectivity, high sensitivity, low detection limit, and relatively low operating temperature [24].
Pt as a catalytic additive has been proven to be effective in improving gas-sensing performance. Ivanov et al. [25] has shown that the Pt-doped SnO2 material is less resistant, more sensitive, and shows faster response to ethanol than pure SnO2; what’s more, the response of the Pt-doped sensors was between 2 and 55 times higher than the commercial one. Wang et al. [26] prepared α-Fe2O3 nanoparticles doped with different amounts of Pt. Compared with the pure α-Fe2O3 based sensor, the Pt-doped α-Fe2O3 based sensors showed the enhanced excellent sensing performance and good selectivity for H2S gas. However, reports on the gas-sensing performance of Pt-doped CuO are rather rare. We expected that Pt doping could be an efficient way to enhance the sensing properties of pure CuO. In the present work, the pristine and Pt-doped CuO based H2S gas sensors were designed. The Pt-doped CuO has been prepared using a facile one step method. For the purpose of comparison, the gas sensing performance of CuO sensors with different Pt concentrations was evaluated. The effect of Pt doping plays an important role in enhancing the sensing performance, and the resulting gas sensors are able to operate at a low temperature. Long recovery time is a common issue for the metal oxide semiconductor sensors at low operating temperature [27], and we found that applying a short electric current pulse is an appropriate way to reduce the recovery time.

2. Experimental

All chemicals used in this work were of analytical grade and were used without further purification, and were purchased from Sinopharm Chemical Reagent Co. Ltd. (Shanghai, China).

2.1. Preparation of CuO

CuO nanoflowers were synthesized by a simple water bath heating method. The typical process is listed here: 24.16 g copper (II) nitrate hydrate was dissolved in 1000 mL deionized water to prepare copper nitrate solution (0.1 mol/L), and then 12.62 g hexamethylenetra-mine was then added into the above solution (20 mL), and stirred for 1 h to get a bright blue solution. After that, the flask was moved to a water bath container at 80 °C for 90 min, and the bright blue Cu-hydroxide precipitate converted into dark brown ones (copper oxide). Finally, the resulting mixture was allowed to cool to room temperature, and was subsequently subjected to centrifugation at 8000 rpm for 10 min. The samples were rinsed with deionized water three times, followed by three times with ethanol, and were dried in the oven at 80 °C.

2.2. Pt-Doped CuO Flowers

Pt-doped CuO flowers were prepared by the following procedure: Chloroplatinic acid hexahydrate (1 g) was dissolved in deionized water (100 mL) to prepare mother liquor, then, the above solution (12.95 mL) was diluted to 250 mL to prepare (hydro)chloroplatinic acid (1 mmol/L). After that, a copper nitrate solution (20 mL) and (hydro)chloroplatinic acid were mixed together, and the remaining steps were the same as mentioned above. For a convenient comparison, we indicate doping with different concentrations of Pt by 0.75Pt-CuO, 1.25Pt-CuO, and 1.50Pt-CuO, respectively, which means the Pt doping concentration in the copper nitrate solution were 0.75 wt %, 1.25 wt %, and 1.50 wt %, respectively.

2.3. Characterization

The crystallinity and phase composition of the CuO specimens were analyzed by X-ray diffraction with a monochromatized Cu target radiation resource (λ = 1.5418 Å), scanning from 10°–80° (XRD, D8-Advance, Bruker, Germany), as well as X-ray photoelectron spectroscopy (XPS, ESCALAB 250Xi, Thermo Scientific, London, UK). The morphology of the powders was investigated by field emission scanning electron microscopy (FE-SEM, S-4800, Hitachi Co. Ltd., Tokyo, Japan) at an accelerating voltage of 10 kV. Energy Dispersive X-Ray (EDX) spectroscopy was used to confirm the composition of the CuO nanostructures. The surface areas were measured by the Brunauer–Emmett–Teller method (BET, Tristar II 3020, Micromeritics Instrument Co Ltd., Norcross, GA, USA). The concentrations of Pt-doped specimens were determined by inductively coupled plasma atomic emission spectrometer (ICP-AES, A-6300, Thermo Scientific, Waltham, MA, USA).

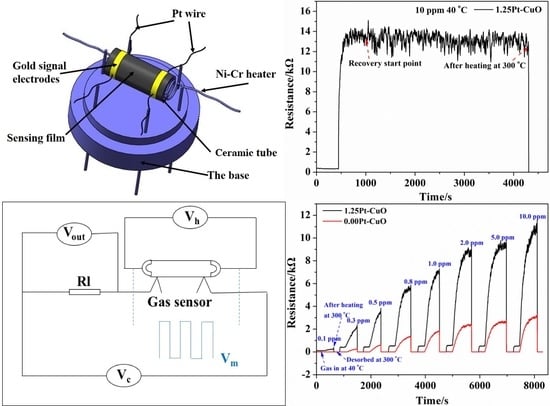
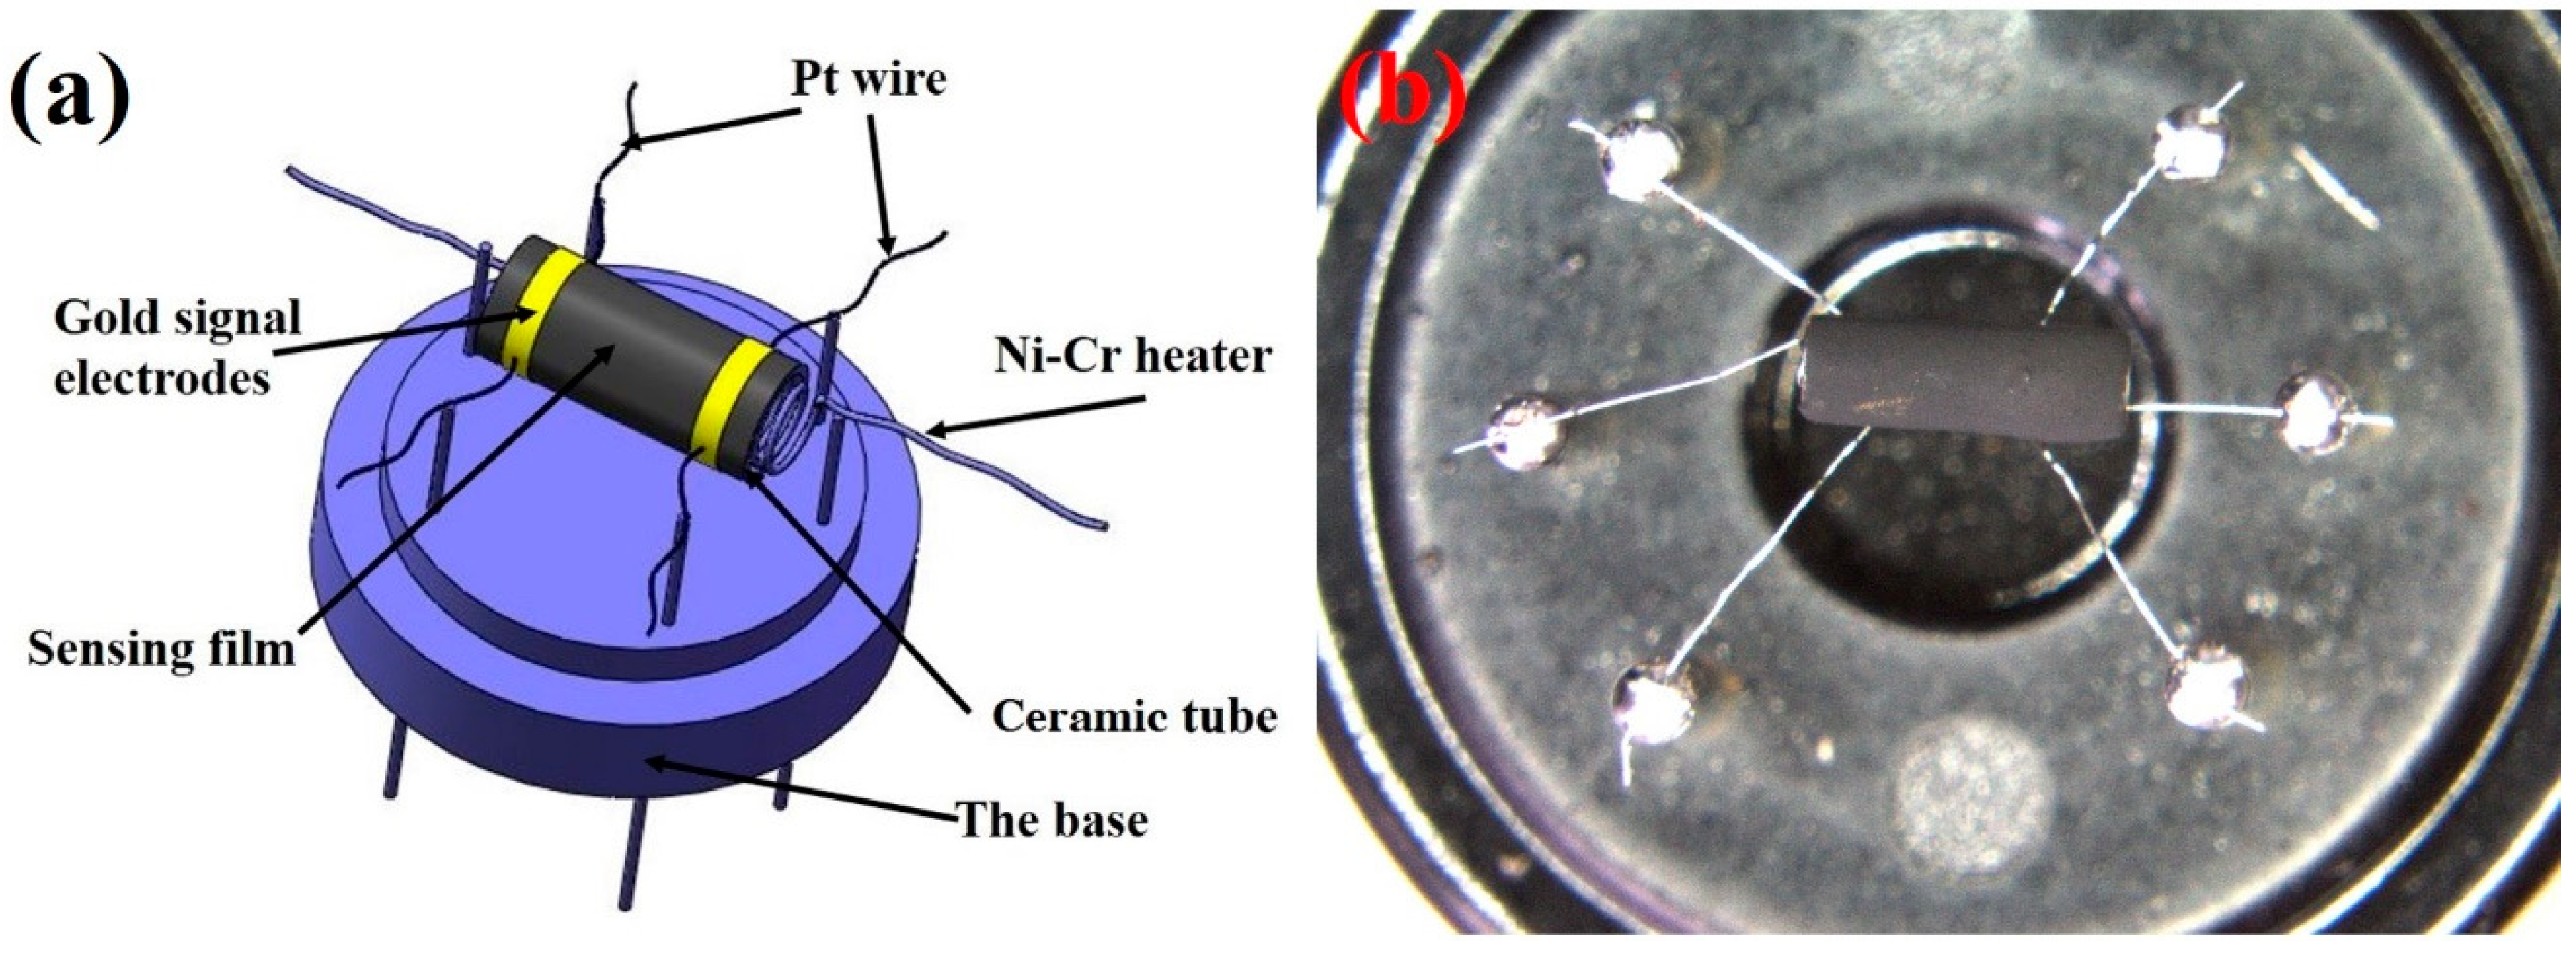
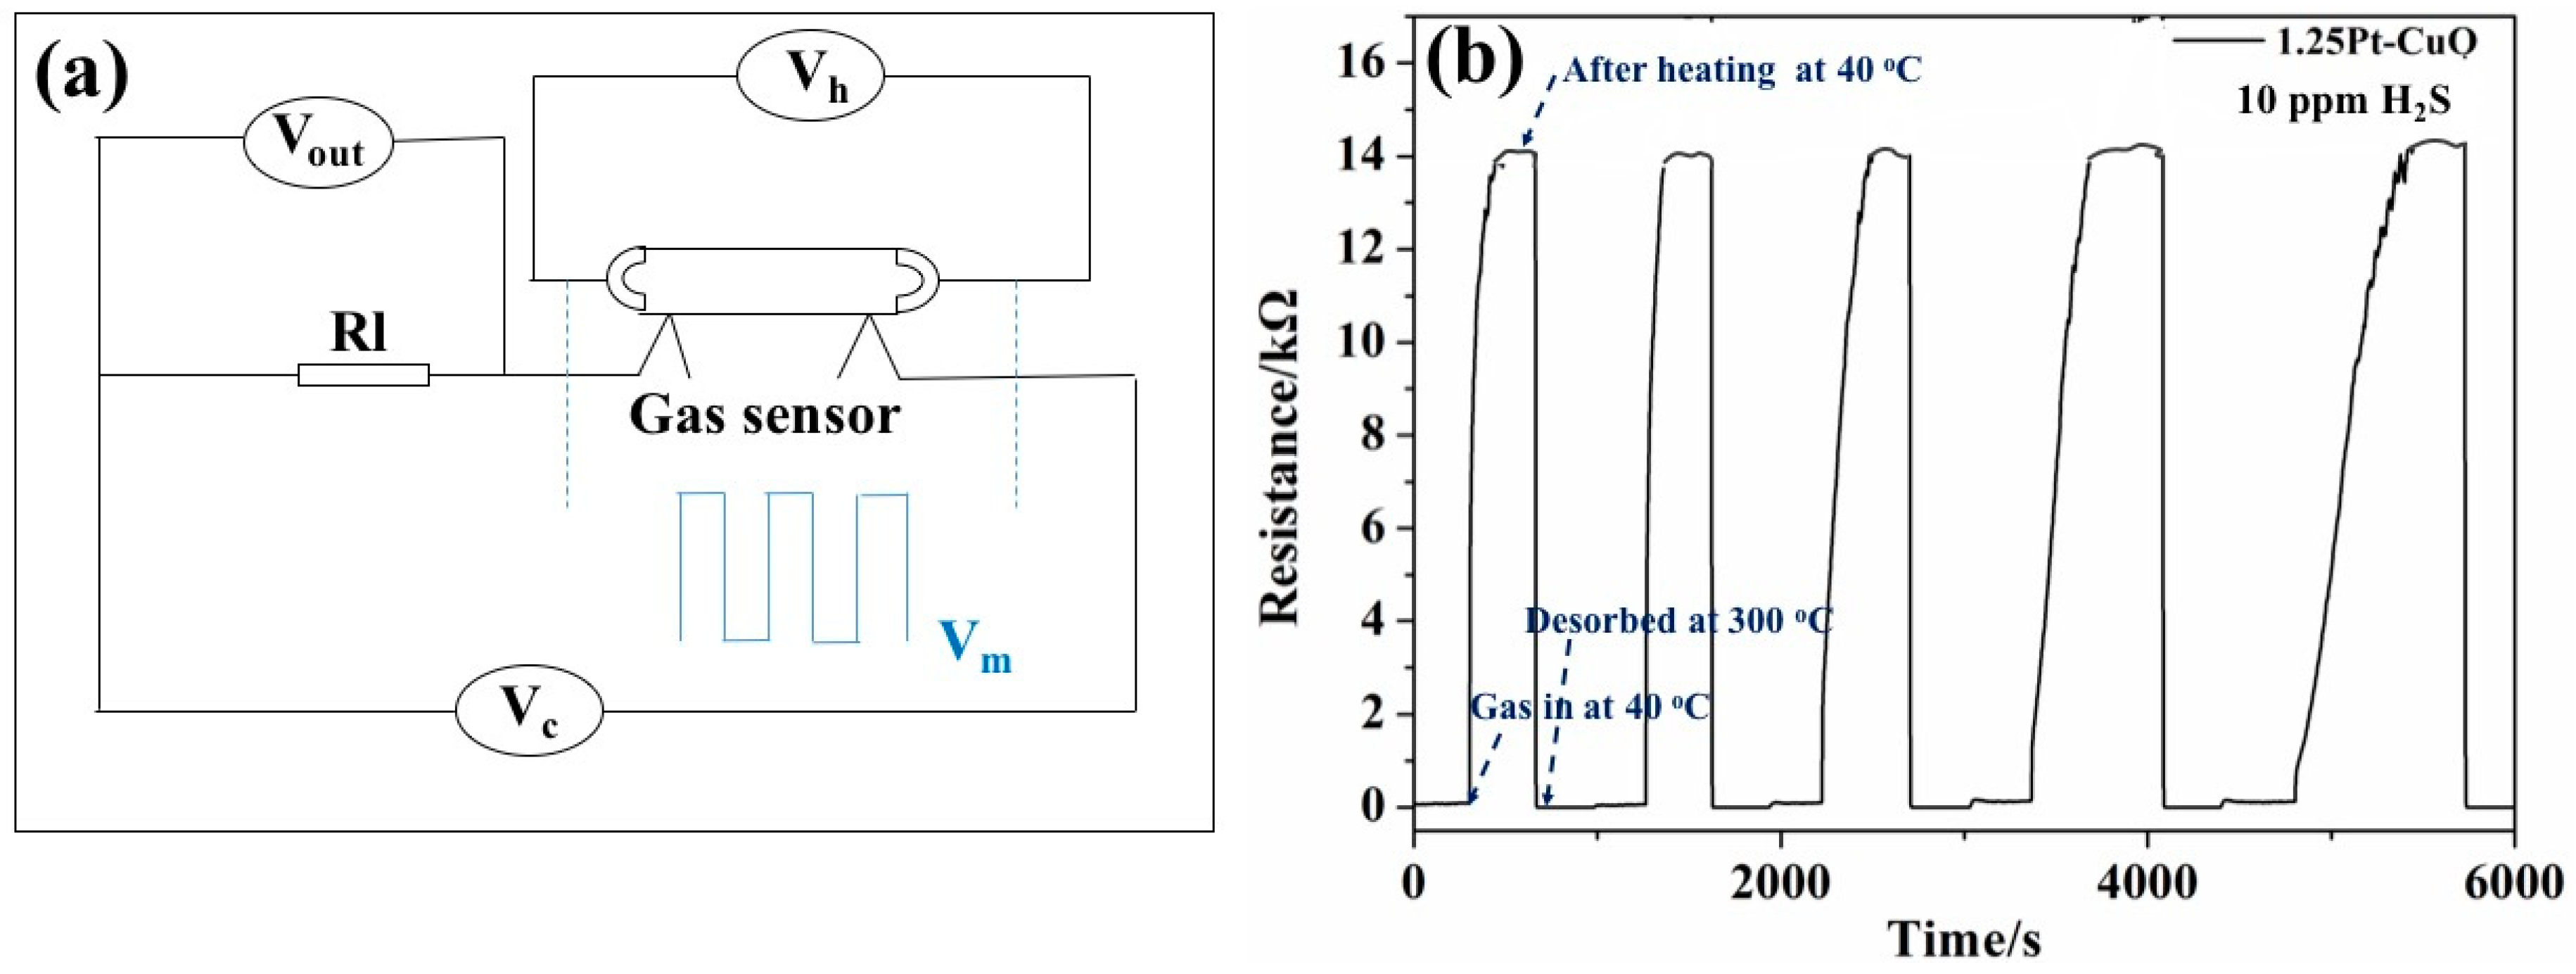
2.4. Fabrication and Characterization of Gas Sensors

Gas sensors based on bare CuO and Pt-doped CuO products were fabricated. The gas sensors were fabricated as follows: The as-synthesized Pt-doped CuO flowers were uniformly mixed with deionized water to prepare a paste, and were then coated onto a ceramic tube with a pair of gold electrodes at both ends to form a thick film. The ceramic tubes were heated and dried under infrared radiant heating. Figure 1a shows a schematic structure of the ceramic electrode. The sensing element was calcined at 500 °C for 2 h to remove the bound water and to form a porous structure on the surface for gas sensing. After cooling down, a heating wire was placed inside the ceramic tube to make sure the sensors can work at different operating temperatures. Finally, the sensors were aged at 5.0 V for 7 days, in order to stabilize it. The photograph of the gas sensor is shown in Figure 1b.
The WS-30A Gas Sensing Analysis System (Weisheng Tech Co, Ltd., Zhengzhou, China) was used to measure the performance of the gas sensor, and the static testing method was applied to examine the gas sensing performance. The gas sensors were placed into a closed test chamber (15 L in volume), and the target gases were injected into the test chamber through a rubber plug. The electrical properties changed once the sensor was exposed to the target gas. When the response reached a constant value, the sensors were exposed to air again, and the response returned to its original value. The response was defined as the ratio of Ra to Rg or Rg to Ra, where Ra and Rg are the resistances in the air and target gas, respectively. The response and recovery time were defined as the time needed for the sensor to reach 90% of the total change of the resistance during adsorption and desorption, respectively.

3. Results and Discussions

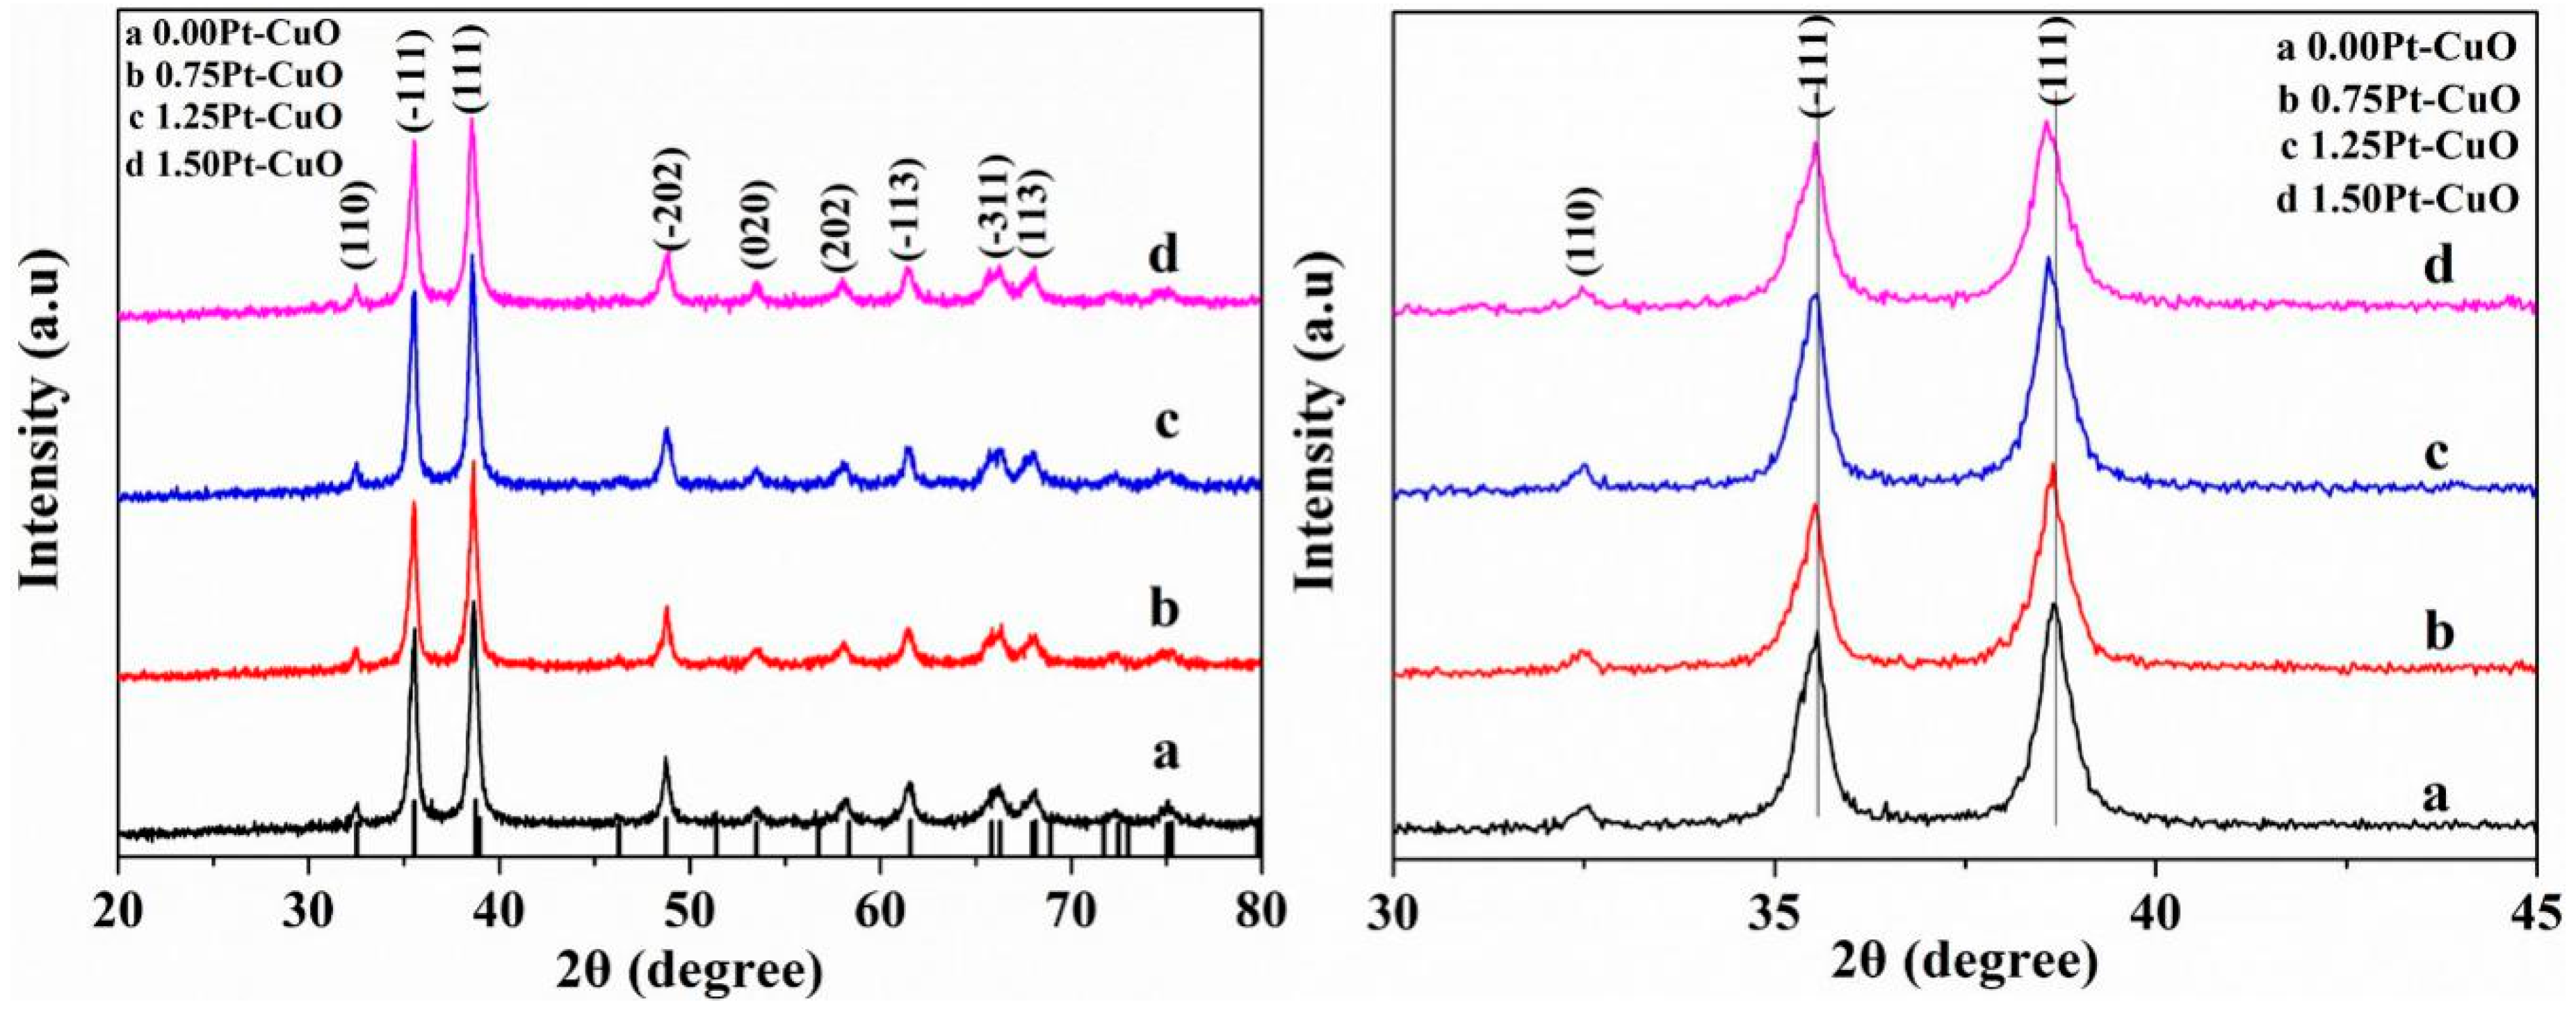
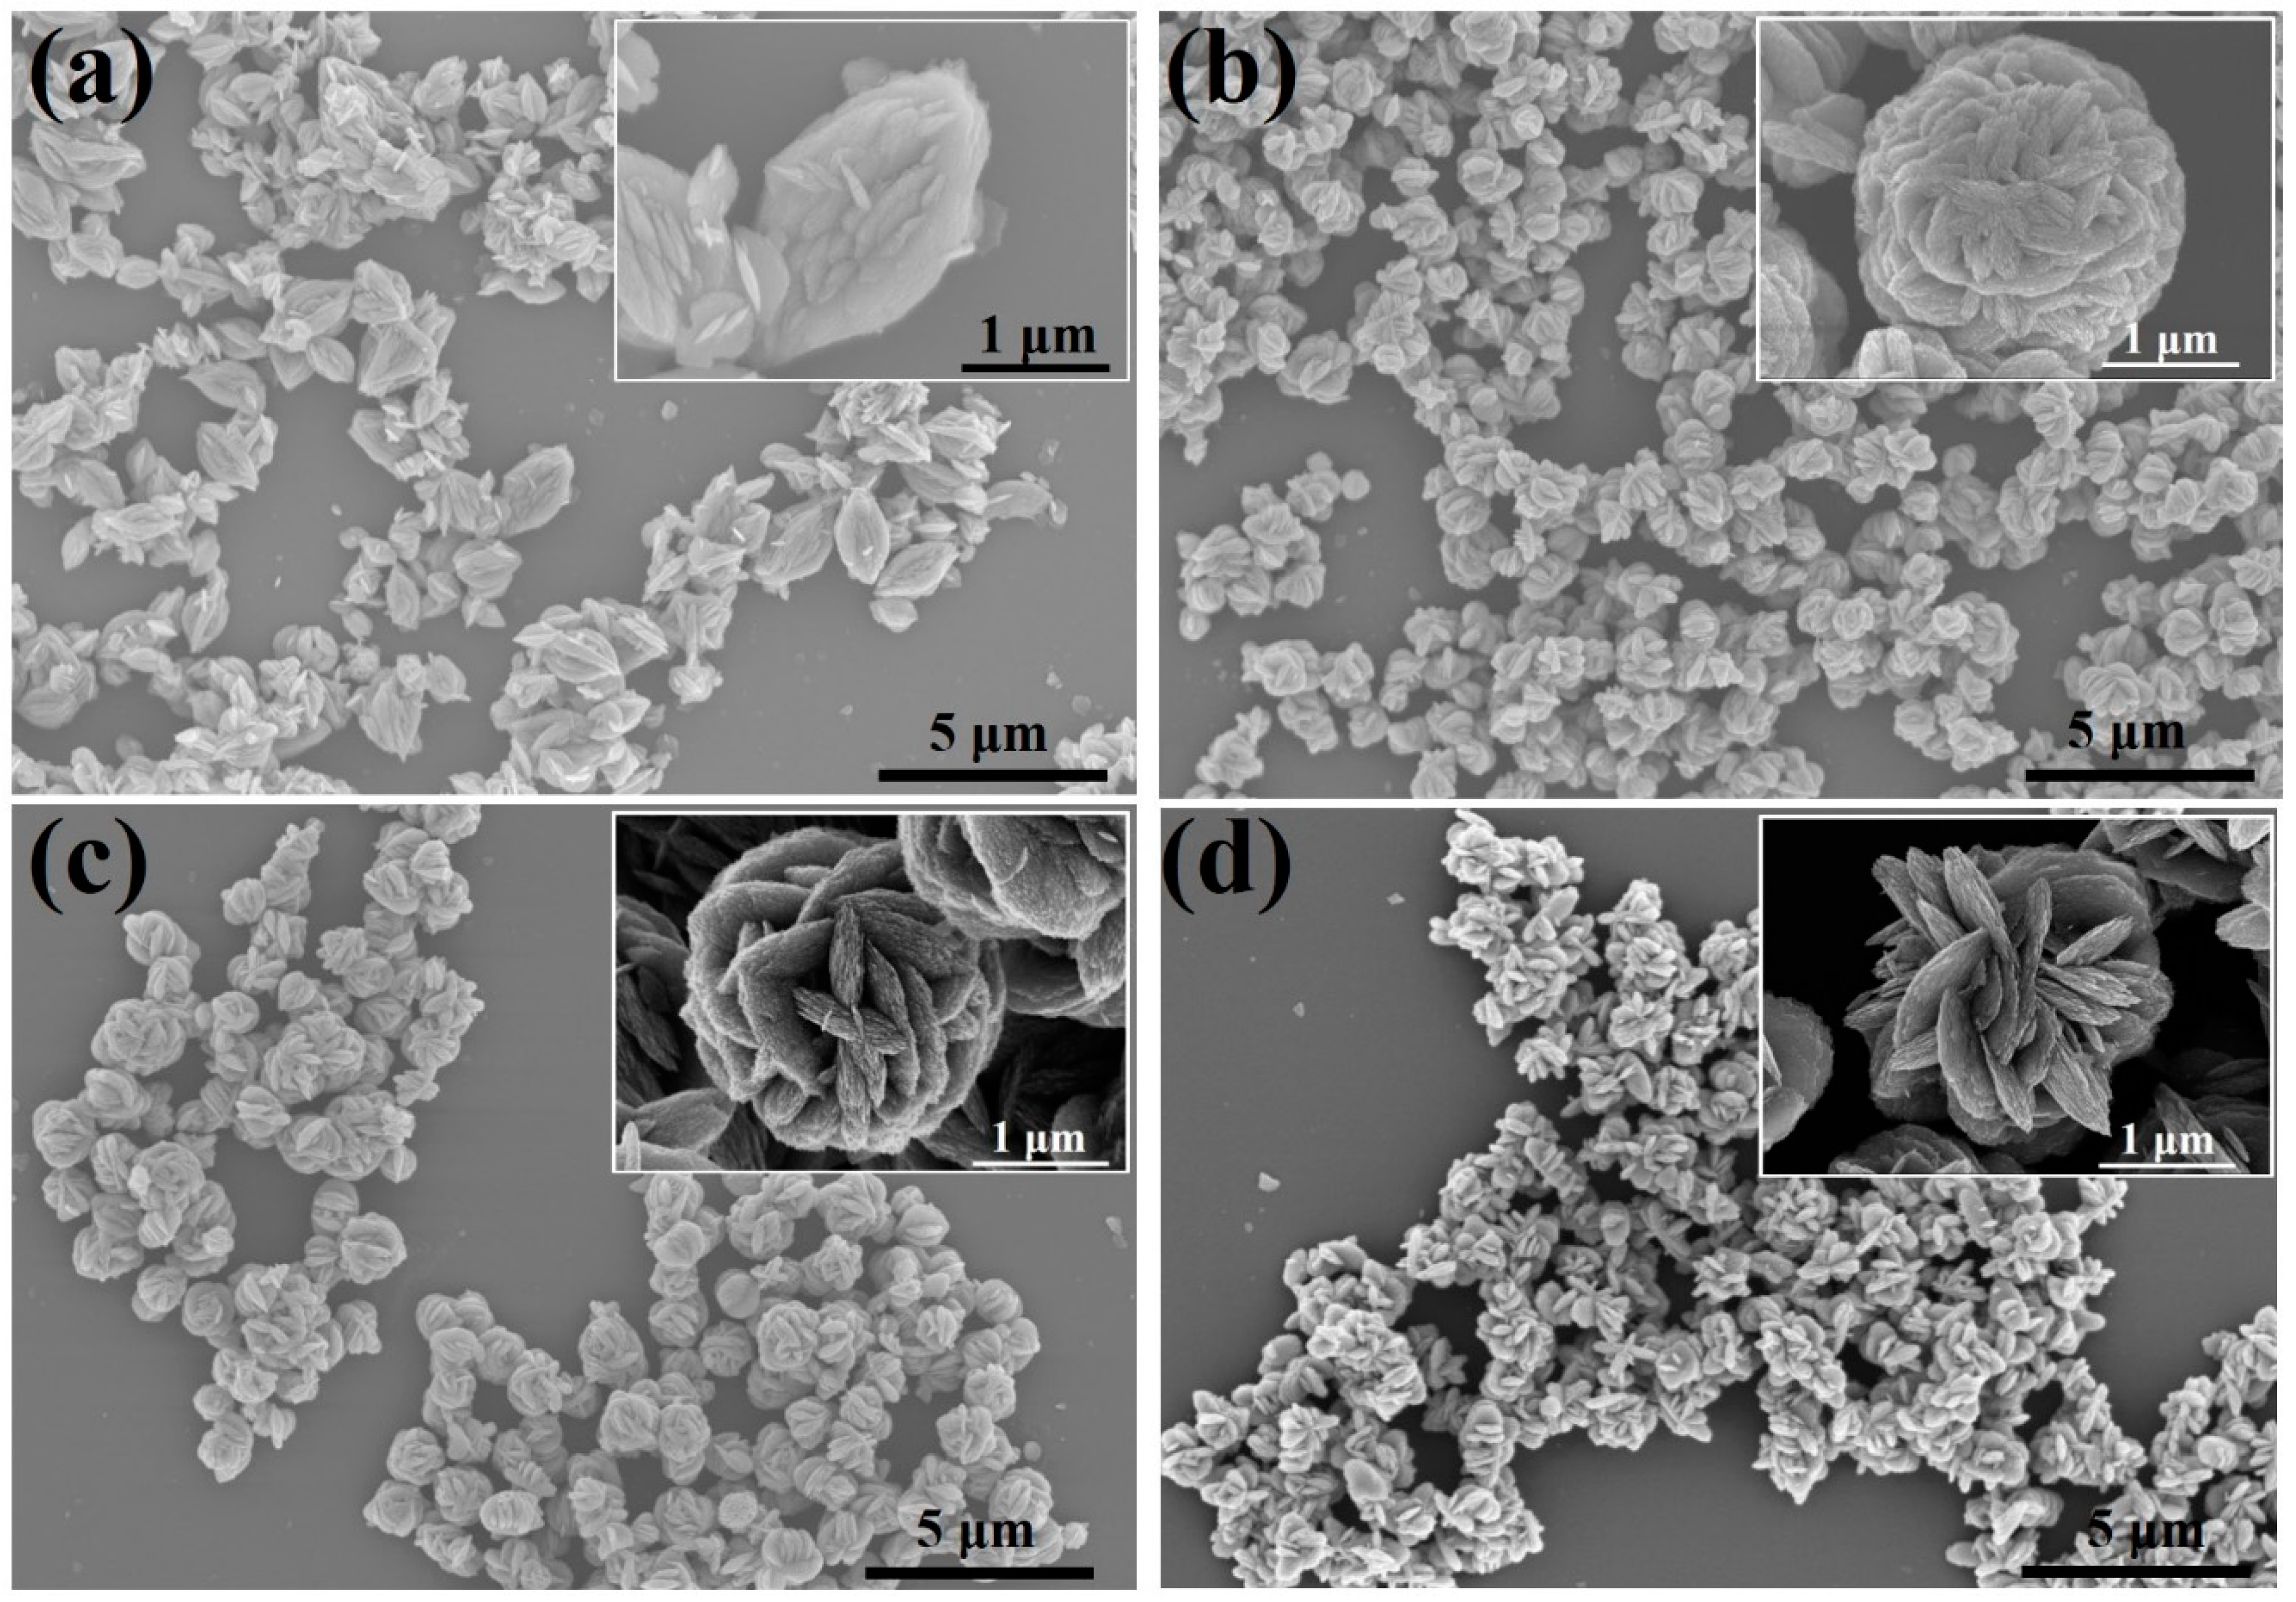
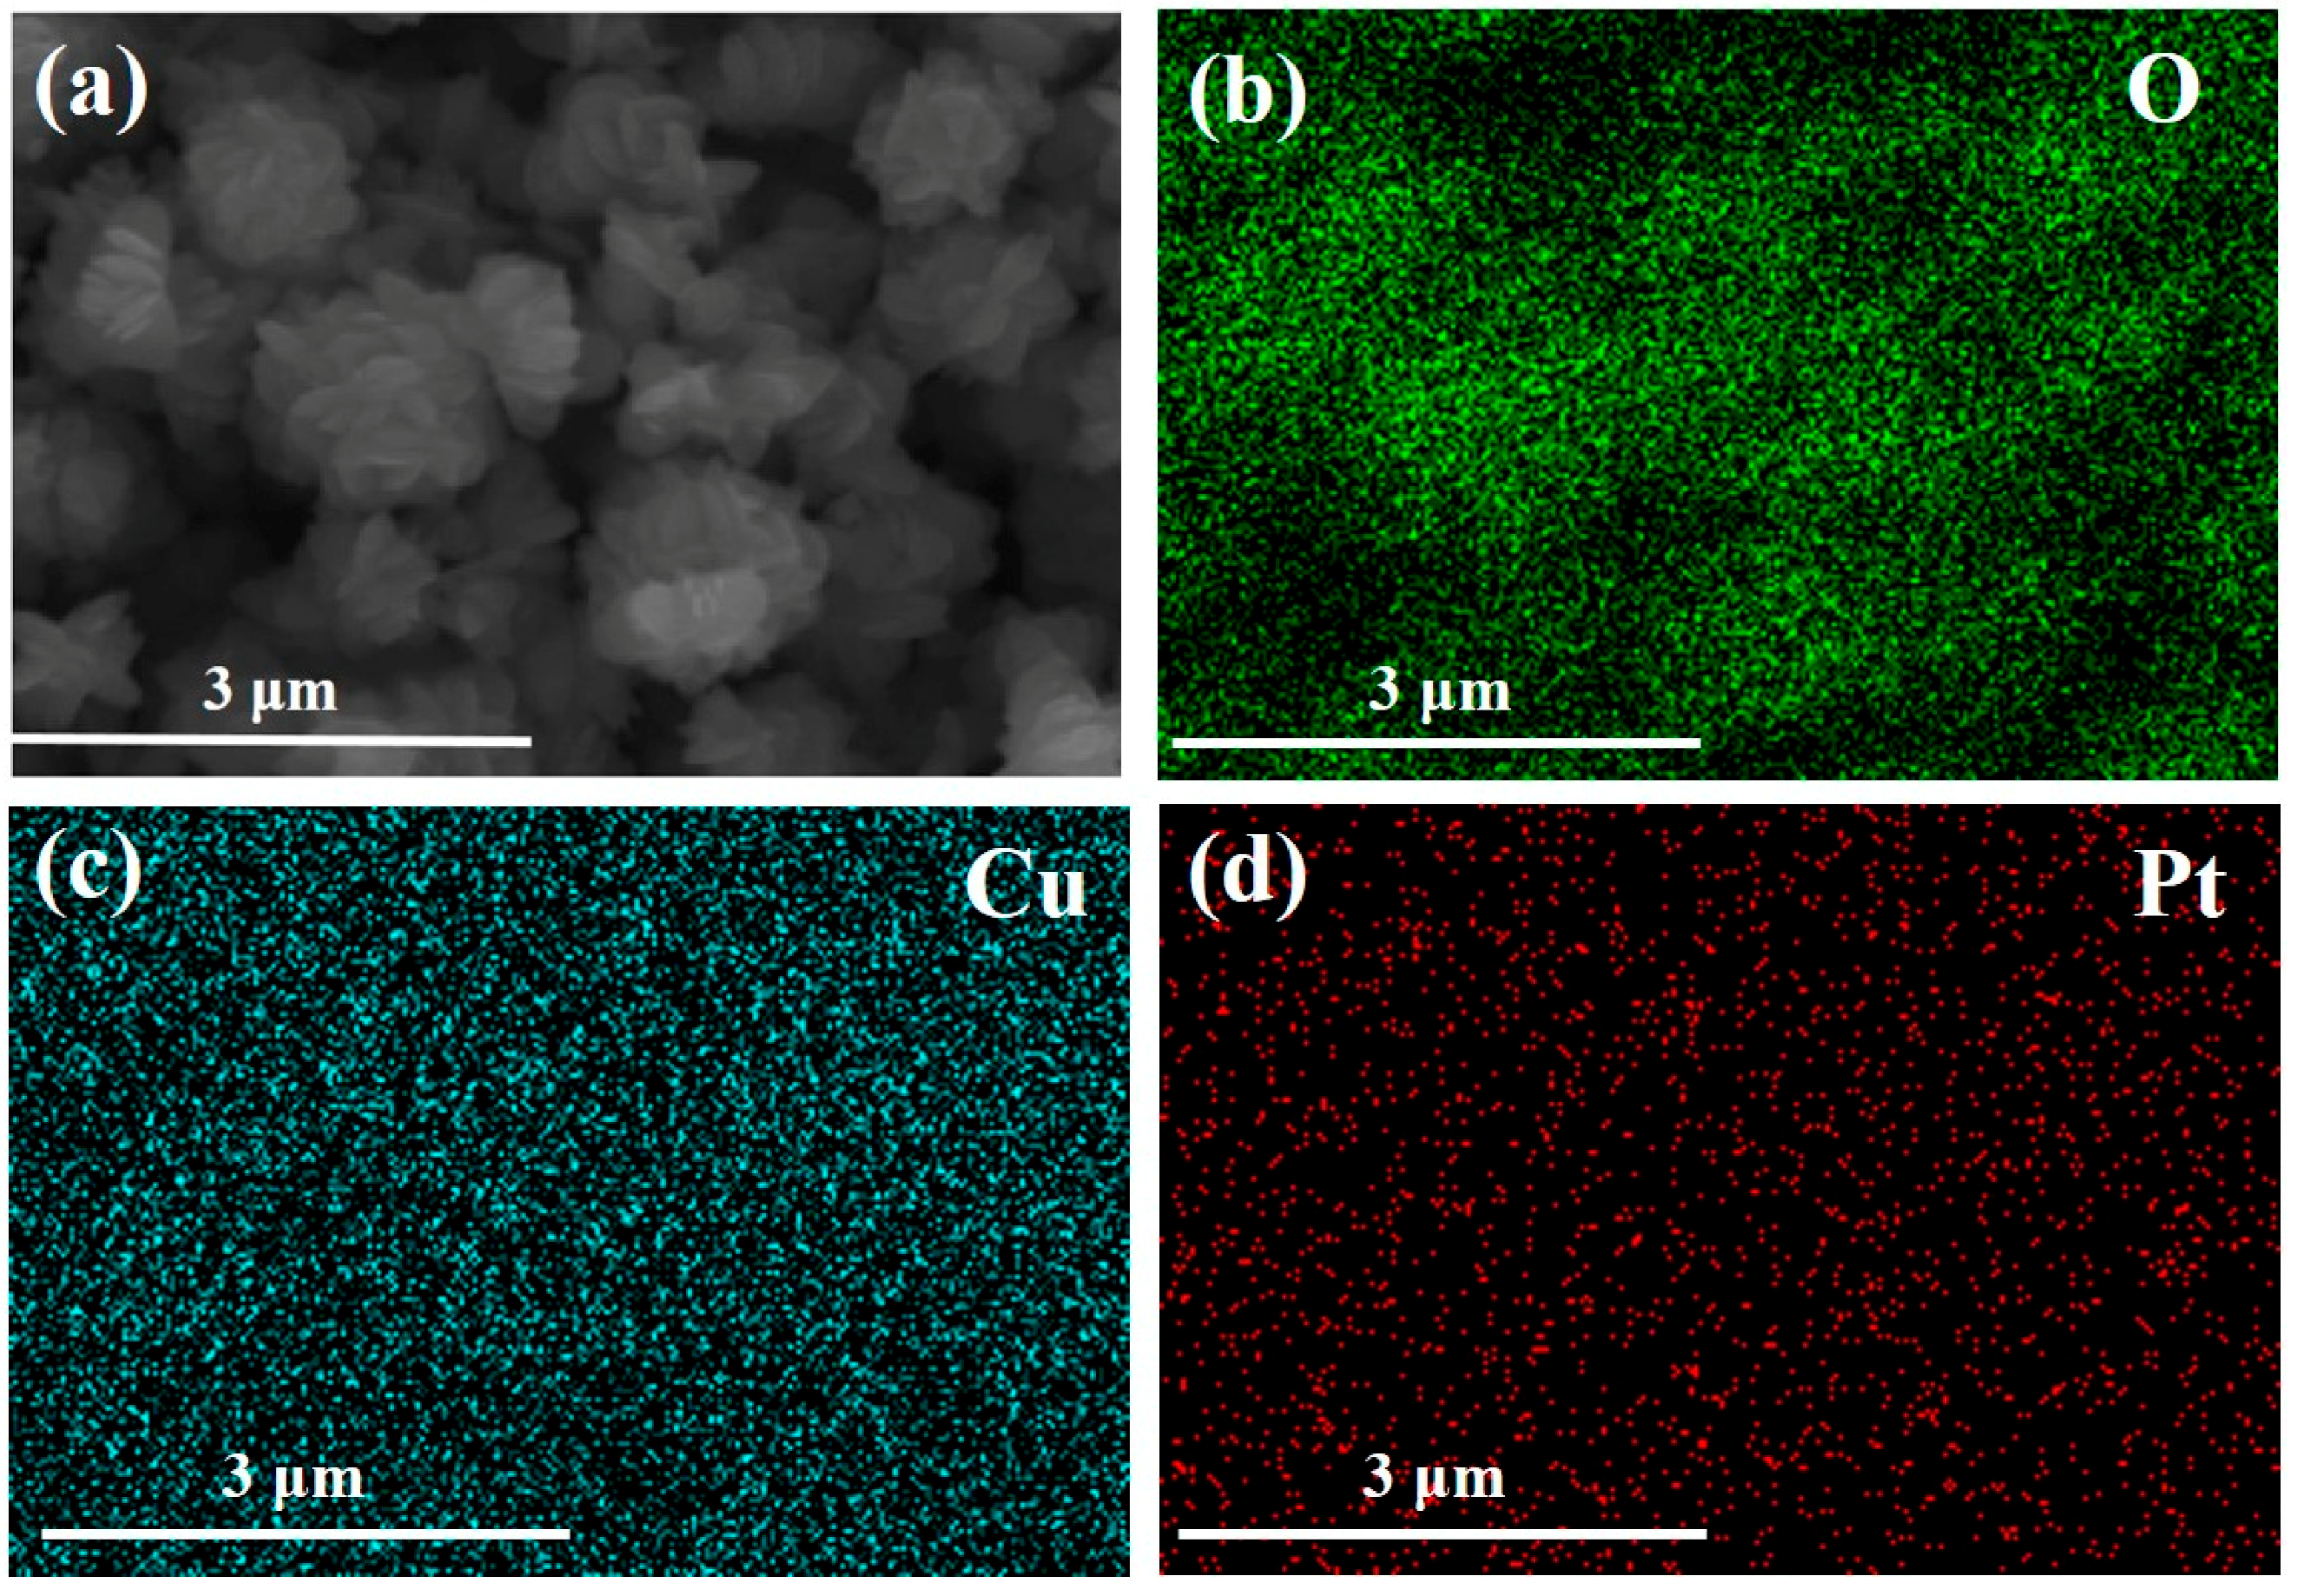
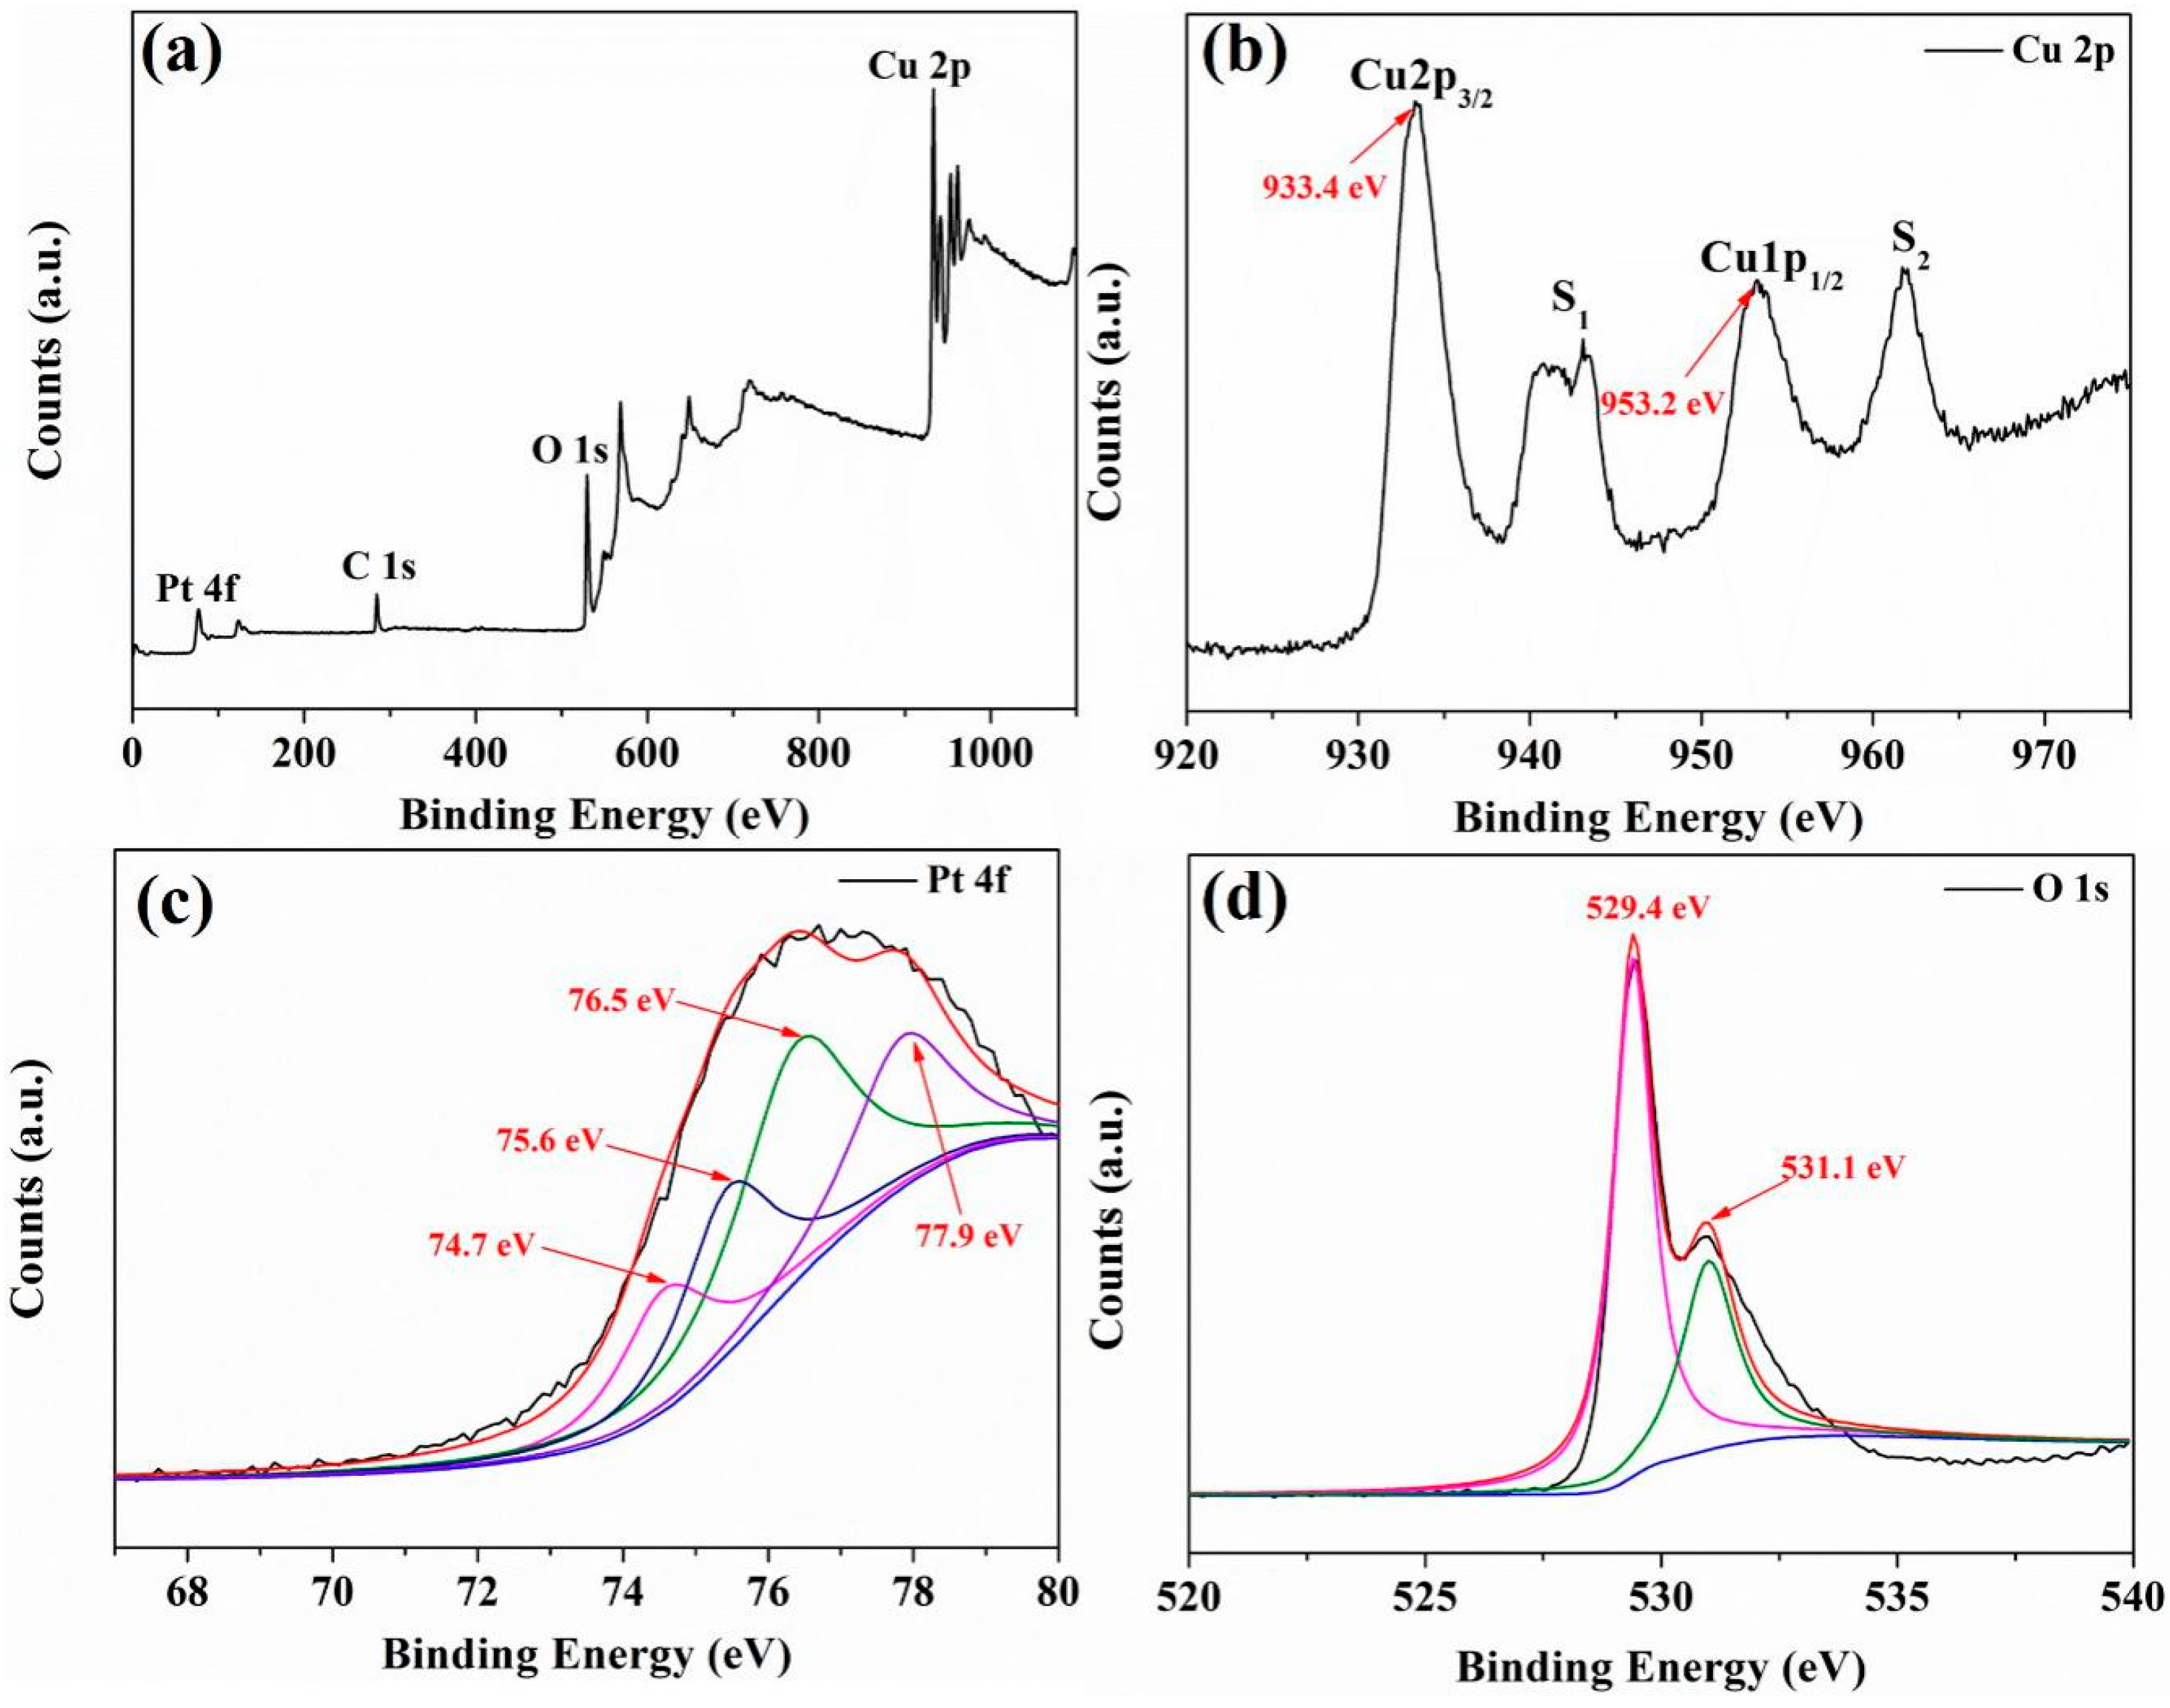
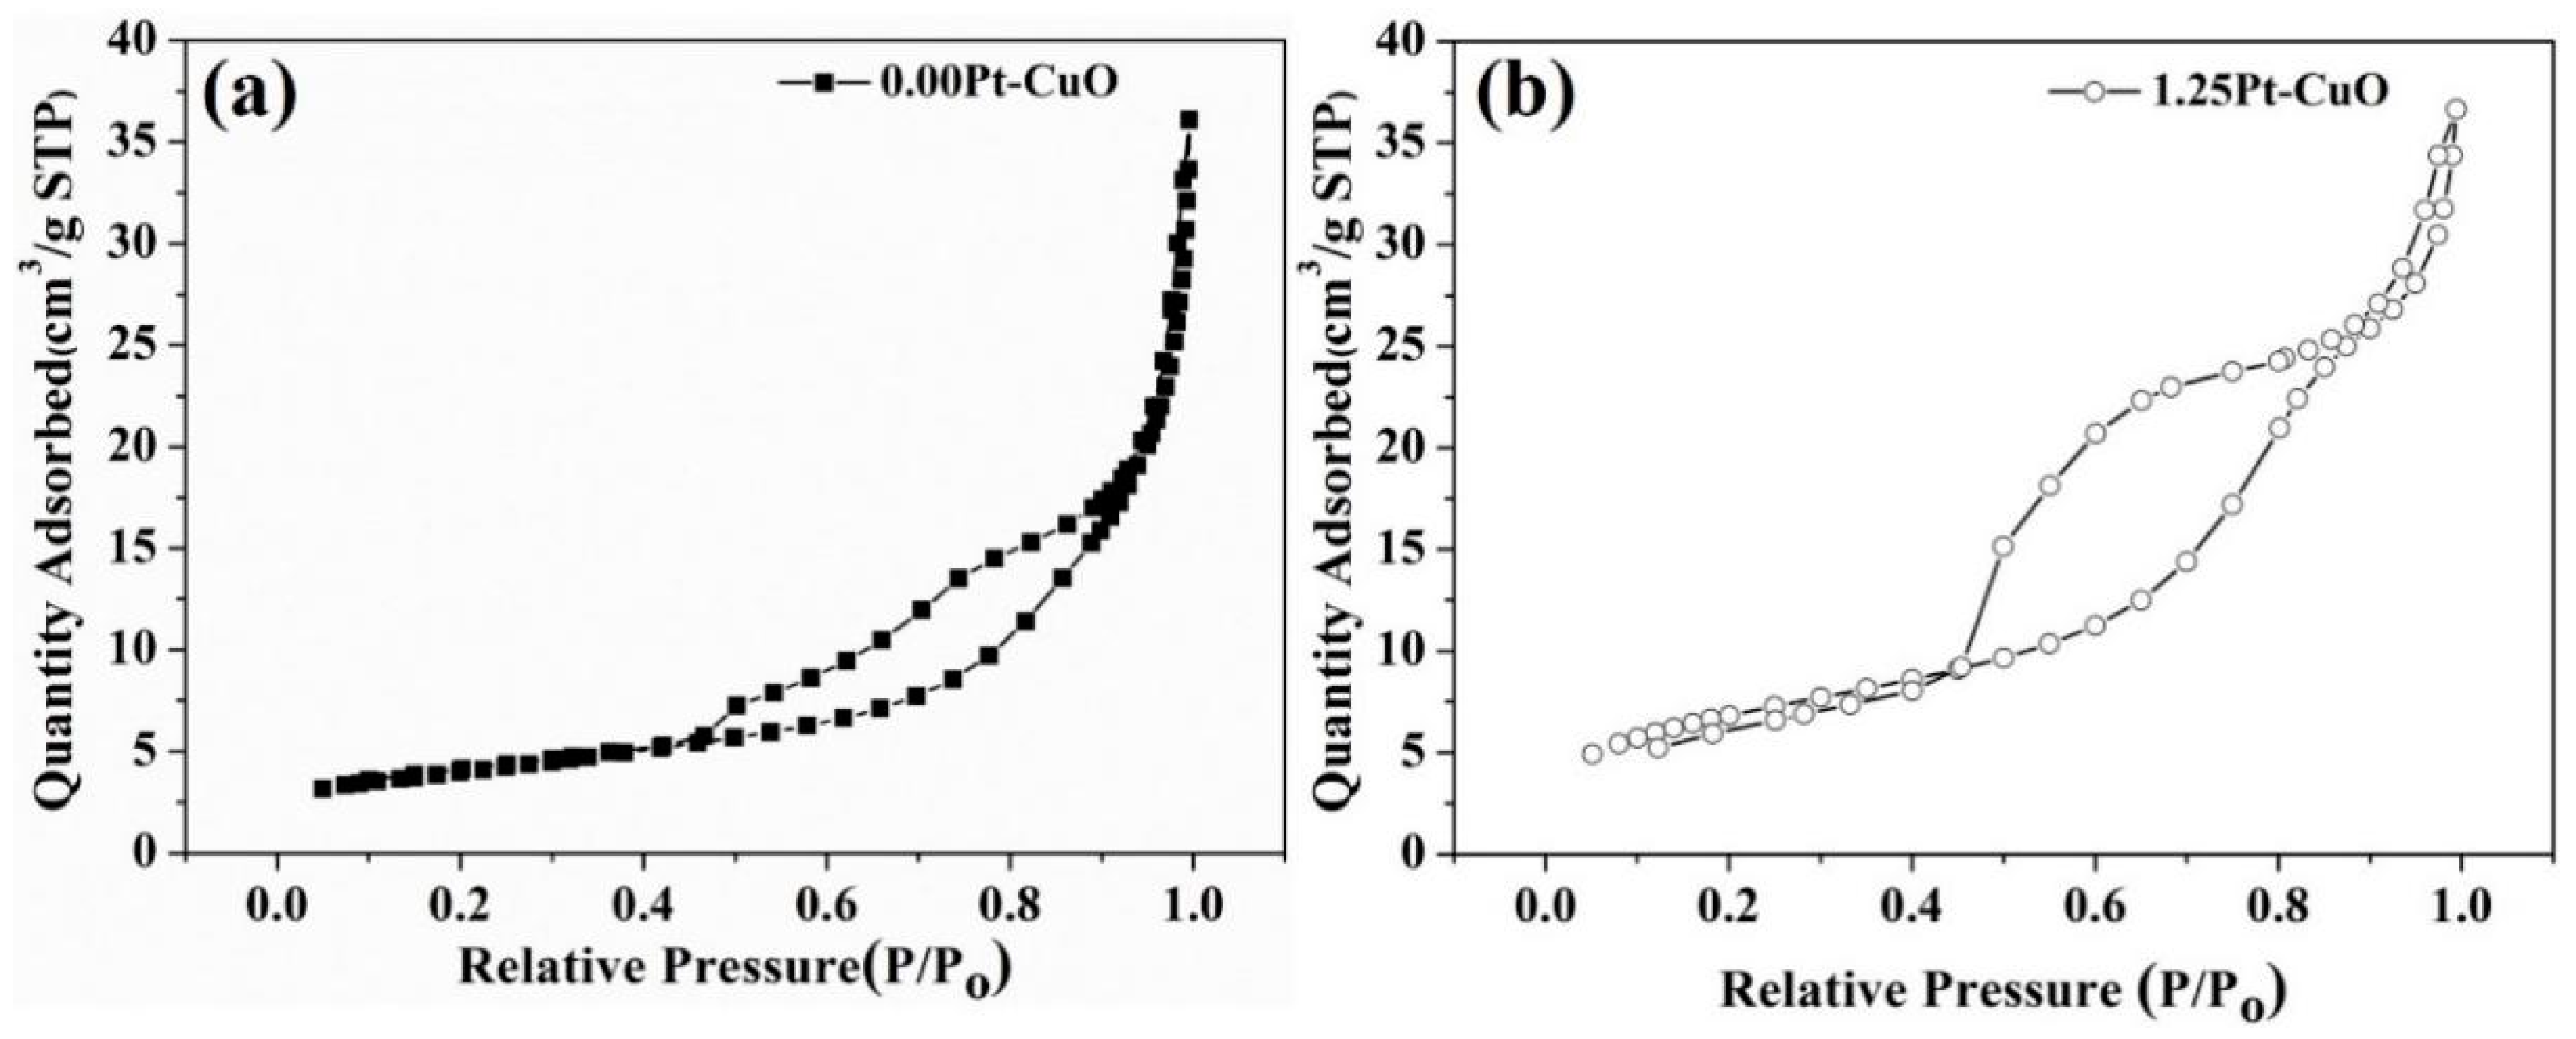
3.1. Structure and Morphology of Sensing Materials

Figure 2 plots the XRD patterns of pure CuO structures and Pt-doped CuO structures. The patterns of pure CuO are specified as monoclinic CuO (JCPDS No. 72-0629), and reveal a series of well-defined diffraction peaks at 2θ of 32.53°, 35.56°, 38.75°, 48.75°, 53.50°, 58.36°, 61.57°, 66.28°, and 67.97°, corresponding to the (110), (−111), (111), (−202), (020), (202), (−113), (−311), and (113) planes of monoclinic CuO. All XRD patterns look very similar at first sight, as shown in Figure 2a. However, the difference can be found at the specific region (35–40°) of XRD patterns in Figure 2b. After Cu2+ ions had been replaced by Pt2+ ions in the CuO matrix, the lattice parameter of CuO crystal is changed because of the different ionic radius between Cu2+ (0.73 Å) [28] and Pt2+ (0.86 Å) [29]. As a result, with the increase of the Pt dopant from 0.75 wt % to 1.50 wt %, the (−111) and (111) peaks were slightly shifted to a lower angle [30]. What is more, we used the least square refinement method in the unit cell program to determine the lattice constants. The obtained parameters of the 1.25 wt % Pt-doped CuO are α = 4.6837 Å, b = 3.4226 Å, and c = 5.1288 Å, and the unit cell volume is 82.2169 Å3. The lattice constants of the doped sample are the monoclinic data of undoped CuO (α = 4.6504 Å, b = 3.3903 Å, c = 5.0997 Å, and unit cell volume = 80.4032 Å3) obtained under the same conditions. It can be seen that the unit cell expands with the Pt2+ ion doping in CuO. This clearly proved that the Pt2+ ions were successfully replaced by Cu2+ in the CuO matrix.
Field emission scanning electron microscope (FESEM) images of pristine CuO and Pt-doped CuO with various doping concentrations are shown in the Figure 3. As shown in Figure 3a, the morphology of the pristine CuO was olive-like, exhibiting particle diameters ranging from 200 nm to 4 μm. Once the Pt2+ ions were introduced, the morphology of the CuO structure transformed into being flower-like, as illustrated in Figure 3b,c. At a Pt doping concentration of 1.25 wt % (Figure 3c), a three-dimensional (3D) flower-like CuO with hierarchical nanostructures was obtained. The flower-like CuO is ca. 1.5 μm in diameter and homogeneously distributed, and the hierarchical flower-like CuO consists of nanosheets with sizes around 200 nm. The resulting growth-mechanism for CuO after Pt doping can be explained as follows: A copper nitrate solution provides Cu2+ ions to form a blue precipitate of copper hydroxide Cu(OH)2. The color of the Cu(OH)2 precipitate gradually turned into dark brown, which was caused by the dehydration of Cu(OH)2 and finally formed the nano-CuO along with the increase of the water bath temperature. Once the Pt was introduced, it did not affect the precipitate color, but seemed to have a consecutive influence on the growth rate of the nanoflower CuO [31]. The Pt ions tend to be adsorbed on the basal planes of the CuO, and hence modify the chemical surface properties of CuO, such as the relative surface free energy on the facets. It was also observed that the presence of higher amounts of Pt influenced the dehydration of Cu(OH)2 and retarded the phase transformation of the Cu(OH)2 to CuO. In addition, the morpholoies of the CuO were not significantly altered after increasing the Pt doping concentration to 1.50 wt %, instead, the uniformity of the CuO declined again (Figure 3d). Thus, it was clearly demonstrated that the morphology of CuO can be adjusted by the Pt doping.
The EDX element mapping was employed to evaluate the uniformity of element distribution in a 1.25Pt-CuO specimen. Figure 4 shows the distribution of the O, Cu, and Pt, respectively, and it is clearly demonstrated that all three elements are homogeneously distributed. Meanwhile, the concentrations of the 1.00Pt-CuO, 1.25Pt-CuO, and 1.50Pt-CuO specimens were also determined by inductively coupled plasma mass spectroscopy, the Pt concentrations were 0.76 at%, 0.85 at%, and 0.91 at%, respectively.
The XPS spectral measurements were used to analyze the chemical states of the 1.25Pt-CuO sample. The full spectra of 1.25Pt-CuO are shown in Figure 5a, which proved the existence of Cu, Pt, and O. The appearance of the C 1s peaks can be ascribed to the adsorbed or bonded organic species [32]. In Figure 5b, two peaks at 933.4 eV and 953.2 eV, corresponding to Cu 2p3/2 and Cu 2p1/2, denote the existence of Cu2+ in the form of CuO. In addition, the satellite peaks of Cu 2p3/2 and Cu 2p1/2, denoted as peaks S1 and S2, respectively, are characteristic for a partially filled d-orbital (3 d9 in the case of Cu2+) [33]. The Pt 4f spectra of 1.25Pt-CuO are shown in Figure 5c. After the Pt 4f curve fitting (Figure 5c), the spectrum consists of two pairs of peaks at 74.7 and 76.5 eV and at 75.6 and 77.9 eV, which are assigned to Pt0 and Pt2+, respectively [34]. The above measurements clearly proved that the Pt2+ ions were successfully doped into the CuO matrix, which is in good accordance with the results of EDX and ICP-AES. Figure 5d shows the high-resolution O 1s XPS profile of Pt-doped CuO, in which the two peaks at binding energies of 529.4 eV and 531.1 eV correspond to the typical surface lattice oxygen and the surface absorbed oxygen species (O2ads and Oads) [35]. The surface absorbed oxygen species play a positive role in the enhancement of gas sensing performance, as they are capable of reacting with test gas molecules [36].
The BET surface areas of the pure CuO and 1.25Pt-CuO were investigated via a BET method using N2 adsorption and desorption. As shown in Figure 6, it has been shown that the BET surface area of the 1.25Pt-CuO is 24.3 m2/g, which is 1.9 times larger than pure CuO (13.1 m2/g). However, none of such two samples showed a porous structure based on the BET results. The larger surface area of the 1.25Pt-CuO can be beneficial for the enhancement of gas sensing properties.

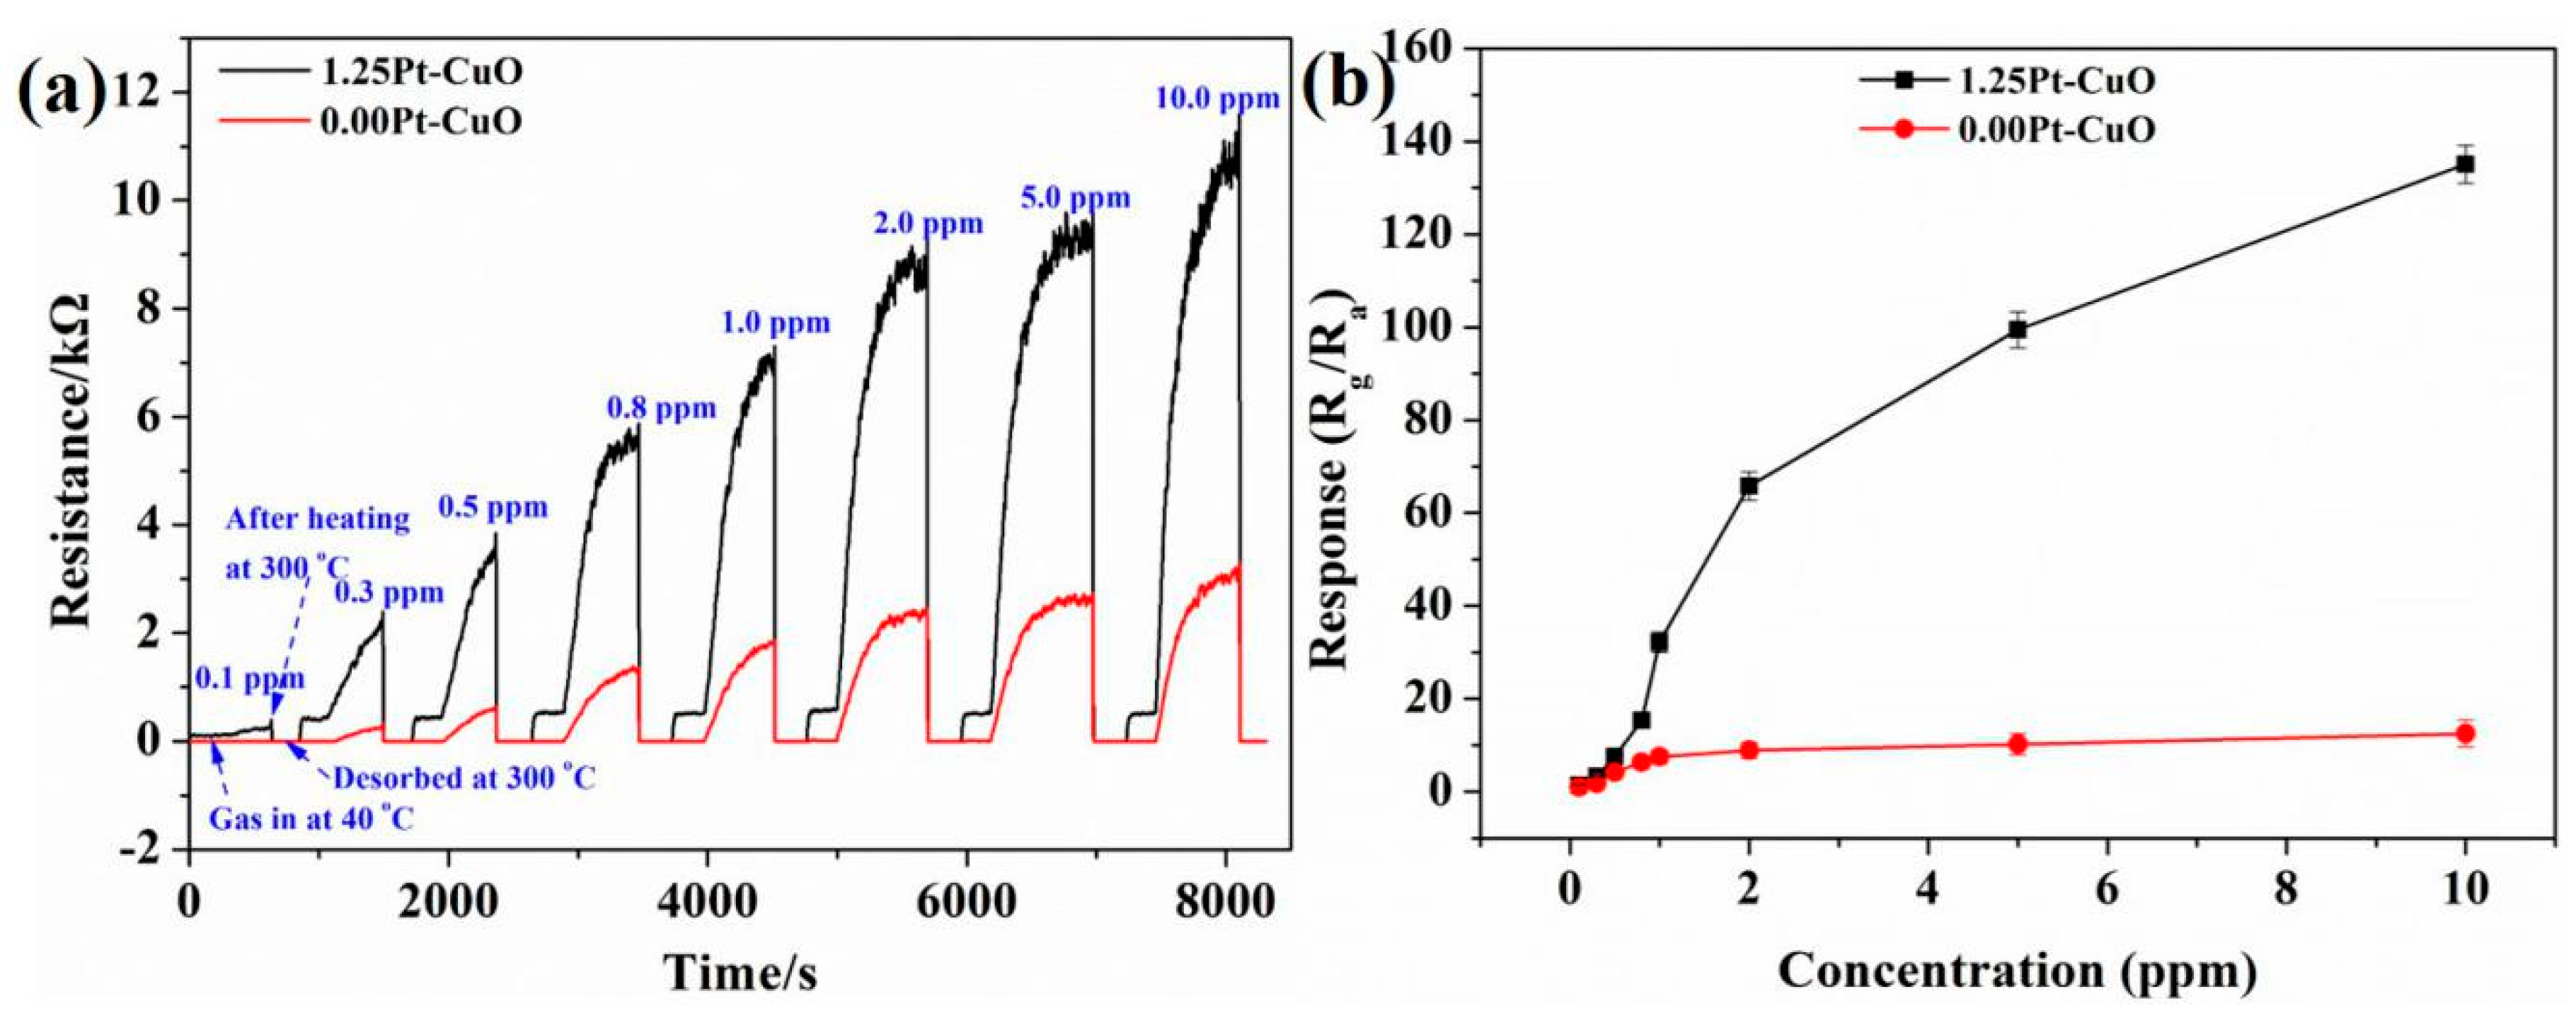
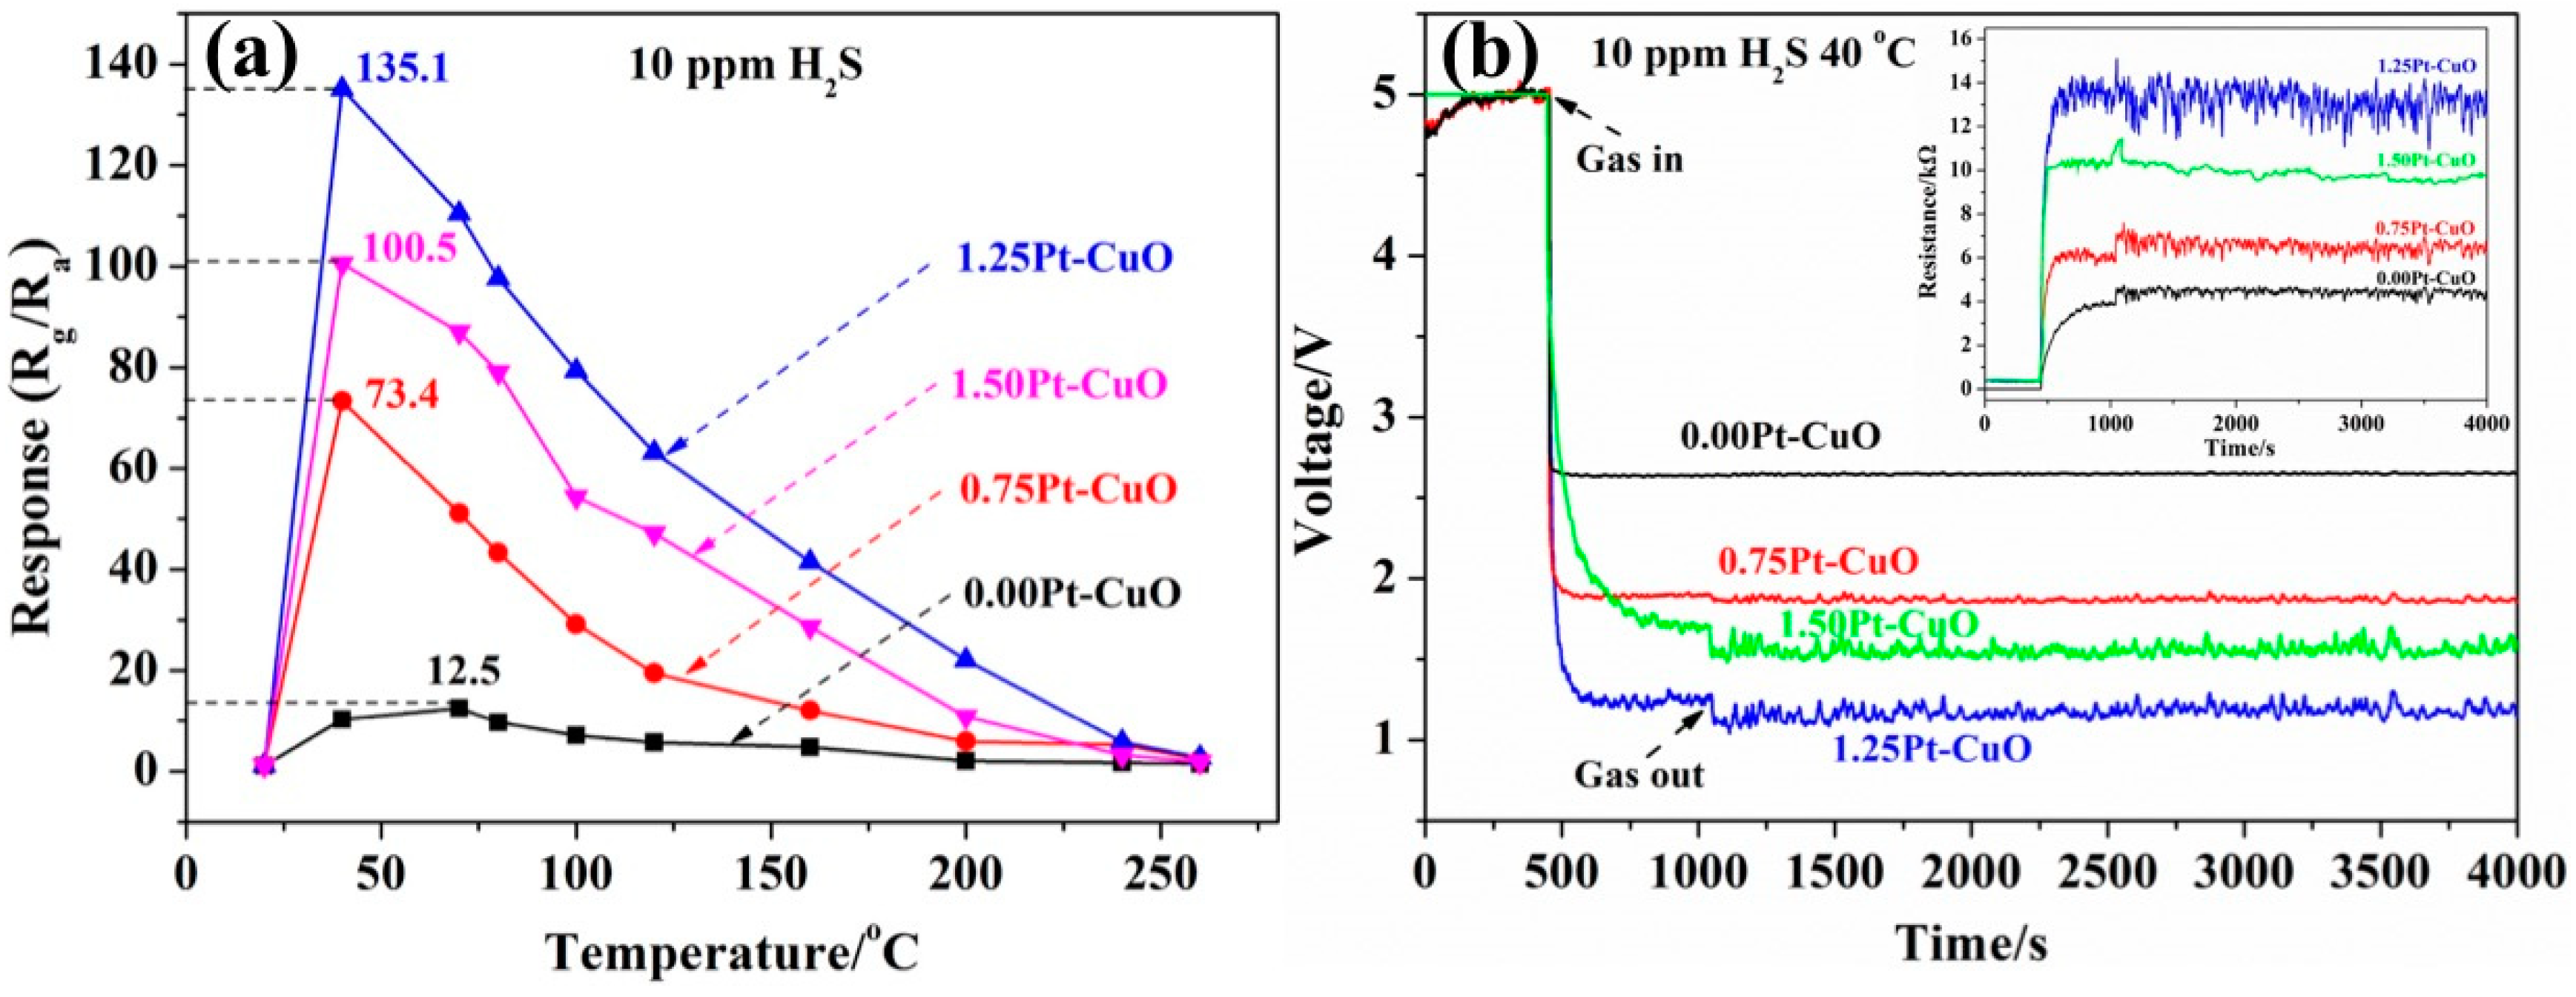
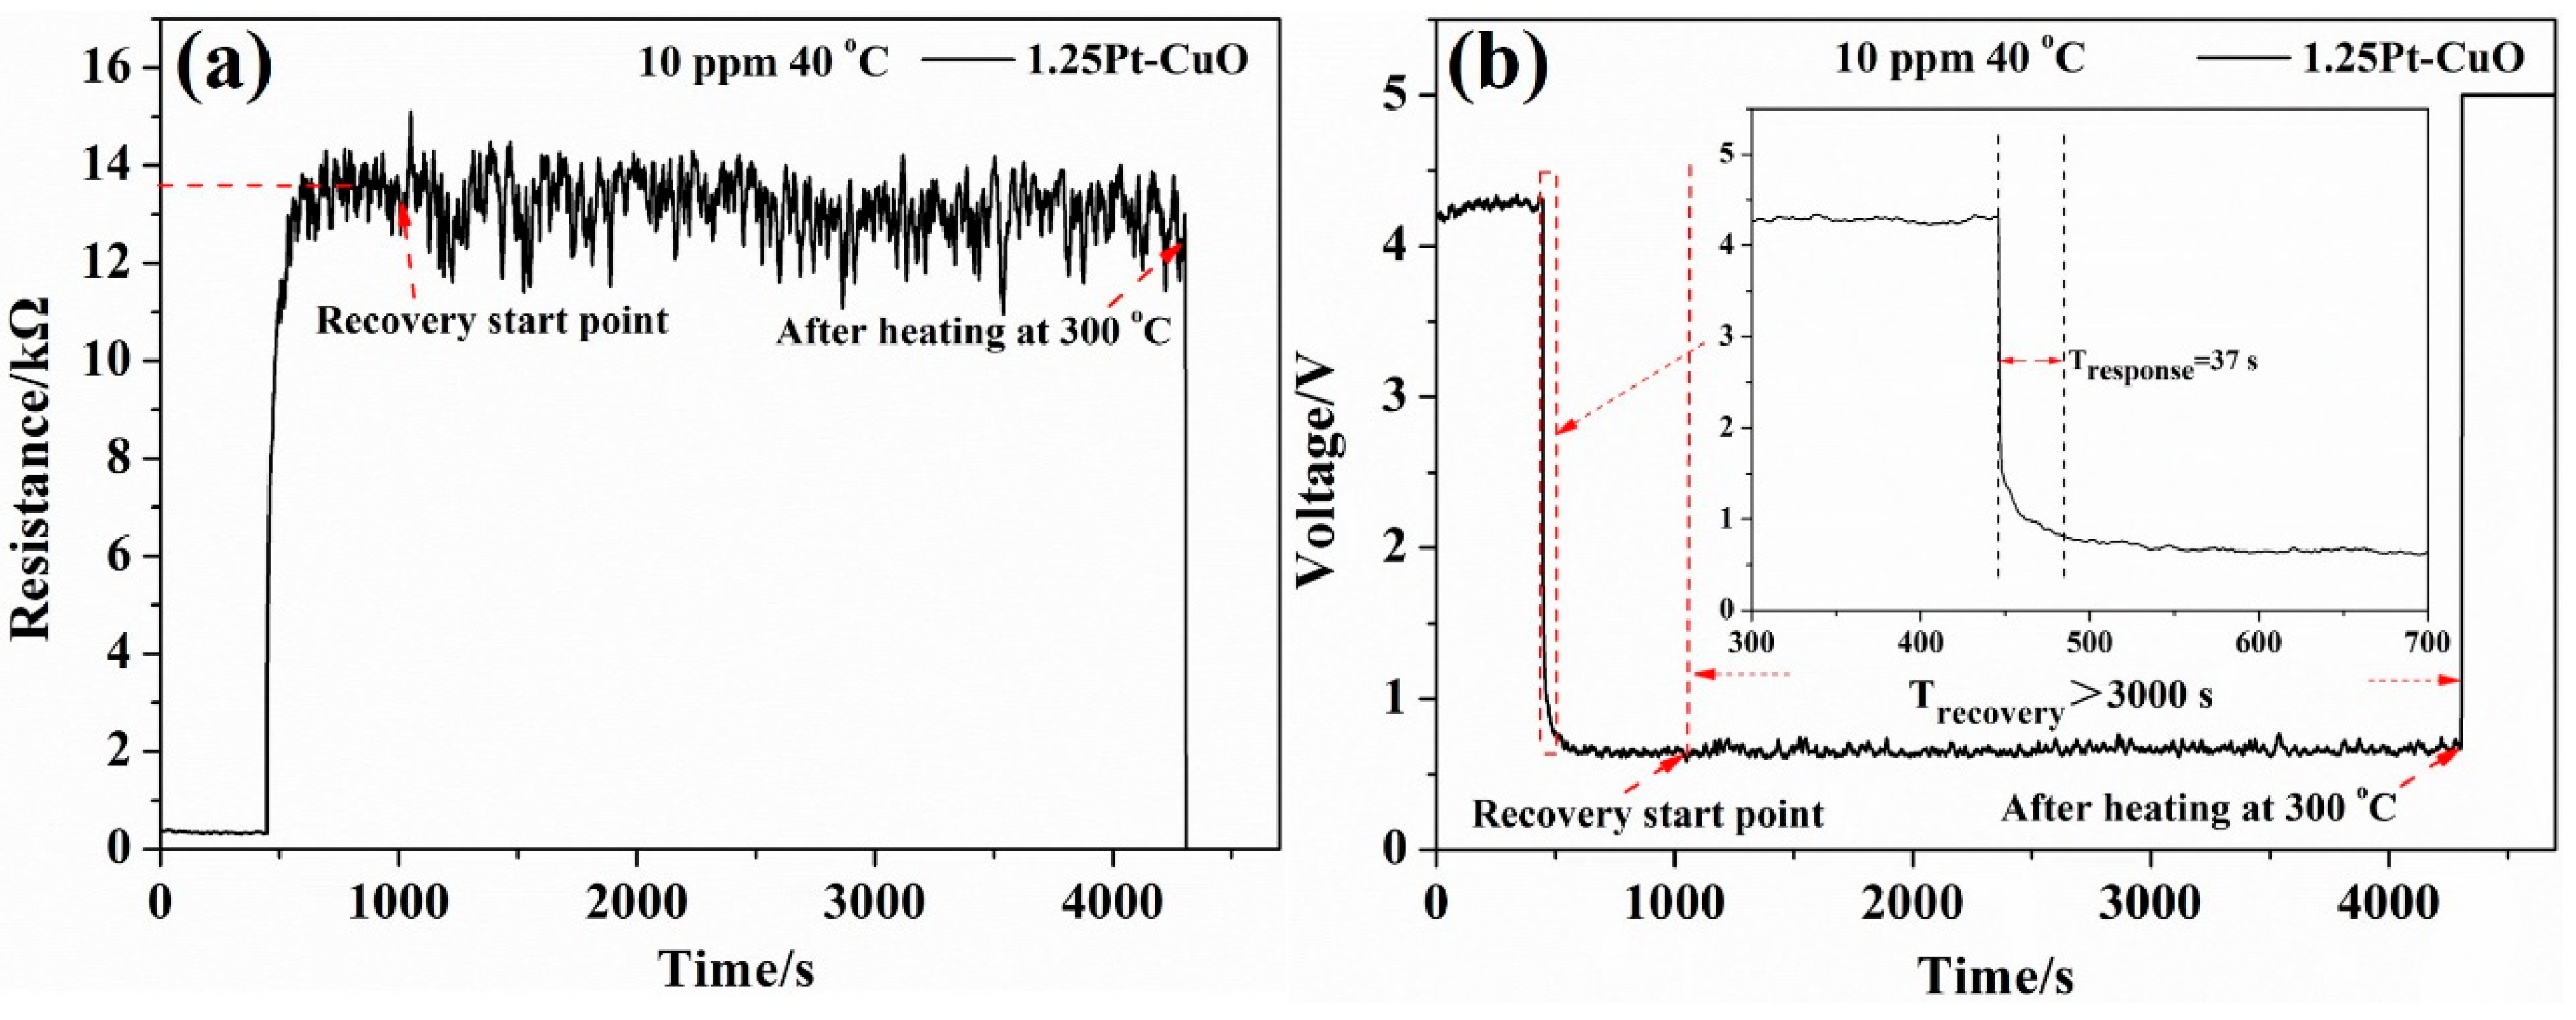
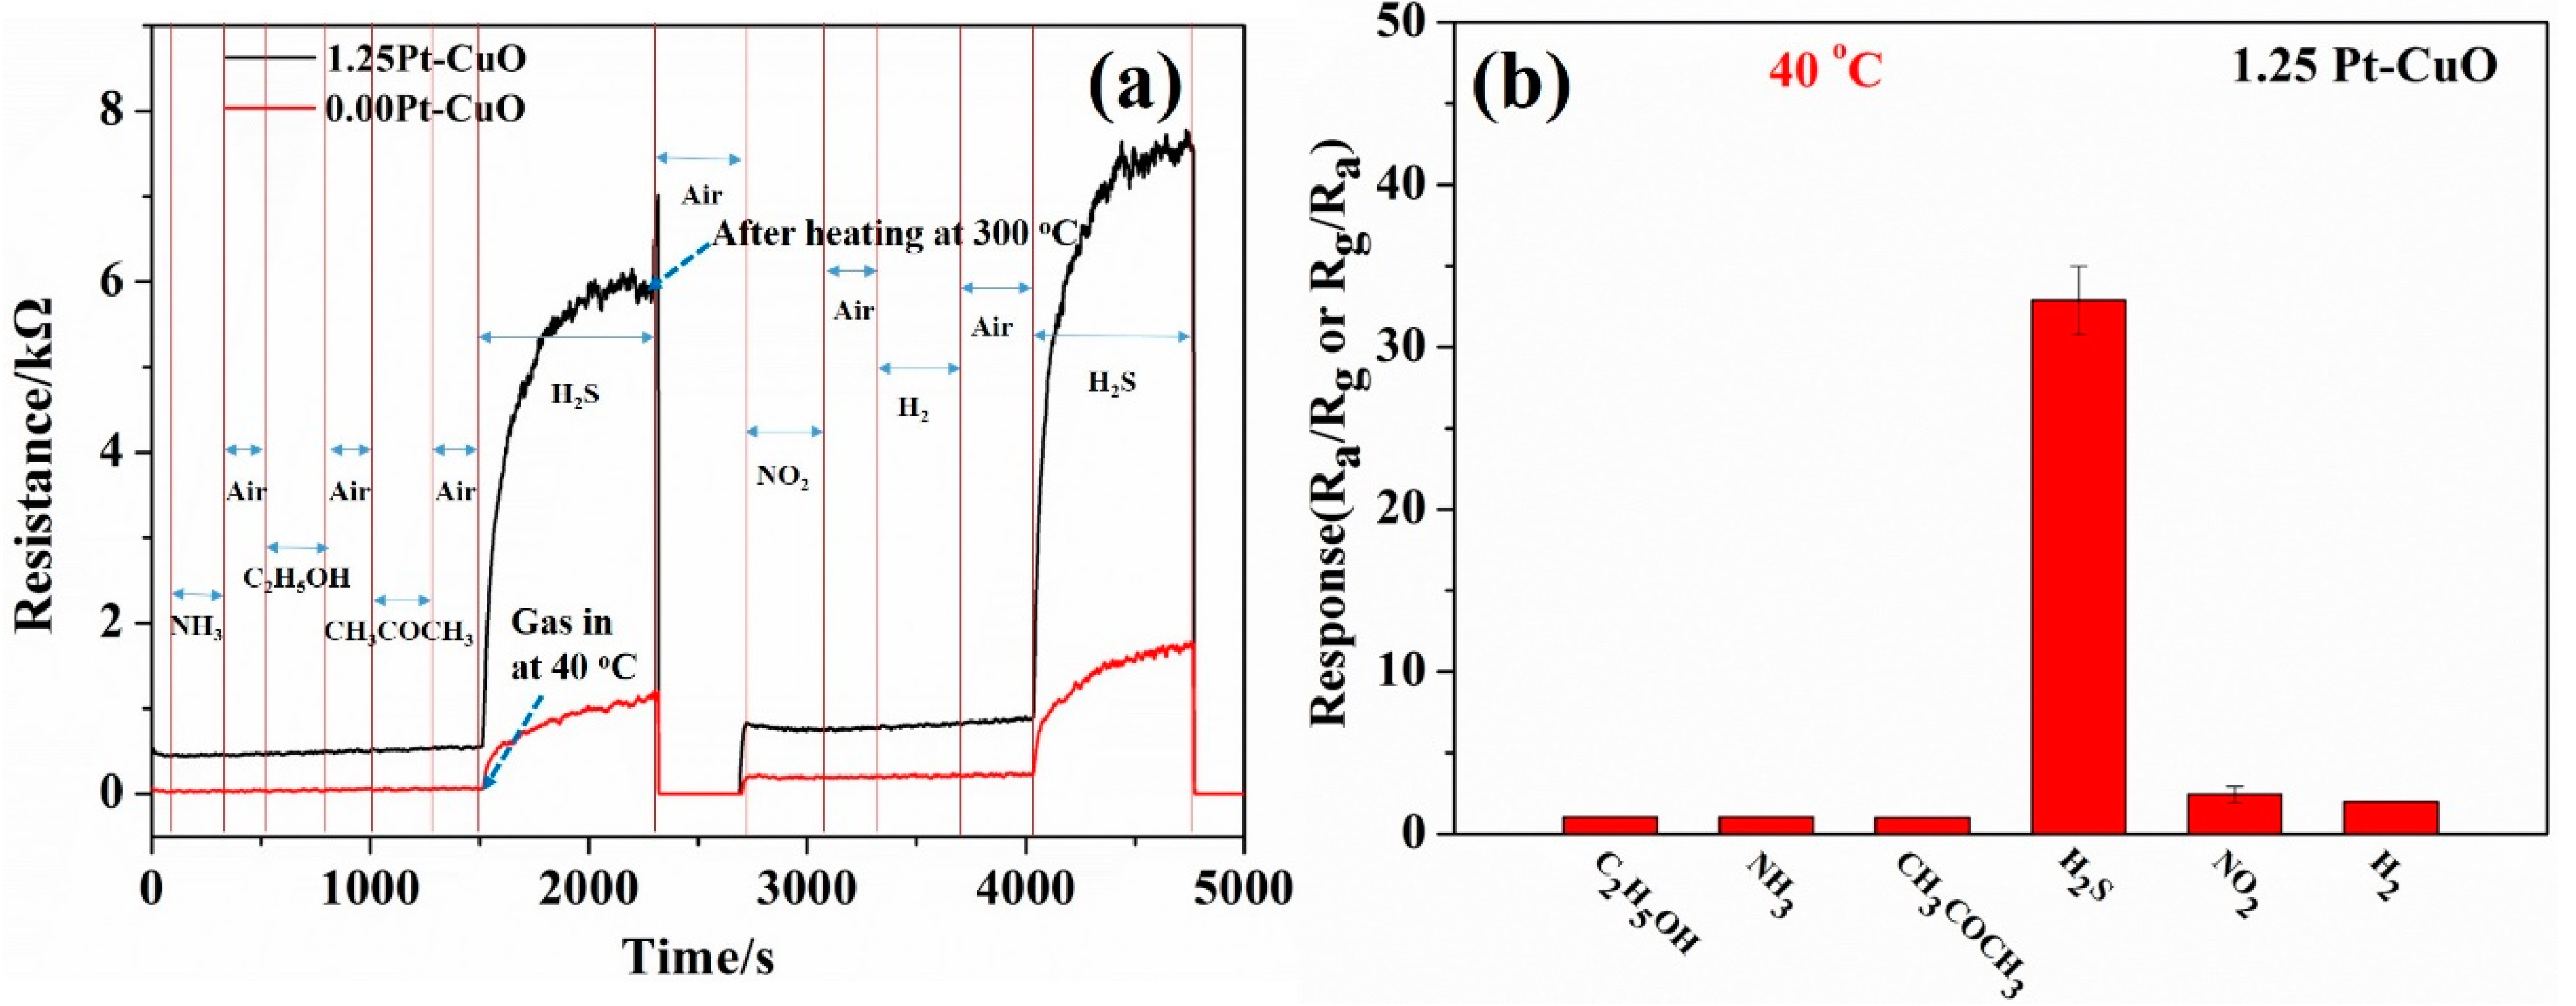
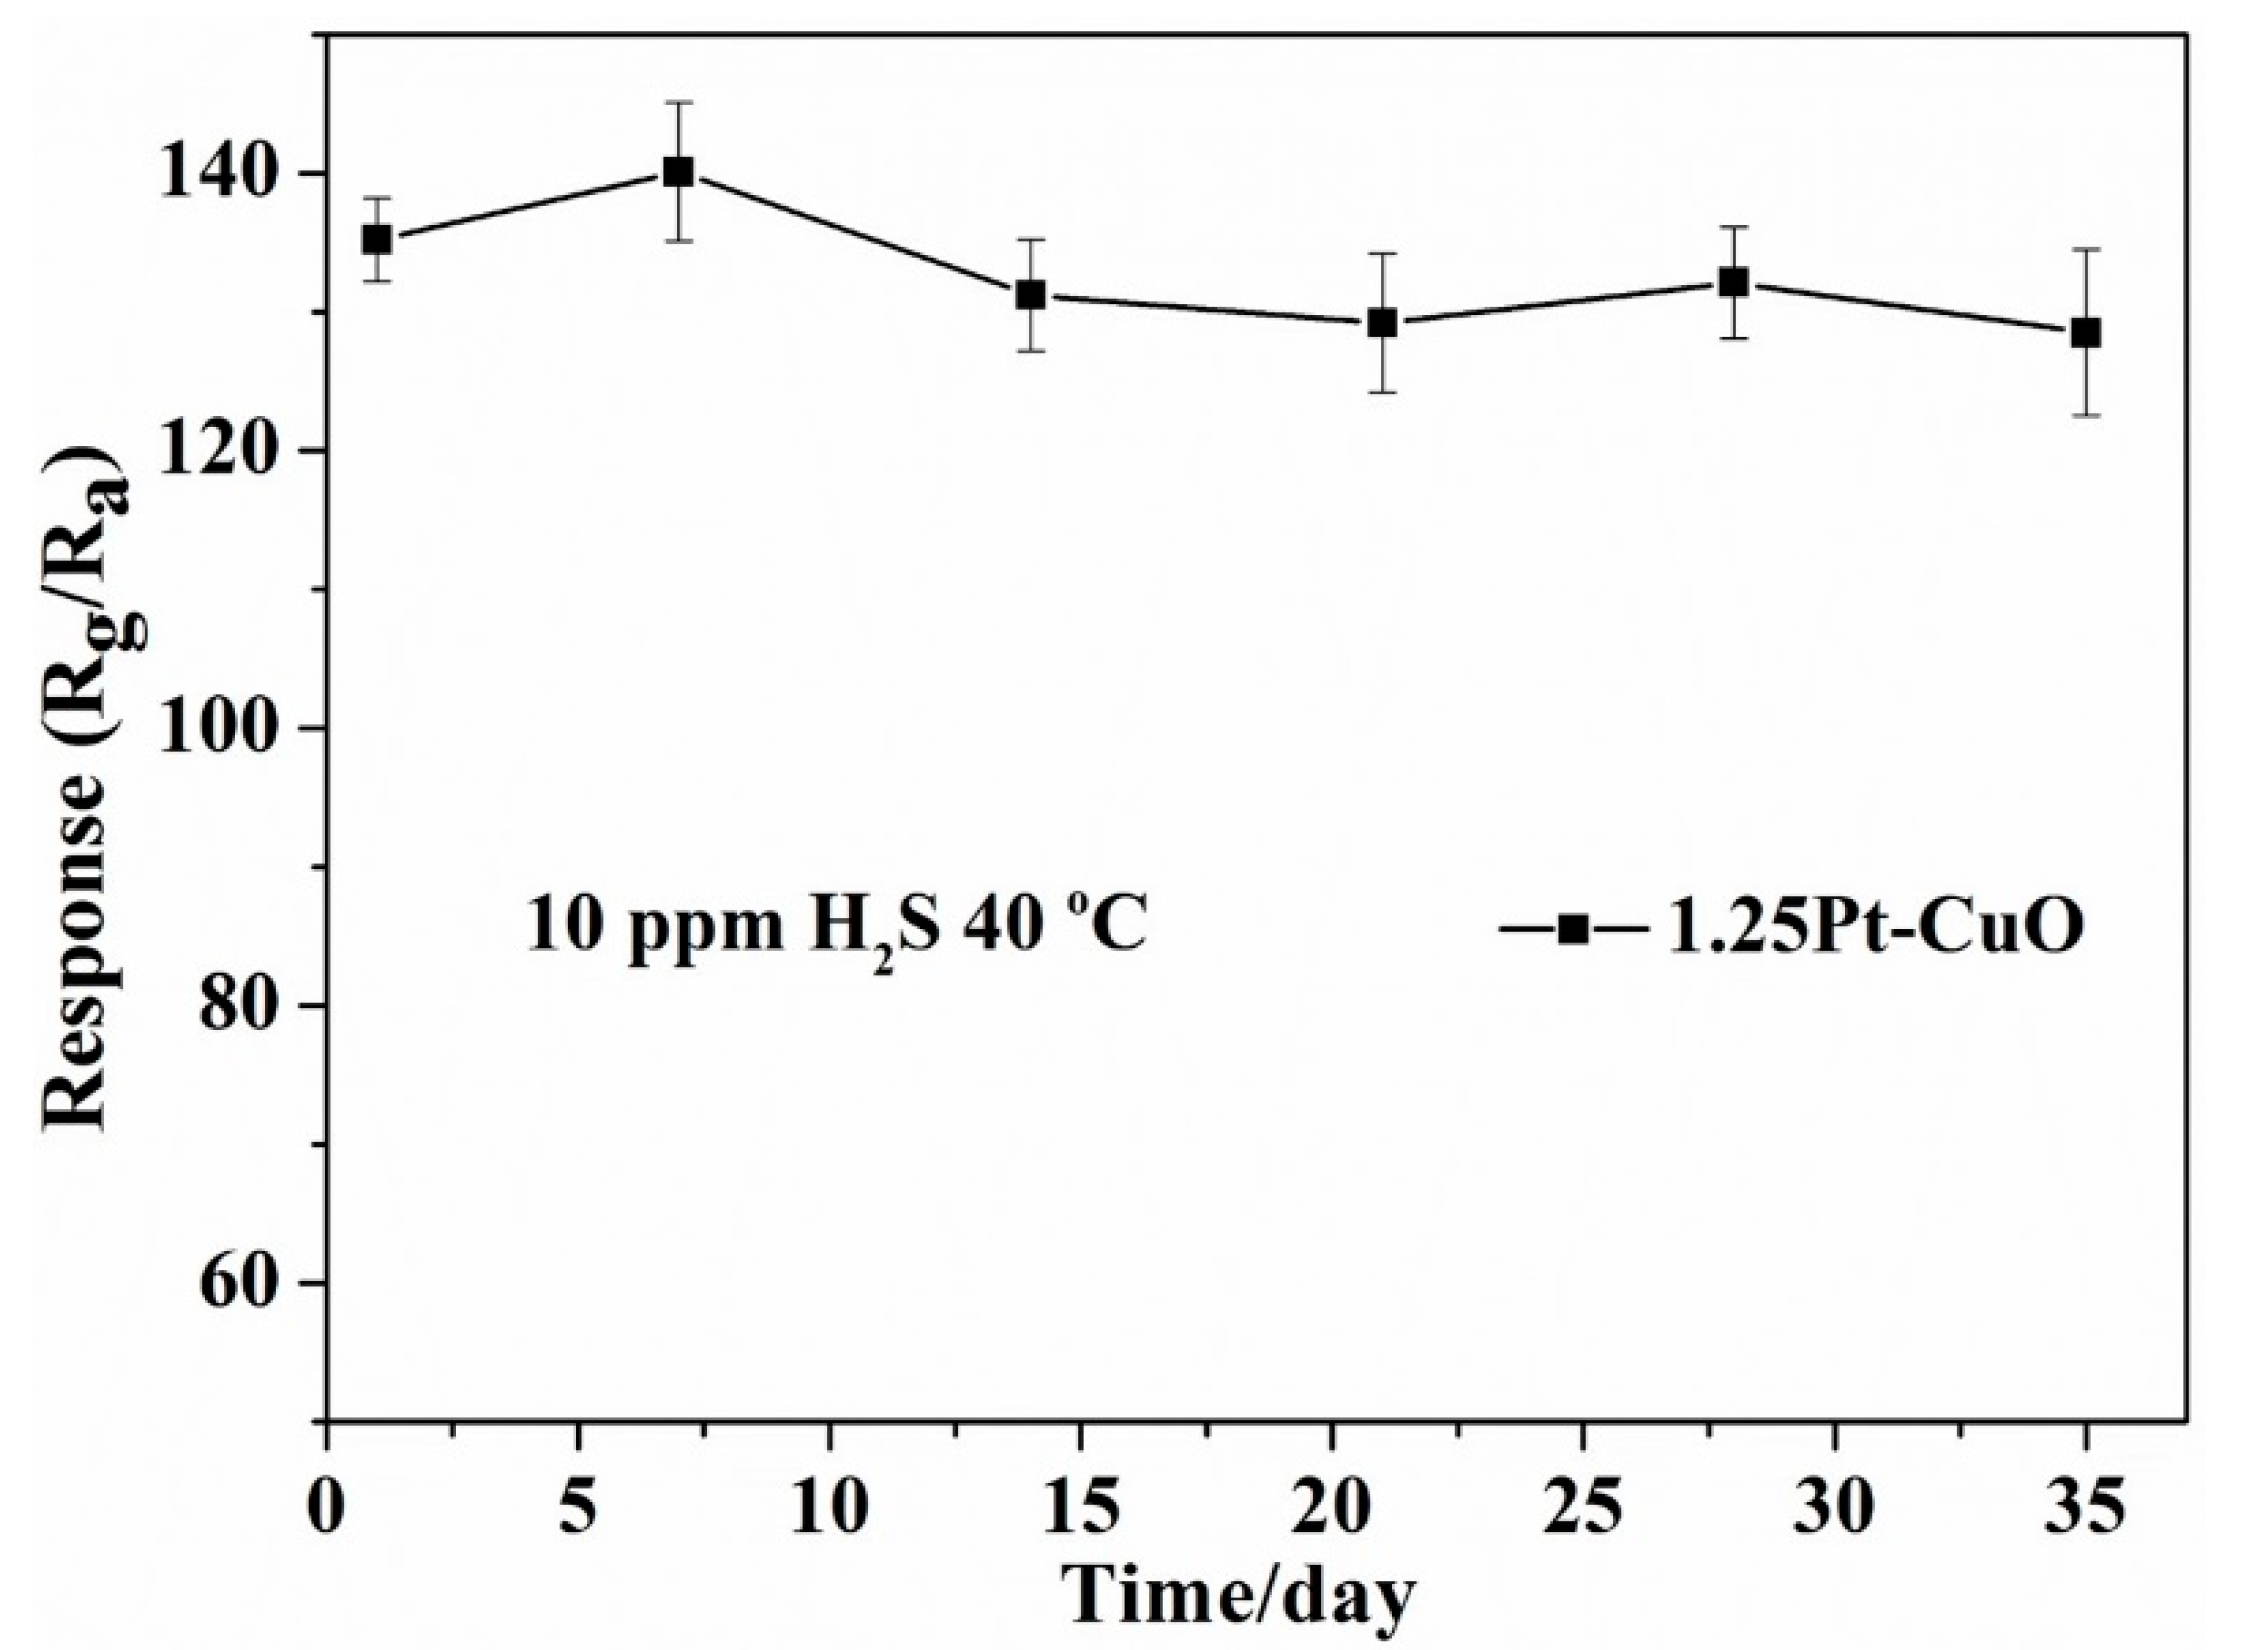
3.2. Gas Sensing Characteristics

To investigate the optimum operating temperature and additive amount of the Pt-doped CuO based sensor for H2S, we examined the responses of the four sensors to 10 ppm H2S gas from room temperature to 260 °C. Figure 7a illustrates that the response of all the doped sensors increased once the operating temperature changed from room temperatures to 40 °C, while the undoped sensor has its maximum response at 70 °C. Furthermore, all the Pt-doped sensors exhibit a much higher response than the pristine one. The 1.25Pt-CuO sensor showed the highest response of 135.1 to 10 ppm of H2S gas at 40 °C, which was 13.1 times higher than that of the pure CuO sensor (Rg/Ra = 10.3) at the same temperature. At a high operating temperature (above 240 °C), the pure CuO and all Pt-doped sensors showed a small response (1.6–2.7). Therefore, the optimized doping concentration is 1.25 wt % Pt for CuO and the operating temperature is 40 °C. Figure 7b shows the dynamic response curves of the gas sensors, based on the pure CuO and Pt-doped CuO to 10 ppm H2S at 40 °C. It proves that the 1.25Pt-CuO gas sensor has the highest response. However, it is noteworthy that neither the pure CuO sensor nor Pt-doped CuO sensor could be completely recovered to the baseline.
Figure 8 shows the sensing behavior of the sensor, based on 1.25 wt % Pt-doped CuO towards 10 ppm H2S gas at 40 °C. As it is shown in Figure 8a, the resistance of the 1.25Pt-CuO sensor is 0.1 kΩ when exposed to air. After the sensor was exposed to H2S gas, the response resistance increases to 13.51 kΩ, thus the response of the 1.25Pt-CuO sensor to 10 ppm H2S is as high as 135.1 (Rg/Ra). Although the Pt-doped CuO sensors were highly sensitive to detect H2S gas, the extremely long recovery time was the bottleneck for real practice. Figure 8b shows the dynamic response–recovery curves of the sensor; it took 37 s to reach 90% of the resistance variation. Figure 8b also shows that it took more than 3000 s to recover about 5% of the maximum value after removal of the H2S. In fact, the response could not be completely recovered to the baseline, and it is the common issue for gas sensors operating at a low temperature. According to Chaturvedi et al. [37] because of molecular affinity, Cu and S could easily form a helical bond at a low operating temperature. Therefore, H2S could be present in the form of molecular adsorption on the surface, and the adsorption is intermediate between physisorption and chemisorption.
In this work, we proposed a solution to solve the problem that the gas sensors could not be completely recovered at a low operating temperature. The principle of this scheme is based on the Joule heating effect, which accelerates the detachment of the H2S molecules from the CuO surface by applying a short electric current pulse. As shown in Figure 9a, Vc is the test voltage; Rl is a load resistor, and the voltage drop on Rl is denoted as Vout; Vh is the heating voltage applied on the the heating wire; and Vm is the 4.6 V electric current pulse. Figure 9b shows the dynamic response curves of the 1.25Pt-CuO sensor to 1 ppm H2S gas at 40 °C. Once the H2S was removed and the sensor was exposed to air, the response could not be recovered to its original baseline. After applying a 4.6 V (the temperature was 300 °C) voltage pulse, the 1.25Pt-CuO sensor returned to its original state within 15 s. Reproducibility is an important indicator to evaluate the performance of the sensor. Figure 9b also shows the dynamic response curves of the 1.25Pt-CuO sensor to 10 ppm H2S gas. In the five-cycle continuous test process, the sensors based on the Pt-doped CuO exhibit good stability, and their gas-sensing performance, such as sensitivity, and response/recovery speed did not show obvious resistance attenuation. In addition, such a ‘recovery heating’ process had tiny effect on the response of the sensor, which made the gas sensor highly reusable. Therefore, by applying a short electric current pulse, we have developed high performance H2S gas sensors based on the Pt-doped CuO with a low operating temperature.
Selectivity is one of the key parameters of the gas sensors. To explore the selectivity of the sensors, the dynamic response curves of the 1.25Pt-CuO based sensor to 1 ppm H2S and 50 ppm of other gases were measured at 40 °C. The results are shown in Figure 10a. Compared with the responses to H2S gas, the responses to other reducing gases were negligible. Figure 10b shows the responses of the 1.25Pt-CuO sensor to various gas samples, including 50 ppm C2H5OH, NH3, CH3COCH3, NO2, Cl2, H2, NO, and 1 ppmH2S, operated at 40 °C. The sensitivity of such sensors are 32.9 and 2.4 to 1 ppm H2S and 50 ppm NO2, respectively, while the responses to other gases ranged between 1.1 and 1.2. Therefore, 1.25 wt % Pt doping led to highest selectivity and sensitivity for the detection of H2S at low operating temperature (i.e., 40 °C).
Figure 11a displays the dynamic response–recovery transient of the sensor based on 1.25Pt-CuO, under the H2S concentration ranging from 0.1 to 25 ppm, at the operating temperature of 40 °C. It is apparent that as the concentration of the H2S gas increases, the response curve also displays a stepwise distribution. Figure 11b shows the response of the gas sensor to different concentrations of H2S gas. It can be observed that the gas response increased as the concentration increased. Even when the H2S concentration is as low as 300 ppb, the response of the sensor is still 3.2. According to the value of response (Rg/Ra > 2), as the standard for a valid response [38], it can be said that the gas sensor based on 1.25Pt-CuO has a detection limit of H2S gas as low as 300 ppb. Figure 12 illustrates the long-term stability of the gas sensor based on 1.25Pt-CuO. The results reveal that the response of the sensor changes by less than 10%, indicating that our sensor is stable and reliable.

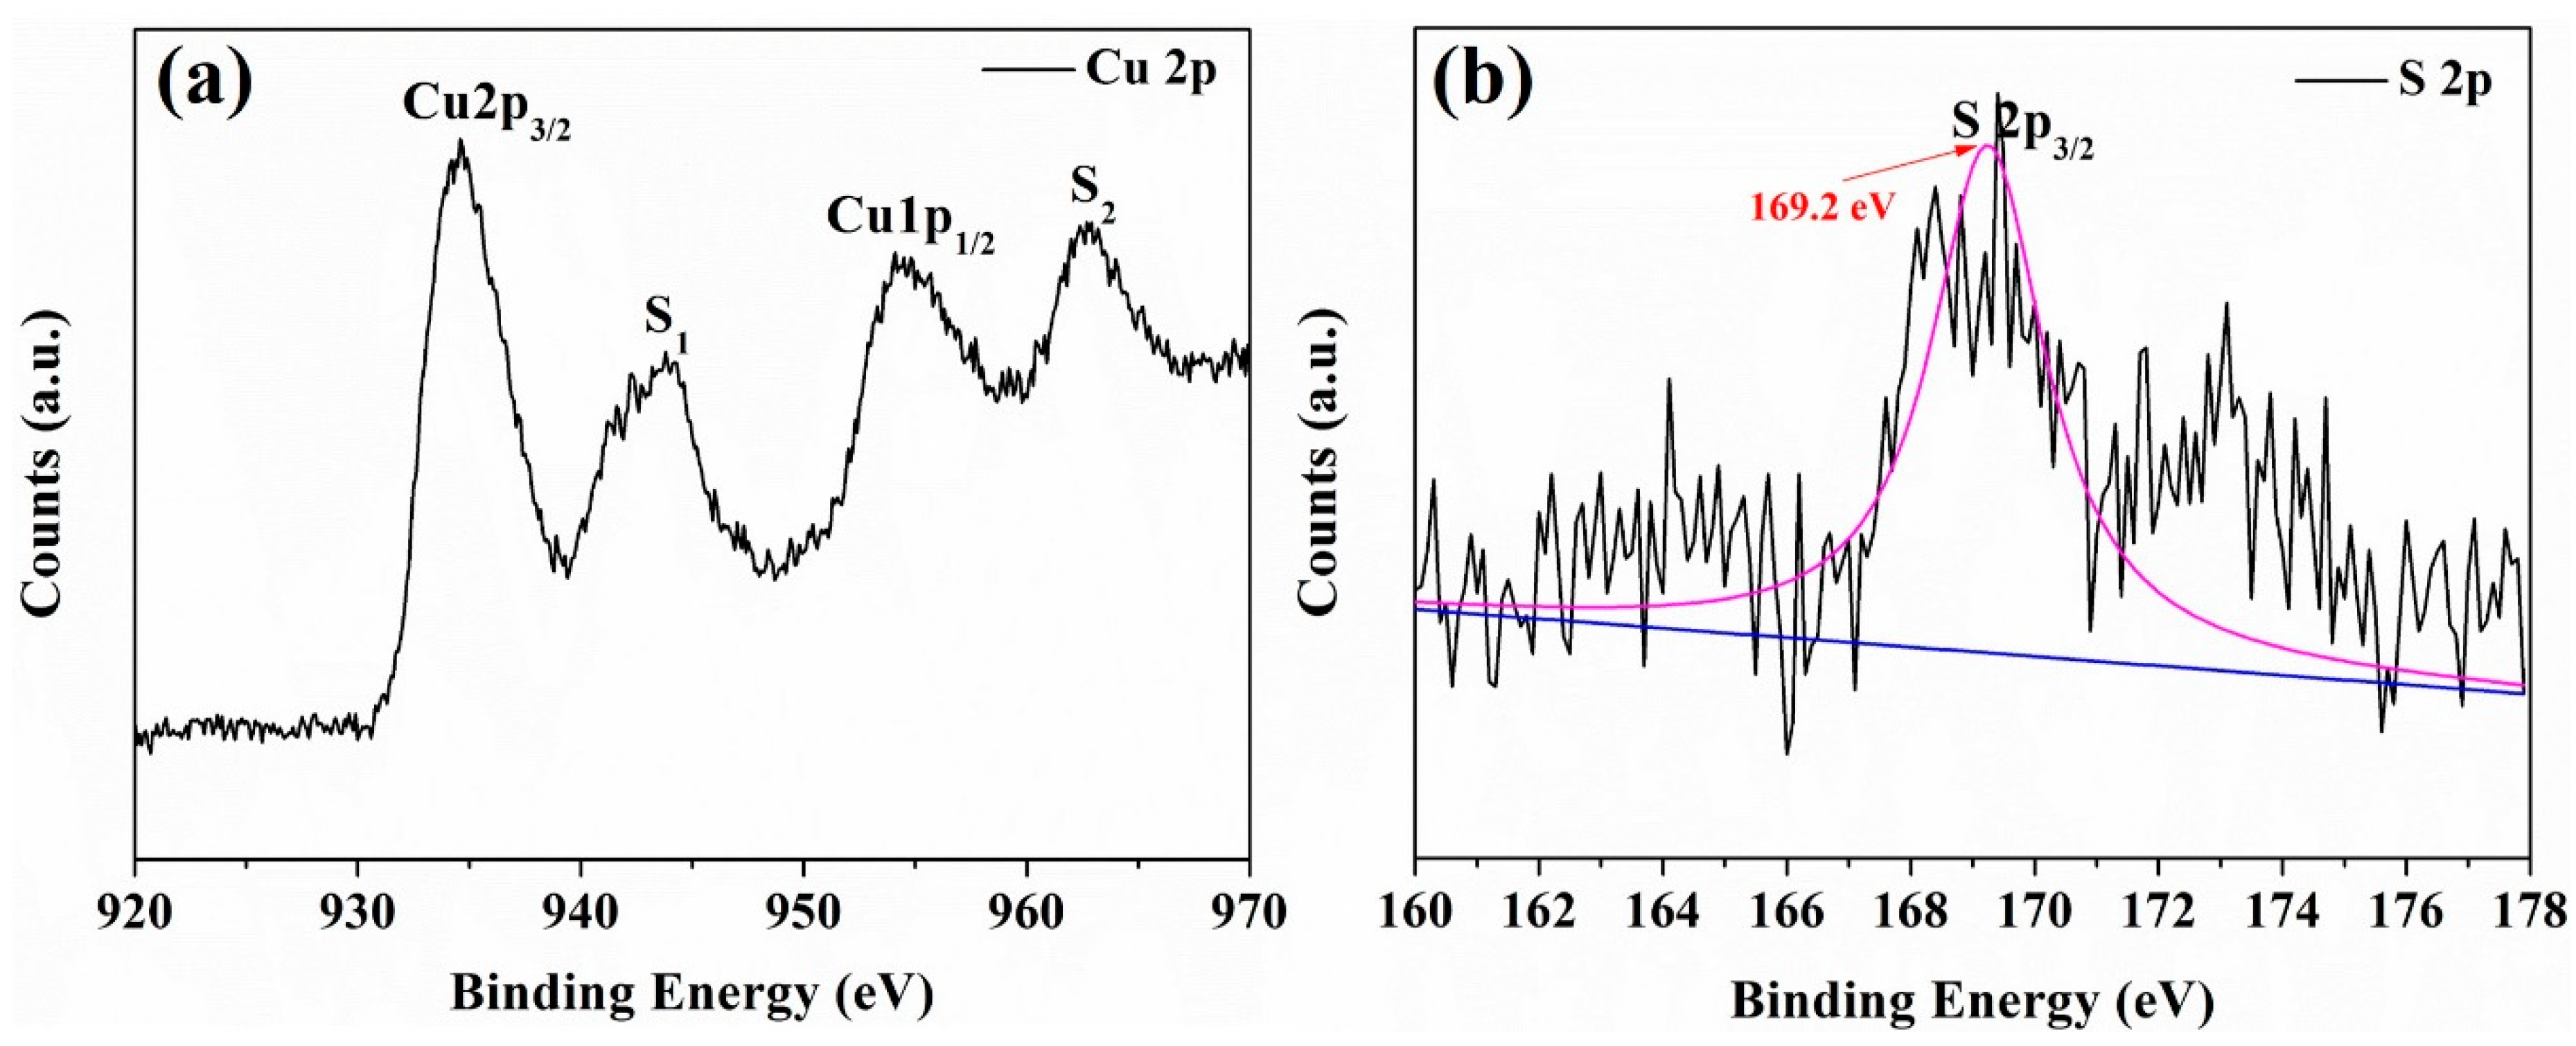
3.3. The Sensing Mechanism

The gas-sensing mechanism of the p-type semiconducting oxides has been previously reported, and it can be summarized as follows: Adsorption/desorption of gas molecules on the surface of semiconductors and reactions cause the change of resistance [11,24]. When the p-type CuO semiconductor is in contact with air, oxygen molecules are adsorbed on the surface of CuO and are ionized by electrons from the valence band, thereby generating negatively charged chemisorbed oxygen species (O2−, O, and O2), the processes are shown in Equations (1)–(4). The types of absorbed oxygen species depend on the operating temperature. Oxygen is absorbed on the surface as O2 ions below 147 °C or as O ions between 147–397 °C. Above 397 °C, O2− ions occur [39]. According to the above conclusions, the major oxygen adsorption species on the surface of CuO is O2 when the operating temperature is 40 °C.
O2 (gas) → O2 (ads)
O2 (ads) + e → O2 (ads) (<147 °C)
O2 (ads) + e → 2O (ads) (147 °C–397 °C)
O (ads) + e → O2− (ads) (>397 °C)
Once the sensor is exposed to an H2S (reducing gas) atmosphere operating at 40 °C, the H2S molecules are oxidized by O2− to form SO2 and H2O, while releasing electrons [40], and the sensing reaction is as shown in Equation (5).
H2S (g) + 3O2 (ads) → H2O (g) + SO2 (g) + 6e
The released electrons during this process will recombine with the holes on the surface of CuO and cause the decrease of hole concentration, which will lead to an increased resistance of the gas sensor. According to some previous reports [41,42], a CuS layer might form on the surface of the CuO, when the sensor is exposed to high H2S concentrations, the spontaneous chemical reaction is as shown in Equation (6), as follows:
CuO (s) + H2S (g) → CuS (s) + H2O (g)
In order to confirm the formation of CuS, we have carried out XPS studies on a 10 ppm H2S exposed 1.25Pt-CuO sensor. The recorded Cu 2p and S 2p spectra are shown in Figure 13. When the sensor was exposed to H2S gas, the Cu 2p spectrum confirmed the presence of CuO and CuS, and the corresponding peak of 169.2 eV in the S 2p spectrum also confirmed the presence of CuS [11].
Once H2S is removed by introducing air, the CuS is unstable, and is able to be slowly oxidized by oxygen in the air, as shown in Equation (7). As a result, recovery of the resistance will occur.
CuS (s) + O2 (g) → 2CuO (s) + 2S (s)
The influence of Pt dopant on the gas sensing properties of the sensor can be attributed to the spillover effect [43]. Various chemisorbed oxygen species and gas molecules were able to spill over onto the surface CuO support, as the O2 and H2S gas molecules are absorbed in the abundant sites provided by the Pt dopant. Thus, it is reasonable to believe that the better gas sensing properties of the Pt-doped CuO is mainly caused by the ability of the Pt dopant to accelerate the electron exchange between the test gas and the sensor, rather than being directly involved in the reaction. On the other hand, compared with pure CuO, 1.25Pt-doped CuO nanoflowers have a larger BET surface area, which can provide more adsorption sites for gas adsorption. However, as the doping concentration increased to 1.50 wt %, a constipation disorder occurs and the surface density increases, resulting in Fermi level changes and the decrease of sensor response [44]. In summary, the doping of Pt is the main reason for the enhanced performance of CuO-based sensors.

4. Conclusions

H2S sensors based on Pt-doped CuO nano-flowers were developed. The pristine and Pt-doped CuO nano-flowers were fabricated by a simple heating route using a water bath, and their gas-sensing performances toward H2S were thoroughly investigated. The Pt-doped CuO sensor exhibited a significant improvement in its H2S performance compared with the sensors based on pristine CuO. The enhanced sensing performances of Pt doped CuO would be most likely ascribed to the spillover effect. At an operating temperature of 40 °C, the optimized Pt-doped CuO sensor yielded a response of 135.1 and 32.9 upon exposure to H2S gas of 10 and 1 ppm, respectively. To solve the issue of a long recovery time at a low operating temperature, a 4.6 V (300 °C) heater voltage pulse was selected, and the recovery time could be shortened to 15 s.

Author Contributions

Q.T. and X.-B.H. carried out the experiment and draft the manuscript, M.H. and L.-L.X. carried out gas sensor test, Z.-G.Z. and J.-Q.W. are the corresponding author for the whole work.

Funding

This work was supported by the National Natural Science Foundation of China (No. 61471233), the Program for Professor of Special Appointment (Eastern Scholar) at SIHL, Shuguang Project by Shanghai Municipal Education Commission (No. 14SG52).

Conflicts of Interest

The authors declare no conflict of interest.

References

  1. Hendrickson, R.G.; Chang, A.; Hamilton, R. Co-worker fatalities from hydrogen sulfide. Am. J. Ind. Med. 2004, 45, 346–350. [Google Scholar] [CrossRef] [PubMed]
  2. Guo, Y.N.; Gong, M.M.; Li, Y.S.; Liu, Y.L.; Dou, X.C. Sensitive, selective, and fast detection of ppb-level H2S gas boosted by ZnO-CuO mesocrystal. Nanoscale Res. Lett. 2016, 475, 1–9. [Google Scholar] [CrossRef] [PubMed]
  3. Hu, X.B.; Zhu, Z.G.; Chen, C.; Wen, T.Y.; Zhao, X.L.; Xie, L.L. Highly sensitive H2S gas sensors based on Pd-doped CuO nanoflowers with low operating temperature. Sens. Actuators B Chem. 2017, 253, 809–817. [Google Scholar] [CrossRef]
  4. Nagarajan, V.; Chandiramouli, R. DFT studies on interaction of H2S gas with α-Fe2O3 nanostructures. J. Inorg. Organomet. Polym. Mater. 2016, 26, 394–404. [Google Scholar] [CrossRef]
  5. Li, W.H.; Sun, W.; Xu, X.Q.; Du, L.P.; Li, M.Y. Coumarin-based fluorescent probes for H2S detection. J. Fluoresc. 2013, 23, 181–186. [Google Scholar] [CrossRef] [PubMed]
  6. Zhang, Y.Y.; Zhang, H.; Wu, P.; Zhang, H.R.; Xu, J.J.; Chen, H.Y. In situ activation of CdS electrochemiluminescene film and its application in H2S detection. Anal. Chem. 2014, 86, 8657–8664. [Google Scholar] [CrossRef] [PubMed]
  7. Henthorn, H.A.; Pluth, M.D. Mechanistic insights into the H2S-mediated reduction of aryl azides commonly used in H2S detection. J. Am. Chem. Soc. 2015, 135, 15330–15336. [Google Scholar] [CrossRef] [PubMed]
  8. Franke, M.E.; Koplin, T.J.; Simon, U. Metal and metal oxide nanoparticles in chemiresistors: Does the nanoscale matter? Small 2006, 2, 36–50. [Google Scholar] [CrossRef] [PubMed]
  9. Tricoli, A.; Righettoni, M.; Teleki, A. Semiconductor gas sensors: Dry synthesis and application. Angew. Chem. Int. Ed. 2010, 49, 7632–7659. [Google Scholar] [CrossRef] [PubMed]
  10. Oosthuizen, D.N.; Motaung, D.E.; Swart, H.C. In depth study on the notable room-temperature NO2 gas sensor based on CuO nanoplatelets prepared by sonochemical method: Comparison of various bases. Sens. Actuators B Chem. 2018, 266, 761–772. [Google Scholar] [CrossRef]
  11. Ramgir, N.S.; Ganapathi, S.K.; Kaur, M.; Datta, N.; Muthe, K.P.; Aswal, D.K.; Gupta, S.K.; Yakhmi, J.V. Sub-ppm H2S sensing at room temperature using CuO thin films. Sens. Actuators B Chem. 2010, 151, 90–96. [Google Scholar] [CrossRef]
  12. Xu, J.Q.; Wang, X.H.; Shen, J.N. Hydrothermal synthesis of In2O3 for detecting H2S in air. Sens. Actuators B Chem. 2006, 115, 642–646. [Google Scholar] [CrossRef]
  13. Wang, C.H.; Chu, X.F.; Wu, M.M. Detection of H2S down to ppb levels at room temperature using sensors based on ZnO nanorods. Sens. Actuators B Chem. 2006, 113, 320–323. [Google Scholar] [CrossRef]
  14. Song, Z.L.; Wei, Z.; Wang, B.C.; Luo, Z.; Xu, S.M.; Zhang, W.K.; Yu, H.X.; Li, M.; Huang, Z.; Zang, J.F.; et al. Sensitive room-temperature H2S gas sensors employing SnO2 quantum wire/reduced graphene oxide nanocomposites. Chem. Mater. 2016, 28, 1205–1212. [Google Scholar] [CrossRef]
  15. Zhang, Y.; Xiang, Q.; Xu, J.Q.; Xu, P.C.; Pan, Q.Y.; Li, F. Self-assemblies of Pd nanoparticles on the surface of single crystal ZnO nanowires for chemical sensors with enhanced performances. J. Mater. Chem. 2009, 27, 4701–4706. [Google Scholar] [CrossRef]
  16. Tao, W.H.; Tsai, C.H. H2S sensing properties of noble metal doped WO3 thin film sensor fabricated by micromachining. Sens. Actuators B Chem. 2002, 81, 237–247. [Google Scholar] [CrossRef]
  17. Demel, J.; Zhigunov, A.; Jirka, I.; Klementova, M.; Lang, K. Facile synthesis of CuO nanosheets via the controlled delamination of layered copper hydroxide acetate. J. Colloid Interface Sci. 2015, 452, 174–179. [Google Scholar] [CrossRef] [PubMed]
  18. Mai, Y.J.; Wang, X.L.; Xiang, J.Y.; Qiao, Y.Q.; Zhang, D.; Gu, J.P.; Tu, J.P. CuO/graphene composite as anode materials for lithium-ion batteries. Electrochim. Acta 2011, 56, 2306–2311. [Google Scholar] [CrossRef]
  19. Wang, G.L.; Huang, J.C.; Chen, S.L.; Gao, Y.Y.; Cao, D.X. Preparation and supercapacitance of CuO nanosheet arrays grown on nickel foam. J. Power Sources 2011, 196, 5756–5760. [Google Scholar] [CrossRef]
  20. Nezamzadeh, E.A.; Hushmandrad, S. Solar photodecolorization of methylene blue by CuO/X zeolite as a heterogeneous catalyst. Appl. Catal. A Gen. 2010, 388, 149–159. [Google Scholar] [CrossRef]
  21. Capone, S.; Forleo, A.; Francioso, L.; Rella, R.; Siciliano, P.; Spadavecchia, J.; Presicce, D.S.; Taurino, A.M. Solid state gas sensors: State of the art and future activities. J. Optoelectron. Adv. Mater. 2003, 5, 1335–1348. [Google Scholar] [CrossRef]
  22. Kim, K.M.; Jeong, H.M.; Kim, H.R.; Choi, K.I.; Kim, H.J.; Lee, J.H. Selective detection of NO2 using Cr-doped CuO nanorods. Sensors 2012, 12, 8013–8025. [Google Scholar] [CrossRef] [PubMed]
  23. Kim, H.; Jin, C.; Park, S.; Kim, S.; Lee, C.M. H2S gas sensing properties of bare and Pd-functionalized CuO nanorods. Sens. Actuators B Chem. 2012, 161, 594–599. [Google Scholar] [CrossRef]
  24. Liu, S.; Yu, B.; Zhang, H.; Fei, T.; Zhang, T. Enhancing NO2 gas sensing performances at room temperature based on reduced graphene oxide-ZnO nanoparticles hybrids. Sens. Actuators B Chem. 2014, 202, 272–278. [Google Scholar] [CrossRef]
  25. Ivanov, P.; Llobet, E.; Vilanova, X.; Brezmes, J.; Hubalek, J.; Correig, X. Development of high sensitivity ethanol gas sensors based on Pt-doped SnO2 surface. Sens. Actuators B Chem. 2004, 99, 201–206. [Google Scholar] [CrossRef]
  26. Wang, Y.; Wang, S.R.; Zhao, Y.Q.; Zhu, B.L.; Kong, F.H.; Wang, D.; Wu, S.H. H2S sensing characteristics of Pt-doped α-Fe2O3 thick film sensors. Sens. Actuators B Chem. 2007, 125, 79–84. [Google Scholar] [CrossRef]
  27. Miller, D.; Akbar, S.; Morris, P. Nanoscale metal oxide-based heterojunctions for gas sensing: A review. Sens. Actuators B Chem. 2014, 204, 250–272. [Google Scholar] [CrossRef]
  28. Kayestha, R.; Sumati; Hajela, K. ESR studies on the effect of ionic radii on displacement of Mn2+ bound to a soluble β-galactoside binding hepatic lectin. FEBS Lett. 1995, 368, 285–288. [Google Scholar] [CrossRef]
  29. Sheppard, L.R.; Lamo, M.B.; Holik, J.; Mayfield, K.J.; Nelson, D.R. Solute diffusion of platinum in rutile titanium dioxide. J. Am. Ceram. Soc. 2013, 96, 407–411. [Google Scholar] [CrossRef]
  30. Wang, D.G.; Wang, Y.Q.; Jiang, T.T.; Jia, H.X.; Yu, M.H. The preparation of M (M: Mn2+, Cd2+, Zn2+)-doped CuO nanostructures via the hydrothermal method and their properties. J. Mater. Sci. Mater. Electron. 2016, 27, 2138–2145. [Google Scholar] [CrossRef]
  31. Petr, V.; Václav, Š.; Jirˇí, H.; Martin, K. Shape-controlled synthesis of Sn-doped CuO nanoparticles for catalytic degradation of Rhodamine B. J. Colloid Interface Sci. 2016, 481, 28–38. [Google Scholar]
  32. Zhang, Y.W.; Si, R.; Liao, C.S.; Yan, C.H. Facile alcohothermal synthesis, size-dependent ultraviolet absorption, and enhanced CO conversion activity of ceria nanocrystals. J. Phys. Chem. B 2003, 107, 10159–10167. [Google Scholar] [CrossRef]
  33. Hu, X.B.; Zhu, Z.G.; Li, Z.H.; Xie, L.L.; Wu, Y.H.; Zheng, L.Y. Heterostructure of CuO microspheres modified with CuFe2O4 nanoparticles for highly sensitive H2S gas sensor. Sens. Actuators B Chem. 2018, 264, 139–149. [Google Scholar] [CrossRef]
  34. Liu, L.Q.; Zhou, F.; Wang, L.G.; Qi, X.J.; Shi, F.; Deng, Y.Q. Low-temperature CO oxidation over supported Pt, Pd catalysts: Particular role of FeOx support for oxygen supply during reactions. J. Catal. 2010, 274, 1–10. [Google Scholar] [CrossRef]
  35. Wang, S.R.; Zhang, J.X.; Yang, J.D.; Gao, X.L.; Zhang, H.X.; Wang, Y.S.; Zhu, Z.Y. Spinel ZnFe2O4 nanoparticle-decorated rod-like ZnO nanoheterostructures for enhanced gas sensing performances. RSC Adv. 2015, 5, 10048–10057. [Google Scholar] [CrossRef]
  36. Hu, D.; Han, B.Q.; Deng, S.J.; Feng, Z.P.; Wang, Y.; Popovic, J.; Nuskol, M.; Wang, Y.; Djerdj, I. Novel mixed phase SnO2 nanorods assembled with SnO2 nanocrystals for enhancing gas-sensing performance toward isopropanol gas. J. Phys. Chem. C 2014, 118, 9832–9840. [Google Scholar] [CrossRef]
  37. Chaturvedi, S.; Rodriguez, J.A.; Hrbek, J. Reaction of S2 with ZnO and Cu/ZnO surfaces: Photoemission and molecular orbital studies. J. Phys. Chem. B 1997, 101, 10860–10869. [Google Scholar] [CrossRef]
  38. Cho, Y.H.; Liang, X.; Kang, Y.C.; Lee, J.H. Ultrasensitive detection of trimethylamine using Rh-doped SnO2 hollow spheres prepared by ultrasonic spray pyrolysis. Sens. Actuators B Chem. 2015, 207, 330–337. [Google Scholar] [CrossRef]
  39. Sun, Y.F.; Liu, S.B.; Meng, F.L.; Liu, J.Y.; Jin, Z.; Kong, L.T.; Liu, J.H. Metal oxide nanostructures and their gas sensing properties: A Review. Sensors 2012, 1, 36–50. [Google Scholar] [CrossRef] [PubMed]
  40. Liu, X.H.; Zhang, J.; Kang, Y.F.; Wu, S.H.; Wang, S.R. Brochantite tabular microspindles and their conversion to wormlike CuO structures for gas sensing. CrystEngComm 2012, 14, 620–625. [Google Scholar] [CrossRef]
  41. Park, S.; Kim, S.; Kheel, H.; Hyun, S.K.; Jin, C.; Lee, C. Enhanced H2S gas sensing perfoemane of networked CuO-ZnO composite nanoparticle sensor. Mater. Res. Bull. 2016, 82, 130–135. [Google Scholar] [CrossRef]
  42. Sonia, S.; Kumar, P.S.; Jayram, N.D.; Masuda, Y.; Manqalaraj, D.; Lee, C. Superhydrophobic and H2S gas sensing properties of CuO nanostructured thin films through a successive ionic layered adsorption reaction process. RSC Adv. 2016, 6, 24290–24298. [Google Scholar] [CrossRef]
  43. Kappler, J.; Barsan, N.; Weimar, U.; Dieguez, A.; Alay, J.L.; Rodriguez, A.R.; Morante, J.R.; Gopel, W. Correlation between XPS, Raman and TEM measurements and the gas sensitivity of Pt and Pd doped SnO2 based gas sensors. Fresenius’ J. Anal. Chem. 1998, 361, 110–114. [Google Scholar] [CrossRef]
  44. Korotcenkov, G.; Boris, I.; Brinzari, V.; Han, S.H.; Cho, B.K. The role of doping effect on the response of SnO2-based thin film gas sensors: Analysis based on the results obtained for Co-doped SnO2 films deposited by spray pyrolysis. Sens. Actuators B Chem. 2013, 182, 112–124. [Google Scholar] [CrossRef]
Figure 1. (a) Schematic illustration of the gas sensor and (b) photographs of the gas sensor.
Applsci 08 01091 g001
Figure 2. X-ray diffraction (XRD) pattern of the Pt-doped CuO specimens: (a) 0.00Pt-CuO, (b) 0.75Pt-CuO, (c) 1.25Pt-CuO, and (d) 1.50Pt-CuO.
Applsci 08 01091 g002
Figure 3. Field emission scanning electron microscope (FESEM)images of (a) 0.00Pt-CuO, (b) 0.75Pt-CuO, (c) 1.25Pt-CuO, and (d) 1.50Pt-CuO. The inset is the magnification of each image.
Applsci 08 01091 g003
Figure 4. Energy Dispersive X-Ray (EDX) element mapping of 1.25 wt % Pt-doped CuO structure, as follows: (a) 1.25Pt-CuO, (b) O, (c) Cu, and (d) Pt.
Applsci 08 01091 g004
Figure 5. (a) X-ray photoelectron spectroscopy (XPS) spectrum of the 1.25 wt % Pt-doped CuO; (bd) high-resolution spectra of Cu, Pt, and O peaks, respectively, (red line, blue line, purple line and green line are fitting curves).
Applsci 08 01091 g005
Figure 6. Typical N2 adsorption-desorption isotherms of different specimens, as follows: (a) 0.00Pt-CuO and (b) 1.25Pt-CuO.
Applsci 08 01091 g006
Figure 7. (a) Response of 0.00Pt-CuO, 0.75Pt-CuO, 1.25Pt-CuO, and 1.50Pt-CuO sensors to 10 ppm H2S as a function of operating temperature; (b) the corresponding sensing transients of 0.00Pt-CuO, 0.75Pt-CuO, 1.25Pt-CuO, and 1.50Pt-CuO sensors to 10 ppm H2S at 40 °C. The inset of (b) is the resistance variation of four sensors to 10 ppm H2S at 40 °C.
Applsci 08 01091 g007
Figure 8. (a) The resistance variation of the 1.25Pt-CuO sensor to 10 ppm H2S at 40 °C; (b) the corresponding sensing transients of the 1.25Pt-CuO sensor. The inset of (b) is the magnification of sensing transients between 300 s to 700 s.
Applsci 08 01091 g008
Figure 9. (a) Sensing diagram of the gas sensor with a 4.6 V electric modulation voltage; (b) the recovery cycles for 10 ppm H2S of the 1.25Pt-CuO sensor at 40 °C, followed by a 4.6 V electric modulation voltage.
Applsci 08 01091 g009
Figure 10. (a) Dynamic response curves of 1.25Pt-CuO and 0.00Pt-CuO based sensor to 1 ppm H2S and 50 ppm various interfering gases at 40 °C; (b) gas response (Ra/Rg or Rg/Ra) of 1.25Pt-CuO to 50 ppm different gases and 1 ppm H2S gas, operated at 40 °C.
Applsci 08 01091 g010
Figure 11. (a) Dynamic response transient of the gas sensor based on 1.25Pt-CuO and 1.00Pt-CuO to different concentrations of H2S gas at 40 °C; (b) gas response of 1.25Pt-CuO and 1.00Pt-CuO sensor to different concentrations of H2S at 40 °C.
Applsci 08 01091 g011
Figure 12. Long-term stability of 1.25Pt-CuO sensor to 10 ppm H2S at 40 °C.
Applsci 08 01091 g012
Figure 13. (a) Cu 2p and (b) S 2p XPS spectra recorded for 1.25 wt % Pt-doped CuO after exposure to 10 ppm H2S.
Applsci 08 01091 g013

