Review

Multi-Modal Ptychography: Recent Developments and Applications

1
Diamond Light Source Ltd., Harwell Science and Innovation Campus, Didcot, Oxfordshire OX11 0DE, UK
2
Advanced Light Source, Lawrence Berkeley National Laboratory, 1 Cyclotron Rd, Berkeley, CA 94720, USA
3
London Centre for Nanotechnology, University College London, London WC1H 0AH, UK
4
Department of Condensed Matter Physics and Materials Science, Brookhaven National Laboratory, Upton, NY 11973, USA
*
Author to whom correspondence should be addressed.
These authors contributed equally to this work.
Appl. Sci. 2018, 8(7), 1054; https://doi.org/10.3390/app8071054
Submission received: 7 April 2018 / Revised: 20 June 2018 / Accepted: 20 June 2018 / Published: 28 June 2018
(This article belongs to the Special Issue Applications of Digital Holographic Microscopy)

Abstract

:
Utilisation of partially coherent X-rays in Coherent X-ray Diffraction Imaging (CDI) and X-ray ptychography have brought intense research and developments for the past few years. Generally, data reconstructions convergence can be achieved by considering to incorporate partially coherent X-rays in ptychographic iterative reconstructions algorithms. Recently, exploration of both X-ray probe and sample modes have been studied and it was suggested that sufficient constraints are required to achieve accurate data reconstructions due to the mathematical inseparability of multiple sample modes that are superimposed into a single set of ptychographic intensity patterns. Here we review the multi-modal ptychography that can be used as a new emerging technique to investigate dynamical sample systems with partially coherent X-rays by recent experimental and simulated demonstrations.

1. Introduction

Significant progresses have been made during the past few years in applying coherent X-ray diffraction imaging (CDI) and X-ray ptychography in materials sciences and soft matter materials. To introduce X-ray ptychography [1,2,3,4] in short, the technique is the elegant amalgamation of scanning X-ray microscopy (STXM) with CDI, where partially overlapping illumination provides additional real-space constraint that expands the sample of interest to arbitrarily-defined region with high-resolution in both absorption and phase contrasts. In CDI, a modified algorithm that includes ab initio correction of transverse partial coherence in measured data by using Lucy-Richardson (RL) deconvolution method has been shown to give better data reconstructions [5,6]. Thibault and Menzel [7] recently demonstrated that the ptychographic method provides enough redundancy in datasets to allow high-quality reconstructions through complete recovery of X-ray illumination modes (and object’s states in the case of dynamical sample). This work also opened up the exciting possibilities of information multiplexing [8] and dynamical systems imaging [9] with ptychography. Following results by Thibault, Menzel et al. and Batey et al. [7,8], Li et al. [10] has recently demonstrated the feasibility of recovery of multiple sample modes by applying extra constraints into the iterative algorithms, and they discovered the inability of recovery of individual sample modes due to the mathematical equivalence in mixing the initial sample modes in multi-modal ptychography. Individual sample mode could be recovered when additional constraints on sample were applied [10]. To understand better this for dynamical sample modes, we have simulated ptychographic data with both X-ray beam and sample modes to mimic experimental data when partially coherent X-rays are used. Implementations of both sample modes and X-ray beam modes could enable relatively higher X-ray flux on dynamical samples. This approach ultimately reduces ptychographic data acquisition time to detect dynamical sample states with few-nanometer spatial resolution in a relatively short experimental time.
Figure 1 [9] shows experimental reconstructions of X-ray orthogonal illumination modes when partially coherent X-ray illumination was adopted with a vibrating sample. Multiple sample modes due to vibration are transferred to probe modes, resulting to partially coherent illumination.
Li et al. [10] recently successfully performed multi-modal experiments with visible lights on complex test objects with partially coherent illuminations with several orthogonal modes. Their results demonstrate the feasibility of inversion of complex wavefunctions of both object and illumination using multi-modal approach without a priori information to start with. This could be trivially extended to X-rays to enable dynamical studies on condensed matter materials by adopting this technique. Figure 2 illustrates experimental work demonstrated by Li et al. [10] by using visible lights to test reconstruction quality of measured data by applying multi-modal ptychography algorithms.

2. Theory

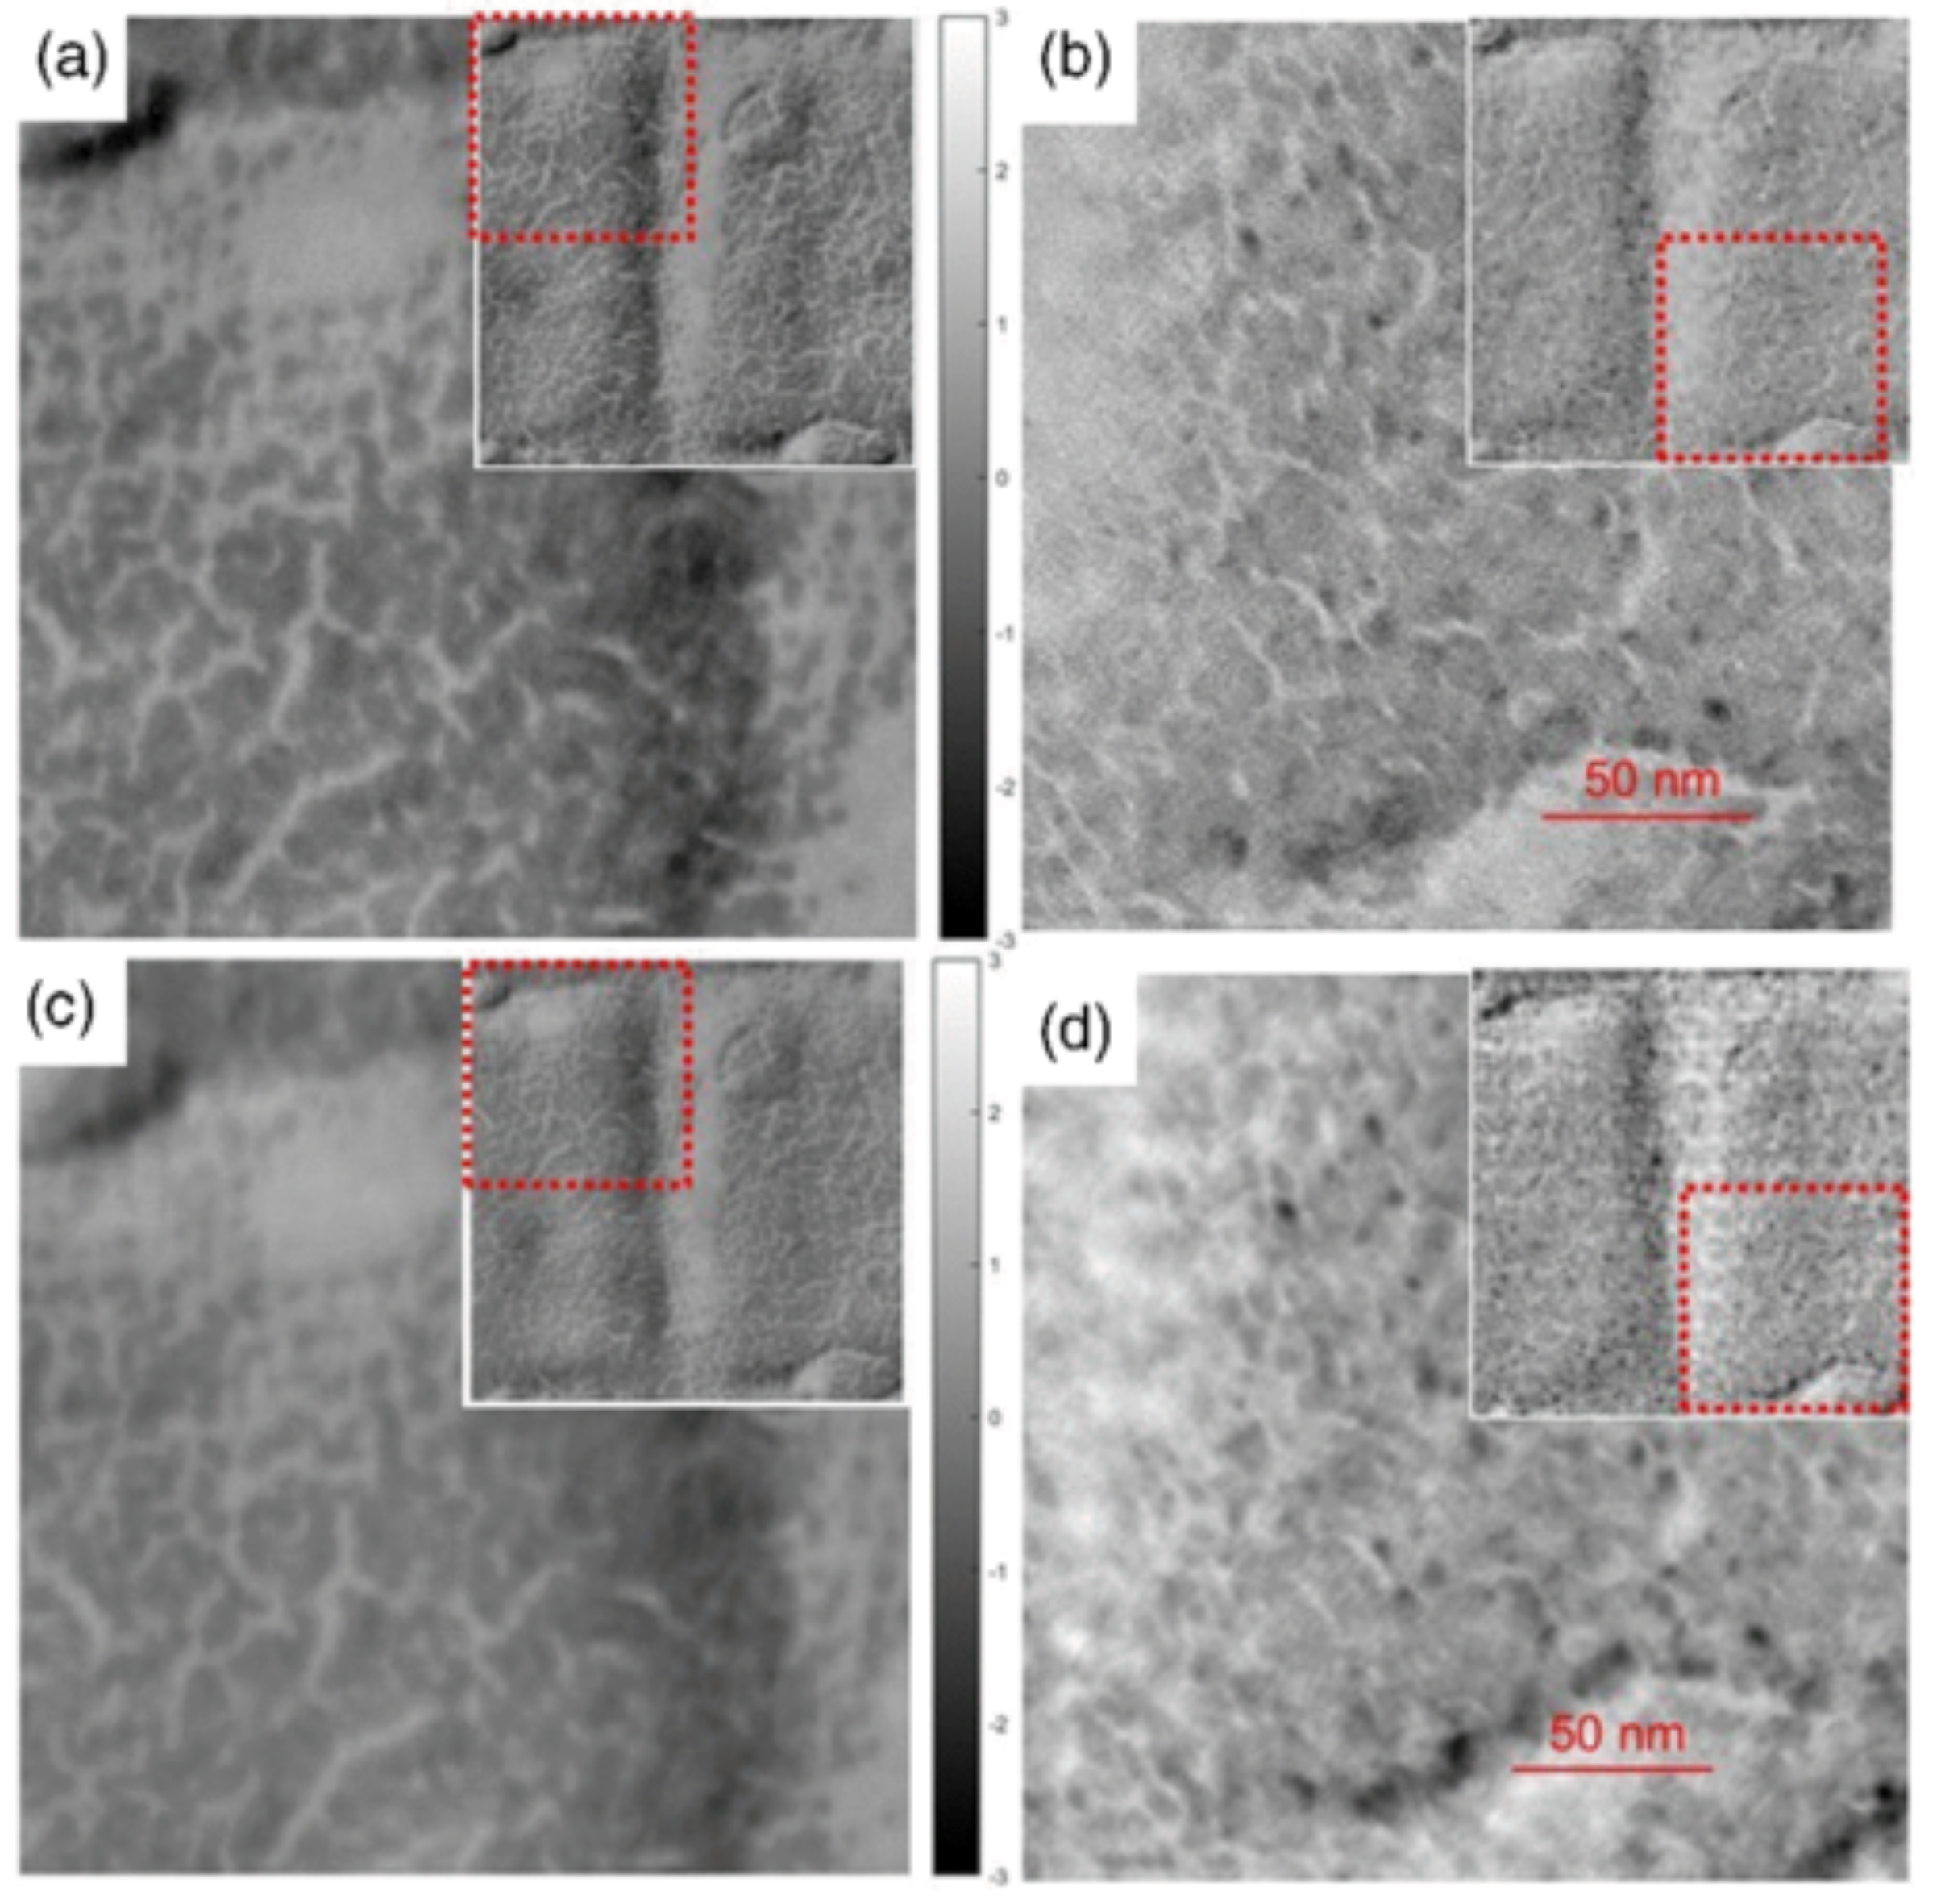
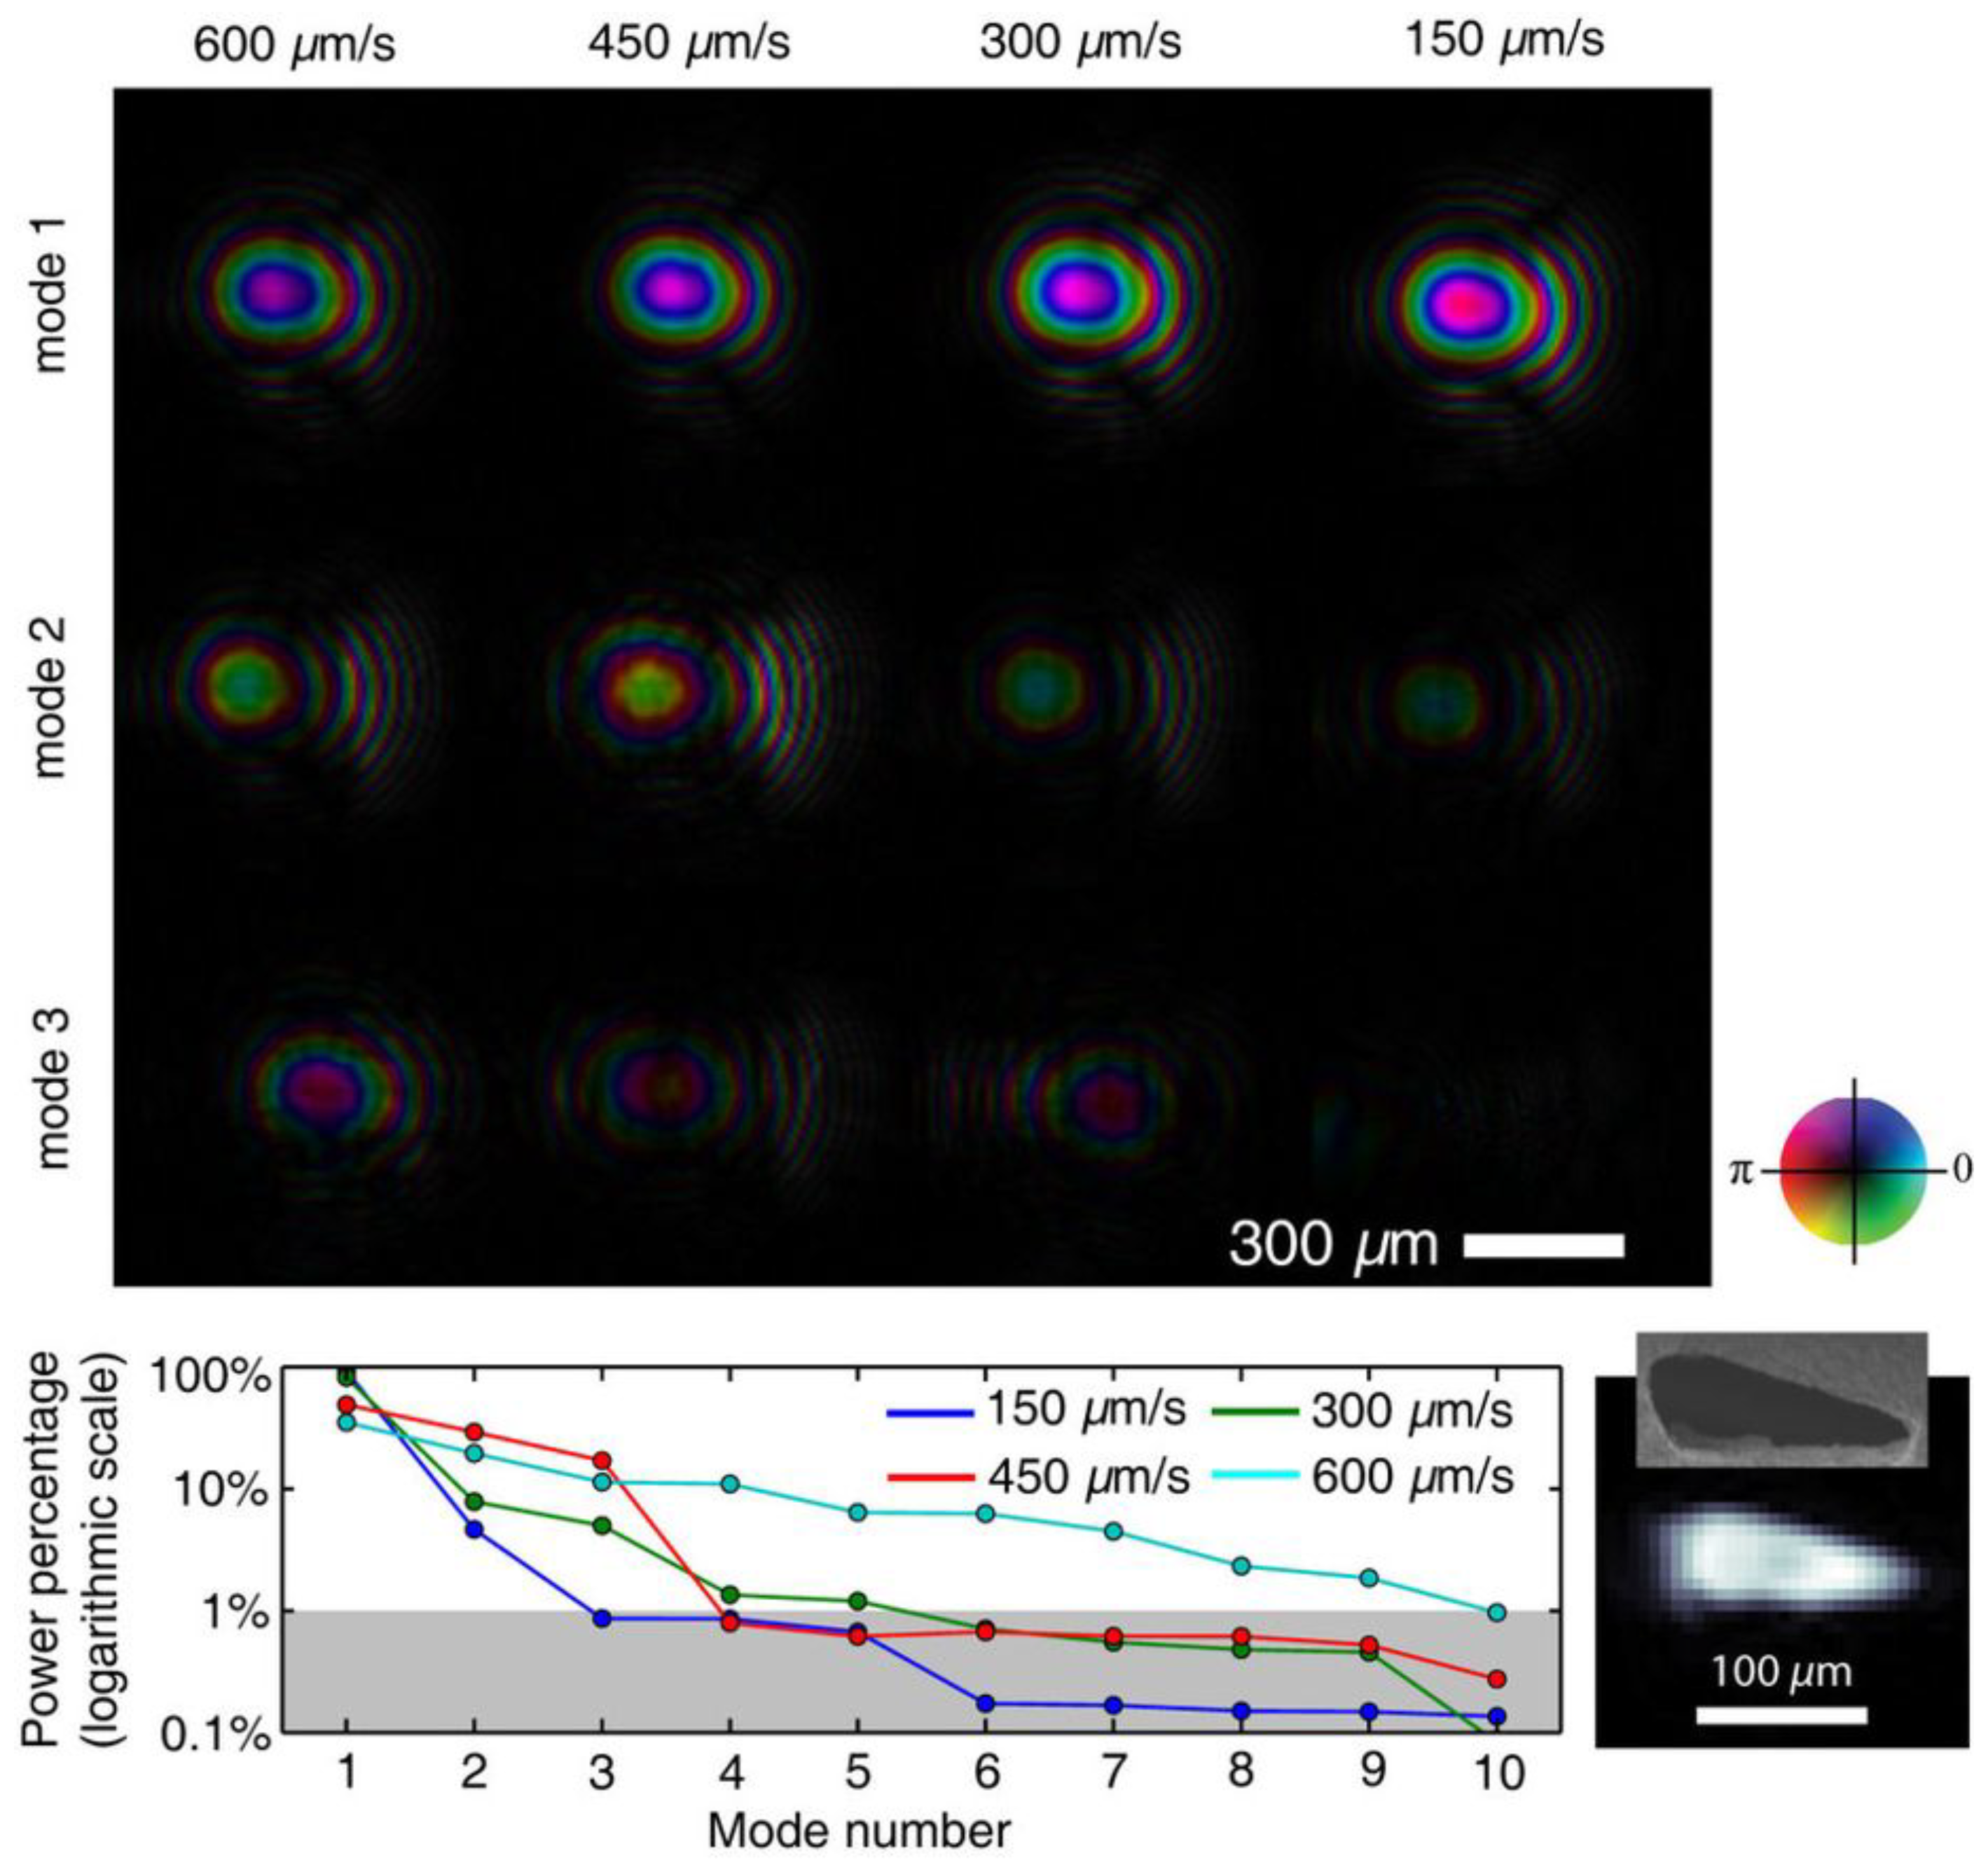
Previously, researchers adopted RL deconvolution to accommodate spatial partial coherence into CDI [5,6] and ptychographic [11] iterative algorithms, and their mathematical formulations have been described in details in Ref [5,6,11]. To further develop the mathematical concept of partial coherence that suits ptychography, a different version of representation of partial coherence of electromagnetic waves has been suggested [7,9], which adopts the theorem that transverse and longitudinal partially coherent X-rays can be generally formulated equivalently by introduction of superposition states of multiple modes in both spatial and wavelength (spectra) regimes. In the spectral regime, multi-modal approach is also valid. Insertion device generated synchrotron X-rays always possess a certain amount of longitudinal incoherence, especially when no X-ray monochromators are present, the resulting X-rays are to be composed of significant broadening of the energy spectra. It is considered of general interest to utilize an undulator harmonic from X-ray intensity spectra that is generated by an insertion device because coherent intensity diffraction intensities can be mathematically recovered with iterative algorithms by applying multi-modal ptychography. The original research on broadband X-ray illumination in coherent diffraction imaging reported by Abbey et al. [12], include a priori calculated electromagnetic wave spectrum from a particular undulator harmonic, obtained by simulations of broadband X-rays, produced by an insertion device to guide the iterative algorithms in the reconstruction of the acquired CDI data. This approach was extended to Ptychography, both in visible [8] and X-rays regimes [13], with demonstrated enhanced experimental efficiencies achieved by allowing larger flux illumination on sample. Figure 3 shows reconstructions of test sample with multiple probe modes using broad bandwidth pink beam X-rays, and the reconstructions improved significantly when introducing multiple probe modes into the iterative algorithms. Figure 4 displays Multi-modal ptychography can be extended to electron regime, and a study demonstrates the applicability of probe modal decomposition using electron ptychography [14]. Figure 4 illustrates experimental reconstructions of both modulus and phase components of object, showing much improved data inversion quality when 16 probe modes are incorporated when compared to results with only a single probe mode in the ptychographic iterative algorithms. It is particularly important to note that recent development of fly-scan ptychography [15,16] introduces continuous motions of sample movements, thus, would result in blurring of measured diffraction intensities. To reconstruct fly-scan ptychography datasets, incorporation of partial coherence is required; multiple probe modes are artificially introduced into data processing to account for the continuous motions of samples. Figure 5 shows experimental reconstruction of several probe modes as a function of sample scanning speed in their reported study with a collimated visible-light laser source [15]. The advantages of fly-scan ptychography are two-fold. First, the overhead of sample stages could be minimized to reduce total measurement time, and secondly, the sample stage scanning motions are much more stable and reliable, comparing to the case of excessive acceleration and deceleration of sample stage motors during ptychographic data acquisition.
The number of sample modes are representatives of multiple sample states, sometimes they can be orthogonal to each other, in the same fashion to that of X-ray beam. Following the free-space propagation intensity equation derived from Equation (1) in the work of Clark et al. [9],
I ( q ) = B ( r 1 , r 2 ) S ( r 1 , r 2 ) exp [ i π z λ ( r 1 2 r 2 2 ) ] × exp [ i ( r 1 r 2 ) · q ] d r 1 d r 2
where B ( r 1 , r 2 ) is the probe function, S ( r 1 , r 2 ) is the object function, r 1 , r 2 represent two arbitrary points separated in the free-space propagation direction, and q represents the reciprocal-space unit vector, and λ is the wavelength of the illuminating X-rays. The mutual optical intensity (MOI) equations of both multiple X-ray beam J B ( r 1 , r 2 ) and sample modes J S ( r 1 , r 2 ) can be described as the following mathematical formulations, which are first proposed by Thibault and Menzel [7] :
J B ( r 1 , r 2 ) = n = 1 N η n B n ( r 1 ) B n * ( r 2 )
J S ( r 1 , r 2 ) = m = 1 M η m S m ( r 1 ) S m * ( r 2 )
where η n and η m represent the corresponding X-ray beam and sample modes weights individually according to specific experimental setup conditions and sample states respectively. n and m represent the number of modes in X-ray beam and sample respectively, and where * indicates complex conjugate operation, and N and M represent the total number of modes in X-ray beam and sample respectively.
When the illumination demonstrates a statistically stationary mutual intensity function which depends only on the difference r 1 r 2 , the measured partially coherent intensity I p c ( q ) adopts a particularly simple form:
I p c ( q ) = F [ J B ( r 1 , r 2 ) · J S ( r 1 , r 2 ) ] = F [ n = 1 N m = 1 M η n B n ( r 1 ) B n * ( r 2 ) · η m S m ( r 1 ) S m * ( r 2 ) ]
where F denotes Fourier transform of the product of X-ray beam and sample states.
Following Thibault’s parametrization of the classical Fourier projector in the difference-map [7], the following equation expresses the partial coherence projector, Π F
Π F = F 1 n = 1 N m = 1 M F ( 2 Π 0 [ ψ j m , n ( r ) ] ψ j m , n ( r ) ) · I j ( q ) n = 1 N m = 1 M F ( 2 Π o [ ψ j m , n ( r ) ] ψ j m , n ( r ) ) ,
where ψ j represents the product of X-ray beam and sample wavefunctions of the number jth position of the ptychography scan in a 2D series.
Also, with the real-space projection probe update operation Π 0 being implemented, analogously augmented to incorporate multi-modal formulation:
P n ( r ) = m j O m , n * ( r + r j ) · ψ j ( r ) ( m , n ) n j | O m , n ( r + r j ) | 2 ,
and
O m ( r ) = n j P m , n * ( r + r j ) · ψ j ( r ) ( m , n ) m j | P m , n ( r + r j ) | 2 .
where r and r + r j represent sample position under X-ray beam illumination at position r and the next position r + r j in the jth position of the ptychography scan in a 2D series.

3. Simulation Results

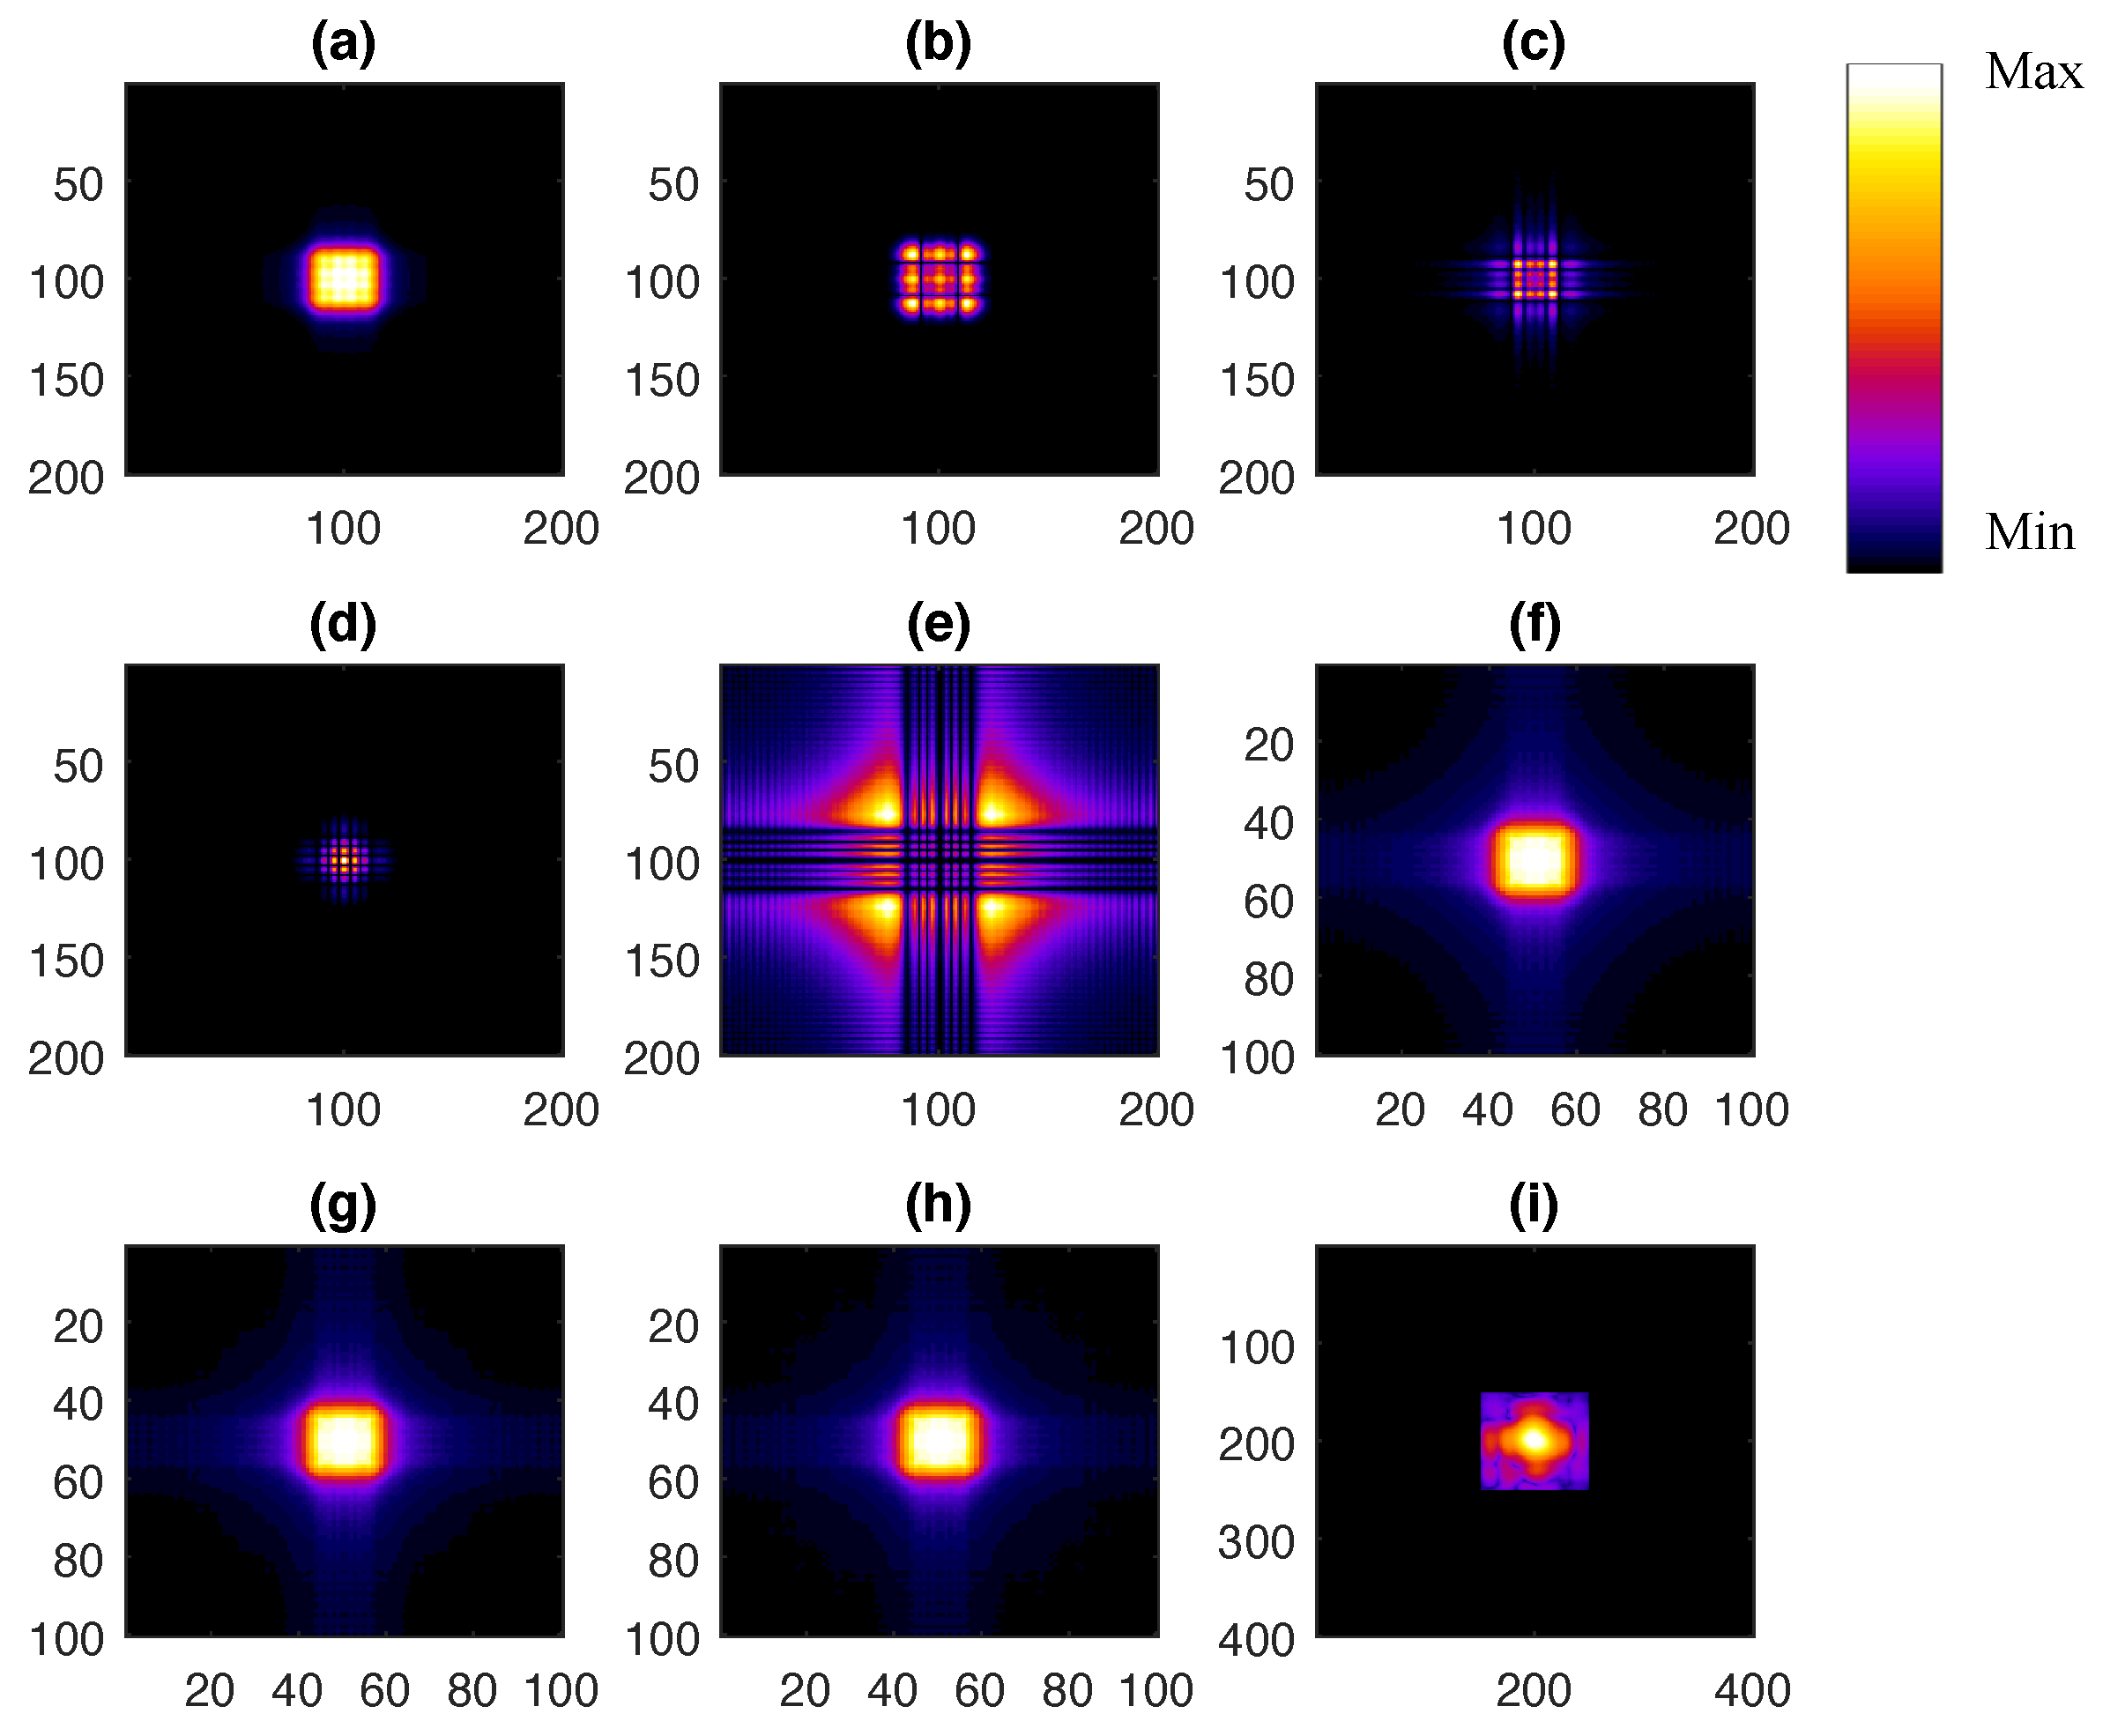
To simulate sample multiple states for ptychographic reconstructions, we performed reconstructions using the first 5 orthorgonal modes of canonical Lena test image given by Singular Value Decomposition (SVD) algorithm [17,18]. Simulated data in which the Lena object ( L ) under illumination was the real-part only canonical Lena test image of size 512 × 512 pixels. The orthogonal modes in both probe and object are particular ranks of the singular values of the image matrices. Selecting more numbers of singular values produces higher numbers of ranks of the matrices. The orthogonal modes can represent real modes in materials systems, and they can be scientifically interesting. Electrical or magnetic field with mutually orthogonal modes could be present in waveguides. The first two orthogonal modes have the highest proportions of weights, and the weights become much less for orthorgonal modes with increasing numbers of singular values. We used SVD to decompose a probe simulated by propagating illumination after a circular pinhole into 5 orthogonal modes, and the related reconstructions of the probe, which are displayed in Figure 6. The first 5 orthogonal modes of canonical Lena test image by SVD and the related reconstructions are depicted in Figure 7. Both probe and object orthogonal modes simulated by SVD are used to simulate multi-modal ptychographic diffraction intensities to test the feasibility of information retrieval by the reconstruction algorithms. Multi-modal diffraction intensities are simulated by performing summation over all the 25 individual coherent diffraction intensities that result from 5 orthogonal modes of both probe and object test pattern. The overlap ratio in our simulations was selected to be around 85%, and the total number of scan positions in the ptychographic datasets is 323, and the ptychographic scan was performed with a spiral geometry to intentionally break the possible translation symmetry. Only the first orthogonal mode of simulated probe is fed into the reconstruction algorithms, the remaining modes of the probe and all sample modes are unknown when starting the reconstructions. The reconstruction of simulated data was performed with 1000 iterations. The reconstructed images in Figure 6i and Figure 7i are compared to Figure 6f and Figure 7f respectively, where superposition of 5 orthogonal modes of both probe and sample are calculated to compare the reconstructed and simulated probe and sample. The central region of the superposition images of Figure 7a–e is selected for simulation analyses. Comparison of the superposition of the central region of the image (Figure 7f) to the reconstructed results (Figure 7i) on sample is performed. The reconstructed images in Figure 6i and Figure 7i are compared to Figure 6f and Figure 7f by using Real-space error metric [6] to be 0.0176 and 0.0154 respectively. The reconstructions of first 5 modes do not match the original 5 modes, because the reconstruction fails to recover separated modes. In real experiments, usually Poissonian or Gaussian noises can be present in the measured datasets. These noises can be effectively modelled and taken into account by using The maximum-likelihood (ML) formulation for ptychography [7,19].

4. Discussion

Multi-modal ptychography could be potentially used to study extremely short or large time-scale dynamics of materials sciences systems, and works well when dynamical time-scale of sample is faster than that of a single ptychographic scan point in a 2D scan series. As long as there is enough statistics in a single ptychographic scan point in 2D scan series, the reconstructions convergence for multi-modal ptychography can be achieved. The estimated ratio between average time-scale of single scans position and the object dynamics should be at least around 1 to 2. Ideally, more cycles of ptychography data of dynamical objects should be collected to ensure good data reconstructions with reasonable statistics. These limiting factors should be carefully considered in future experiments, and measurements should be performed with caution to be able to investigate different materials sciences dynamical systems.

5. Conclusions

We here report examinations on multi-modal (in both sample and probe) ptychography. Both experimental and simulated reconstructions of multi-modal ptychographic datasets have suggested that multi-modal ptychography is not able to directly retrieve individually separate sample and probe modes, instead, the technique is capable to recover superposition states of both sample and probe initial modes, simultaneously, with a very good agreement with correct results. The recovered final average image of either sample or X-ray probe is a superposition state of all the sample or X-ray probe modes. We envisage multi-modal X-ray ptychography can be potentially applied to dynamical sample systems using partially coherent X-rays with few-nanometer spatial resolution in the near future when diffraction-limited synchrotron radiation facilities become available worldwide.

Author Contributions

X.S and N.B. conceived and designed the simulation experiments; X.S. and N.B. performed the experiments; X.S. and N.B. analyzed the simulated data; D.B. and I.R. contributed reagents/materials/analysis tools; All authors wrote the paper.

Funding

Xiaowen Shi acknowledge partial supported by the U.S. Department of Energy, Office of Basic Energy Sciences, Division of Materials Science and Engineering, under Grant No. DE- FG02-11ER46831. Xiaowen Shi gratefully acknowledges financial support from physical sciences division and Beamline I13 Coherence branch of Diamond Light Source, Didcot, Oxfordshire, United Kingdom. Work performed at Brookhaven National Laboratory was supported by the US Department of Energy, Office of Basic Energy Sciences, under Contract Number DE-SC00112704.

Acknowledgments

The authors thank Christoph Rau from Diamond Light Source for helpful discussions.

Conflicts of Interest

The authors declare no conflict of interest.

References

  1. Rodenburg, J.M.; Faulkner, H.M.L. A phase retrieval algorithm for shifting illumination. Appl. Phys. Lett. 2004, 85, 4795–4797. [Google Scholar] [CrossRef]
  2. Rodenburg, J.M.; Hurst, A.C.; Cullis, A.G.; Dobson, B.R.; Pfeiffer, F.; Bunk, O.; David, C.; Jefimovs, K.; Johnson, I. Hard-X-Ray Lensless Imaging of Extended Objects. Phys. Rev. Lett. 2007, 98, 034801. [Google Scholar] [CrossRef] [PubMed]
  3. Thibault, P.; Dierolf, M.; Bunk, O.; Menzel, A.; Pfeiffer, F. Probe retrieval in ptychographic coherent diffractive imaging. Ultramicroscopy 2009, 109, 338–343. [Google Scholar] [CrossRef] [PubMed]
  4. Pierre, T.; Martin, D.; Andreas, M.; Oliver, B.; Christian, D.; Franz, P. High-Resolution Scanning X-ray Diffraction Microscopy. Science 2008, 321, 379–382. [Google Scholar]
  5. Clark, J.N.; Huang, X.; Harder, R.; Robinson, I.K. High-resolution three-dimensional partially coherent diffraction imaging. Nat. Commun. 2012, 3, 993. [Google Scholar] [CrossRef] [PubMed] [Green Version]
  6. Parks, D.H.; Shi, X.; Kevan, S.D. Partially coherent X-ray diffractive imaging of complex objects. Phys. Rev. A 2014, 89, 063824. [Google Scholar] [CrossRef]
  7. Thibault, P.; Menzel, A. Reconstructing state mixtures from diffraction measurements. Nature 2013, 494, 68–71. [Google Scholar] [CrossRef] [PubMed]
  8. Batey, D.J.; Claus, D.; Rodenburg, J.M. Information multiplexing in ptychography. Ultramicroscopy 2014, 138, 13–21. [Google Scholar] [CrossRef] [PubMed]
  9. Clark, J.N.; Huang, X.; Harder, R.J.; Robinson, I.K. Dynamic imaging using ptychography. Phys. Rev. Lett. 2014, 112, 113901. [Google Scholar] [CrossRef] [PubMed]
  10. Li, P.; Edo, T.; Batey, D.; Rodenburg, J.; Maiden, A. Breaking ambiguities in mixed state ptychography. Opt. Express 2016, 24, 9038–9052. [Google Scholar] [CrossRef] [PubMed]
  11. Burdet, N.; Shi, X.; Parks, D.; Clark, J.N.; Huang, X.; Kevan, S.D.; Robinson, I.K. Evaluation of partial coherence correction in X-ray ptychography. Opt. Express 2015, 23, 5452–5467. [Google Scholar] [CrossRef] [PubMed]
  12. Abbey, B.; Whitehead, L.W.; Quiney, H.M.; Vine, D.J.; Cadenazzi, G.A.; Henderson, C.A.; Nugent, K.A.; Balaur, E.; Putkunz, C.T.; Peele, A.G.; et al. Lensless imaging using broadband X-ray sources. Nat. Photonics 2011, 5, 420–424. [Google Scholar] [CrossRef]
  13. Enders, B.; Dierolf, M.; Cloetens, P.; Stockmar, M.; Pfeiffer, F.; Thibault, P. Ptychography with broad-bandwidth radiation. Appl. Phys. Lett. 2014, 104, 171104. [Google Scholar] [CrossRef]
  14. Cao, S.; Kok, P.; Li, P.; Maiden, A.M.; Rodenburg, J.M. Modal decomposition of a propagating matter wave via electron ptychography. Phys. Rev. A 2016, 94, 063621. [Google Scholar] [CrossRef]
  15. Huang, X.; Lauer, K.; Clark, J.N.; Xu, W.; Nazaretski, E.; Harder, R.; Robinson, I.K.; Chu, Y.S. Fly-scan ptychography. Sci. Rep. 2015, 5, 9074. [Google Scholar] [CrossRef] [PubMed]
  16. Deng, J.; Nashed, Y.S.G.; Chen, S.; Phillips, N.W.; Peterka, T.; Ross, R.; Vogt, S.; Jacobsen, C.; Vine, D.J. Continuous motion scan ptychography: Characterization for increased speed in coherent X-ray imaging. Opt. Express 2015, 23, 5438–5451. [Google Scholar] [CrossRef] [PubMed]
  17. Lerotic, M.; Jacobsen, C.; Gillow, J.B.; Francis, A.J.; Wirick, S.; Vogt, S.; Maser, J. Cluster analysis in soft X-ray spectromicroscopy: Finding the patterns in complex specimens. J. Electron Spectrosc. Relat. Phenom. 2005, 144–147, 1137–1143. [Google Scholar] [CrossRef]
  18. Lerotic, M.; Jacobsen, C.; Schäfer, T.; Vogt, S. Cluster analysis of soft X-ray spectromicroscopy data. Ultramicroscopy 2004, 100, 35–57. [Google Scholar] [CrossRef] [PubMed] [Green Version]
  19. Thibault, P.; Guizar-Sicairos, M. Maximum-likelihood refinement for coherent diffractive imaging. New J. Phys. 2012, 14, 063004. [Google Scholar] [CrossRef] [Green Version]
Figure 1. The first three ( n = 1, 2, 3) recovered probe modes for the cases of (a) a static sample; (b) a square wave with amplitudes 1 μ m and (c) 1.5 μ m; and (d) a sine wave with amplitudes 1 μ m and (e) 1.5 μ m. The bottom line also shows the square root of the summed intensity (rms, right column, linear scale) from five probe modes for the cases listed previously. The rms shows clearly how the probe forms can be manipulated using a vibrating sample. The scale bar is 1 μ m. The vibration frequency is selected to be 1 Hz with exposure of 6 s per position. Figure adapted from Ref [9], reprint permission granted, 2014 American Physical Society.
Applsci 08 01054 g001
Figure 2. Two different sets of reconstructions from the same data set using different initial guesses. (a) The first set of raw reconstructions; (b) The second set of raw reconstructions. The scale bars indicate a length of 300 m. The color wheel applies to all the images. To aid in display, the curvature of the probe phases has been removed. Figure adapted from [10], Reprint permission granted, 2016 The Optical Society.
Applsci 08 01054 g002
Figure 3. Comparison between three reconstruction strategies: conventional reconstruction (a,d); reconstruction after background correction on diffraction data (b,e); and mixed-state reconstruction using 10 modes (c,f). For each frame, the image on the top displays the modulus of the retrieved probe and the image on the bottom is the phase of the reconstructed object. (a,c) (resp. (d,f)) Reconstructions from the scan at a distance of +0.35 mm (resp. +2.1 mm) from the focus of the illumination. The colour scale for all panels is the same as in (a). Figure adapted from Ref [13]. Reprint permission granted. 2014 American Institute of Physics.
Applsci 08 01054 g003
Figure 4. Specimen reconstructions. (a,b) The phase and modulus of the specimen when 16 modes were engaged; (c,d) The phase and modulus reconstructed with a single mode. The main images are the magnification of the squared area by the red dashed line in the whole field of view inserted in the top corner. Figure adapted from Ref [14]. Reprint permission granted. 2016 American Physical Society.
Applsci 08 01054 g004
Figure 5. The top panel shows the three reconstructed illumination modes with the most powers for diffraction pattern collected at different scan speeds. The bottom panel shows the power percentage of the recovered modes. With increased scan speed, more illumination power is removed from primary modes and redistributed into other modes. The inset in the bottom-left corner shows the propagation of the reconstructed illumination wave back to pinhole plane. The shape and dimension are consistent with SEM measurement of the pinhole. Figure adapted from Ref [15]. Reprint permission granted. 2015 Macmillan Publishers Ltd.
Applsci 08 01054 g005
Figure 6. Five first fundamental modes (ae) from SVD of a real-only probe propagated after a pinhole; (fh): simulated sum of 5 modes; 10 modes and 20 modes; (i) reconstructed sum of 5 modes of probe. Images are plotted with a fire-style colormap with an arbitrary maximum value. The Figure 6i is reconstructed results of Figure 6f. The minima and maxima of colormap legend bar for Figure 6a–i are as follows respectively: [0, 1.1531]; [0, 0.2707]; [0, 0.3694]; [0, 0.3410]; [0, 0.3273]; [0.0381, 3.1813]; [0.0820, 3.1817]; [0.0916, 3.1818]; [0, 1.3419].
Applsci 08 01054 g006
Figure 7. Five first fundamental modes (ae) from SVD of a real-only Lena image; (fh): simulated sum of 5 modes; 10 modes and 20 modes. (superposition of central part of mode Figure 7a–e); (i) reconstructed sum of 5 modes of object. (superposition of central part of mode Figure 7a–e); The colormap is the same as that in Figure 6. The Figure 7i is reconstructed results of Figure 7f. The minima and maxima of colormap legend bar for Figure 7a–i are as follows respectively: [0, 0.7764]; [−0.3369, 0.3452]; [−0.3694, 0.3241]; [−0.3410, 0.3031]; [−0.3161, 0.3273]; [0.6184, 6.0942]; [0.5684, 6.1781]; [0.5845, 6.3456]; [0, 12.2898].
Applsci 08 01054 g007