Evaluation of Water Content in an Active Layer Using Penetration-Type Time Domain Reflectometry
by
 ,
,
Jong-Sub Lee
1 ,
,
Won-Taek Hong
1,
Keunbo Park
2,
Seung Seo Hong
3,
Sang-Ho Lee
4 and
Yong-Hoon Byun
4,5,* 1
School of Civil, Environmental and Architectural Engineering, Korea University, Seoul 02841, Korea
2
Division of Polar Climate Sciences, Korea Polar Research Institute, Incheon 21990, Korea
3
Geotechnical Engineering Research Division, SOC Research Institute, Korea Institute of Construction Technology, Goyang 10223, Korea
4
School of Agricultural Civil and Bio-Industrial Engineering, Kyungpook National University, Daegu 41566, Korea
5
Institute of Agricultural Science & Technology, Kyungpook National University, Daegu 41566, Korea
*
Author to whom correspondence should be addressed.
Appl. Sci. 2018, 8(6), 935; https://doi.org/10.3390/app8060935
Submission received: 10 May 2018
/
Revised: 2 June 2018
/
Accepted: 4 June 2018
/
Published: 5 June 2018
Abstract
:Featured Application
The PTDR developed in this study is effectively used for estimating the water content profile of soils, and simultaneously applying the PTDR and electrical resistivity survey can be useful for the evaluation of water content distribution in the active layer.
Abstract
The moisture condition of the active layer in Arctic regions can induce severe problems, such as ground subsidence and frost heave. Thus, the water content in the active layer needs to be estimated using a light and portable in-situ testing device. In this study, a penetration-type time domain reflectometry (PTDR) device is developed for the estimation of volumetric water content in the active layer. The developed PTDR is applied at a site for an electrical resistivity survey to characterize the water distribution along a measurement line. A PTDR consists of a PTDR module, connecting rods, and a guide with a hammer. The PTDR module can determine the dielectric constant of a material from the measurement of the travel time of electromagnetic waves. Using remolded soil samples, the dielectric constants measured from the PTDR are calibrated with the volumetric water content. The PTDR calibration demonstrates that the dielectric constant increases with the water content. For the temperature of 0.1 to 15.2 °C, the travel time only slightly depends on the temperature variance. For field application, a PTDR is pressed into the ground and measures the electromagnetic waves and temperature with depth. The results of the field tests show that the volumetric water content measured by the PTDR increases with depth due to the impermeable layer located underneath the active layer. The electrical resistivity survey conducted at the same site provides the electrical resistivity profile for a long distance and shallow depth soils. Furthermore, the electrical resistivity survey and PTDR establish a significant correlation between electrical resistivity and water content. The PTDR developed in this study can be effectively used as an advanced in-situ testing method to estimate the water distribution in the active layer.
1. Introduction
The active layer, which is the uppermost layer of soil above the permafrost, is exposed to seasonal freezing and thawing. The active layer is considered to be a variable resistor that regulates the heat flow between the atmosphere and permafrost [1]. As a representative index for heat transfer in soils, the thermal conductivity has previously been estimated; it has been shown that the addition of water to dried soils leads to higher thermal conductivity. Furthermore, the active layer during summer has a higher thermal conductivity than during winter, due to the higher water content. The water content in the active layer increases with the increase in precipitation during summer, and eventually induces an increase in the latent heat, which can delay the refreezing of the active layer during winter. In this respect, the water in the active layer plays an important role in the heat transfer process. In practice, the existence of water in the active layer can cause potential problems, such as differential ground subsidence, development of thermokarst, frost heave, and slope failure [2,3].
Several methods have been used to measure the water content in soils. First, using the neutron moisture meter (NMM), which emits fast neutrons, the slow neutrons thermalized by hydrogen atoms that are predominantly found in water molecules can be detected. As the thermalizing effect in water is much greater than in other elements commonly found in soils, the NMM is useful for estimating the total water content [4,5]. However, when using the NMM, it is not possible to discriminate the liquid water from the ice in the soil matrix. Second, as a reliable method for determining the water content in frozen soils, nuclear magnetic resonance (NMR) spectroscopy has been used for determining unfrozen water content, although the application of NMR has been limited to laboratory tests [6,7,8]. Third, the gamma ray attenuation method has also been used for the measurement of water content in soils [9]. However, these methods may cause a potential health hazard. Alternatively, time domain reflectometry (TDR) based on the propagation velocity of electromagnetic waves has also been employed over the past few decades to estimate the water content [10]. Based on the difference between the dielectric constants of water (kwater = 80) and other soil constituents (kair = 1, ksolid = 3~7), a calibration relationship between the volumetric water content and the dielectric constant proposed by Topp et al. [11] has been used [12,13,14,15,16,17,18,19]. Even for frozen soils, the volumetric water content can be easily estimated due to the low value of the dielectric constants of ice (kice = 3.2) when compared to that of water. Lastly, frequency domain reflectometry (FDR), also based on the dielectric constant determination of the material surrounding the probe, are popular for the evaluation of the water content in soils [20,21]. However, the water content determined from using the FDR probe is more sensitive to soil type and salinity than that determined using the TDR probe.
During the process of the repeated freezing and thawing of the active layer, the water content is a key aspect of frost heave and ground subsidence. The active layer in the cold region is formed approximately within one to two meters from the ground surface. To measure the volumetric water content in the shallow-depth soil, Topp et al. [22] and Young et al. [23] developed a combined cone penetrometer which included the electrodes of a TDR probe in the shaft of the penetrometer. A coiled-type combined TDR-penetrometer has also been used to improve the accuracy of travel time measurements with an increased number of electrodes [24,25,26,27]. To coincide with the position of the penetrating cone, a conductive coil for detecting the water content was located at the cone tip [28]. A series of curved plate-type combined TDR-penetrometers was designed to investigate the optical configuration for waveguides [29]. Recently, a combined TDR-penetrometer, which has two electrodes on the shaft in the same direction, was developed to ensure that the electrodes were fixed to the shaft [30]. These TDR-penetrometers are light and portable, and are thus useful for the shallow subsurface characterization of a natural hill slope. However, for these TDR-penetrometers, there are several issues to be modified, such as the number of electrodes and the air gap between the probe and soil. Furthermore, to date, a TDR-penetrometer has not been used for the estimation of the volumetric water content in the active layer. Compared to the approach of applying TDR-penetrometers at a limited number of test locations, the electrical resistivity survey has the advantage of providing a continuous resistivity profile of a greater volume of soil. Nevertheless, few trials have been performed where the results obtained using a TDR penetrometer have been integrated with those obtained from an electrical resistivity survey.
This study demonstrates the development of a penetration-type TDR (PTDR) and its application with an electrical resistivity survey for the evaluation of the water content in the active layer. First, the basic principle of the TDR technique and design of the PTDR developed in this study are introduced. The engineering properties of the soils sampled at Ny-Alesund, Svalbard are provided. The PTDR is then used to establish the relationship between the volumetric water content and the dielectric constant. The temperature effect is then investigated. Finally, the field test results of the PTDR and the electrical resistivity survey obtained at the same site are discussed.
2. Penetration-Type TDR (PTDR)
2.1. Principle of TDR
The dielectric constant of a medium, which represents the ability to store electrical potential energy under an electrical field, can be determined from the propagation time of electromagnetic waves. The time domain reflectometry (TDR) unit has been used to measure the reflection of electromagnetic waves along the elapsed time through the electrodes of the TDR. The dielectric constant (ka) of soils in the vicinity of the TDR electrodes is dependent on the propagation velocity of a pulse, as follows [10]:
where c is the velocity of electromagnetic waves in a perfect vacuum (3 × 10⁸ m/s); v is the propagation velocity of electromagnetic waves in a tested medium; t is the travel time of electromagnetic waves in a tested medium; and L is the length of the electrodes of the TDR. The travel time is determined as the time elapsed from the reflection at the beginning of the electrodes to the reflection at the end of the electrodes. Using TDR, the dielectric constant can be determined from a known probe length and the time between the first and second reflection.
In a TDR waveform, the identification of the first and second reflection points is critical for the determination of the dielectric constant. In general, the location of the first reflection is a fixed point, unchanged by the material surrounding the probe [31]. Baker and Allmaras [32] determined the location of the second reflection to be the intersection of the tangent line, representing the maximum value of the derivative, with a horizontal line representing the maximum value of the derivative.
2.2. Design
A PTDR was developed in this study to evaluate the water content in the active layer along the depth when the ice lens in the ground was melted. The PTDR consists of a PTDR module, connecting rods, ruler, and a guide with a hammer, as shown in Figure 1.
Figure 2 shows the shape of the PTDR module, which was designed as a tapered rectangle with a width ranging from 20 mm to 22 mm to enhance the contact between the electrodes and soil. For the measurement of the velocity of electromagnetic waves, three electrodes, each having a thickness of 1.5 mm and a length of 80 mm, were mounted onto the surface of the PTDR module. The three electrode-type probe generally provides a more distinct reflection than two electrode-type probes [35]. The PTDR module was fabricated of monomer-cast (MC) nylon to insulate the spaces between the electrodes, while the tip of the PTDR module was made of stainless steel to minimize the abrasion during penetration. Figure 2 shows the connection of the PTDR module with a co-axial cable of 3 m length. A central electrode installed in the PTDR module as a signal line was connected to the inner co-axial cable, and the other two electrodes were connected as ground lines to the outer co-axial cable. To measure the temperature, a thermocouple was installed diametrically opposed to the module, on the surface of the PTDR module. To reduce the friction along the connecting rod with a diameter of 22 mm during penetration, an expanded coupling with a diameter of 24 mm was used behind the PTDR module.
The hammer, with a weight of 78.8 N, was used for driving the PTDR into the soil. To place the PTDR module at the desired depth, the falling height of the hammer can be changeable during penetration. To transmit and record the reflection signals, a co-axial cable was connected to the TDR unit (Hyperlabs, HL1101); the TDR unit then functions as a pulse generator and an oscilloscope. The 256 detected signals were averaged to minimize the electromagnetic noise, and the signal in the time domain was then recorded.
After soils thaw, the water amount distributed in the active layer can be determined by driving the PTDR, placing the PTDR module at the desired depth, and measuring the TDR waveform. In the following chapter, the relationship between the dielectric constant obtained from the PTDR and water content will be used to estimate the water content in the active layer. Compared to the conventional methods such as digging a pit, the PTDR requires less labor and minimizes soil disturbance. Furthermore, the PTDR can easily be used to survey the water content distribution in the field, while the TDR probes embedded in the soils enable the monitoring of water content only at a fixed position.
3. Laboratory Tests
The Korean Arctic Research station located at Ny-Alesund in Svalbard, Norway was selected as a study site, as shown in Figure 3. The soils behind the research stations might have been disturbed due to past mining activities. At this site, the soils were sampled at P3 along the depth after the excavation, and the PTDR developed in this study was applied.
3.1. Soils Sampled in Ny-Alesund
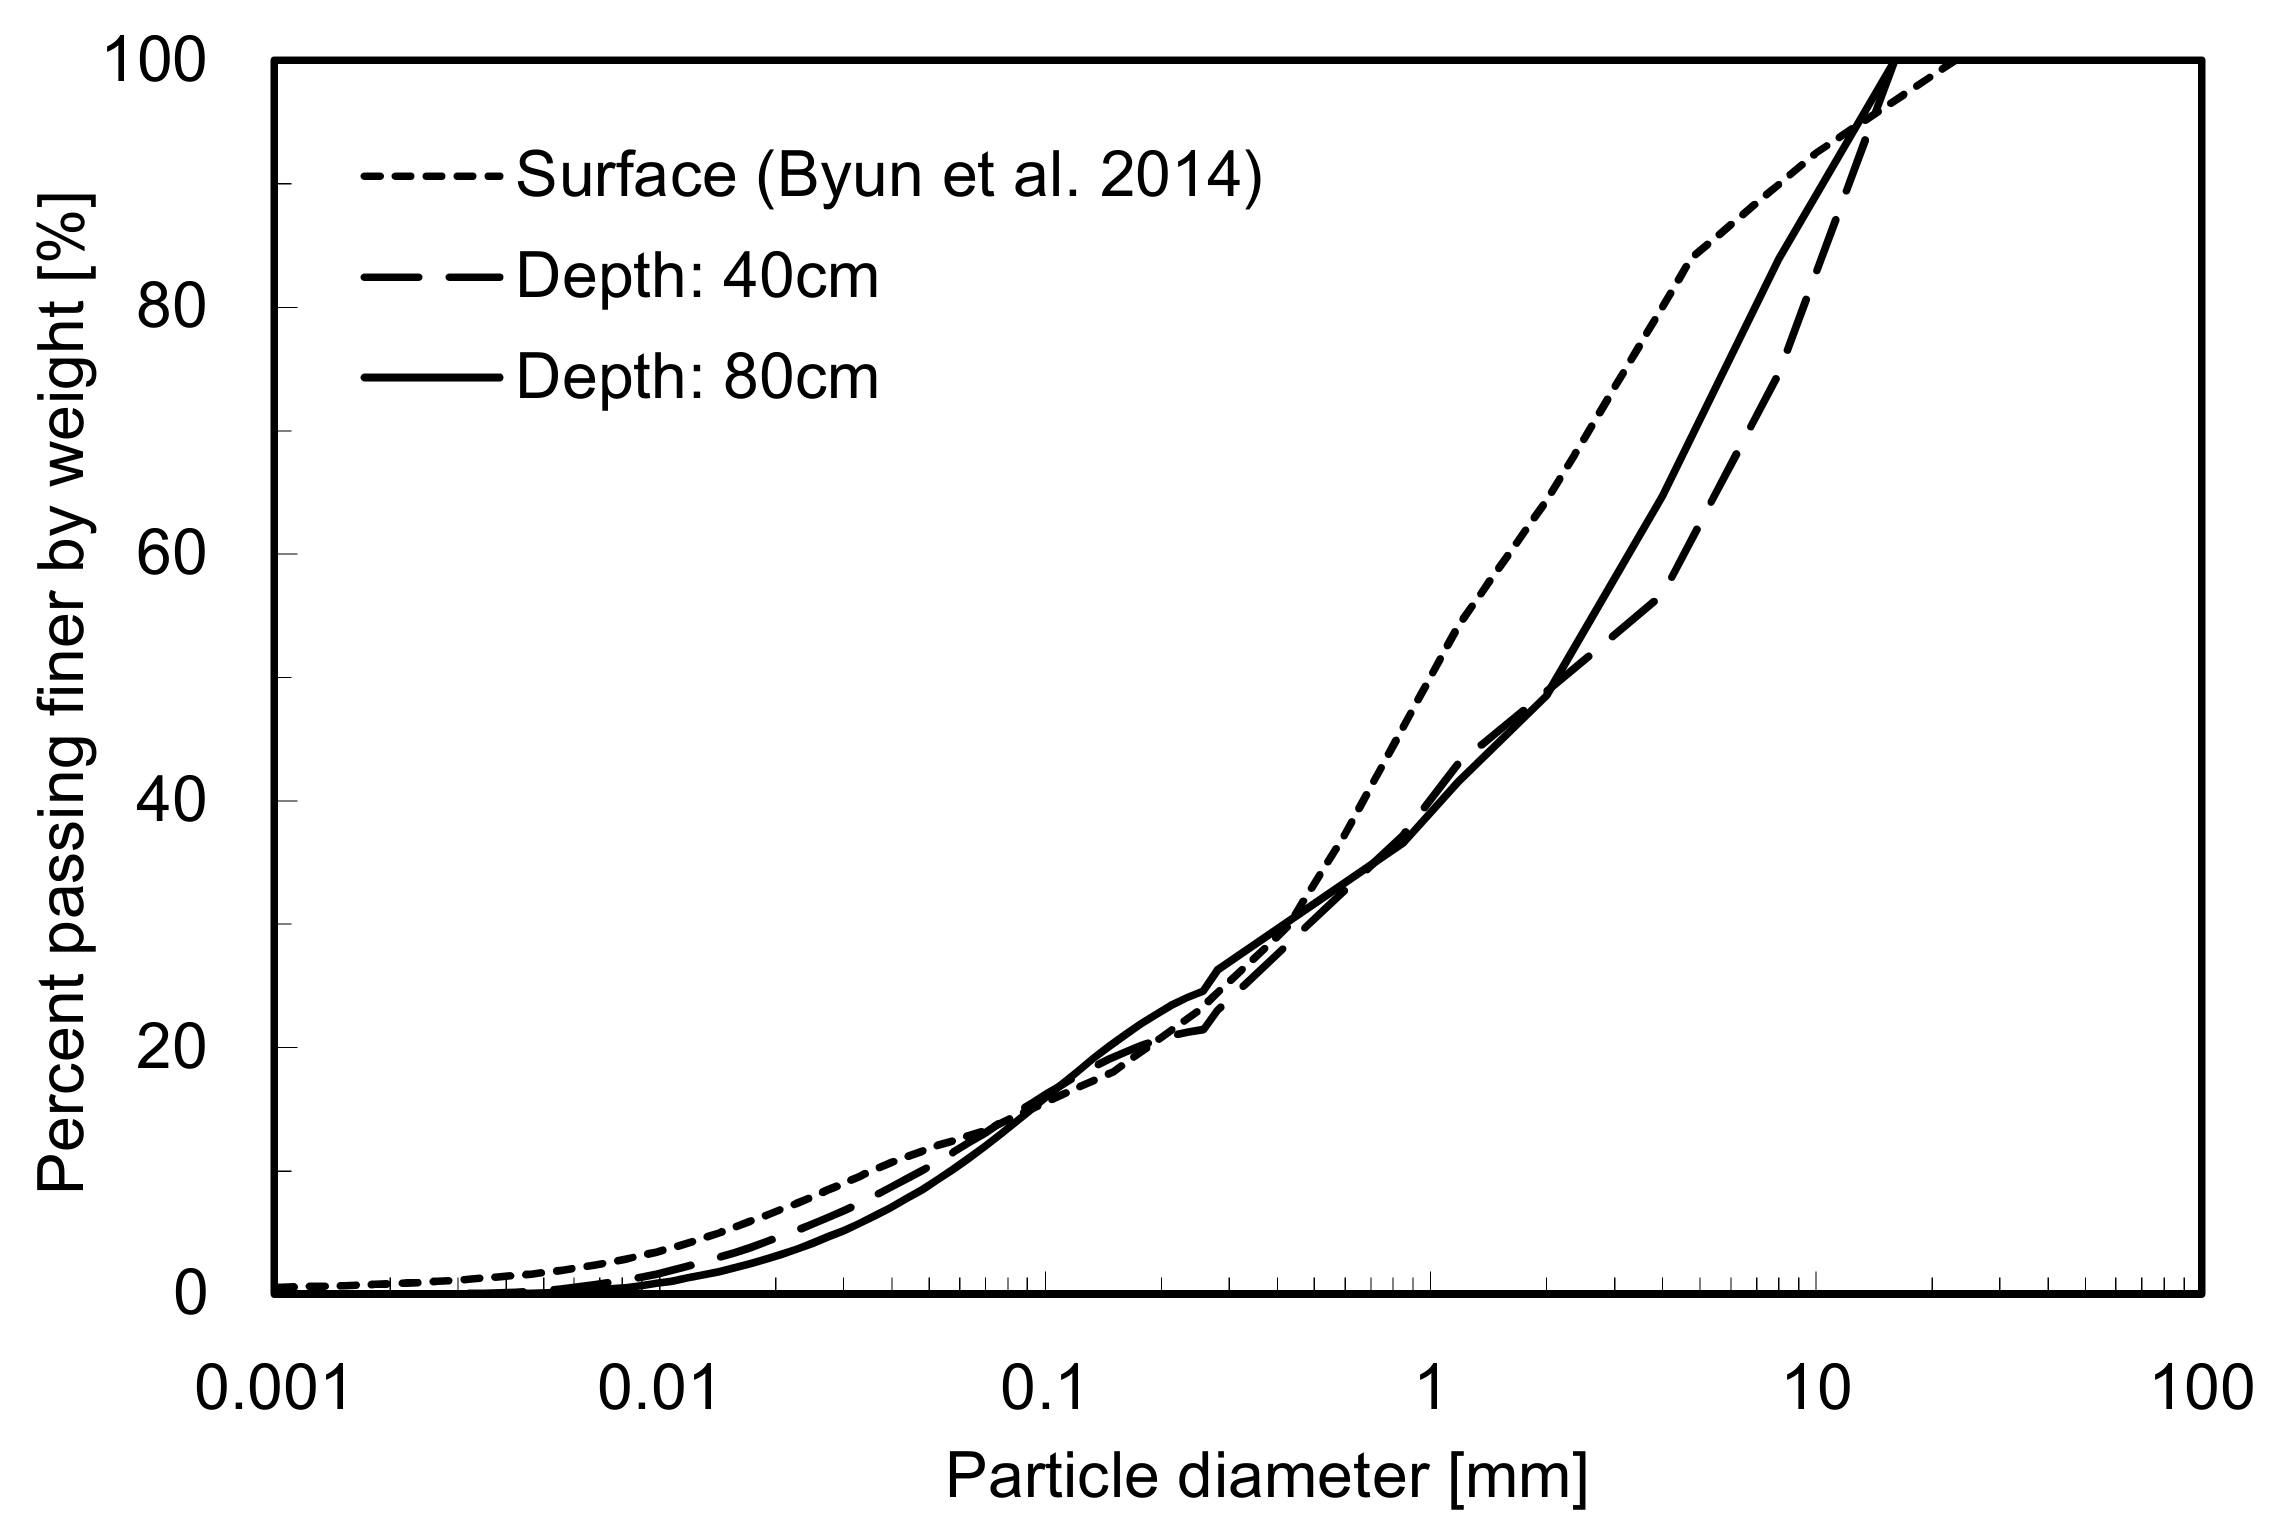
The engineering properties of soils sampled at P3 were investigated. The index properties obtained at three different depths including those reported by Byun et al. [36] are summarized in Table 1. The measured specific gravities of the soils sampled at depths of 40 and 80 cm were greater than those of soils sampled at the surface, as the soils sampled at the surface included the organic materials. For the grain-size distribution, the soils were divided into coarse particles and fine particles with a No. 40 sieve. A sieve analysis and a laser diffraction particle size analyzer were used to obtain the grain-size distribution curves of the coarse particles and fine particles, respectively. Figure 4 shows the grain-size distribution curves of the soils obtained at three different depths. The median grain size of the soil sampled at a depth of 0 cm was slightly smaller than those sampled at depths of 40 and 80 cm. Note that most of the glacial deposits have high variability even within short vertical or horizontal distances [37]. The large uniformity coefficient from 46.4 to 98.7 represents a wide grain-size distribution of glacier-deposited soils. The natural water content in fine-grained soils affecting the soil engineering behavior should be evaluated in comparison with Atterberg limits. Liquid limit and plastic limit were determined from BS 1377 [38] and ASTM D 4318 [39], respectively. Considering the Unified Soil Classification System (USCS), the sampled soils are classified as silty sand (SM).
3.2. Relationship between ka and θ
The dielectric constant measured by the PTDR is influenced by the surrounding soil, and the epoxy and MC nylon in the PTDR module. However, several researchers have shown that the dielectric constant measured by TDR probes can be related to the water content in soils, regardless of soil type [25,40]. A calibration was thus carried out for the estimation of the water content in the soils.
The soils sampled in the study site were used for the calibration. Note that the dielectric constant of the solid material can be changed according to the mineralogical composition of the solid material of the soil [41,42]. Using the sampled soil, seven different specimens mixed with each water amount (θ = 5, 10, 15, 20, 25, 30, 35 m3 m−3) were prepared in a cylindrical acrylic cell with a diameter of 220 mm and a height of 200 mm. To measure the TDR waveforms, the PTDR module was driven into the center of the specimen.
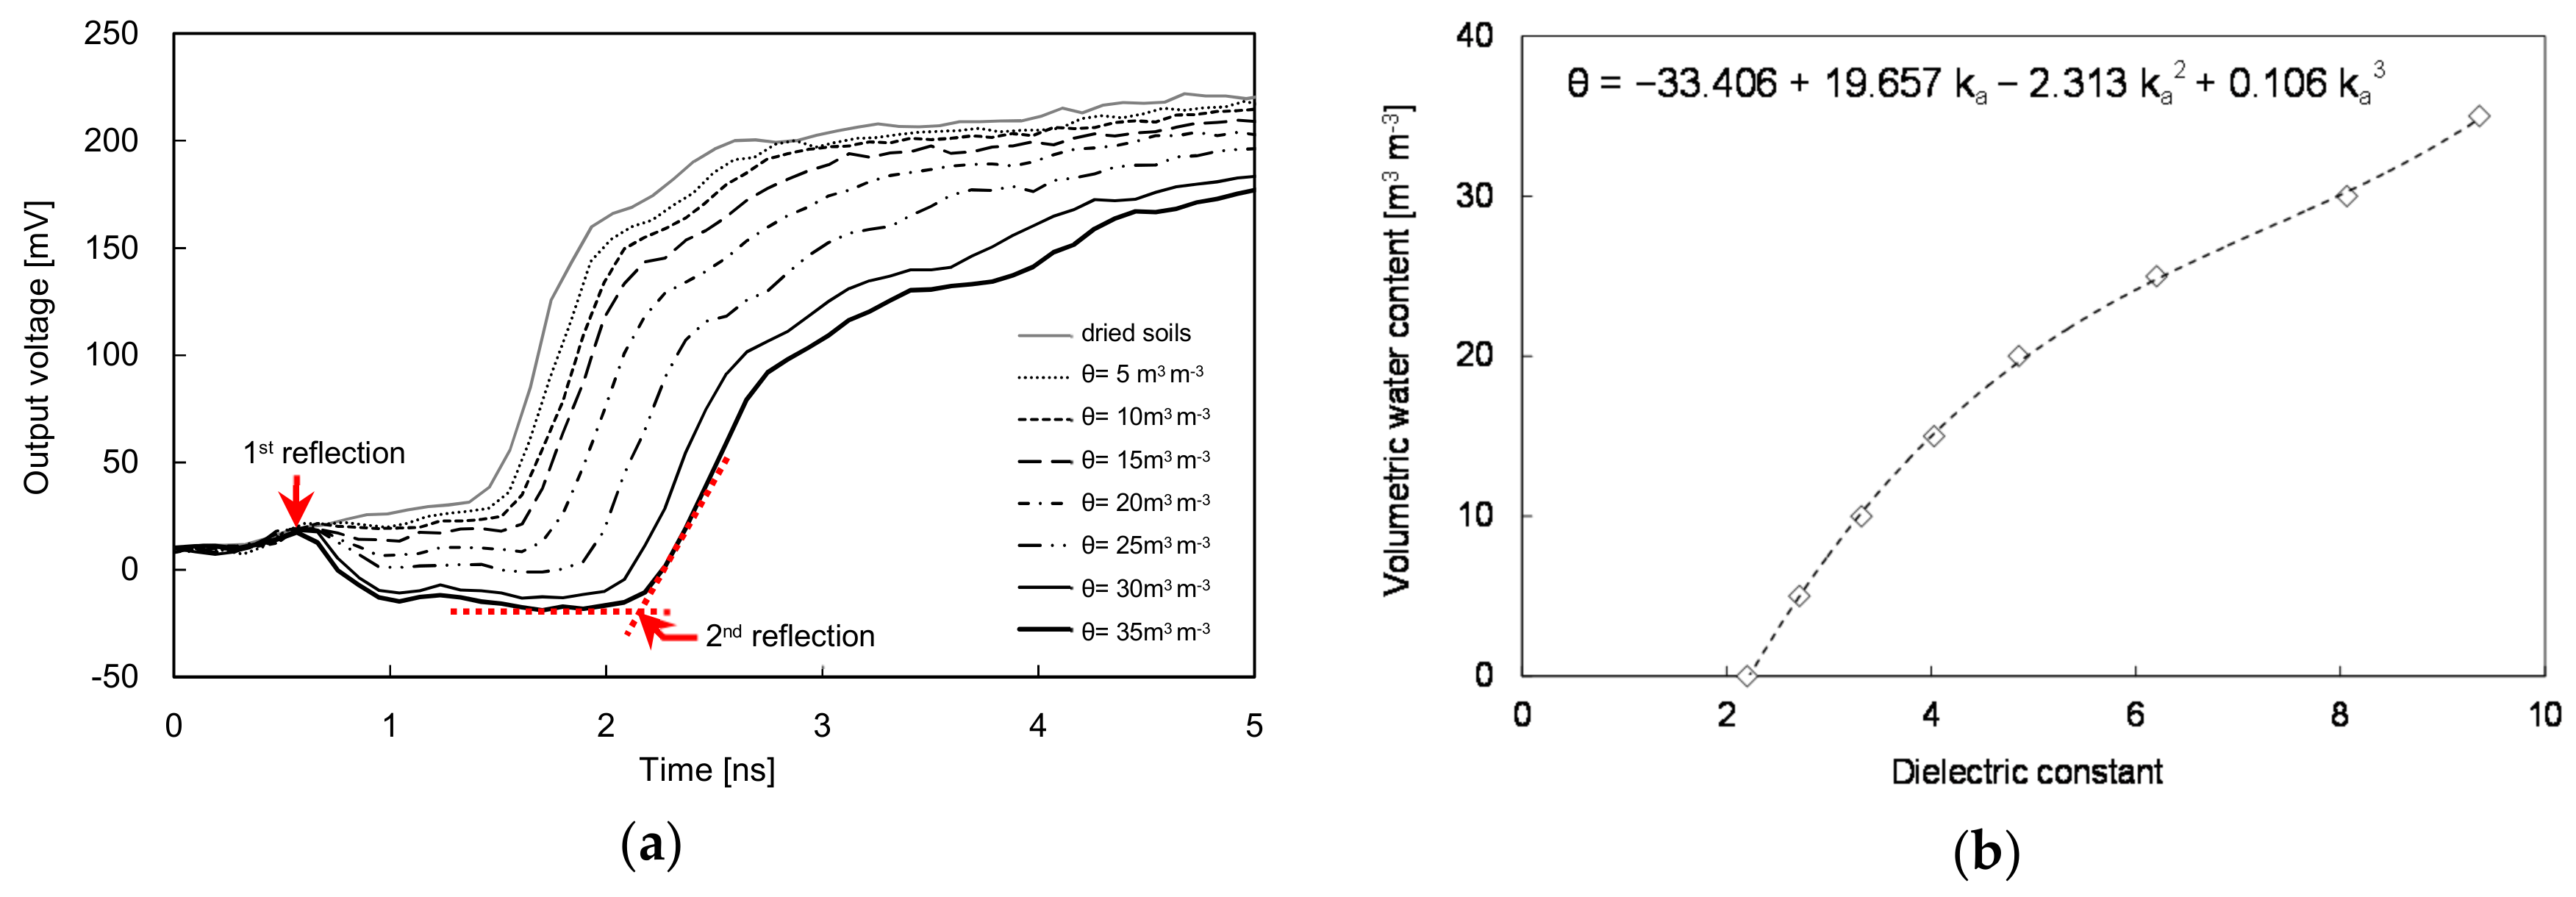
TDR waveforms measured by the PTDR module are plotted in Figure 5a for several specimens. The bump apex was determined as the first reflection point. For the determination of the second reflection point, the TDR waveforms were smoothed and then differentiated with respect to the travel time. After finding a maximum tangent line of the smoothed wave, the intersection of the tangent line with the horizontal line was selected as the second reflection point. The selection of the points was done manually. Then, the travel time (t) was determined as the time difference between the first and second reflection points. Figure 5a shows that the travel time of the reflected wave increased with the increase in the water content. The dielectric constant was determined from the travel time using Equation (1). A relationship between the dielectric constant (ka) obtained from the PTDR and the volumetric water content (θ) was then established by the least-square fitting, and can be represented as follows:
where a, b, c, and d are constants determined by the cubic polynomial regression models of dielectric constant and volumetric water content, which corresponded to −33.406, 19.657, −2.313, and 0.106, respectively, as shown in Figure 5b. Note that the calibration equation suggested by Topp et al. [11] was the same cubic polynomial equation as that obtained from this study, but with different constant values than those obtained from this study. In fact, the measured dielectric constant of 2.2 for the dried soil in this study represents the result of combining each dielectric constant of the soil particle, epoxy, and MC nylon of the PTDR module [43]. The values of the dielectric constant ranging from 2.2 to 9.4 in the specimens with different water contents were similar to the typical values of dielectric constants of soil particle, epoxy, and MC nylon when compared to that of water. Note that the water and soil particles can only be placed on one side of the electrodes, whereas three sides of the electrodes are enclosed with the epoxy and MC nylon.
3.3. Temperature Effect
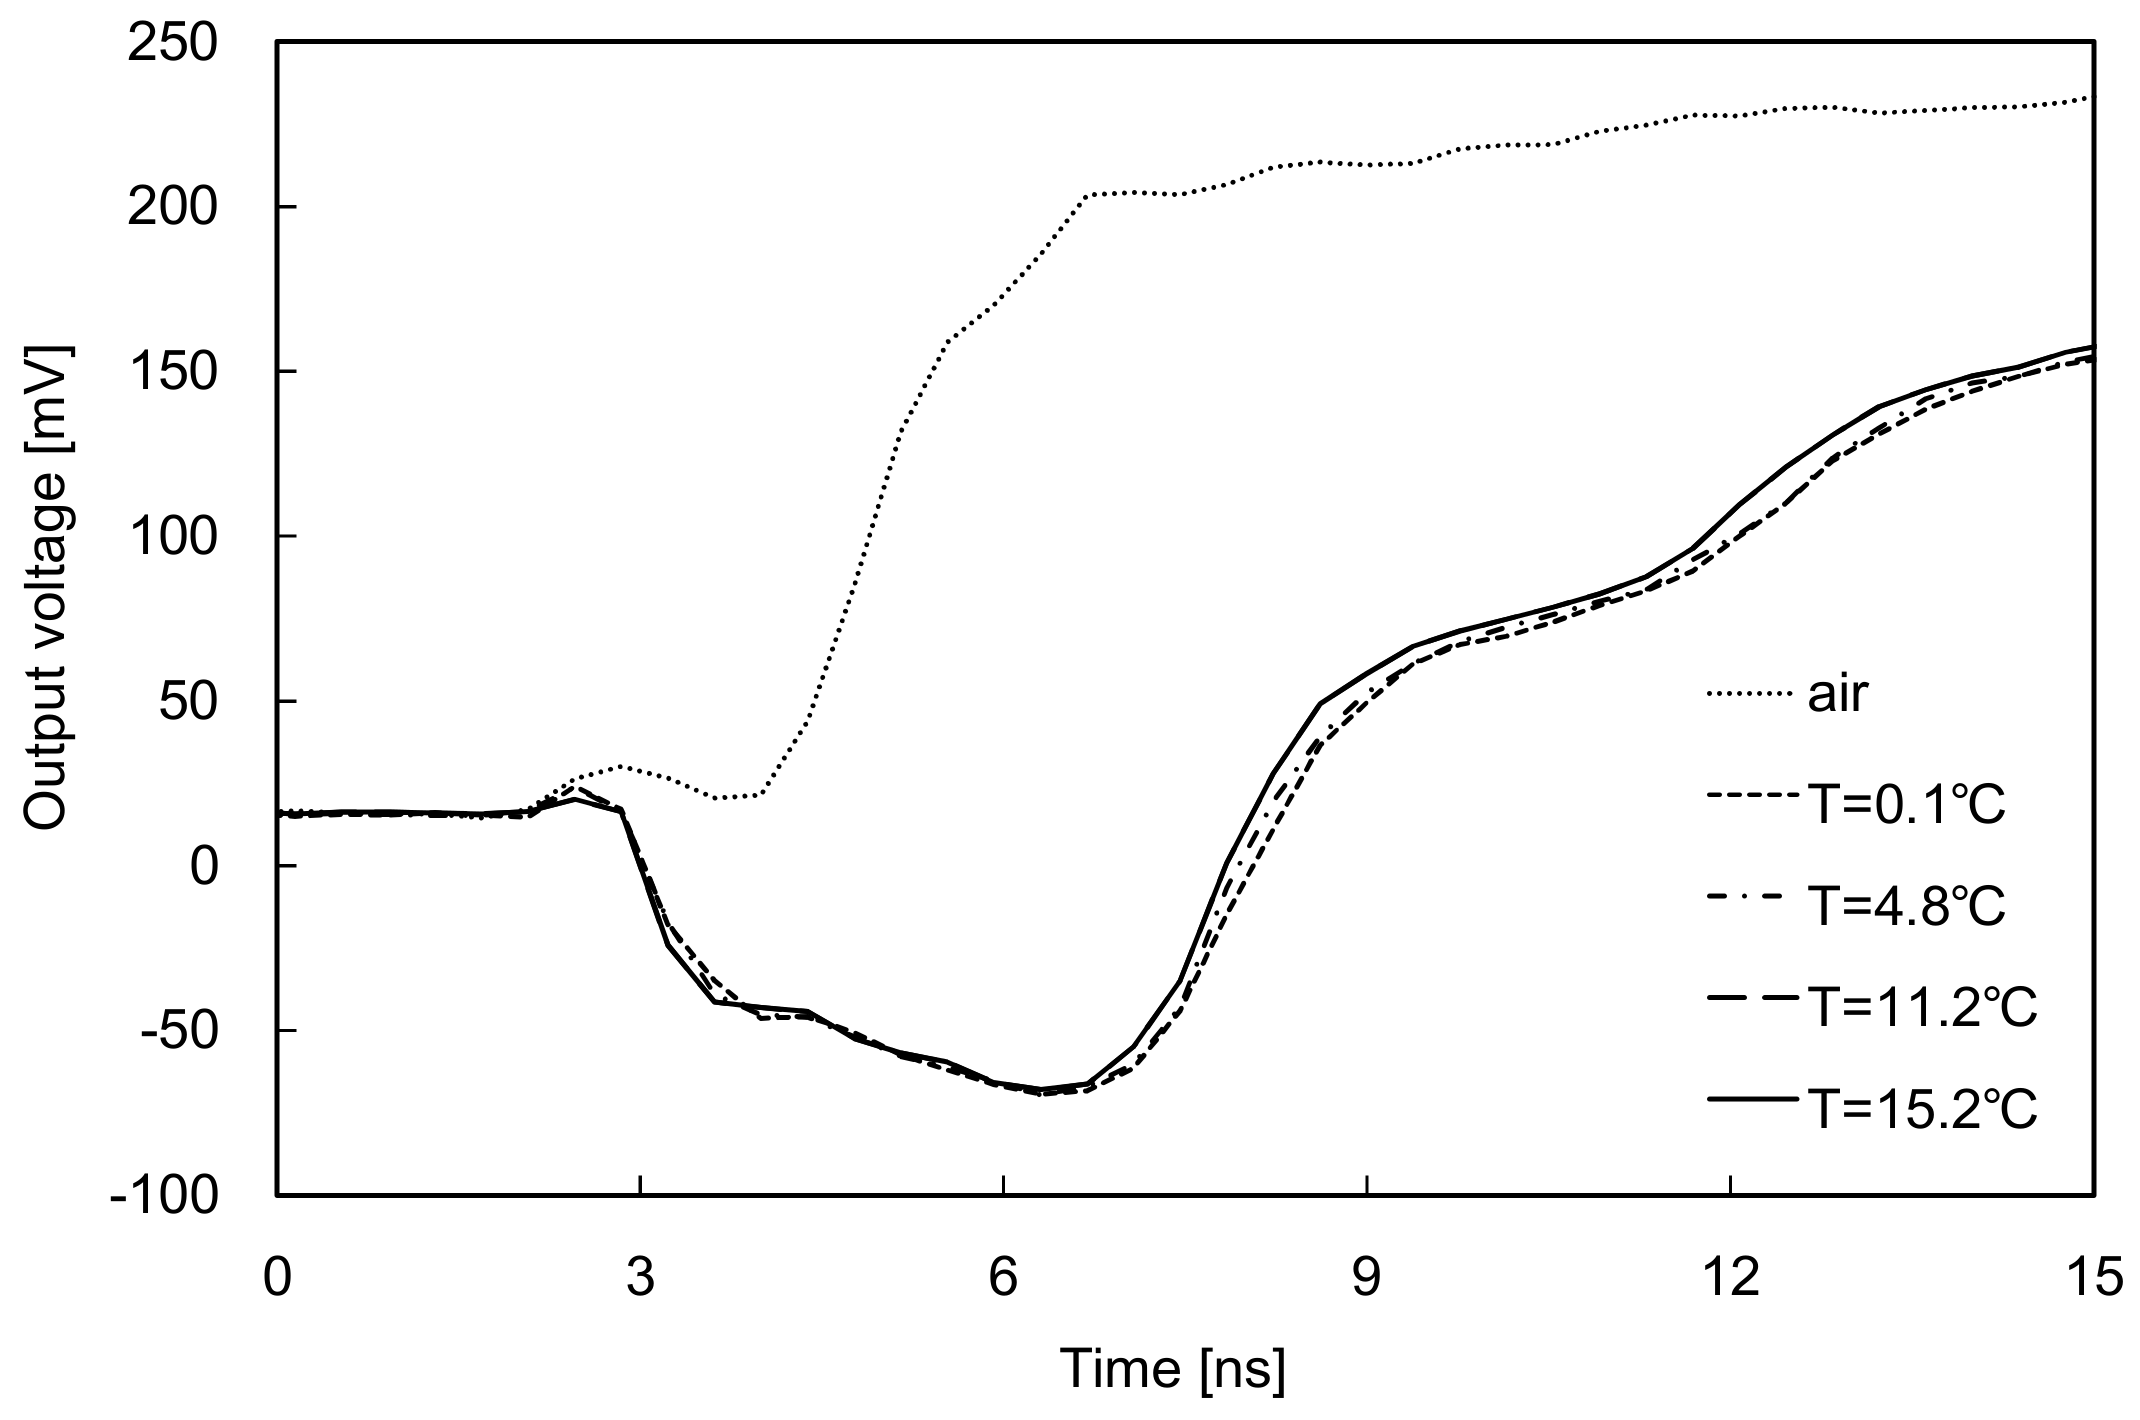
To investigate the effect of temperature on the dielectric constants obtained from the PTDR, the PTDR module was submerged in distilled water in a plastic cylindrical tank with a 500 mm diameter. The temperature of distilled water was changed, ranging from 0.1 to 15.2 °C, based on the annual subsurface temperature of the study site reported by Byun et al. [36]. Figure 6 shows that the second reflection of the waveform in water obtained from the PTDR became more rounded when compared to the typical waveforms obtained from conventional TDR probe. Considering the PTDR was connected to the short cable with 3 m length, the rounded waveform may not be affected by the cable length, but rather, can be affected by the physical construction of the PTDR module. The travel time between the first and second reflection in the water remained constant throughout the change of temperature. This means that temperature had a minor effect on the travel time determined in the time domain. It should be noted that this result was obtained by using PTDR, not a conventional TDR probe. Or and Wrath [44] showed that the dielectric constants of loamy sand changed with the change in temperature, but the dielectric constants almost remained constant in the range of temperature from 0 to 10 °C. According to the results by Or and Wrath [44], the variation in the dielectric constants of loamy sand was influenced more by water content than by temperature. Considering the temperature range measured at the site (0 to 6 °C), the effect of temperature in this study was not taken into account for the estimation of dielectric constant by the PTDR. The minor influence of temperature on the dielectric constant measurement makes the PTDR more accurate in the estimation of water content in the active layer.
4. Field Tests
4.1. PTDR Application
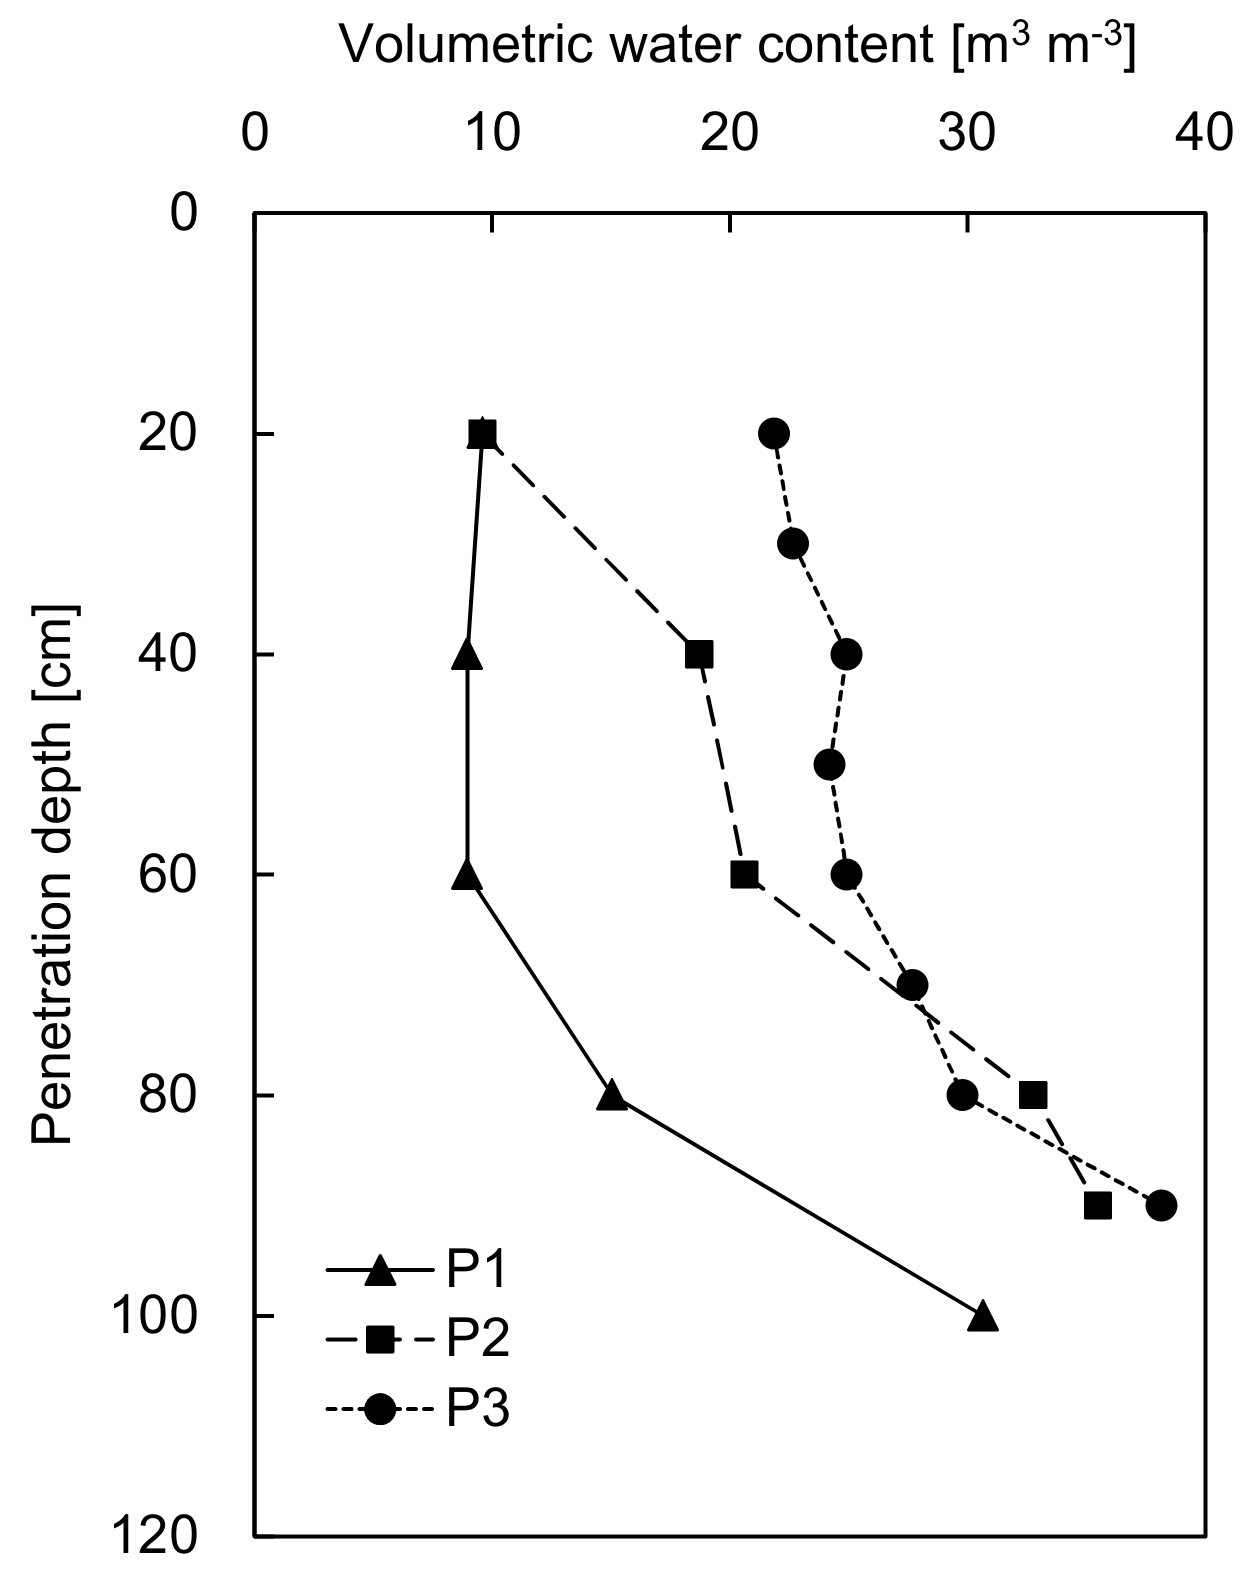
The field application tests using the PTDR were carried out at three different positions of the study site at Ny-Alesund, as shown in Figure 3. The PTDR was driven into the ground to a depth ranging from 20 cm to 100 cm. The middle of the electrodes was set as the measurement depth. To place the PTDR module at a certain depth, the hammer was dropped from different falling heights at each blow. The penetration depth was measured by a ruler attached to the connecting rod, as shown in Figure 1. At each depth, the TDR waveforms were recorded within 10 min after the penetration. Figure 7 shows the TDR waveforms recorded along the depth. For all TDR waveforms obtained at the three positions, the travel time increased with an increase in depth. The increasing rate and range of the travel time depend on the location at which the PTDR was driven into the ground. The dielectric constants calculated from the travel time by using Equation (1) ranged from 3.2 to 10.1, which are similar to the typical dielectric constant values of unsaturated soils measured by a conventional TDR probe [11]. At P1, the dielectric constant (ka ≈ 3) remained constant up to a depth of 60 cm, after which it increased up to 8.2. At P2 and P3, the dielectric constants increased as the depth increased. In the shallow depth, the dielectric constants at P3 were greater than those at P2.
Figure 8 shows the profile of the volumetric water content estimated from Equation (2). The volumetric water contents ranged from 9.0 to 38.2 m3 m−3, which were similar to the range of volumetric water contents monitored near the study site during summer [45]. The high water content at the bottom of the active layer was considered to have originated from the melting ice lens and from the impermeability of the permafrost. After the PTDR was driven at P3 to the depth of 90 cm and extracted, the depth of the water table was measured directly through the penetrated hole at a depth of 80 cm. Unsurprisingly, the volumetric water content greater than 30 m3 m−3 at a depth of 80 cm at P2 and P3 was close to the degree of saturation of 100%. The temperature profile measured by the PTDR is plotted in Figure 9, and compared to the temperature profiles monitored by using thermocouples embedded in the same site reported by Byun et al. [36]. The subsurface temperature measured by the PTDR decreased with an increase in depth, and the temperature at a depth of 90 cm reached 1 °C. This implies that the active layer was within a depth range of 20 to 90 cm at the study site.
4.2. Electrical Resistivity Survey
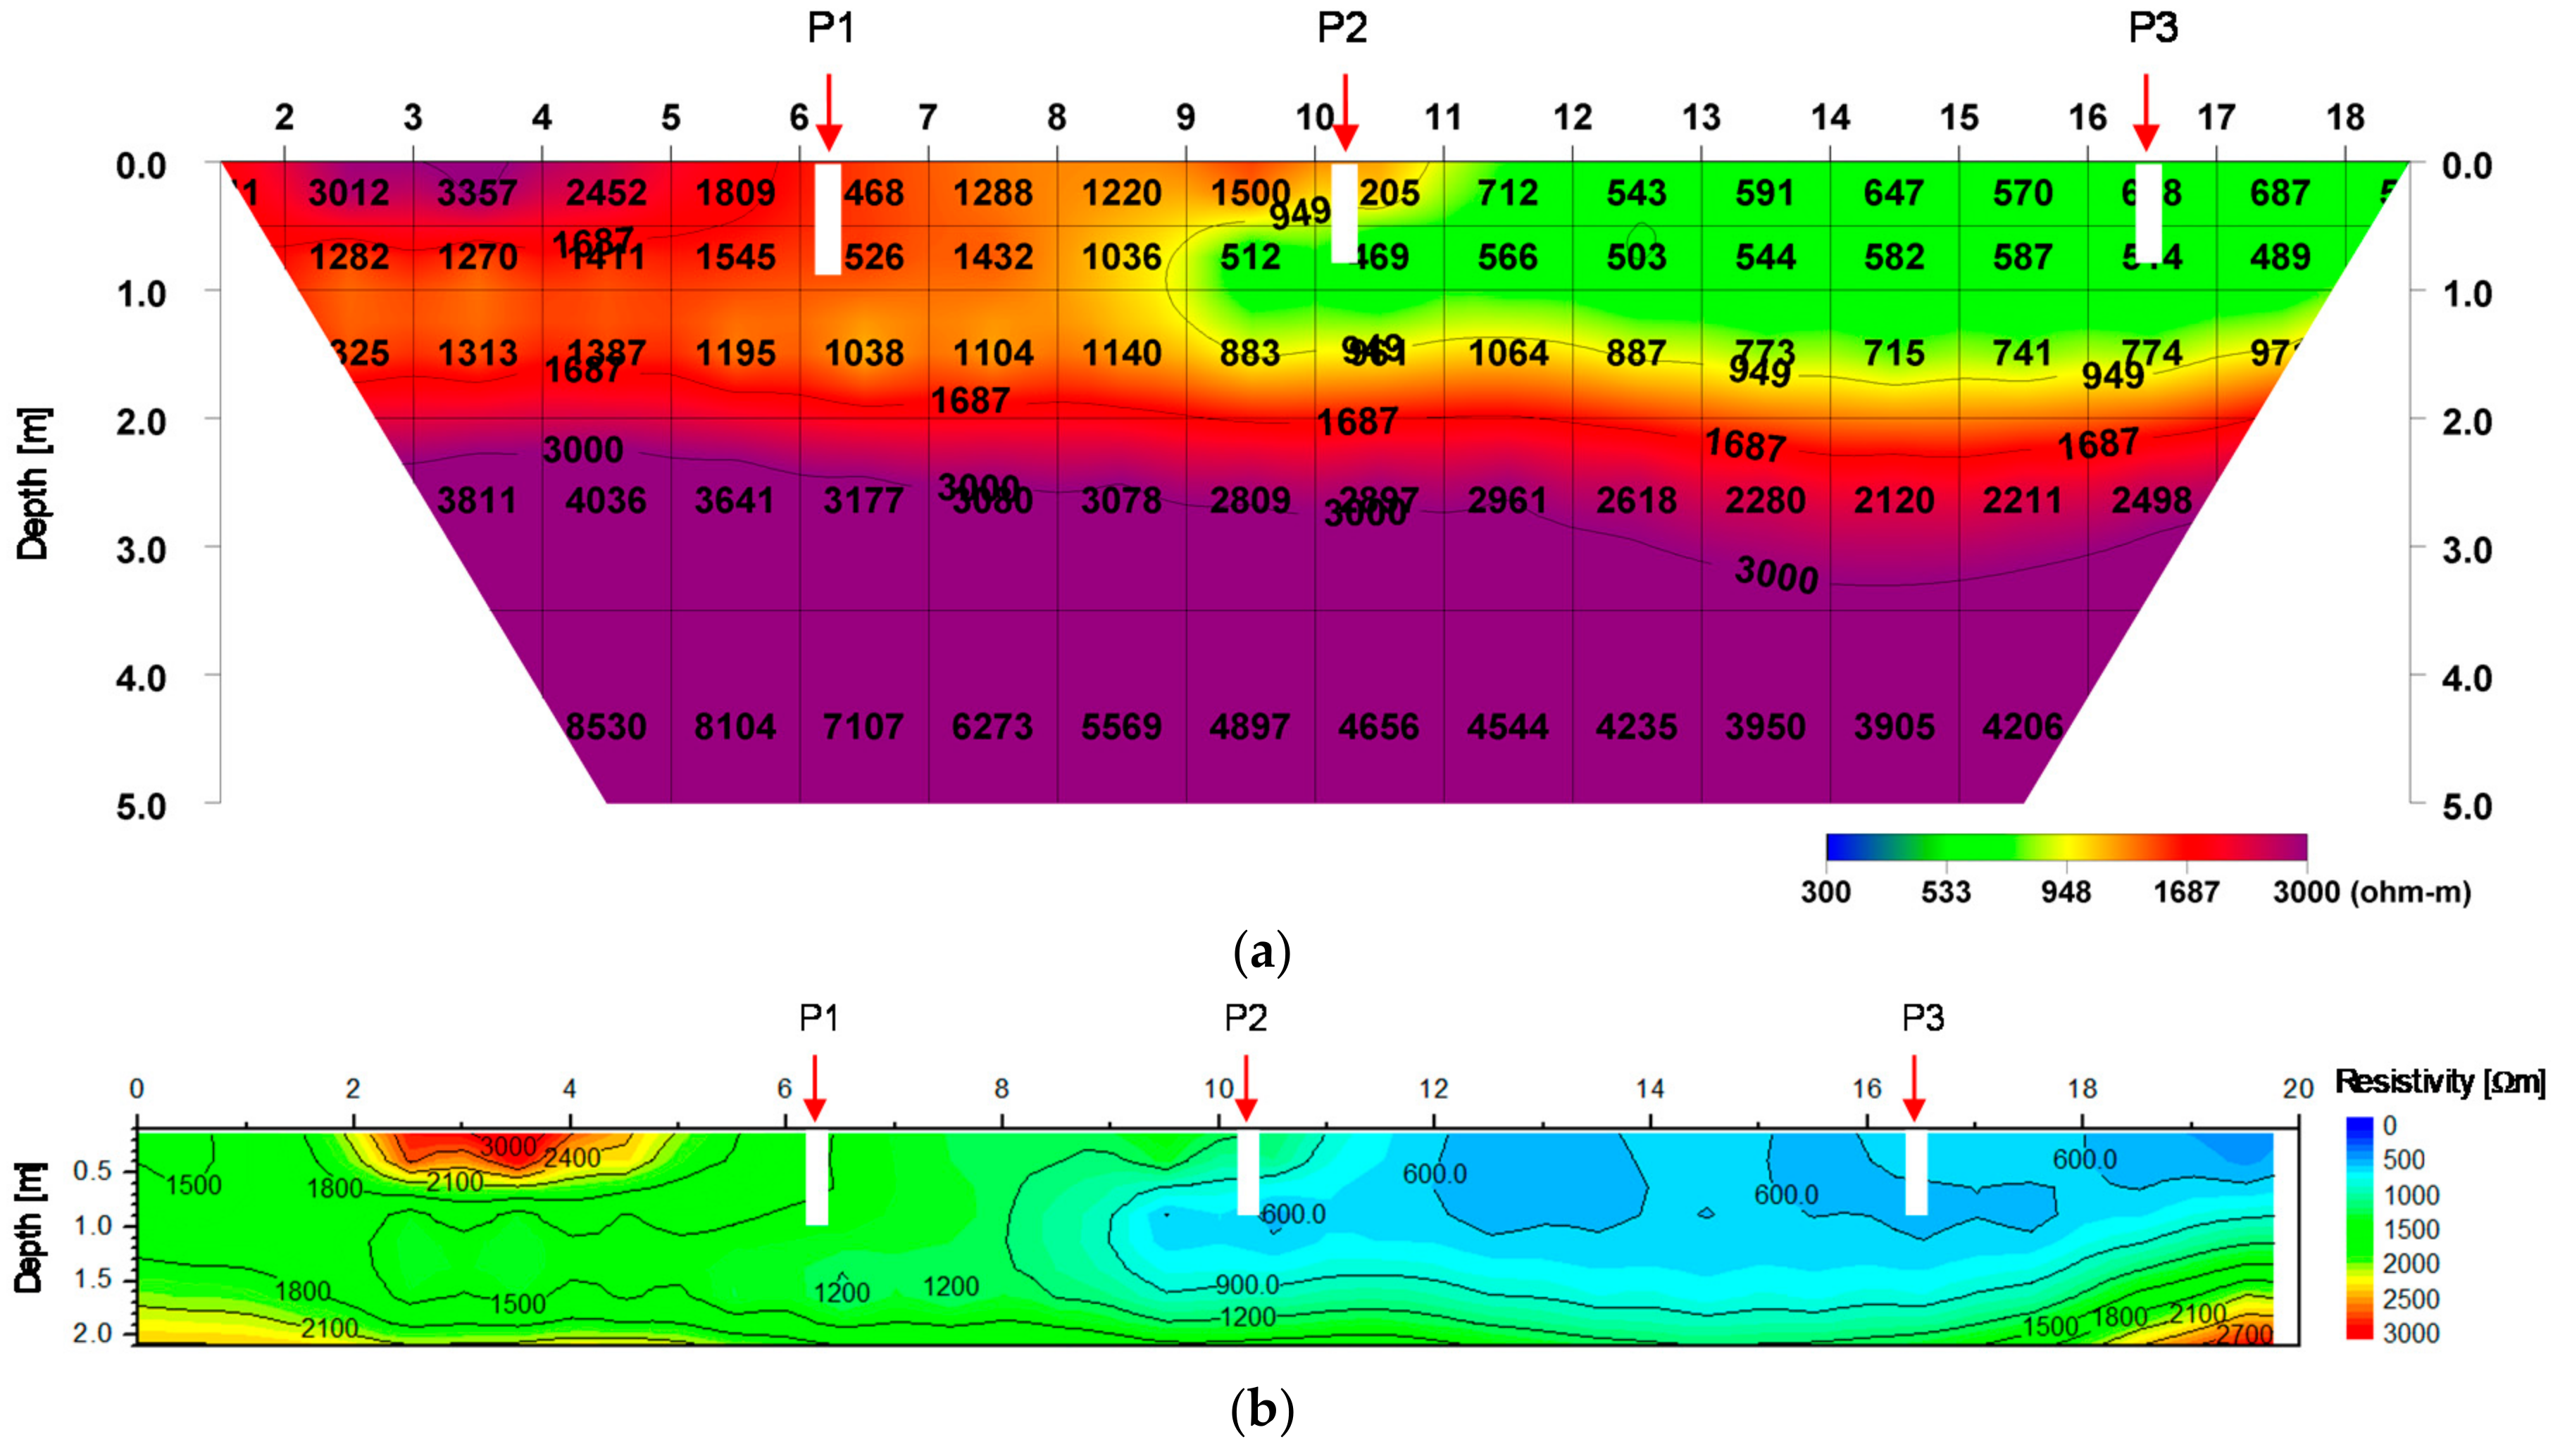
Electrical resistivity has been used as an indicator to represent the spatial and temporal variability of soil properties. The electrical resistivity is known to be affected by the porosity, salinity, clay content, and water content. Among the factors that control the electrical resistivity of bulk soil, the electrical conductivity of pore water and the water content are the main factors. An electrical resistivity survey performed on the ground surface has the advantage of providing the continuous resistivity profile of greater volumes of soil [46]. On the other hand, while the TDR method is applied to a position, it is more accurate in determining the water content of soil compared to the electrical resistivity survey.
The electrical resistivity survey was conducted at the same site along the positions for the application of PTDR, as shown in Figure 3b. For the electrical resistivity measurement, twenty-one electrodes were used for a 20 m length at a 1 m spacing. The dipole–dipole array was selected to minimize the electromagnetic coupling between the current and potential circuits, and to detect the variance in horizontal electrical resistivity. Using the Sting R1 earth resistivity meter (Advanced Geosciences, Inc.), the electrical resistivity was manually measured to avoid recording the outlier from the dataset. Figure 10a shows the distribution of average apparent resistivity of a section obtained from the Dipro 2D inversion software [47]. The interpreted resistivity values obtained above the 2 m depth were generally lower than those obtained under the 2 m depth, as shown in Figure 10a. The high resistivity values of 3000 to 8000 Ω·m under the 2 m depth corresponded to the resistivity values of permafrost or rocks. Figure 10b shows the magnified resistivity tomogram within the 2 m depth with contour lines. Overall, the low resistivity values ranging from 600 to 1800 Ω·m within the 2 m depth were included in the range of the resistivity of tills, and the resistivity values around P1 were greater than those around P2 and P3. Considering that the subsurface temperatures of P2 and P3 exceeded 0 °C, it is clear that the values represent the apparent resistivity of the water and soils, excluding the possibility of the existence of ice. It should also be noted that the thaw depth of this site was estimated to be slightly deeper than 1 m, according to the soil temperature profile reported by the Alfred Wegener Institute for Polar and Marine Research (AWI) and the Polar Institute Paul Emile Victor (IPEV).
4.3. Correlation between θ and ρ
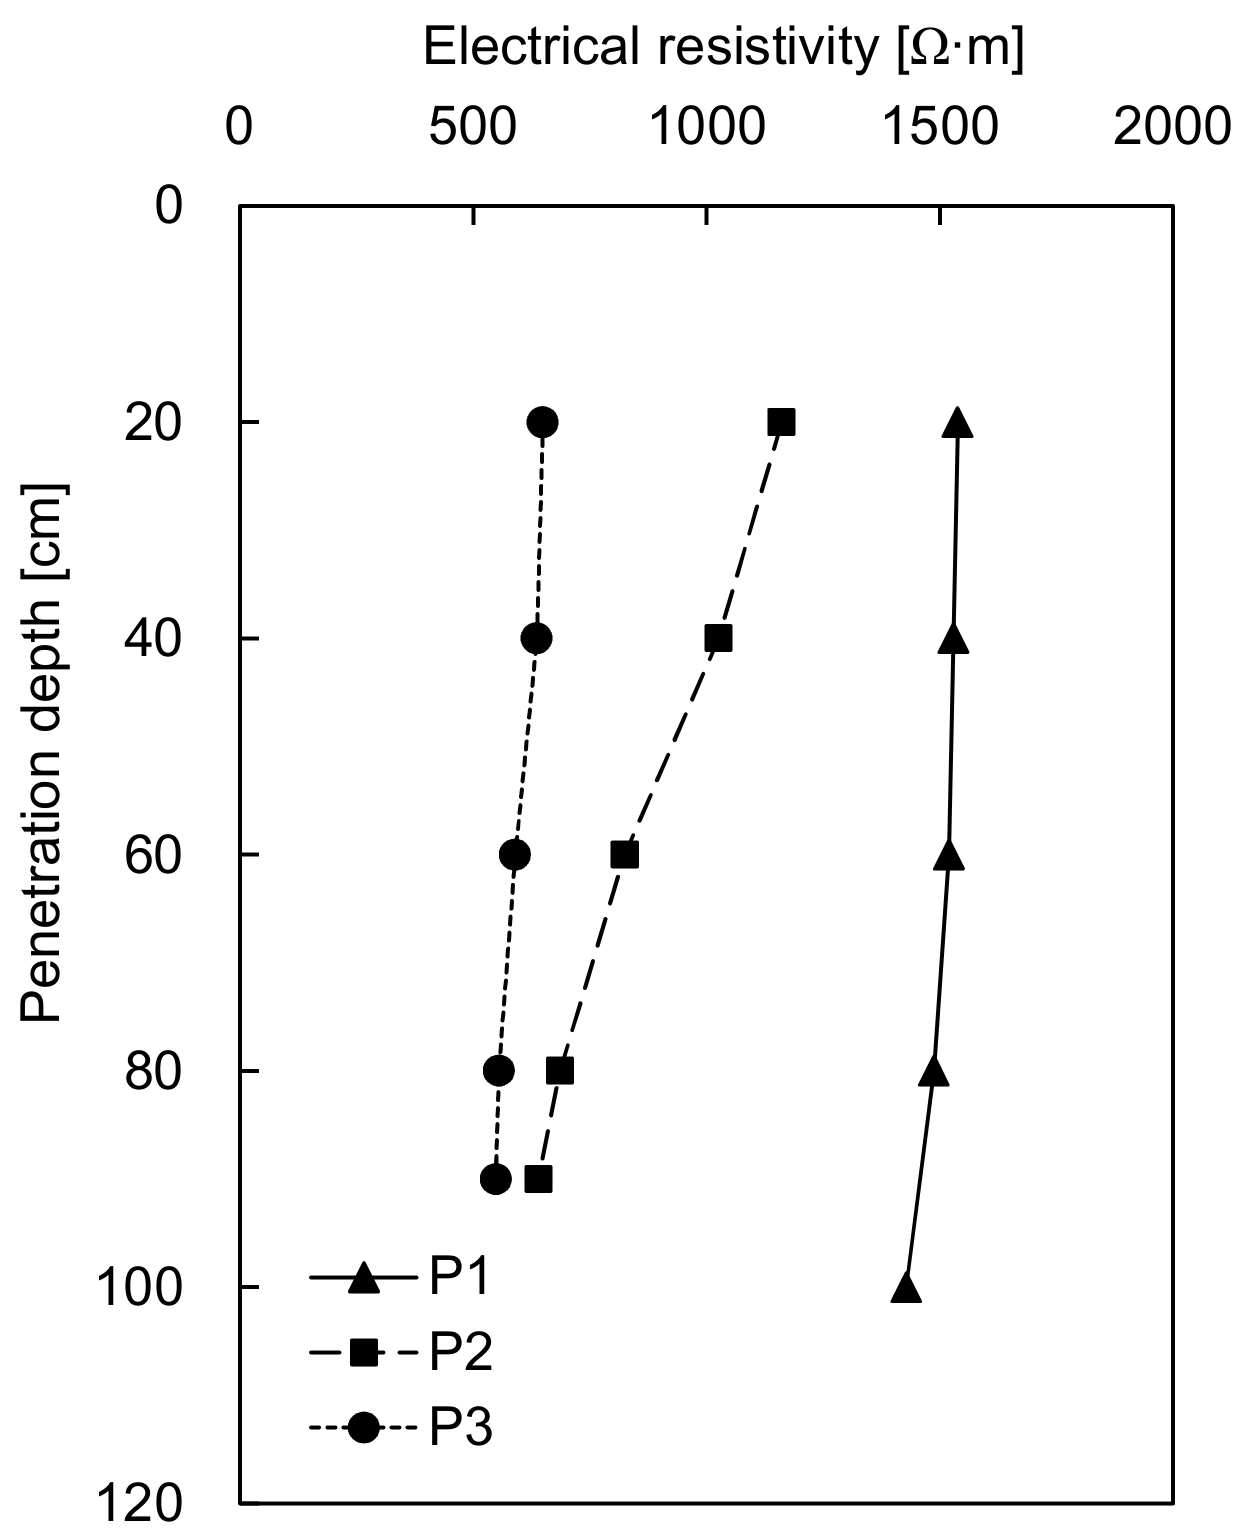
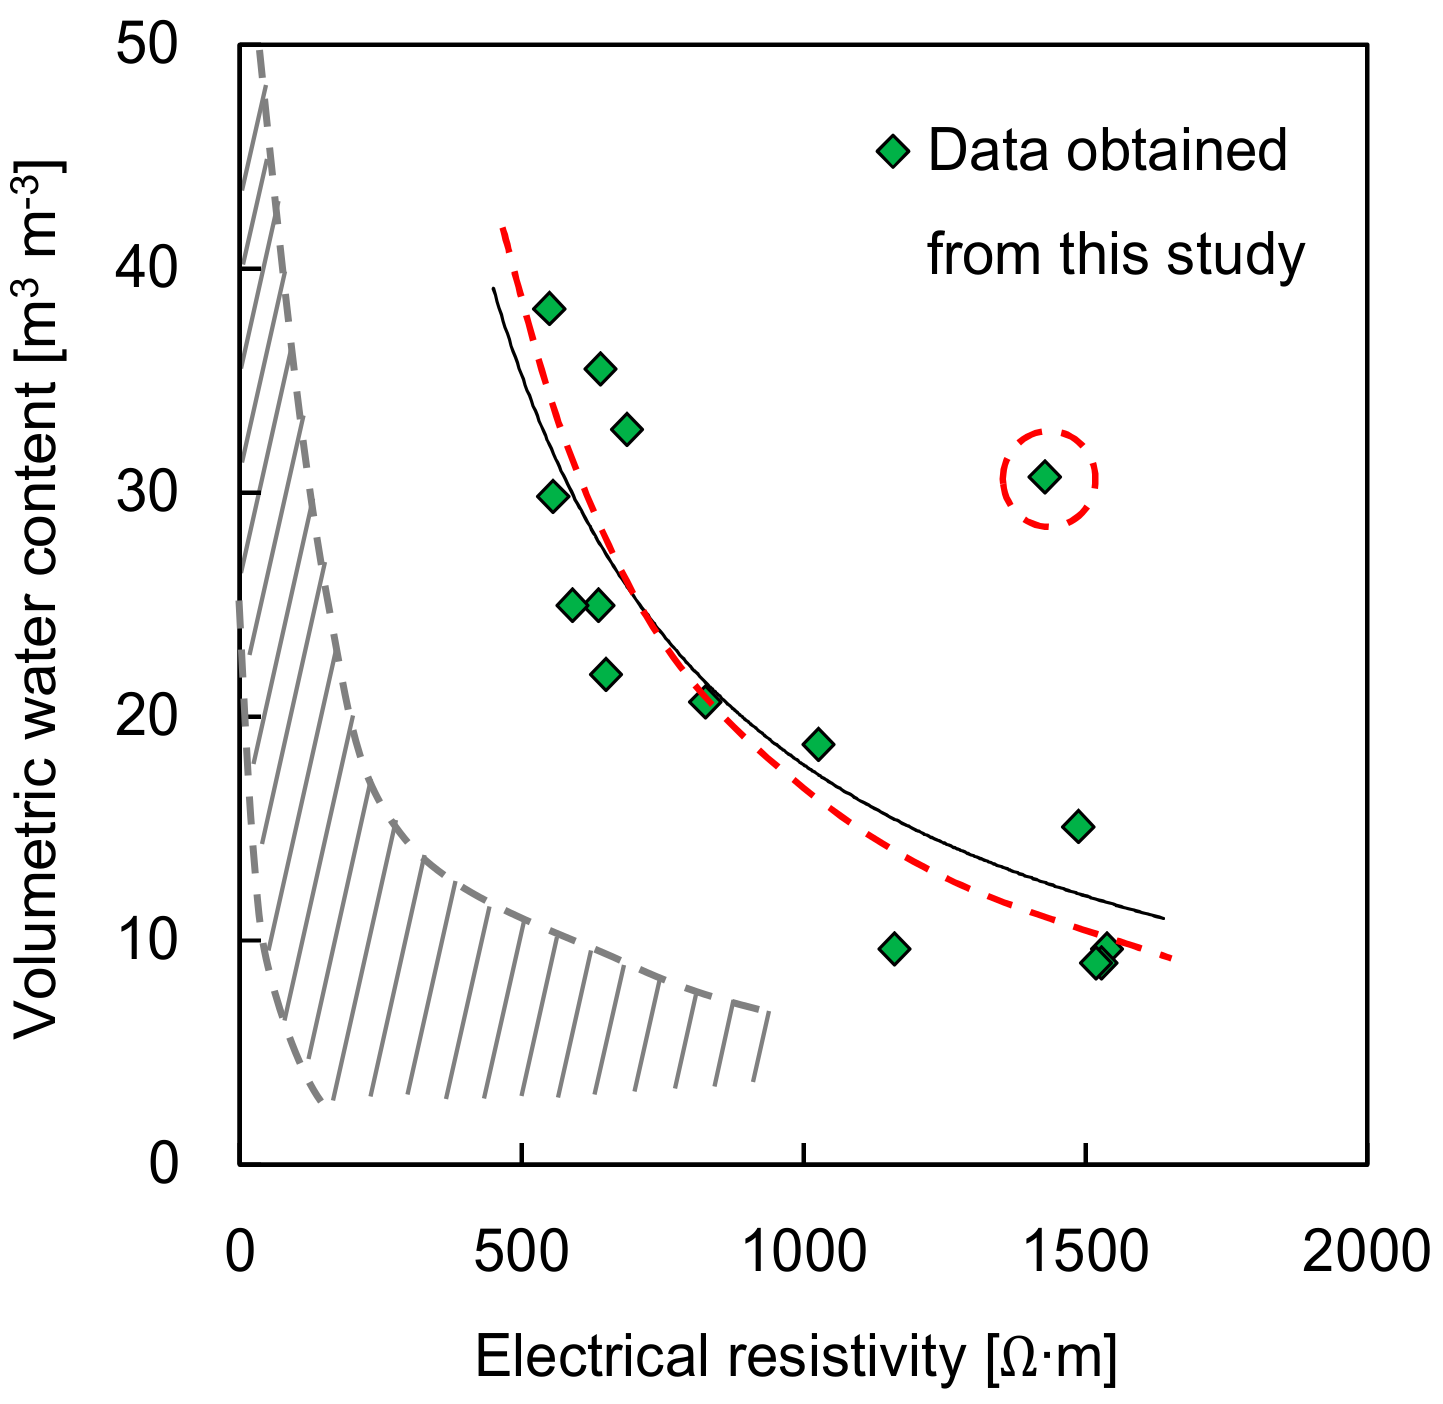
To investigate the resistivity variation with depth, the profiles of resistivity estimated at each position for PTDR are plotted in Figure 11. For the three positions, the resistivity values slightly decreased as the depth increased, and the variation in resistivity along the depth was significant at P2. To compare the apparent resistivity with the water content estimated by using PTDR, the data estimated at each depth is plotted in Figure 12. The volumetric water content decreased with an increase in the apparent resistivity. Thus, the relationship between the electrical resistivity () and the volumetric water content (θ) can be established by regression analysis as follows:
where a and b are constants determined by regression analysis, and the values of a and b are summarized in Table 2. Assuming that the resistivity value estimated at the 100 cm depth of P1 can be overestimated and disregarded from all of the data, the coefficient of determination of 0.61 increased to 0.84, while the standard deviation of regression decreased from 0.34 to 0.22. The results showed that the variation in volumetric water content estimated using PTDR closely correlated with the electrical resistivity distribution. Compared to the results of previous studies reported by Calamita et al. [48], the electrical resistivity measured at this site was greater, as most of the soil particles at this site were larger than 2 mm. Note that the grain size distribution of the soils at this site is similar to that reported by Byun et al. [36]. However, the relationship of the electrical resistivity and the volumetric water content should be carefully considered, given that the amount of data used for regression analysis was not sufficient, and the spacing among the electrodes was greater than the minimum distance between the two depths of the PTDR. Nevertheless, the results demonstrate that the electrical resistivity measured at this site was mainly affected by water content. After all, the water content profile at a position can be estimated by using the PTDR. Then, the water content distribution can be approximately estimated from using the PTDR and electrical resistivity survey. In short, the application of PTDR with electrical resistivity survey may become a promising technique for the evaluation of volumetric water content distribution in the active layer.
5. Summary and Conclusions
The existence of water in the active layer is a crucial factor in the process of heat transfer in global climate change and in geotechnical problems. In this study, the variation of water content in the active layer was characterized by the application of an advanced device as part of an in situ testing method.
Penetration-type TDR (PTDR), which can determine the dielectric constant of a material from the measurement of the travel time of electromagnetic waves, was developed for estimating the water content along the depth in the active layer. The PTDR comprised a PTDR module, connecting rods, and a guide with a hammer. The PTDR module, comprising three electrodes and a thermocouple, was designed as a tapered rectangle to improve the contact between the electrodes and soil. A guided hammer was mounted on the top of the PTDR for penetration into the soil. The co-axial cable soldered into the electrodes was connected to the TDR unit for detecting the reflection signals in the time domain.
Using the soils sampled at Ny-Alesund, the dielectric constants measured from PTDR were calibrated with the volumetric water content. For estimation of the volumetric water content from the dielectric constant measured by the PTDR, a relationship was established from the specimens prepared with different water contents. It was also found that temperature had a minor effect on the travel time determined in the time domain within a range of the measured subsurface temperature of the active layer.
Field application tests using PTDR were performed at three different positions of the Ny-Alesund site. As the PTDR penetrated the ground, electromagnetic waves and temperature were measured at each depth. The test results of the PTDR showed that the volumetric water content at the three different positions generally increased with an increase in depth. To compare with the water content profiles estimated from PTDR, an electrical resistivity survey was carried out at the same site. Although the variation in resistivity profiles depended on the position, the resistivity values decreased with an increase in depth. The relationship between the water content and resistivity was obtained from regression analysis, and the values of the coefficient of determination and standard deviation showed a consistency among the PTDR results. With its good mobility, PTDR can be effectively used to evaluate the water content distribution in the active layer.
Author Contributions
Y.-H.B., W.-T.H., and J.-S.L. designed the PTDR; Y.-H.B., W.-T.H., K.P., and S.S.H. performed the experiments; Y.-H.B., K.P., S.-H.L. and J.-S.L. analyzed the data; Y.-H.B. and J.-S.L. wrote the paper.
Funding
This work was supported by the National Research Foundation of Korea (NRF) grant funded by the Korea government (MSIP) (NRF-2017R1A2B3008466).
Conflicts of Interest
The authors declare no conflict of interest.
References
- Lachenbruch, A.H. Permafrost, the Active Layer, and Changing Climate; U.S. Geological Survey: Menlo Park, CA, USA, 1994. [Google Scholar]
- Nelson, F.E.; Lachenbruch, A.H.; Woo, M.-K.; Koster, E.A.; Osterkamp, T.E.; Gavrilova, M.K.; Guodong, C. Permafrost and Changing Climate. In Proceedings of the Sixth International Conference on Permafrost, Beijing, China, 5–9 July 1993; South China University of Technology: Wushan, Guangzhou, China, 1993. [Google Scholar]
- Boike, J.; Roth, K.; Overduin, P.P. Thermal and hydrologic dynamics of the active layer at a continuous permafrost site (Taymyr Peninsula, Siberia). Water Resour. Res. 1998, 34, 355–363. [Google Scholar] [CrossRef] [Green Version]
- Evett, S.R. Some aspects of time domain reflectometry, neutron scattering, and capacitance methods for soil water content measurement. In Proceedings of the International Atomic Energy Agency Symposium; International Atomic Energy Agency: Vienna, Austria, 2000; Volume 59, pp. 5–49. Available online: http://www.iaea.org/inis/collection/nclcollectionstore/_public/31/014/31014384.pdf#page=9 (accessed on 1 May 2018).
- Evett, S.R. Soil water measurement by neutron thermalization. Encyclopedia Water Sci. 2003, 889–893. [Google Scholar] [CrossRef]
- Tice, A.R.; Oliphant, J.L.; Nakano, Y.; Jenkins, T.F. Relationship between the Ice and Unfrozen Water Phases in Frozen Soil as Determined by Pulsed Nuclear Magnetic Resonance and Physical Desorption Data; No. CRREL-82-15; Cold Regions Research and Engineering Lab.: Hanover, NH, USA, 1982. [Google Scholar]
- Oliphant, J.L. A model for dielectric constants of frozen soils. In Freezing and Thawing of Soil-Water Systems; ASCE: New York, NY, USA, 1985; pp. 46–57. [Google Scholar]
- Black, P.B.; Tice, A.R. Comparison of soil freezing curve and soil water curve data for Windsor sandy loam. Water Resour. Res. 1989, 25, 2205–2210. [Google Scholar] [CrossRef]
- Reginato, R.J.; van Bavel, C.H.M. Soil Water Measurement with Gamma Attenuation 1. Soil Sci. Soc. Am. J. 1964, 28, 721–724. [Google Scholar] [CrossRef]
- Fellner-Feldegg, H. Measurement of dielectrics in the time domain. J. Phys. Chem. 1969, 73, 616–623. [Google Scholar] [CrossRef]
- Topp, G.C.; Davis, J.L.; Annan, A.P. Electromagnetic determination of soil water content: Measurements in coaxial transmission lines. Water Resour. Res. 1980, 16, 574–582. [Google Scholar] [CrossRef]
- Patterson, D.E.; Smith, M.W. The measurement of frozen water content by time domain reflectometry: Results from laboratory tests. Can. Geotech. J. 1981, 18, 131–144. [Google Scholar] [CrossRef]
- Topp, G.C.; Davis, J.L.; Annan, A.P. Electromagnetic determination of soil water content using TDR: II. Evaluation of installation and configuration of parallel transmission lines. Soil Sci. Soc. Am. J. 1982, 46, 678–684. [Google Scholar] [CrossRef]
- Smith, M.W.; Patterson, D.E. Determining the unfrozen water content in soils by time-domain reflectometry. Atmos.-Ocean 1984, 22, 261–263. [Google Scholar] [CrossRef]
- Topp, G.C.; Davis, J.L.; Bailey, W.G.; Zebchuk, W.D. The measurement of soil water content using a portable TDR hand probe. Can. J. Soil Sci. 1984, 64, 313–321. [Google Scholar] [CrossRef]
- Dasberg, S.; Dalton, F.N. Time domain reflectometry field measurements of soil water content and electrical conductivity. Soil Sci. Soc. Am. J. 1985, 49, 293–297. [Google Scholar] [CrossRef]
- Topp, G.C.; Davis, J.L. Measurement of soil water content using time-domain reflectometry (TDR): A field evaluation. Soil Sci. Soc. Am. J. 1985, 49, 19–24. [Google Scholar] [CrossRef]
- Drungil, C.E.C.; Abt, K.; Gish, T.J. Soil moisture determination in gravely soils with time domain reflectometry. Trans. ASAE 1989, 32, 177–180. [Google Scholar] [CrossRef]
- Hong, W.T.; Jung, Y.S.; Kang, S.; Lee, J.S. Estimation of soil-water characteristic curves in multiple-cycles using membrane and TDR system. Materials 2016, 9, 1019. [Google Scholar] [CrossRef] [PubMed]
- Skierucha, W.; Wilczek, A. A FDR sensor for measuring complex soil dielectric permittivity in the 10–500 MHz frequency range. Sensors 2010, 10, 3314–3329. [Google Scholar] [CrossRef] [PubMed]
- Wilczek, A.; Szypłowska, A.; Skierucha, W.; Cieśla, J.; Pichler, V.; Janik, G. Determination of Soil Pore Water Salinity Using an FDR Sensor Working at Various Frequencies up to 500 MHz. Sensors 2012, 12, 10890–10905. [Google Scholar] [CrossRef] [PubMed] [Green Version]
- Topp, G.C.; St-Amour, G.; Compton, B.A. Measuring cone resistance and water content with a TDR-penetrometer combination. In Proceedings of the 3rd Eastern Canada Soil Structure Workshop, Merrickville, ON, Canada, 21–22 August 1996; Volume 3, pp. 21–22. [Google Scholar]
- Young, G.D.; Adams, B.A.; Topp, G.C. A portable data collection system for simultaneous cone penetrometer force and volumetric soil water content measurements. Can. J. Soil Sci. 2000, 80, 23–31. [Google Scholar] [CrossRef] [Green Version]
- Nissen, H.H.; Moldrup, P.; Henriksen, K. High-resolution time domain reflectometry coil probe for measuring soil water content. Soil Sci. Soc. Am. J. 1998, 62, 1203–1211. [Google Scholar] [CrossRef]
- Vaz, C.M.P.; Hopmans, J.W. Simultaneous measurement of soil penetration resistance and water content with a combined penetrometer–TDR moisture probe. Soil Sci. Soc. Am. J. 2001, 65, 4–12. [Google Scholar] [CrossRef]
- Topp, G.C.; Lapen, D.R.; Edwards, M.J.; Young, G.D. Laboratory calibration, in-field validation and use of a soil penetrometer measuring cone resistance and water content. Vadose Zone J. 2003, 2, 633–641. [Google Scholar] [CrossRef]
- Kosugi, K.; Yamakawa, Y.; Masaoka, N.; Mizuyama, T. A combined penetrometer-moisture probe for surveying soil properties of natural hillslopes. Vadose Zone J. 2009, 8, 52–63. [Google Scholar] [CrossRef]
- Vaz, C.M.P.; Bassoi, L.H.; Hopmans, J.W. Contribution of water content and bulk density to field soil penetration resistance as measured by a combined cone penetrometer-TDR probe. Soil Tillage Res. 2001, 60, 35–42. [Google Scholar] [CrossRef]
- Lin, C.P.; Tang, S.H.; Chung, C.C. Development of TDR penetrometer through theoretical and laboratory investigations: 1. Measurement of soil dielectric permittivity. Geotech. Test. J. 2006, 29, 306–321. [Google Scholar]
- Miyamoto, T.; Fukami, K.; Chikushi, J. Simultaneous measurement of soil water and soil hardness using a modified time domain reflectometry probe and a conventional cone penetrometer. Soil Use Manag. 2012, 28, 240–248. [Google Scholar] [CrossRef]
- Maheshwarla, S.V.; Venkatasubramanian, R.; Boehm, R.F. Comparison of time domain reflectometry performance factors for several dielectric geometries: Theory and experiments. Water Resour. Res. 1995, 31, 1927–1933. [Google Scholar] [CrossRef]
- Baker, J.M.; Allmaras, R.R. System for automating and multiplexing soil moisture measurement by time-domain reflectometry. Soil Sci. Soc. Am. J. 1990, 54, 1–6. [Google Scholar] [CrossRef]
- Alharthi, A.; Lange, J. Soil water saturation: Dielectric determination. Water Resour. Res. 1987, 23, 591–595. [Google Scholar] [CrossRef]
- Ledieu, J.; De Ridder, P.; De Clerck, P.; Dautrebande, S. A method measuring soil water moisture by time-domain reflectometry. J. Hydrol. 1986, 88, 319–328. [Google Scholar] [CrossRef]
- Zegelin, S.J.; White, I.; Jenkins, D.R. Improved field probes for soil water content and electrical conductivity measurement using time domain reflectometry. Water Resour. Res. 1989, 25, 2367–2376. [Google Scholar] [CrossRef]
- Byun, Y.H.; Yoon, H.K.; Kim, Y.S.; Hong, S.S.; Lee, J.S. Active layer characterization by instrumented dynamic cone penetrometer in Ny-Alesund, Svalbard. Cold Reg. Sci. Technol. 2014, 104, 45–53. [Google Scholar] [CrossRef]
- Holtz, R.D.; Kovacs, W.D.; Sheahan, T.C. An Introduction to Geotechnical Engineering, 2nd ed.Prentice Hall: Englewood Cliffs, NJ, USA, 2011; 747p. [Google Scholar]
- BS 1377. Methods of Test for Soils for Civil Engineering Purposes: Part 2; British Standard Institution: London, UK, 1990. [Google Scholar]
- ASTM D4318. Standard test methods for liquid limit, plastic limit, and plasticity index of soils. In Annual Book of ASTM Standard 04.08; ASTM International: West Conshohocken, PA, USA, 2010. [Google Scholar]
- Roth, K.; Schulin, R.; Flühler, H.; Attinger, W. Calibration of time domain reflectometry for water content measurement using a composite dielectric approach. Water Resour. Res. 1990, 26, 2267–2273. [Google Scholar] [CrossRef]
- Lide, D.R. CRC Handbook of Chemistry and Physics, 77th ed.; CRC Press: Boca Raton, FL, USA, 1996. [Google Scholar]
- Yu, C.; Warrick, W.; Conklin, M.H. Derived functions of time domain reflectometry for soil mois ture measurements. Water Resour. Res. 1999, 35, 1789–1796. [Google Scholar] [CrossRef]
- Ferré, P.A.; Knight, J.H.; Rudolph, D.L.; Kachanoski, R.G. The sample area of conventional and alternative time domain reflectometry probes, Water Resour. Res. 1998, 34, 2971–2979. [Google Scholar]
- Or, D.; Wraith, J.M. Temperature effects on soil bulk dielectric permittivity measured by time domain reflectometry: A physical model. Water Resour. Res. 1999, 35, 371–383. [Google Scholar] [CrossRef] [Green Version]
- Roth, K.; Boike, J. Quantifying the thermal dynamics of a permafrost site near Ny-Ålesund, Svalbard. Water Resour. Res. 2001, 37, 2901–2914. [Google Scholar] [CrossRef] [Green Version]
- Salako, A.O.; Adepelumi, A.A. Evaluation of hydraulic conductivity of subsoil using electrical resistivity and ground penetrating radar data: Example from Southwestern Nigeria. Int. J. Geo-Eng. 2016, 7. [Google Scholar] [CrossRef]
- Kim, J.H. Dipro for Windows v. 4.0 Manual; HeeSong-Geotech: Daejeon, Korea, 1996. [Google Scholar]
- Calamita, G.; Brocca, L.; Perrone, A.; Piscitelli, S.; Lapenna, V.; Melone, F.; Moramarco, T. Electrical resistivity and TDR methods for soil moisture estimation in central Italy test-sites. J. Hydrol. 2012, 454, 101–112. [Google Scholar] [CrossRef]
Figure 1.
Schematic drawing of PTDR connected to the measurement system.
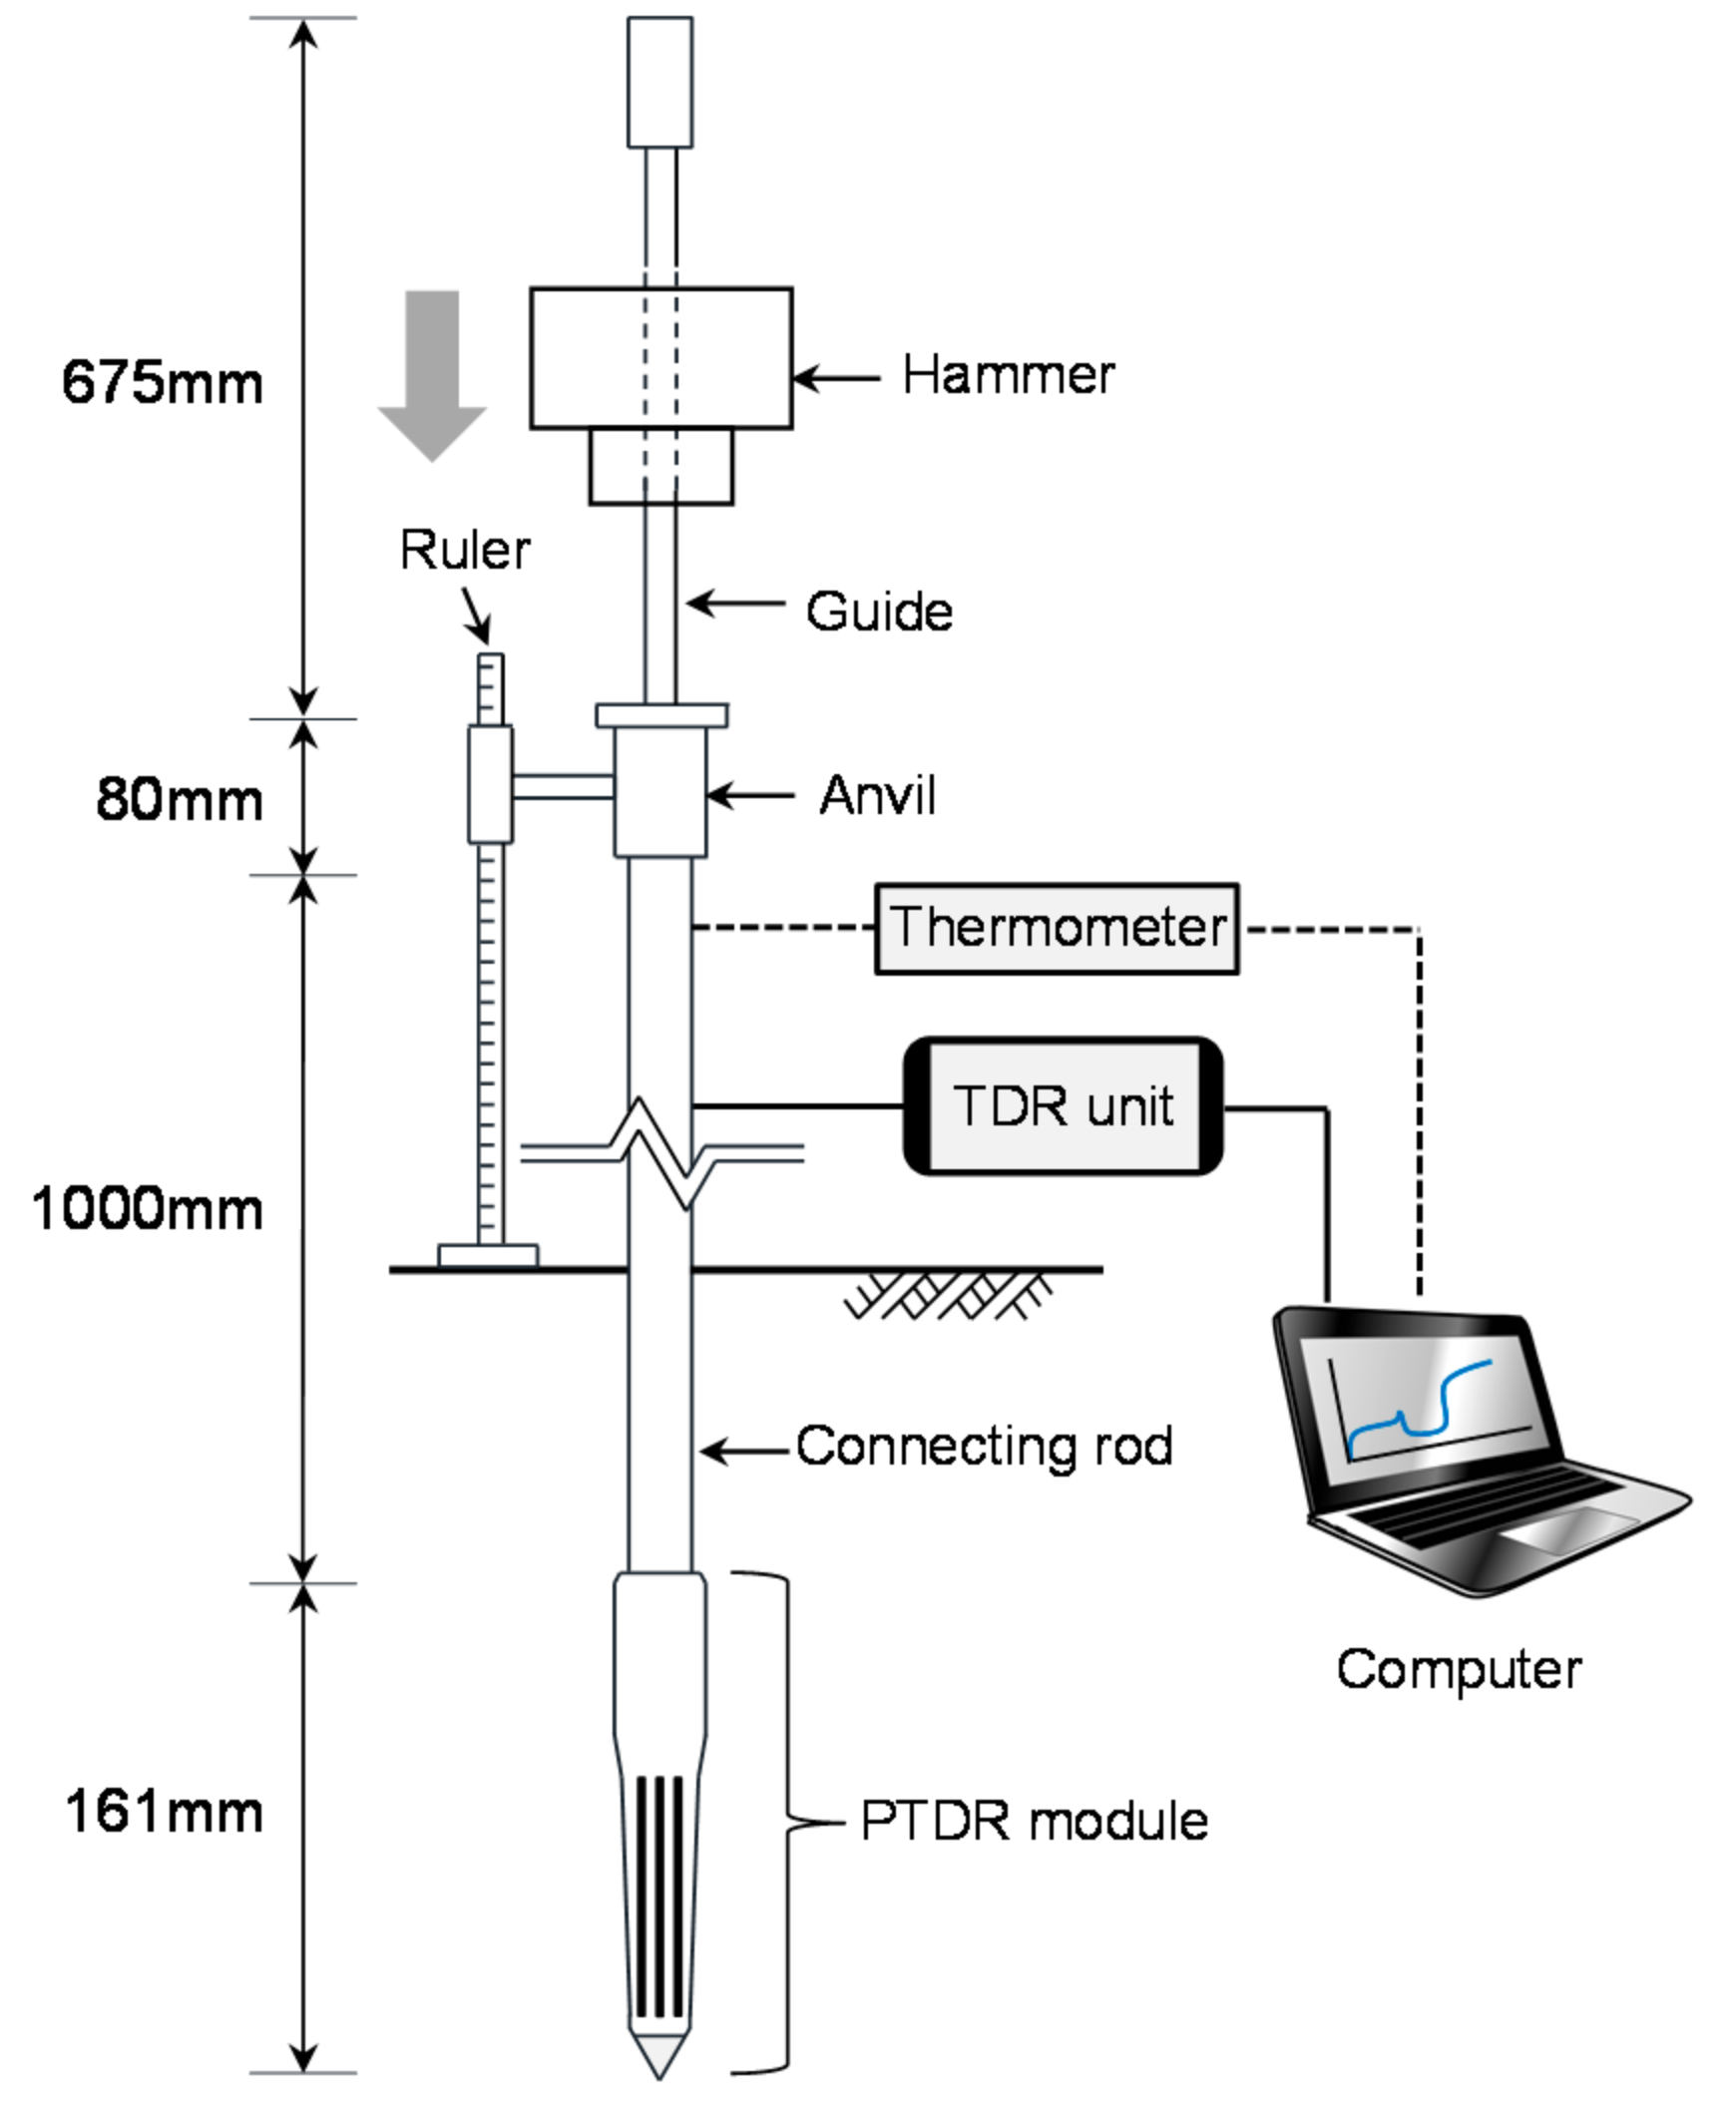
Figure 2.
Schematic drawing of the PTDR module: (a) top view; (b) side view. The units are in millimeters. The thickness of the electrodes is 1.5 mm.
Figure 2.
Schematic drawing of the PTDR module: (a) top view; (b) side view. The units are in millimeters. The thickness of the electrodes is 1.5 mm.

Figure 3.
Maps of the study area: (a) for Ny-Alesund research district; (b) enlarged for the location of the field test. P1, P2, and P3 denote the three different positions. PTDR and ERT indicate the tested positions of PTDR application and electrical resistivity testing.
Figure 3.
Maps of the study area: (a) for Ny-Alesund research district; (b) enlarged for the location of the field test. P1, P2, and P3 denote the three different positions. PTDR and ERT indicate the tested positions of PTDR application and electrical resistivity testing.
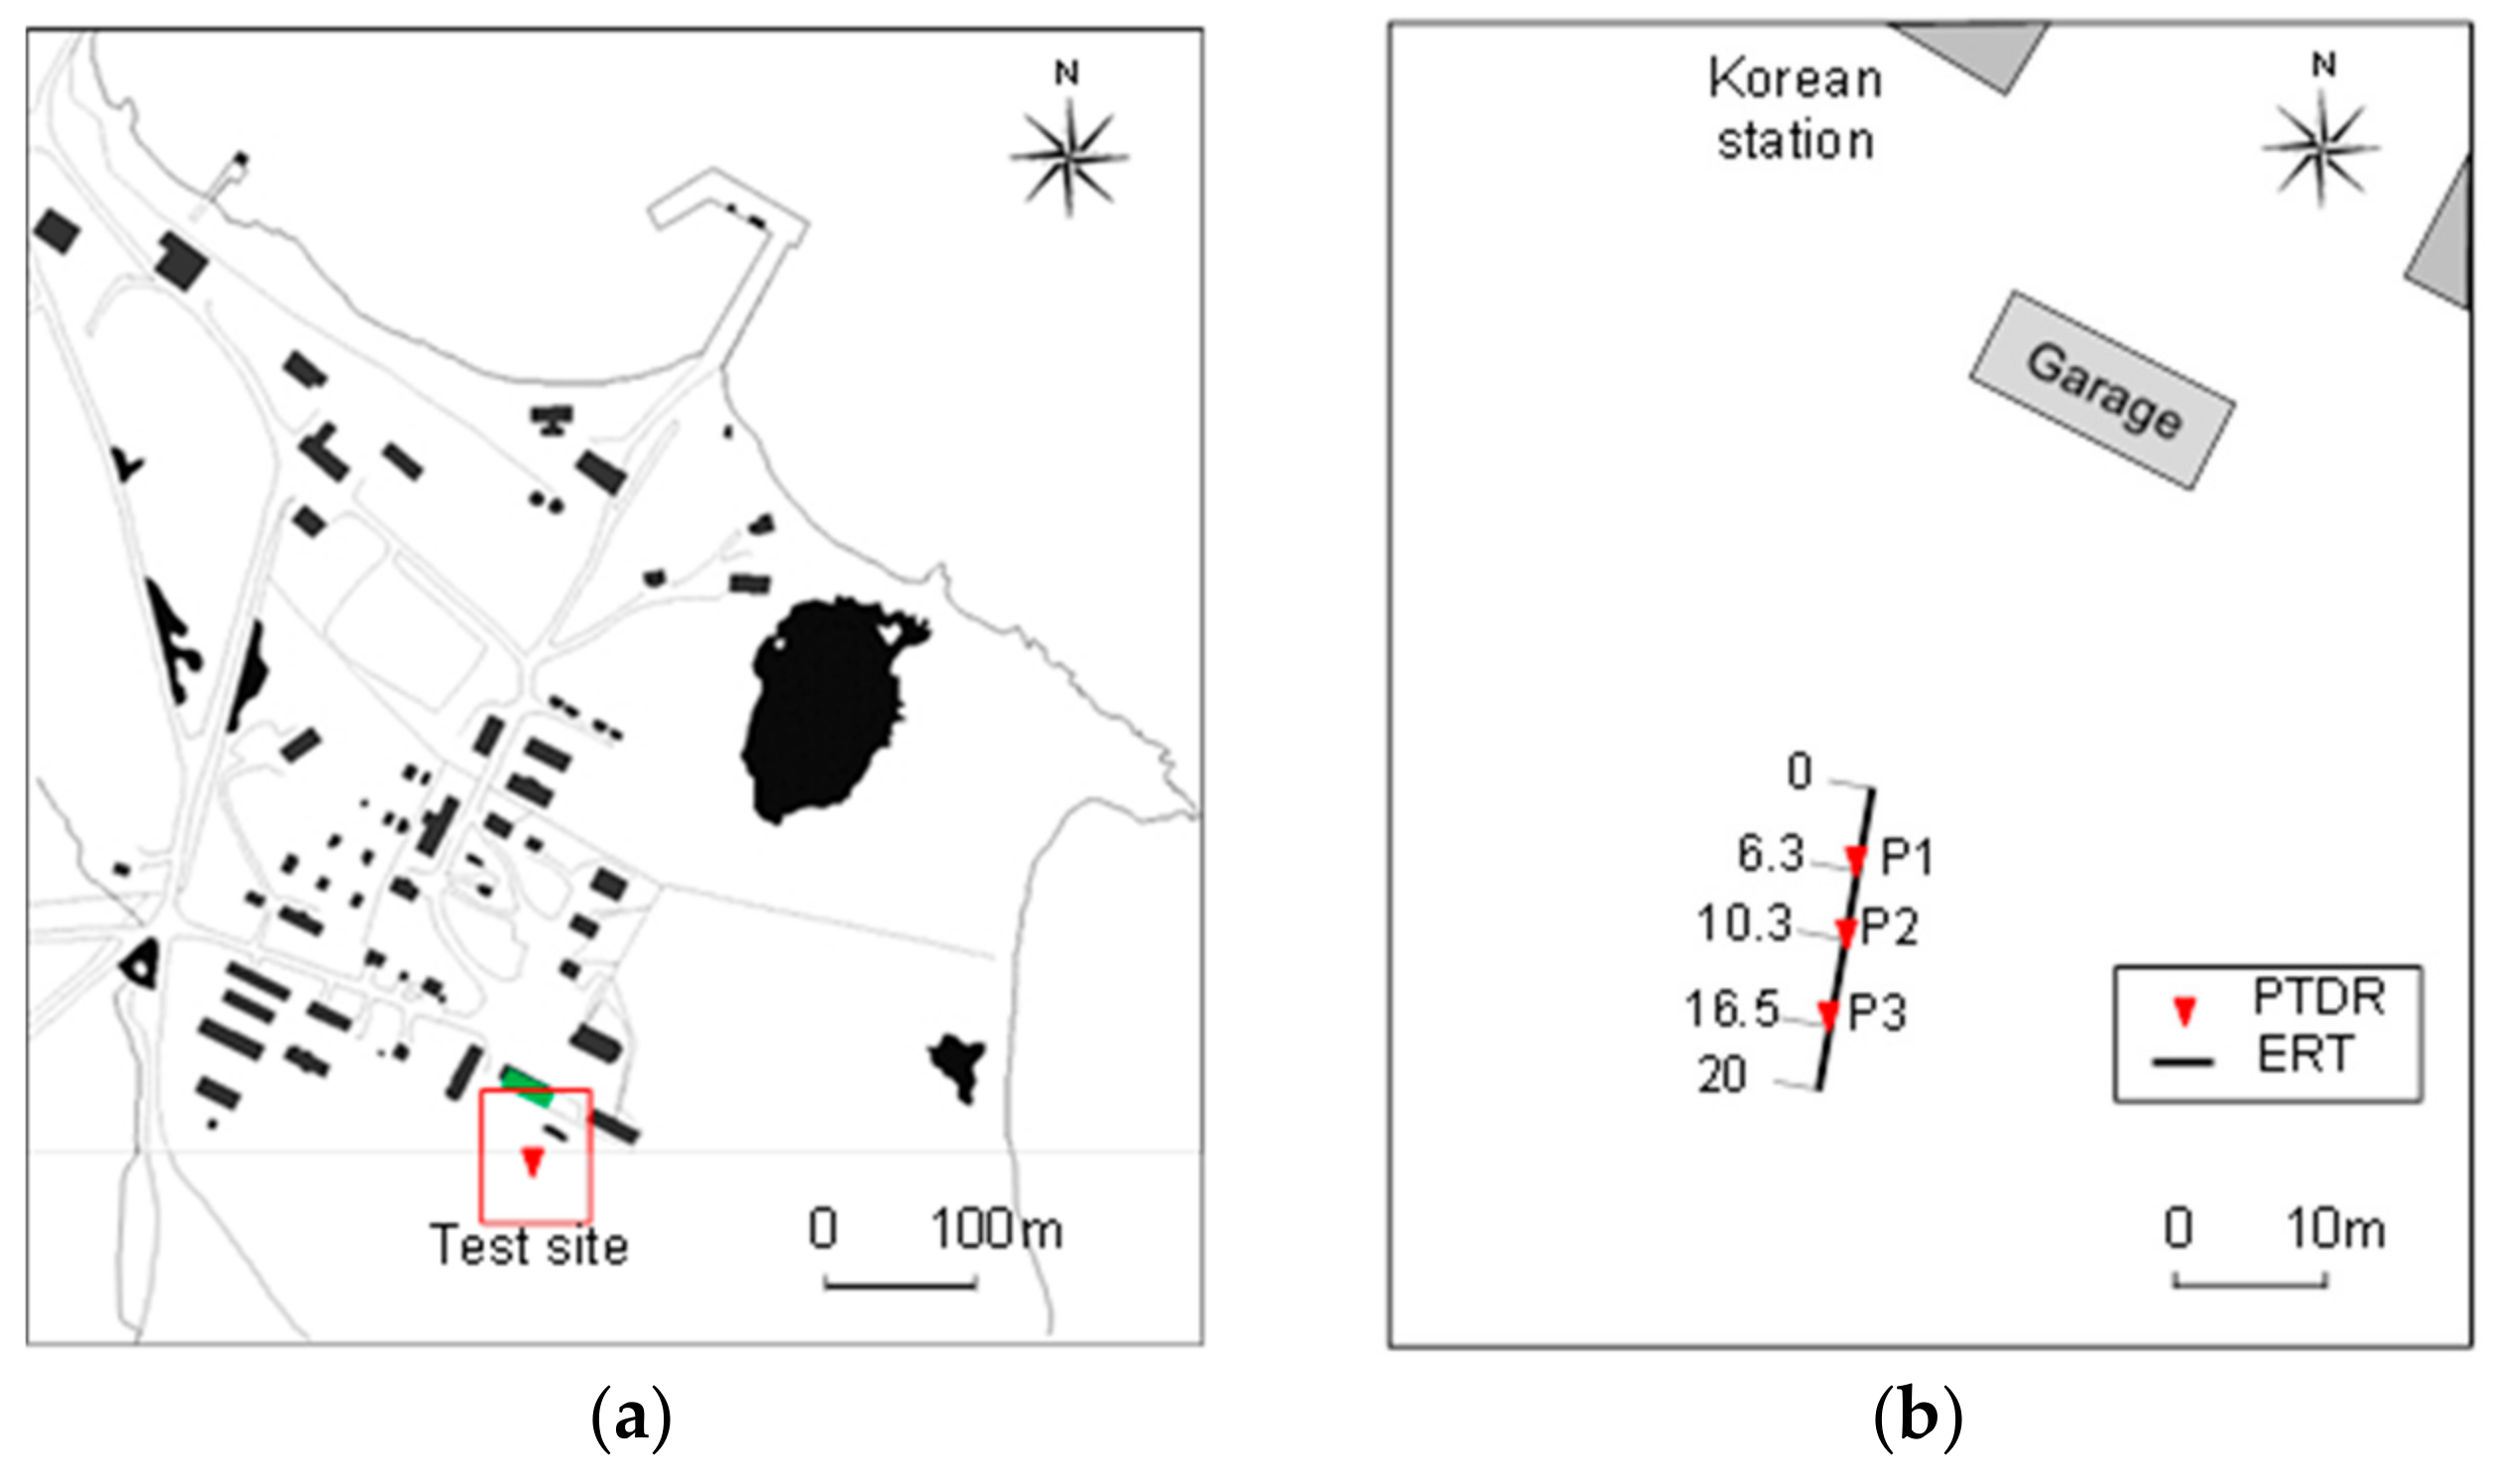
Figure 4.
Grain size distribution with depth.

Figure 5.
Calibration using soils sampled at Ny-Alesund, Svalbard: (a) TDR waveforms; (b) correlation between the dielectric constant and volumetric water content.
Figure 5.
Calibration using soils sampled at Ny-Alesund, Svalbard: (a) TDR waveforms; (b) correlation between the dielectric constant and volumetric water content.

Figure 6.
Effect of temperature on the dielectric constant estimated from using PTDR in distilled water. ‘T’ denotes the temperature of water.
Figure 6.
Effect of temperature on the dielectric constant estimated from using PTDR in distilled water. ‘T’ denotes the temperature of water.

Figure 7.
TDR waveforms measured in the field along the penetration depth: (a) P1; (b) P2; and (c) P3.
Figure 7.
TDR waveforms measured in the field along the penetration depth: (a) P1; (b) P2; and (c) P3.

Figure 8.
Volumetric water content profiles estimated from using PTDR.

Figure 9.
Temperature profiles obtained by PTDR. The dotted lines are the monitored temperature data in the same site reported by Byun et al. [36].
Figure 9.
Temperature profiles obtained by PTDR. The dotted lines are the monitored temperature data in the same site reported by Byun et al. [36].
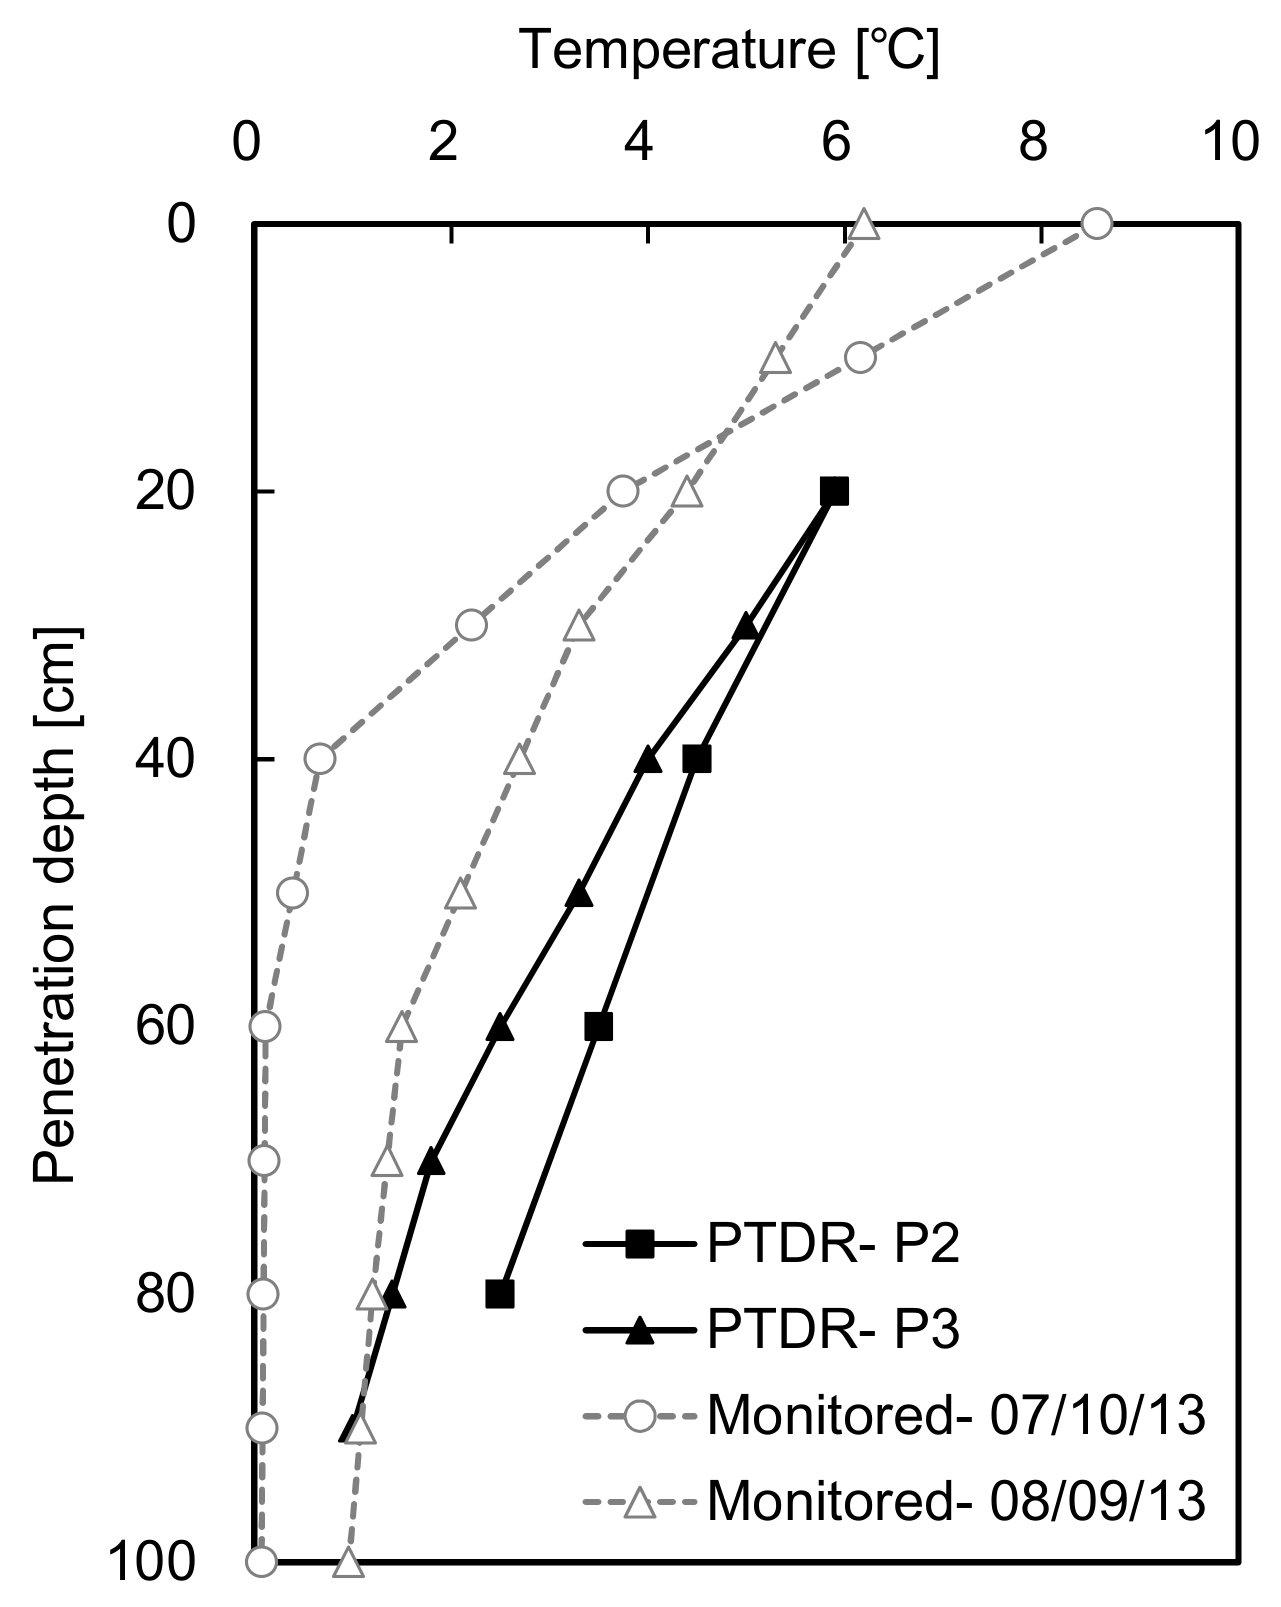
Figure 10.
Resistivity tomograms of a selected line up to: (a) 5 m depth; (b) 2 m depth.

Figure 11.
Profiles of electrical resistivity estimated at the three different locations.

Figure 12.
Relation between water contents and electrical resistivity, with a comparison of the data range reported by Calamita et al. [48]. The red dashed curve indicates the trend, excluding the data point marked with a red circle.
Figure 12.
Relation between water contents and electrical resistivity, with a comparison of the data range reported by Calamita et al. [48]. The red dashed curve indicates the trend, excluding the data point marked with a red circle.


Table 1.
Index properties of the soil samples with depth.
| Depth (mm) | Specific Gravity | Median Diameter (mm) | Gradation Coefficient | Uniformity Coefficient | Gravimetric Water Content (%) | Liquid Limit (%) | Plastic Limit (%) | Plastic Index (%] | USCS |
|---|---|---|---|---|---|---|---|---|---|
| 0 | 2.56 | 1.04 | 3.2 | 46.4 | 16.9 | 30.0 | 25.4 | 4.6 | SM |
| 40 | 2.68 | 2.29 | 1.4 | 98.7 | 5.5 | 31.6 | 24.5 | 7.1 | SM |
| 80 | 2.66 | 2.18 | 1.0 | 59.1 | 5.8 | 33.4 | 23.8 | 9.6 | SM |
Table 2.
Parameters of regression analysis between water contents and electrical resistivity.
| Data | Coefficient, a | Exponent, b | Coefficient of Determination, R2 | Standard Deviation of Regression, σ | p-Value | |
|---|---|---|---|---|---|---|
| a | b | |||||
| Entire | 15,592 | −0.98 | 0.61 | 0.34 | 1.96 × 10⁻⁵ | 0.00058 |
| Selected | 53,471 | −1.172 | 0.84 | 0.22 | 1.35 × 10⁻⁷ | 3.78 × 10⁻⁶ |
“Selected” indicates the data excluding the data point remarked with red circle in Figure 12.
© 2018 by the authors. Licensee MDPI, Basel, Switzerland. This article is an open access article distributed under the terms and conditions of the Creative Commons Attribution (CC BY) license (http://creativecommons.org/licenses/by/4.0/).
Share and Cite
MDPI and ACS Style
Lee, J.-S.; Hong, W.-T.; Park, K.; Hong, S.S.; Lee, S.-H.; Byun, Y.-H. Evaluation of Water Content in an Active Layer Using Penetration-Type Time Domain Reflectometry. Appl. Sci. 2018, 8, 935. https://doi.org/10.3390/app8060935
AMA Style
Lee J-S, Hong W-T, Park K, Hong SS, Lee S-H, Byun Y-H. Evaluation of Water Content in an Active Layer Using Penetration-Type Time Domain Reflectometry. Applied Sciences. 2018; 8(6):935. https://doi.org/10.3390/app8060935
Chicago/Turabian StyleLee, Jong-Sub, Won-Taek Hong, Keunbo Park, Seung Seo Hong, Sang-Ho Lee, and Yong-Hoon Byun. 2018. "Evaluation of Water Content in an Active Layer Using Penetration-Type Time Domain Reflectometry" Applied Sciences 8, no. 6: 935. https://doi.org/10.3390/app8060935
Note that from the first issue of 2016, this journal uses article numbers instead of page numbers. See further details here.