Analysis of the Effect of Parameter Variation on a Dynamic Cost Function for Distributed Energy Resources: A DER-CAM Case Study

1
Department of Electrical and Electronics Engineering Science, University of Johannesburg, Johannesburg 2006, South Africa
2
Department of Electrical and Mining Engineering, University of South Africa, Florida 1710, South Africa
*
Author to whom correspondence should be addressed.
Appl. Sci. 2018, 8(6), 884; https://doi.org/10.3390/app8060884
Submission received: 25 April 2018
/
Revised: 24 May 2018
/
Accepted: 25 May 2018
/
Published: 28 May 2018
(This article belongs to the Special Issue Smart Home and Energy Management Systems)
Abstract
:This paper investigates the effect of selected strategies of distributed energy resources (DER) on an energy cost function that optimizes the distribution of distributed energy resources for a mid-rise apartment building. This is achieved through comparing parameter optimization results for both a high-level and low-level optimizer, respectively. The optimization process is carried out using the following approach: (1) a two-objective function is constructed with one objective function similar to that of the high-level optimizer (DER-CAM); (2) an evolutionary algorithm (EA) with modified selection capability is used to optimize the two-objective function problem in (1) for four selected cases of DER utilization that were previously optimized in DER-CAM; and (3) the optimization results of the low-level optimizer are compared with the outcome of DER-CAM optimization for the four selected cases. This is done to establish the capability of DER-CAM as an effective tool for optimal distributed energy resource allocation. Results obtained reveal the effect of load shifting and solar photovoltaic (PV) panels with power exporting capability on the optimization of the cost function. The Pareto-based MOEA approach has also proved to be effective in observing the interactions between objective function parameters. Mean inverted generational distance (MIGD) values obtained over 10 runs for each of the four cases that were considered show that a DER combination of PV panel, battery storage, heat pump, and load shifting outperforms the other strategies in 70% of the total simulation runs.
1. Introduction
‘Distributed energy resources’ (DER) is the collective term that is given to alternative sources of electricity that operate separately from the conventional power grid, but can be incorporated into the existing grid. An optimized combination of these sources results in strategies that make energy usage more efficient, accessible, and environmentally sustainable [1]. When these energy sources operate apart from the grid, they are said to be in ‘islanding’ mode (commonly called distributed generation); when they are connected to the grid, they are in grid mode. There are generally two categories of DER: namely, discrete and continuous DER. Discrete forms of DER are those sources that can be switched on and off instantaneously, such as diesel and petrol generators, microturbines, reciprocating engines, and fuel cells [2]. The second category consists of energy sources that are renewed on a frequent basis (for, instance daily) such as wind turbines, solar photovoltaic (PV) panels, and stationary battery banks. The present increase of small-scale urban PV in buildings [3] and urban wind generators [4] can help home electricity consumers also become producers using the smart grid (SG) concept [5,6,7] and the microgrids approach [8,9].
Over the years, efficient energy dispatch management has become an important priority for distribution network operators. This is because they seek to minimize distribution system losses and the cost of maintenance of energy distribution equipment, while maximizing profits and customer satisfaction. This has been made possible through the evolution in distribution network architecture by the application of advances made in computer science and engineering, and also supervisory control and data acquisition (SCADA) systems [2]. These advancements have led to the development of the concept of smart power grids that are capable of adjusting the relevant power supply parameters based on changing demand patterns. A review of the key concepts of smart grids can be found in Cuadra et al., Colak et al. and Tuballa & Abundo [5,6,7]. Specifically, Cuadra et al. [5] explore the optimization of distribution smart grids with distributed renewable generation using a novel approach based on complex network concepts [10] with evolutionary algorithms. The use of evolutionary algorithms and other computational intelligence techniques in energy can be found in Ardabili et al., Cuadra et al. and Jiang et al. [11,12,13]. Also, with the recent passage of laws in countries such as Spain, Germany, and the United Kingdom banning restrictions on private energy sourcing [14,15], the demand is rising for specialized software to meet consumers’ energy needs. Since the distribution side of a power supply system represents the downstream sector of the system, which links the generation sector with the final consumer, efficient and reliable power supply can only be guaranteed when the distribution system is optimally modeled. Also, the development of alternative energy sources has transformed energy consumers to ‘prosumers’, which means that they can now play a more active role in the utilization of electricity. Therefore, having a distribution network that is able to accommodate these changes would result in enormous benefits for both the supply and demand side of the energy distribution network.
Optimization is the process of achieving a set objective with the least possible resources. This is important when it is difficult to determine which combination of variables yields the most viable outcome by simple observation. In such cases, it would be impossible to make a decision based on simply observing the given data, because the data points are likely to be as diverse as they are similar, based on the given objective and predefined parameters. The optimization process involves the development of a mathematical model of the problem, which represents the problem’s variables, constraints, and features [16]. This mathematical model of the problem being optimized is commonly referred to as the objective function (OF). When a suitable OF has been obtained, the next step involves selecting a suitable optimization algorithm to find the best possible extreme trade-off among the variables (and, in the case of multiple objectives, among the objectives) that best solves the problem. Popular search strategies include stochastic, deterministic, and evolutionary algorithms [16]. The fundamental concepts of evolutionary algorithms (EAs) are inspired by two biological phenomena [12,17]: (1) the characteristics of living beings are encoded (represented) using genetic information; and (2) evolution is the result of the interaction between the random creation of new genetic information and the selection of those individuals that are best adapted to the ecosystem [5]. In an EA, candidate solutions (‘individuals’) for the OF are encoded in a way that simplifies the search for the optimal solution. A set of individuals (‘population’) is evolved by applying operators (mutation, crossover, selection) in each iteration (‘generation’). When fulfilling a stop criterion, the EA ends in providing the solution that optimizes the OF (the individual that is best adapted to the ecosystem, in the biological analogy). More details of EAs applied to DER can be found in Cuadra et al. [5]. With respect to evolutionary algorithms, they are classified as single-objective, multi-objective, or many-objective. The advantage of multi-objective evolutionary algorithms is that they find a set of non-dominated solutions rather than a single optimal solution.
The process of optimizing a combination of alternative energy sources with respect to cost minimization and efficient energy supply from the demand side involves developing an OF representing the various sources in the DER mix, subject to specified constraints. The result of the optimization process is a combination of DER technologies that could benefit the consumer from both a cost and demand perspective. This ensures that both sides of the distribution network benefit mutually. A typical optimization process is shown in Figure 1. The process of parameter selection and optimization has been investigated by Eiben & Smith and Gershman in [18,19,20]. Reinforcement learning has been applied to the training and validation of network parameters for wireless communications systems. This paper adopts a similar approach, and involves the optimization of a cost function for selected combinations of DER technologies in a mid-rise apartment building. Using a low-level Pareto-based evolutionary algorithm, the optimal mix of energy sources is obtained for four scenarios: a base case with no DER, and three other cases involving varied combinations of PV solar panel, battery storage, air source heat pump, and load shifting. The rest of the paper is organized as follows: Section 2 discusses the impact of optimization in the determination of DER dispatch strategies. Section 3 discusses the DER-CAM and Pareto-based cost functions for the four selected cases of DER strategies, as well as the parameter specification for the two-objective cost function. Section 4 discusses the outcome of the optimization using the multi-objective evolutionary algorithm, and compares the results with DER-CAM optimization. Section 5 concludes the paper.
2. The Role of Optimization in Demand Side Management (DSM) of DER
Smart power grids are the result of a system of technologies, which are able to anticipate the needs of consumers based on an accurate prediction of their energy usage profiles over a specified period of time. With regard to buildings and microgrids, the optimization of parameters related to energy demand, energy pricing for time-of-use (ToU) patterns, and weather information (with regard to renewable sources) can allow consumers to minimize both the amount paid for electricity and the effect of distributed generation on the environment. Therefore, there is the need for reliable algorithms that are capable of ensuring that these smart grids balance usability with cost-effectiveness.
A lot of research has focused on the application of optimization techniques to the distributed generation of electricity. However, not much work has analyzed the results of these optimizers in order to determine whether or not they are likely to translate to cost-effective physical implementations. This real-life scenario implementation problem has been highlighted by Steen et al. and Hassan et al. in [1,15]. The following are some approaches that have been adopted to issues relating to load scheduling, optimal DER combination and scheduling, and capacity expansion.
The effect of capacity expansion strategies on long-term economic performance for a rural mini-grid operator was investigated by Hartvigsson et al. in [21]. The research proposed a linear bottom–up model, and used DER-CAM to implement the capacity investment model. The results of the research revealed that a cost-optimized model alone is likely not the best long-term investment solution., another optimal DER combination for rural areas in Nigeria was considered by Olatomiwa et al. [22]. The Hybrid Optimization Model for Electric Renewables (HOMER) was used to analyze various combinations of renewable energy sources for six randomly selected rural communities across the country. It was found that for a sensitivity of $1.1 and $1.3/l of diesel, the PV/diesel/battery combination was the most cost-effective solution. This model was the most effective in terms of fuel consumption and CO2 reduction.
A trade-off between grid expansion and standalone electricity generation from renewable sources was considered by Sen & Bhattacharyya [23]. An off-grid, remote village in the state of Chhattisgarh in India was used as a case study, and the electricity demand profile included domestic consumption, as well as industrial, commercial, and agricultural purposes. The research outcome proposed a least-cost combination of small hydropower, solar PV, biodiesel, and batteries. However, it has concluded that the reliability of the proposed system was likely to reduce in the winter season, with less availability of hydropower. A mixed integer linear programming (MILP) model was adopted by Mesaric & Krajcar in [24] for DSM with renewable sources, including an optimally scheduled injection from electric vehicles (while they were parked). The aim of this work was to reduce reliance on the main electricity grid by scheduling consumer demand. The DSM schedule included time-shiftable and power-shiftable appliances, and also the contribution of EVs in V2G mode while parked. Compared with a base case with no EV injection and no home DSM, the proposed model provided the best energy and cost-savings model for the consumer.
A scheduling algorithm based on the optimal stopping rule (OSR) technique was proposed by Rasheed et al. in [25]. OSR uses a sequence of reward functions to select an optimal time slot in the search process, which either minimizes total cost or maximizes expected return. This approach was used to efficiently manage limited grid supply using a modified first-come first-serve (MFCFS) and priority enable early deadline first (PEEDF) algorithms for the load scheduling process. Also, a demand response algorithm was proposed by Gazijahani et al. [26] using a cost minimization function consisting of maintenance and power loss costs, as well as the cost of energy not supplied. The ant colony optimization approach was used to realize the point estimate method (PEM). The proposed approach was applied to a 69-bus distribution system consisting of four wind turbines, three PV panels, and three battery storage systems. The simulations resulted in a flattened load profile based on optimal load shifting from high price periods to other cost-saving periods.
Much of the above-mentioned research for optimal DER mixing and scheduling (especially those based on specialized platforms such as HOMER and DER-CAM) typically adopt a ‘blackbox’ approach to the simulation/optimization of energy usage data, and they adopt more of an optimization approach than a simulated one. Furthermore, since the proposed results are based on simulation, there is the need for a means of verifying that the optimized output of these platforms is indeed the best possible, cost-effective outcome for real-life implementation.
3. Modeling of the Cost Function: A DER-CAM Case Study
Several tools and methods of optimizing various aspects of a smart grid have been used in the literature, as discussed in the previous section of this paper. However, DER-CAM has gained attention in recent years due to the following reasons:
- Its input and output can be easily interfaced with common software platforms such as MATLAB and Vensim.
- Due to its optimization-based mathematical model, it can be reliably applied to situations involving a large number of decision variables to make accurate DER investment and dispatch decisions.
- Its customer-based model makes it suitable for DSM and time-of-use (ToU)-based DER scheduling.
This paper is based on the idea of ‘optimizing the optimizer’, in which the performance of DER-CAM as an optimization model is analyzed using a Pareto-based evolutionary algorithm. The main contributions of this paper are:
- To analyze the performance of DER-CAM using a Pareto-based evolutionary algorithm with differential evolution (DE)-based candidate selection strategy.
- To test the capability of the Pareto-based optimization approach to provide a cost-effective balance among selected parameters of the DER strategies being considered
Performance metrics of mean inverted generational distance (MIGD), Pareto solution spread, and Pareto set variation (PSV) will be used to compare the performance of the selected DER cases optimized by Hassan et al. using DER-CAM in [27]. The flowchart representing the proposed optimization approach is shown in Figure 2.
(a) DER-CAM Cost Function
DER-CAM is an optimization platform that provides information regarding the viability of various DER configurations from both an economic and environmental perspective. The latter is achieved by providing information on the DER mix that yields the least CO2 emissions, while the former is done by obtaining the most cost-effective mix of generation and storage installations [28]. Therefore, DER-CAM is useful for both investment and planning decisions. DER-CAM does not perform simulations or power flow analyses, and can be utilized for both buildings and microgrids. The data being used in this paper is for a mid-rise building, and data points have been adapted from Hassan et al. [27]. This is because DER-CAM is a physically-based optimization model [28]. The microgrid to which the apartment is connected is shown in Figure 3, and the information about microgrid cable impedances and transformer specifications can be obtained from Hassan et al. [27].
The cost function for DER-CAM is formulated as a mixed integer linear programming (MILP) problem in which objective functions and constraints are linear, while decision variables can be either integers or continuous [28]. The objective cost function to be minimized consists of:
- Retail electricity charges (by the distribution network operator on a monthly basis)
- Energy charges per unit load/hour/day/month (for peak, week, and weekend days)
- Maximum power charges (for peak days)/hour/day/month
- Total generation cost/DER/hour/day/month (for each DER utilized)
- Total depreciation cost for each DER (over a 20-year period)
- Excluding the total energy exported to the grid by each DER.
(b) Proposed two-objective Pareto-based Optimization
The Pareto-based dynamic evolutionary algorithm attempts to optimize the Pareto front for two objective functions and . The first objective is similar to the cost function for DER-CAM, while the second is an energy consumption minimization function with regard to the DER utilized with a resulting decrease in CO2 emissions. The mathematical forms of the objective functions are given in Equations (2) and (3).
where:
= battery energy coefficient, = solar PV panel energy coefficient, = air source heat pump energy coefficient, = model for load shifting strategy, = day (week, weekend, peak), = number of shiftable loads (it is assumed that all d, n = 3).
The parameters in Equation (3) are defined as follows:
where:
= state-of-charge of battery, = charging time, = battery efficiency, = charging power, and = discharging power.
where:
= Boltzmann constant, = adjusted power of the photovoltaic (PV) module due to temperature changes across the module, = output power of the PV module under standard operating conditions.
where:
= power generated through heat exchange process, thermal power of compressor
where:
, , = shifting constants, = day of the week, = shifting parameters
Constraints for f1(x,t) include:
Constraints for f2(x,t) include:
f1 represents the constructed cost function based on distributed energy resources (similar to that used in DER-CAM optimization model). f2 specifies the variables for the considered energy sources (PV, battery, and air source heat pump). The two-objective optimization space has been used in order to validate the optimization capability of DER-CAM. Three test cases are considered that have been selected from the DER-CAM optimization by Hassan et al. in [27] for the following cases:
Case 1: Investment is made in solar PV panels with the capability to export excess energy, and a battery, air source heat pump, and load shifting are also utilized.
Case 2: Investment is made in solar PV panels for self-consumption only, and a battery and an air source heat pump, with load shifting, are also utilized.
Case 3: Investment is made in solar PV panels with the capability to export excess energy, and a battery and air source heat pump are utilized.
Case 4: This is the base case without the DER strategy, and all of the supply and demand are met by distribution utility.
The three test cases (Case 1–Case 3) have been considered in this paper because they are the optimal cases selected by DER-CAM based on the analysis by Hassan et al. in [27]. Parameter variation for the above investment scenarios are compared with the base case in which no investment is made in DER, with all of the supply and demand being made by the energy distribution utility. For the above-mentioned cases, the effect of the utilization of PV panels on the Pareto set for both self-consumption and energy export will also be considered. The Pareto-based genetic algorithm used to optimize the dynamic bi-objective problem specified in Equations (1) and (2) is detailed in Algorithm 1. All of the simulations are done using PlatEMO open source MATLAB-based platform [29].
| Algorithm 1. Steps in optimizing f1(x,t) and f2(x,t) |
| Input: OF parameters, optimization parameters Output: Pareto optimal set, MIGD Start Specify f2(x,t) based on case (n) Activate input matrices for f2(x,t) Perform genetic mutation, crossover, and selection based on specified crossover rate. Adjust mutation and crossover rate for optimal Pareto front (PF) Use DE/rand-to-best/for final selection of Pareto set (PS) End |
The mean inverted generational distance (MIGD) is the metric that is being used in this paper to evaluate the Pareto front for each of the four cases optimized by DER-CAM. The smaller the numerical value of the MIGD, the better the PF is likely to be. The mathematical form of the MIGD is given in Equation (21).
where
and are the directional vectors for f1(x,t) and f2(x,t), respectively.
With regard to Algorithm 1, crossover is uniform and real-valued. Randomized mutation has been used based on vector change. Selection is done using the DE/rand-to-best/strategy, which allows the selection of the best-performing candidates for the Pareto set. Therefore, this strategy also helps with the mutation of candidates toward final selection. The algorithm is based on the non-dominated sorting genetic algorithm (NSGA-III) [30,31]. Reference points and Euclidean distance are used to control the crowding of candidates. Mutation and crossover rates are adaptively adjusted using the orientation of reference points and normal boundary intersection (NBI) as discussed by Das and Dennis in [32].
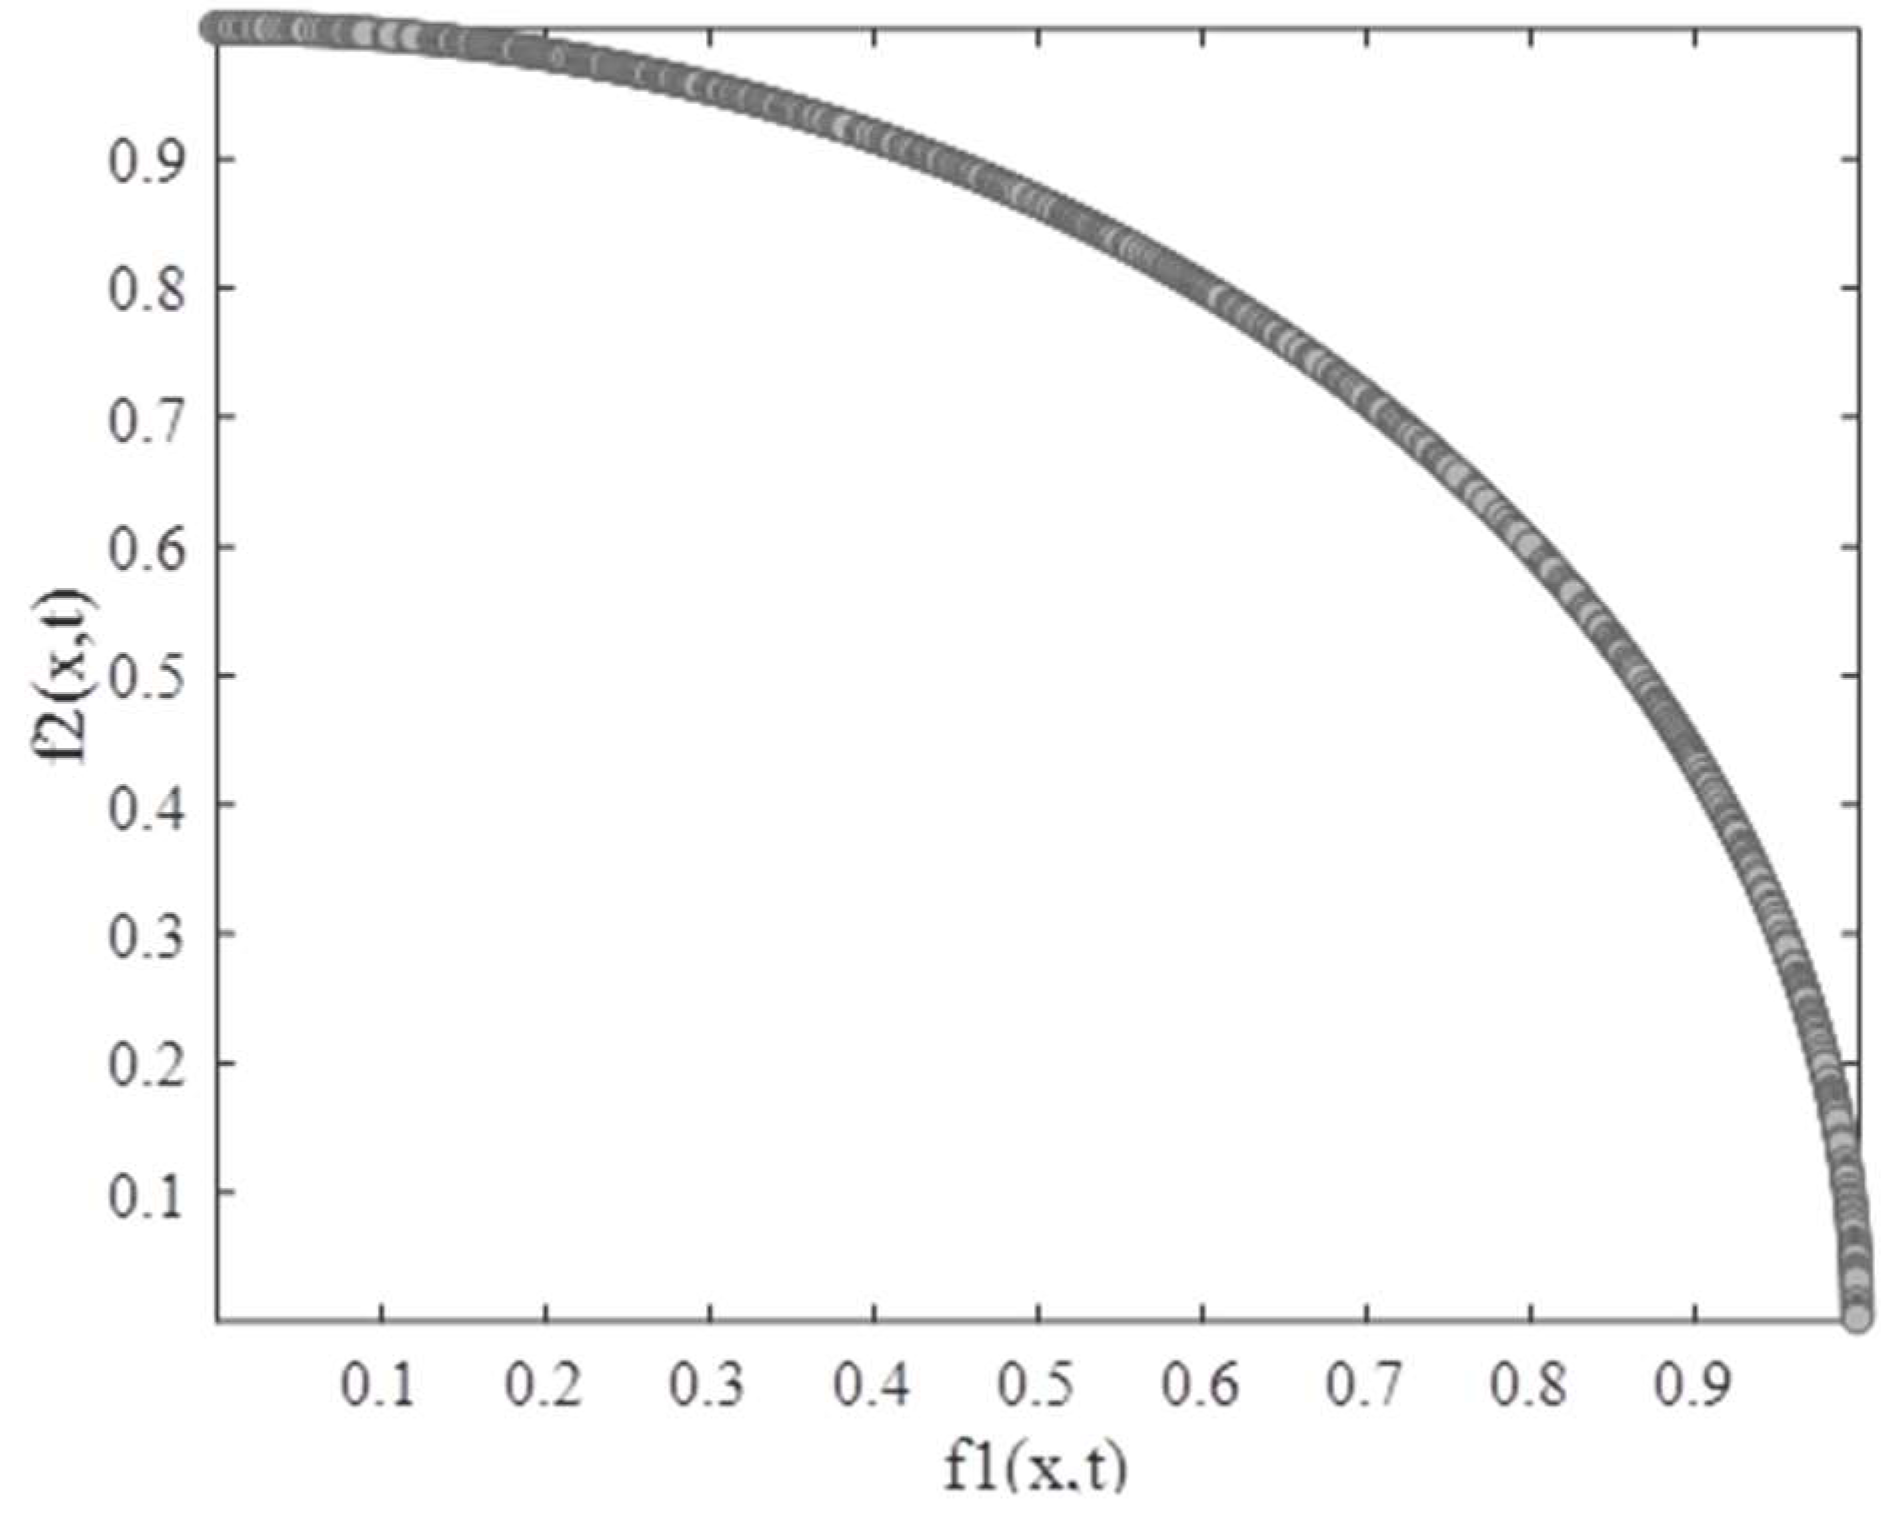
The behavior of the particles in the OF space is also observed using the Pareto set variation, as well as the spread of the particles along the PF. The simulation parameters are specified in Table 1. The crossover rate is adaptive based on the use of both reference points and the NBI technique to balance both convergence and diversity. The number of feature evaluations (FEs) is selected as 10,000 to allow for the settling of non-dominated solutions to constitute the final Pareto set. The differential evolution (DE) selection strategy aids both the mutation and final selection of the Pareto set by controlling selection pressure. The true Pareto front is shown in Figure 4.
4. Results and Discussion
Figure 5 shows the approximation of the true Pareto front (shown in Figure 4) for each of the specified cases. The approximation is done by using the normal boundary intersection (NBI) method [32] to guide the candidates toward the final non-dominated Pareto front. It can be seen that the scenario in which there is no adoption of DER (Case 4) has the worst approximation of the PF, while Case 1 has the best approximation. This demonstrates that in this case study, DER-CAM gave the most economically viable solution based on the adopted DER mix. For cases 2 and 3, it can be seen that the use of the load-shifting strategy marginally improves the cost and energy consumption optimization functions for the consumer. This results in a comparatively more stable and cost-effective energy profile. It can also be seen that cases 1 and 2 take less time to explore and exploit the search space (observed from the axial calibrations of f1(x,t) and f2(x,t)) compared with the cases 3 and 4. This means that the parameter selection for the cases involving load-shifting as an economically viable strategy results in a more optimized PF. For each case (particularly Case 3 and Case 4), it is observed that some of the points on the Pareto front are dominated. This is likely due to the interaction of selected parameters in the OF space on the selection pressure of candidates.
The manner in which the particles in the search space settle on the final Pareto set is observed by the variation of the Pareto set over the selected number of dimensions (Figure 6). Each particle in the search space explores the best possible solution in 100 different directions before finally converging to the final optimal candidate. For Case 1, it is observed that the particles settle much more quickly compared with the other three cases. In cases 3 and 4, the particles are in a state of almost constant oscillation, which makes it difficult for them to settle on the final PF. This is evidenced by the disoriented PF in both cases.
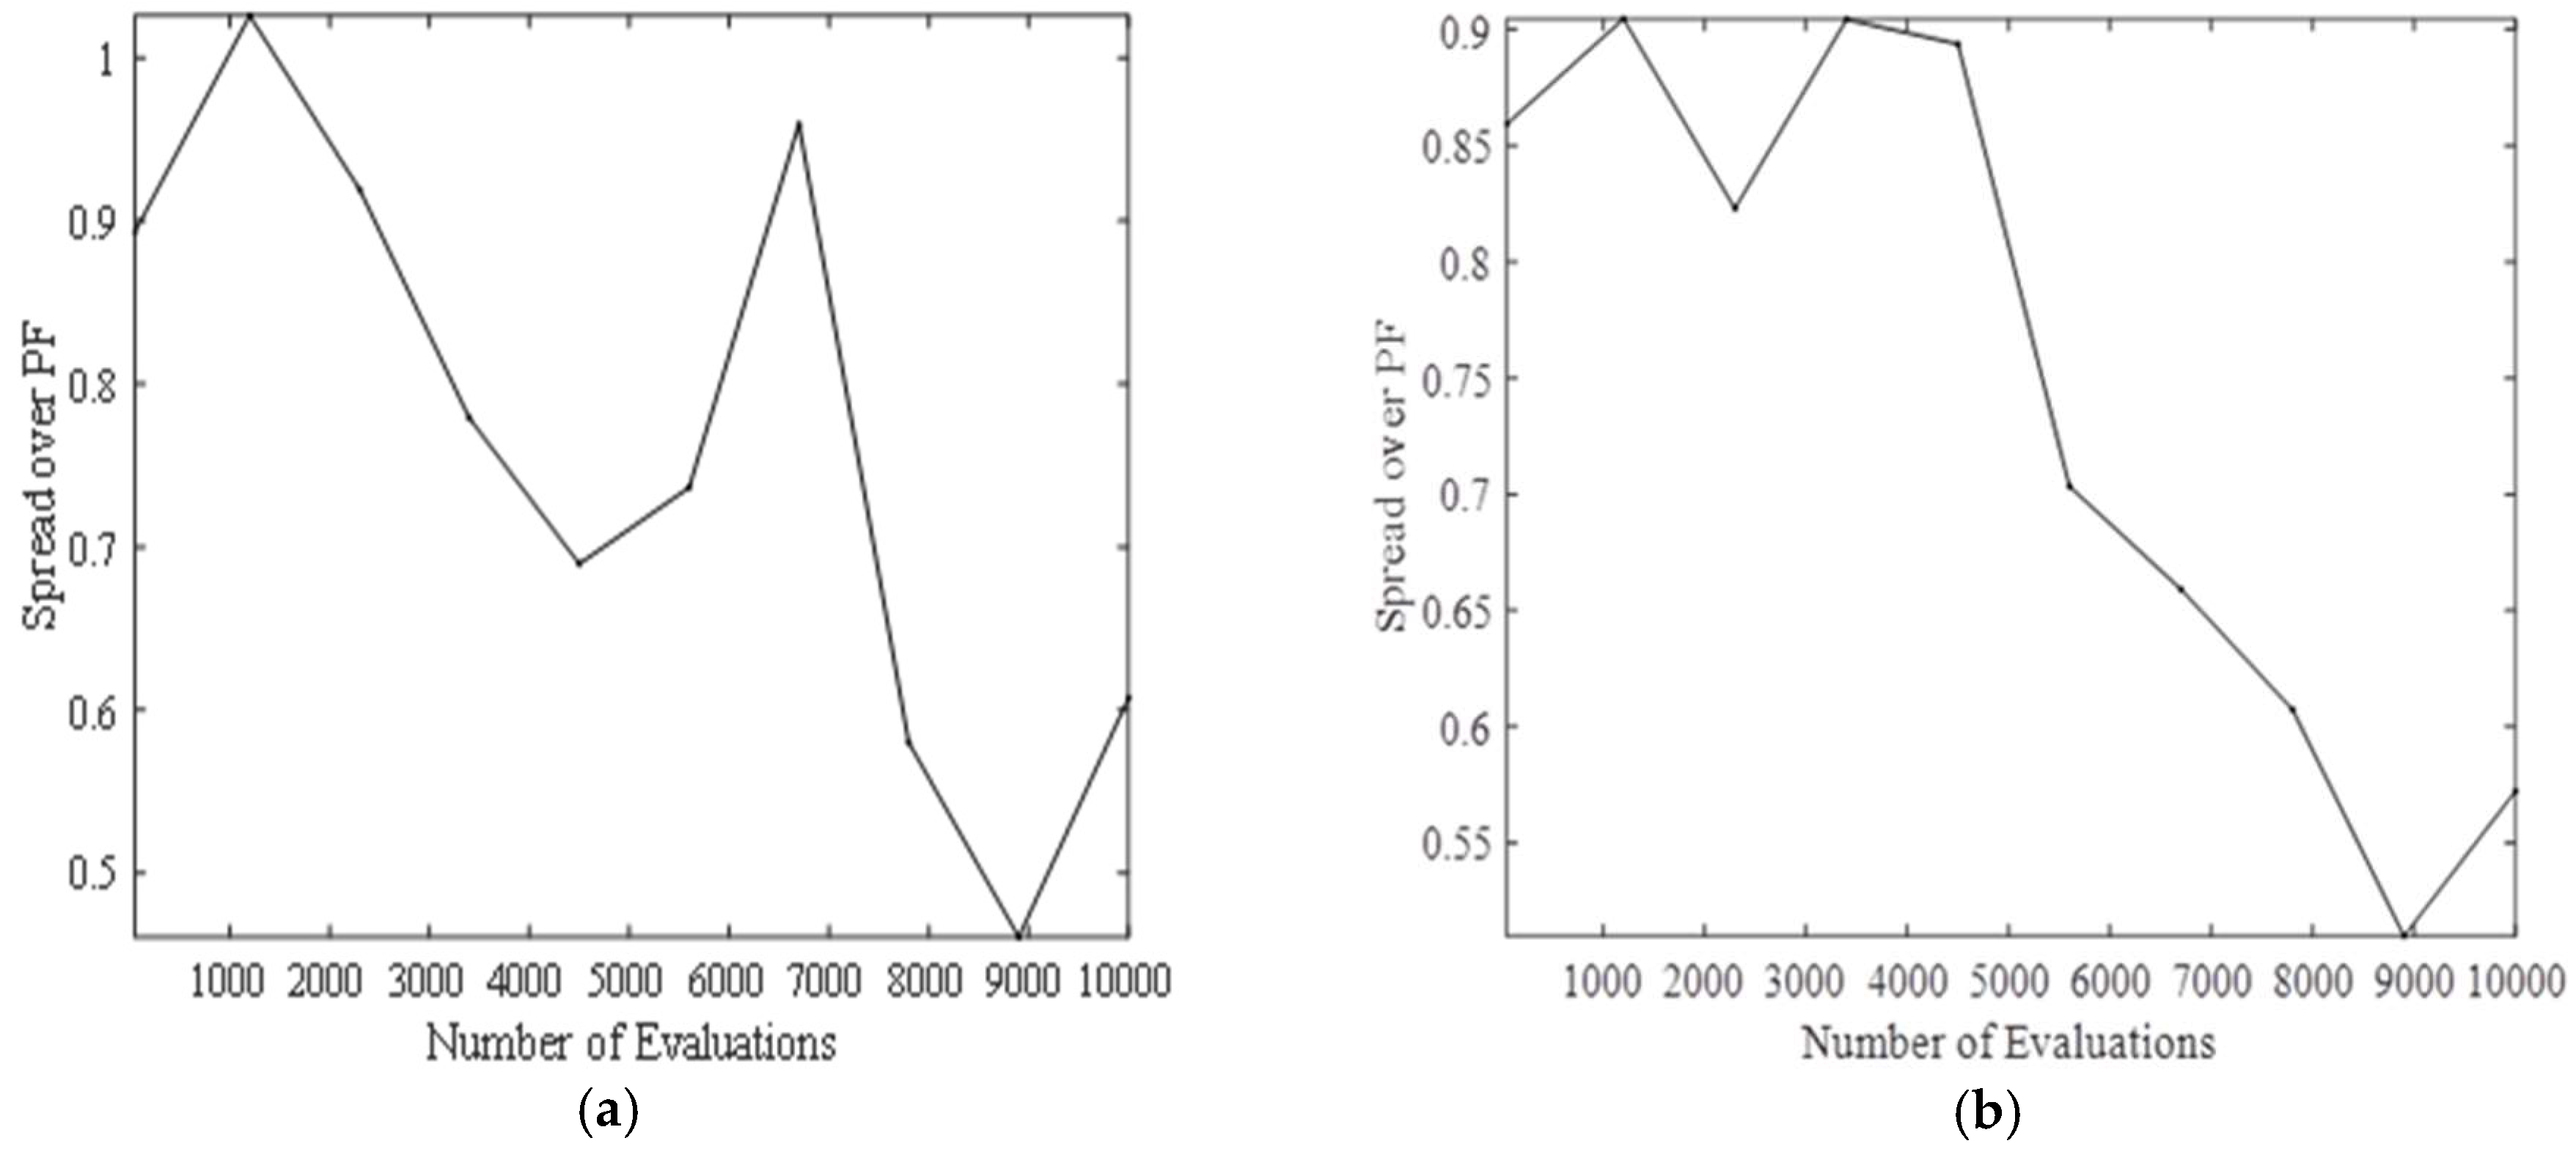
The diversity of the particles that constitute the final Pareto set has also been considered by observing the behavior of the Pareto set over 10,000 feature evaluations (FEs). The ability of the particles to efficiently explore the search space for potential solutions ensures a uniform spread of solutions over the PF. In Case 4 (Figure 6), the evidence of premature convergence, and consequently poor solution spread over the PF is observed over 5000 FEs (between 2000–7000 FEs). Therefore, the OF parameters cannot be fully explored, thus leading to the poor PF observed in Figure 5d. Since parameter selection is made based on the DER mix, it is to be expected that there would be a poor performance over the two-objective space, since f2(x,t) is almost non-existent for Case 4.
By contrast, the spread for Case 1 can be seen to be steady over 7000 FEs (between 2000–9000 FEs). The outlier around 7000 FEs is likely a case of premature converge, which is handled by the DE/rand-to-best/selection strategy in such situations. Cases 2 and 3 are also quite impressive in terms of maintaining the diversity of the Pareto front due to a utilization of elements of the DER mix such as PV panels and load shifting. For Case 2 in particular, the spread over the PF appears to be more stable compared with Case 3, which has no load shifting strategy.
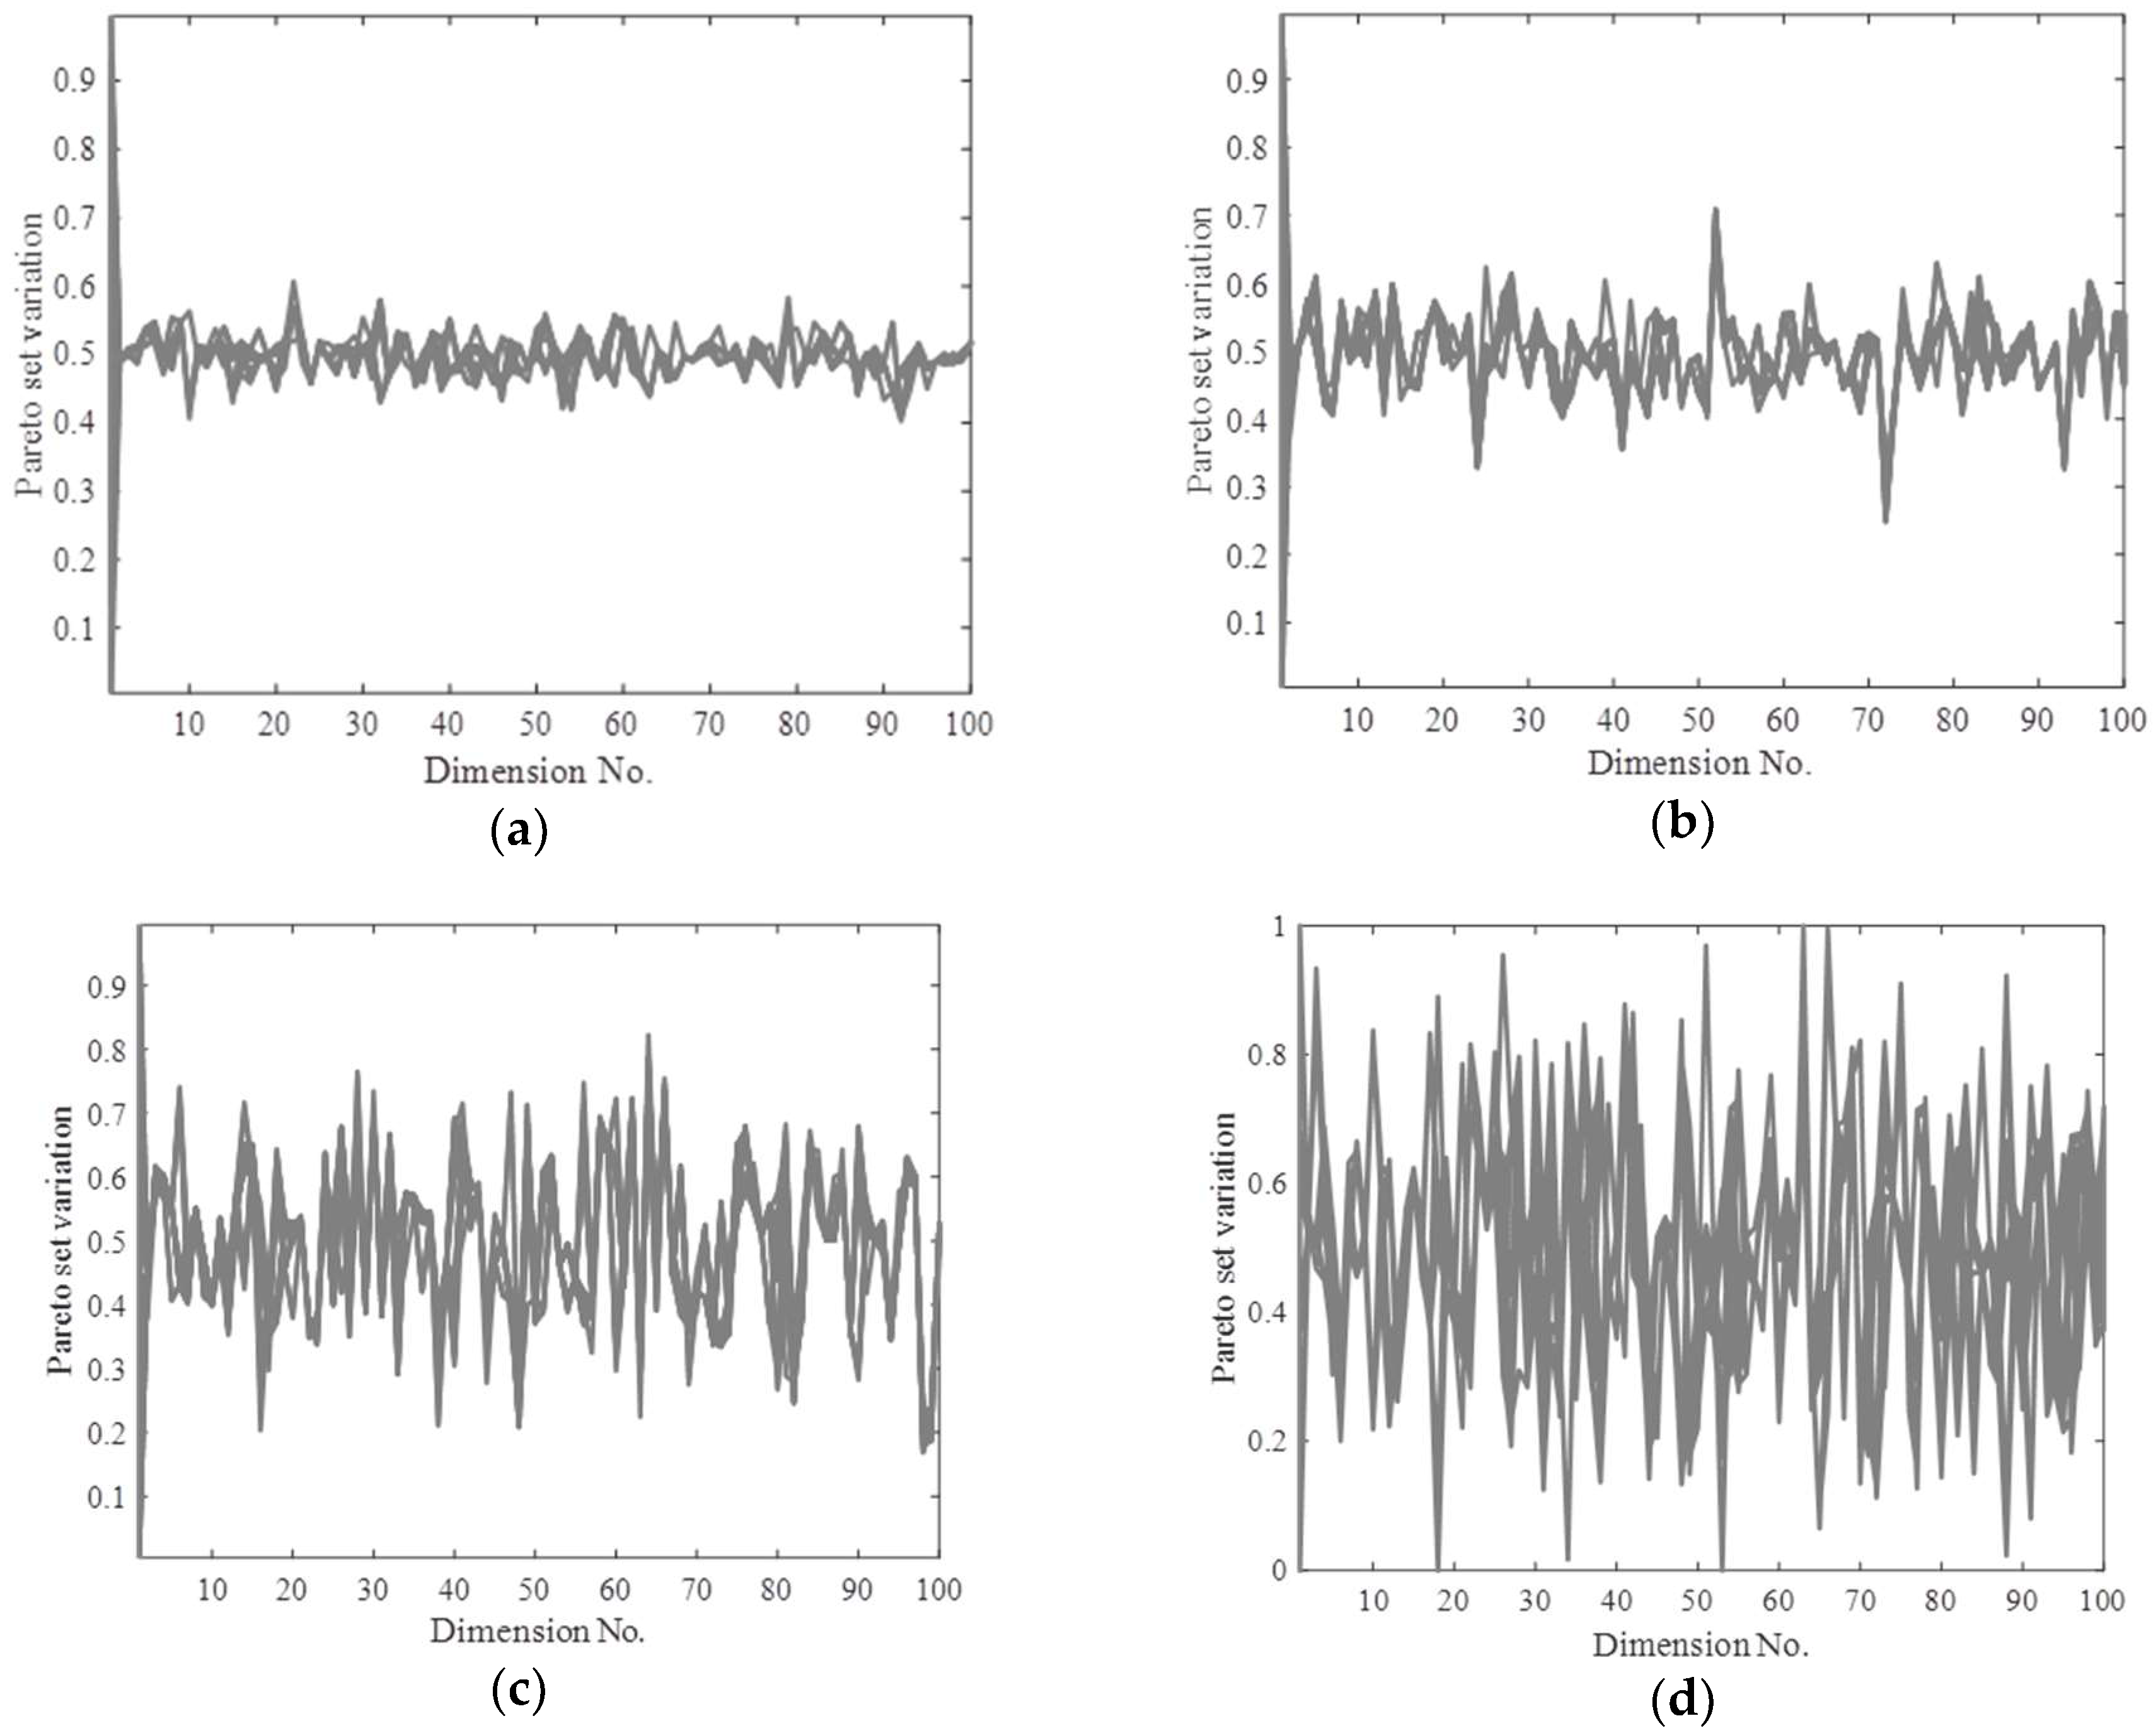
The Pareto set variation is a measure of the ability of particles in the objective search space to settle on the final optimal Pareto front. This was simulated over 100 dimensions for each case, with the results shown in Figure 7. As predicted by DER-CAM, Case 1 had the best Pareto set variation over the specified number of dimensions, and Case 4 had the worst variation. Case 2 outperformed Case 3 in being able to settle on the final PF (as seen in Figure 5). The extremely erratic response observed in Figure 7d for Case 4 is a result of all of the parameter matrices for f2(x,t) having been set to zero, since no DER strategy has been adopted. Therefore, there is no attempt to balance the trade-off between the two objectives.
For the analysis carried out in Figure 5, Figure 6 and Figure 7, the best results over 10 simulation runs were selected for each case. In order to ascertain the results obtained, MIGD values were obtained over 10 runs for each of the four cases considered. The results are shown in Table 2. Each test case has 10 simulation runs, because it is observed that the MIGD values do not vary significantly beyond this number of runs. It is observed from the results that Case 1 had the best MIGD values (shown in boldface) for seven out of 10 runs for all of the cases over the two objective functions, while it was outperformed by Case 2 in two runs (Run 4 and Run 7), and by Case 3 in 1 run (Run 10). With the exception of Run 1, Case 4 had the highest MIGD value for all of the other simulation runs, which means that it had the worst performance for 90% of the simulation runs.
From the results obtained, it has been established that the combination of both solar PV panels with the capability to export excess energy and a load shifting strategy has the best trade-off between the two objectives. This result also confirms the optimized output from DER-CAM for the mid-rise building, thereby confirming the capability of DER-CAM to give accurate optimization results regarding the most cost-effective DER strategies for a particular energy usage profile and location. The results obtained also raised questions regarding the economic viability of combining PV panels with and without energy export capability, and load shifting strategies for particular scenarios. While energy export to the grid may have its merits, the results obtained for cases 2 and 3 suggest that combination of energy export and load shifting may not always be the best economic strategy, given the specific energy usage profiles (particularly situations in which there are generally few peak energy usage periods).
5. Conclusions
This paper has examined the effect of parameter variation for four cases of DER mix using a dynamic two-objective Pareto-based evolutionary optimization. The objective function has been designed such that the first cost function is similar to the MILP objective function used by DER-CAM for finding the optimal mix of distributed energy resources from an economic and environmental perspective. The microgrid under consideration supplies a mid-rise apartment building, and the energy usage profiles used in the optimization and results obtained are to optimize energy usage for the specific building and microgrid.
The paper has made the following research contributions based on the results obtained:
- A Pareto-based modeling approach has been used to investigate the ability of DER-CAM to optimize distributed energy resources for real-life applications.
- The Pareto-based approach has been used to examine the effect of parameter variation on the optimization of an energy cost function. This has been achieved by observing the effect of parameter variation of selected cases of DER mix on the approximation of a two-objective Pareto front
- The Pareto-based approach has the capability to allocate DER in a sustainable and cost-effective manner.
Further research will examine the relationship between energy usage profiles with and without considerable peak energy usage profiles, and the economic viability of combining load shifting with energy export to the grid. Also, the effect of parameter selection and interaction in the objective function space will be investigated. The aim of this will be to improve the integrity of the non-dominated candidate solutions. Overall, it has been established that DER-CAM is indeed an effective tool for optimization of distributed energy resources for specific energy usage profiles. Also, the Pareto-based EA optimization approach provides an effective means of examining the effect of parameter variation on the behavior of the energy cost function.
Author Contributions
I.O.E. carried out the analysis and simulation under the supervision of Y.S. and Z.W.; Y.S. and Z.W. proofread and confirmed the analysis.
Acknowledgments
This research is supported partially by South African National Research Foundation Grants (No. 112108 and 112142), and South African National Research Foundation Incentive Grant (No. 95687 and 114911), Eskom Tertiary Education Support Programme Grants (Yanxia Sun and Zenghui Wang), Research grant from URC of University of Johannesburg.
Conflicts of Interest
The authors declare no conflict of interest.
Abbreviations
| Acronyms | Parameters | |
| PV | Photovoltaic | t = 1 h |
| DER-CAM | Distributed Energy | d = 1–365 |
| Resource Customer Adoption Model | For f1(x,t): | |
| DER | Distributed energy resources | battery charging constraint |
| MOEA | Multi-objective evolutionary algorithm | cost coefficient for DER |
| MIGD | Mean inverted generational distance | maximum energy generation |
| SCADA | Supervisory control and data acquisition | coefficient for DER |
| OF | Objective function | capital cost coefficient for DER |
| DSM | Demand-side management | fixed investment capital cost coefficient for DER |
| ToU | Time-of-use | power generation coefficient for PV module |
| HOMER | Hybrid Optimisation Model for Electric Renewables | maximum power generation coefficient for PV module |
| power generation capacity coefficient for PV module | ||
| EV | Electric vehicle | |
| V2G | Voltage-to-the-grid | |
| MILP | Mixed-integer linear programming | energy conversion coefficient for PV module |
| OSR | Optimal stopping rule | current generation coefficient for PV module |
| MFCFS | Modified first come first serve | time-of-use operating constraint for DER |
| PEEDF | Priority enable early deadline first | maximum power generated by heat pump |
| PEM | Point estimate method | power supplied by heat pump in DER mix |
| DE | Differential evolution | heat pump operating coefficient in DER mix |
| PSV | Pareto set variation | For f2(x,t): |
| PS | Pareto set | minimum operating power for battery state-of-charge |
| PF | Pareto front | maximum operating power for battery state-of-charge |
| IGD | Inverted generational distance | daily battery operating power wrt state-of -charge |
| NSGA-III | Non-dominated Sorting | hourly energy discharge rate of battery |
| Genetic Algorithm-III | hourly energy charging rate of battery | |
| NBI | Normal boundary intersection | |
| FE | Feature evaluation | |
| maximum power delivered by battery converter | ||
| output voltage of PV module | ||
| open-circuit voltage of PV module | ||
| maximum voltage at temperature T | ||
| power supplied by PV module at time t | ||
| power delivered at temperature T | ||
| power supplied by heat pump at time t | ||
| pump voltage coefficient at time t | ||
| pump temperature coefficient at time t | ||
| pump reference power | ||
| heat delivered by pump at time t | ||
| pump heating coefficient at time t | ||
| temprature differential for heat pump at time t | ||
References
- Steen, D.; Stadler, M.; Cardoso, G.; Groissböck, M.; DeForest, N.; Marnay, C. Modeling of thermal storage systems in MILP distributed energy resource models. Appl. Energy 2015, 137, 782–792. [Google Scholar] [CrossRef]
- Feng, X.; Stoupis, J.; Mohagheghi, S.; Larsson, M. Introduction to Smart Grid Applications. In Smart Grid: Applications, Communications, and Security; John Wiley & Sons: Hoboken, NJ, USA, 2012; pp. 25–26. [Google Scholar]
- Salpakari, J.; Lund, P. Optimal and rule-based control strategies for energy flexibility in buildings with PV. Appl. Energy 2016, 161, 425–436. [Google Scholar] [CrossRef]
- Yang, A.; Su, Y.; Wen, C.; Yuan, Y.; Wang, W.; Cheng, C. Estimation of wind power generation in dense urban area. Appl. Energy 2016, 171, 213–230. [Google Scholar] [CrossRef]
- Cuadra, L.; Pino, M.; Nieto-Borge, J.; Salcedo-Sanz, S. Optimizing the structure of distribution smart grids with renewable generation against abnormal conditions: A complex networks approach with evolutionary algorithms. Energies 2017, 10, 1097. [Google Scholar] [CrossRef]
- Colak, I.; Sagiroglu, S.; Fulli, G.; Yesilbudak, M.; Covrig, C. A survey on the critical issues in smart grid technologies. Renew. Sustain. Energy Rev. 2016, 54, 396–405. [Google Scholar] [CrossRef]
- Tuballa, M.; Abundo, M. A review of the development of Smart Grid technologies. Renew. Sustain. Energy Rev. 2016, 59, 710–725. [Google Scholar] [CrossRef]
- Yoldas, Y.; Onen, A.; Muyeen, S.; Vasilakos, A.; Alan, I. Enhancing smart grid with microgrids: Challenges abnd opportunities. Renew. Sustain. Energy Rev. 2017, 72, 205–214. [Google Scholar] [CrossRef]
- Mallol-Poyato, R.; Salcedo-Sanz, S.; Diaz-Villar, P. Optimal discharge scheduling of energy storage systems in MicroGrids based on hyperheuristics. Renew. Energy 2015, 83, 13–24. [Google Scholar] [CrossRef]
- Cuadra, L.; Salcedo-Sanz, S.; del Ser, J.; Jimenez-Fernandez, S.; Geem, Z. A critical review of robustness in power grids using complex networks concepts. Energies 2015, 8, 9211–9265. [Google Scholar] [CrossRef] [Green Version]
- Ardabili, S.F.; Najafi, B.; Shamshirband, S.M.B.B.; Deo, R.; Chau, K. Computational intelligence approach for modeling hydrogen production: A review. Eng. Appl. Comput. Fluid Mech. 2018, 12, 438–458. [Google Scholar]
- Cuadra, L.; Salcedo-Sanz, S.; Nieto-Borge, J.; Alexandra, E.; Rodriguez, G. Computational intelligence in wave energy: Comprehensive review and case study. Renew. Sustain. Energy Rev. 2016, 58, 1223–1246. [Google Scholar] [CrossRef]
- Jiang, L.; Srivatsan, R.; Maskell, D. Computational intelligence techniques for maximum power point tracking in PV systems: A review. Renew. Sustain. Energy Rev. 2018, 85, 14–45. [Google Scholar] [CrossRef]
- Tant, J.; Geth, F.; Six, D.; Tant, P.; Driesen, J. Multiobjective battery storage to improve PV integration in residential distribution grids. IEEE Trans. Sustain. Energy 2013, 4, 182–191. [Google Scholar] [CrossRef]
- Hassan, A.S.; Cipcigan, L.; Jenkins, N. Optimal battery storage operation for PV systems with tariff incentives. Appl. Energy 2017, 203, 422–441. [Google Scholar] [CrossRef]
- Kiranyaz, S.; Ince, T.; Gabbouj, M. Multidimensional Particle Swarm Optimization for Machine Learning and Pattern Recognition; Springer: Berlin, Germany, 2014. [Google Scholar]
- Eiben, A.; Smith, J. What is an evolutionary algorithm? In Introduction to Evolutionary Computing; Springer: Berlin, Germany, 2015; pp. 25–48. [Google Scholar]
- Interest-Aware Energy Collection & Resource Management in Machine to Machine Commnications. Ad Hoc Netw. 2018, 68, 48–57.
- Gershman, S.J. Reinforcement learning and causal models. In The Oxford Handbook of Causal Reasoning; Oxford University Press: Oxford, UK, 2017; p. 295. [Google Scholar]
- Kaelbling, P.; Littman, M.L.; Moore, A.W. Reinforcement learning: A Survey. J. Artif. Intell. Res. 1996, 4, 237–285. [Google Scholar]
- Hartvigsson, E.; Stadler, M.; Cardoso, G. Rural electrification and capacity expansion with an integrated modeling approach. Renew. Energy 2018, 115, 509–520. [Google Scholar] [CrossRef]
- Olatomiwa, L.; Mekhilef, S.; Huda, A.; Ohunakin, O.S. Economic evaluation of hybrid energy systems for rural electrification in six geo-political zones of Nigeria. Renew. Energy 2015, 83, 435–446. [Google Scholar] [CrossRef]
- Sen, R.; Bhattacharyya, S.C. Off-grid electricity generation with renewable energy technologies in India: An application of HOMER. Renew. Energy 2014, 62, 388–398. [Google Scholar] [CrossRef]
- Mesaric, P.; Krajcar, S. Home demand side management integrated with electric vehicles and renewable energy sources. Energy Build. 2015, 108, 1–9. [Google Scholar] [CrossRef]
- Rasheed, B.; Javaid, N.; Ahmad, A.; Awais, M. Priority and delay constrained demand side management in real-time price environment with renewable energy source. Int. J. Energy Res. 2016, 40, 2002–2021. [Google Scholar] [CrossRef]
- Gazijahani, F.S.; Hosseinzadeh, H.; Tagizadeghan, N.; Salehi, J. A New Point Estimate Method for Stochastic Optimal Operation of Smart Distribution Systems Considering Demand Response Programs. In Proceedings of the 22nd Electrical Power Distribution Conference, Semnan, Iran, 19–20 April 2017. [Google Scholar]
- Hassan, A.S.; Cipcigan, L.; Jenkins, N. Impact of optimised distributed energy resources on local grid constraints. Energy 2018, 142, 878–895. [Google Scholar] [CrossRef]
- Ewald, F.; Cardoso, G.; Heleno, M.; Stadler, M.; DeForest, N.; Mashayekh, S. DER-CAM: Decision Support Tool for Decentralized Energy Systems; Berkley Labs: Berkley, CA, USA, 2016. [Google Scholar]
- Tian, Y.; Cheng, R.; Zhang, X.; Jin, Y. PlatEMO: A MATLAB platform for evolutionary multi-objective optimization. IEEE Comput. Intell. Mag. 2017, 12, 73–87. [Google Scholar] [CrossRef]
- Deb, K.; Jain, H. An evolutionary many-objective optimization algorithm using reference-point-based nondominated sorting approach, part i: Solving problems with box constraints. IEEE Trans. Evolut. Comput. 2014, 18, 577–601. [Google Scholar] [CrossRef]
- Deb, K.; Jain, H. An evolutionary many-objective optimization algorithm using reference-point-based nondominated sorting approach, part ii: Handling constraints and extending to an adaptive approach. IEEE Trans. Evolut. Comput. 2014, 18, 602–622. [Google Scholar] [CrossRef]
- Das, I.; Dennis, J.E. Normal Boundary Intersection: A new method for generating the Pareto Surface in nonlinear multicriteria optimization problems. Siam J. Optim. 1998, 8, 631–657. [Google Scholar] [CrossRef]
Figure 1.
Steps involved in the process of optimization.
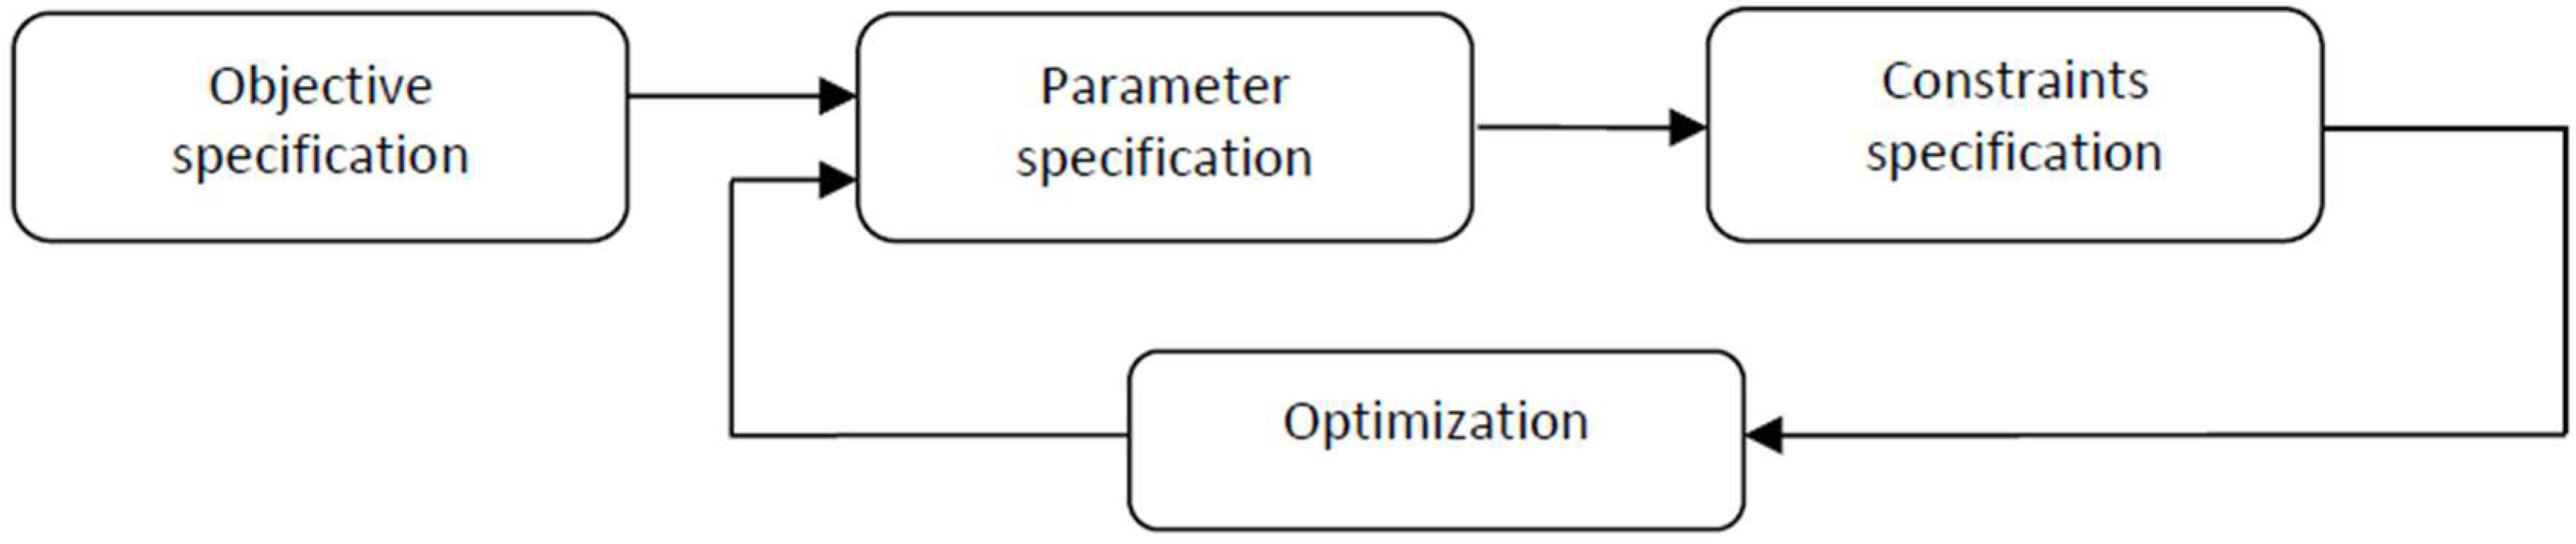
Figure 2.
Proposed optimization approach for comparison with distributed energy resources (DER)-CAM optimization.
Figure 2.
Proposed optimization approach for comparison with distributed energy resources (DER)-CAM optimization.
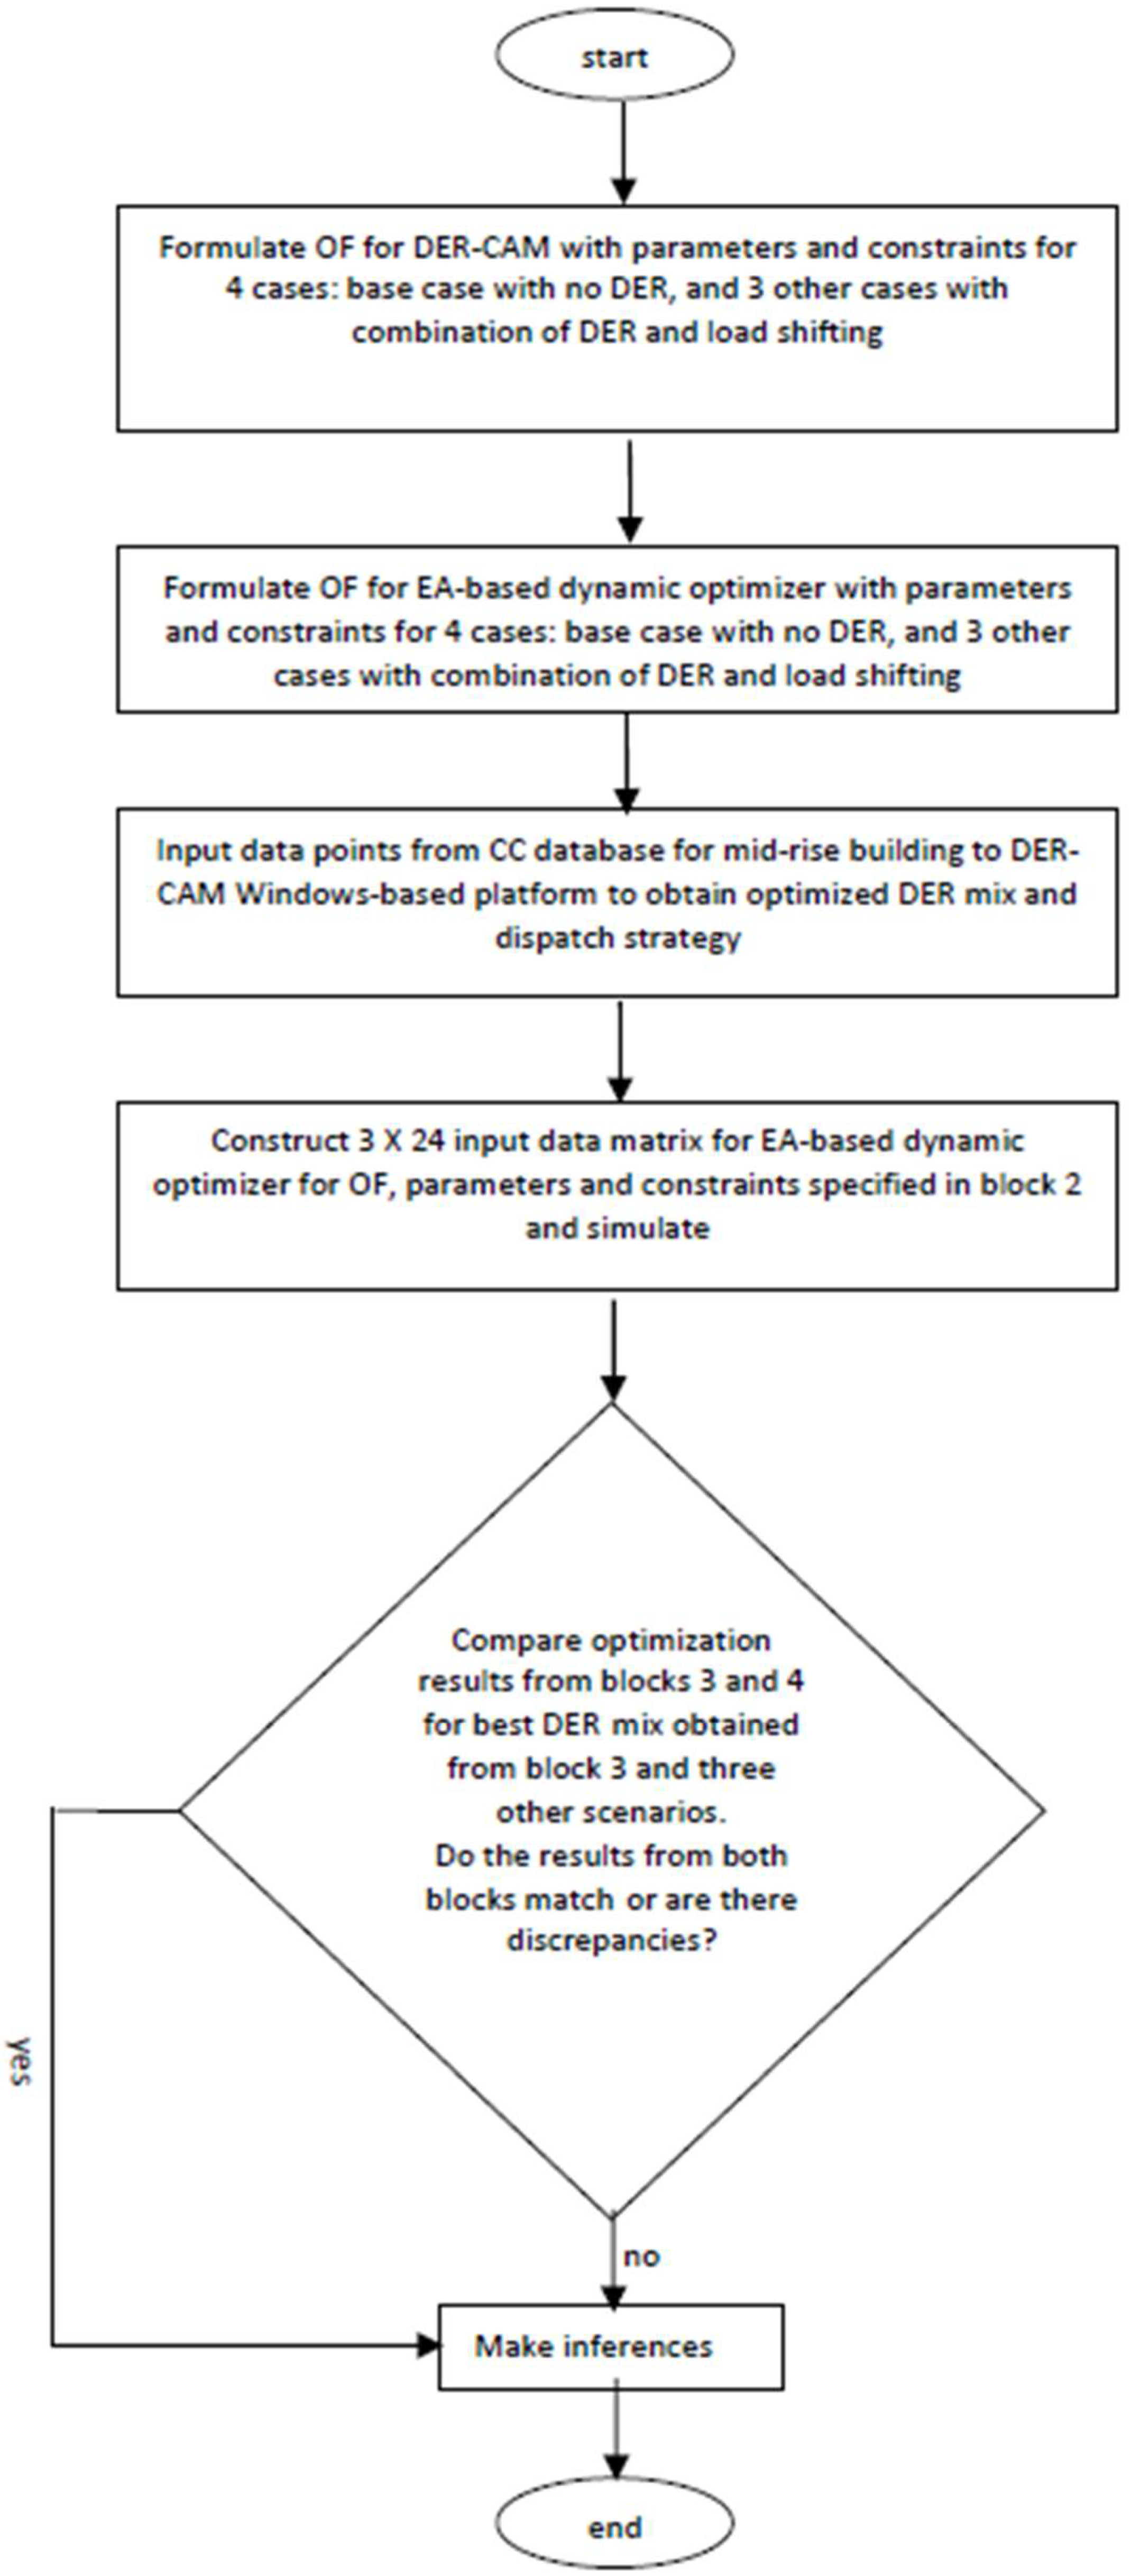
Figure 3.
14-bus microgrid connecting mid-rise apartments (all of the bus connection cable lengths are in meters) [27].
Figure 3.
14-bus microgrid connecting mid-rise apartments (all of the bus connection cable lengths are in meters) [27].

Figure 4.
True Pareto front (PF) for f1(x,t) and f2(x,t).

Figure 5.
Two-objective PF for (a) Case 1, (b) Case 2, (c) Case 3, (d) Case 4.
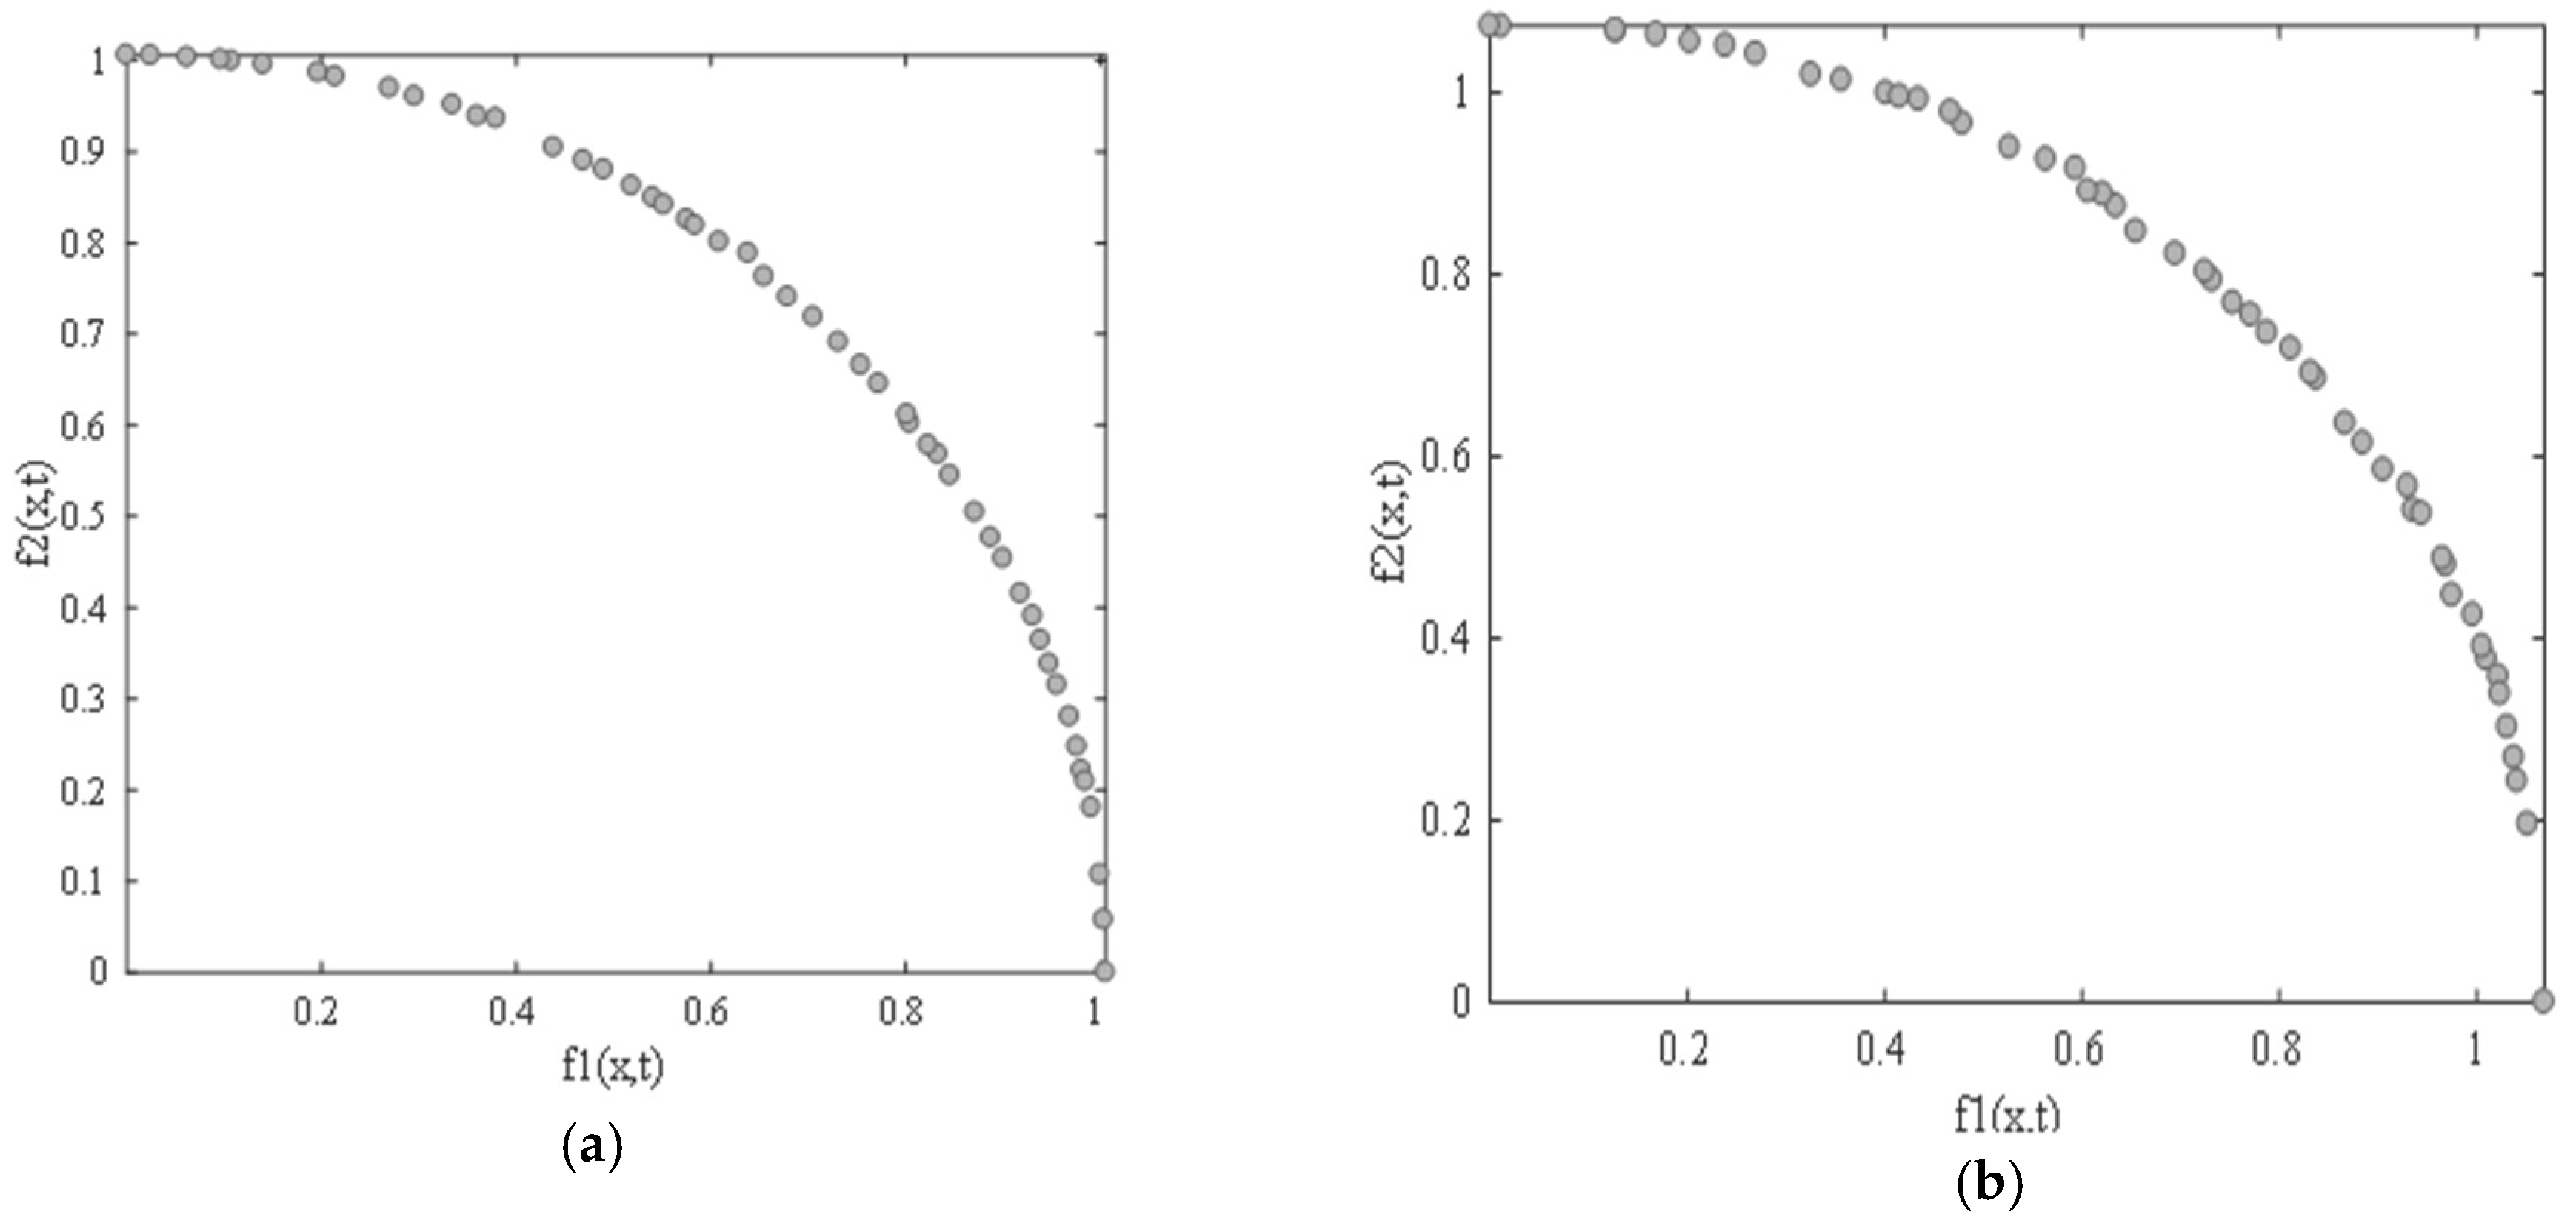

Figure 6.
Solution Spread over the PF for (a) Case 1, (b) Case 2, (c) Case 3, (d) Case 4.


Figure 7.
Pareto Set Variation over the PF for (a) Case 1, (b) Case 2, (c) Case 3, (d) Case 4.

Table 1.
Parameter Settings for Two-Objective Pareto-based Evolutionary Algorithm.
| Parameter | Setting |
|---|---|
| Number of dimensions | 100 |
| Number of feature evaluations (FEs) | 10,000 |
| Number of simulation runs per case | 10 |
| Mutation rate | 1/n |
| Crossover rate (adaptive) | 0.5–1.0 |
| Population size | 50 |
| Selection strategy | DE/rand-to-best/1 |
| Number of generations | 500 |
Table 2.
Mean inverted generational distance (MIGD) values over 10 runs for each case of distributed energy resources (DER) mix.
Table 2.
Mean inverted generational distance (MIGD) values over 10 runs for each case of distributed energy resources (DER) mix.
| Case 1 | Case 2 | Case 3 | Case 4 | |
|---|---|---|---|---|
| Run 1 | 1.5672 × 10⁻² | 2.0148 × 10⁻² | 3.7531 × 10⁻² | 4.4972 × 10⁻¹ |
| Run 2 | 2.2234 × 10⁻¹ | 3.5951 × 100 | 2.1093 × 100 | 1.7693 × 101 |
| Run 3 | 2.0087 ×10⁻³ | 3.8502 × 10⁻² | 1.1096 × 10⁻¹ | 3.0875 × 10² |
| Run 4 | 2.5073 × 10⁻¹ | 1.9617 × 10⁻¹ | 1.0462 × 100 | 2.9839 × 10² |
| Run 5 | 2.3394 × 10⁻¹ | 3.5183 × 100 | 5.1907 × 10⁻¹ | 4.4097 × 100 |
| Run 6 | 1.9431 × 10⁻³ | 2.6783 × 10⁻² | 4.4219 × 10⁻¹ | 3.8519 × 101 |
| Run 7 | 2.1104 × 10⁻² | 1.5072 × 10⁻³ | 6.0173 × 10⁻² | 6.3184 × 10⁻¹ |
| Run 8 | 1.8257 × 10⁻¹ | 2.3725 × 100 | 3.2038 × 100 | 5.0318 × 101 |
| Run 9 | 1.9736 × 10⁻³ | 4.5932 × 10⁻² | 1.2563 × 10⁻¹ | 2.3058 × 100 |
| Run 10 | 2.8847 × 10⁻¹ | 2.7931 × 10⁻¹ | 3.5072 × 10⁻² | 1.9417 × 101 |
© 2018 by the authors. Licensee MDPI, Basel, Switzerland. This article is an open access article distributed under the terms and conditions of the Creative Commons Attribution (CC BY) license (http://creativecommons.org/licenses/by/4.0/).
Share and Cite
MDPI and ACS Style
Essiet, I.O.; Sun, Y.; Wang, Z. Analysis of the Effect of Parameter Variation on a Dynamic Cost Function for Distributed Energy Resources: A DER-CAM Case Study. Appl. Sci. 2018, 8, 884. https://doi.org/10.3390/app8060884
AMA Style
Essiet IO, Sun Y, Wang Z. Analysis of the Effect of Parameter Variation on a Dynamic Cost Function for Distributed Energy Resources: A DER-CAM Case Study. Applied Sciences. 2018; 8(6):884. https://doi.org/10.3390/app8060884
Chicago/Turabian StyleEssiet, Ima O., Yanxia Sun, and Zenghui Wang. 2018. "Analysis of the Effect of Parameter Variation on a Dynamic Cost Function for Distributed Energy Resources: A DER-CAM Case Study" Applied Sciences 8, no. 6: 884. https://doi.org/10.3390/app8060884
Note that from the first issue of 2016, this journal uses article numbers instead of page numbers. See further details here.