Article

Realization of the Zone Length Measurement during Zone Refining Process via Implementation of an Infrared Camera

by
Danilo C. Curtolo
,
Xiaoxin Zhang
,
Martin J. R. Rojas
,
Semiramis Friedrich
*,† and
Bernd Friedrich
IME Institute of Process Metallurgy and Metal Recycling, RWTH Aachen University, 52056 Aachen, Germany
*
Author to whom correspondence should be addressed.
These authors contributed equally to this work.
Appl. Sci. 2018, 8(6), 875; https://doi.org/10.3390/app8060875
Submission received: 13 April 2018 / Revised: 18 May 2018 / Accepted: 23 May 2018 / Published: 25 May 2018

Abstract

:
Zone refining, as the currently most common industrial process to attain ultrapure metals, is influenced by a variety of factors. One of these parameters, the so-called “zone length”, affects not only the ultimate concentration distribution of impurities, but also the rate at which this distribution is approached. This important parameter has however neither been investigated experimentally, nor ever varied for the purpose of optimization. This lack of detections may be due to the difficult temperature measurement of a moving molten area in a vacuum system, of which the zone refining methodology is comprised. Up to now, numerical simulation as a combination of complex mathematical calculations, as well as many assumptions has been the only way to reveal it. This paper aims to propose an experimental method to accurately measure the molten zone length and to extract helpful information on the thermal gradient, temperature profile and real growth rate in the zone refining of an exemplary metal, in this case aluminum. This thermographic method is based on the measurement of the molten surface temperature via an infrared camera, as well as further data analysis through the mathematical software MATLAB. The obtained results show great correlation with the visual observations of zone length and provide helpful information to determine the thermal gradient and real growth rate during the whole process. The investigations in this paper approved the application of an infrared camera for this purpose as a promising technique to automatically control the zone length during a zone refining process.

1. Introduction

Zone refining is an effective way to produce high purity metals by controlling the impurities’ distribution in crystalline materials. It works by repeatedly moving one or a series of molten zones very slowly along a solid bulk. This process, like any other methodologies based on the principle of fractional crystallization, can be applied to refine those metals, in which the distribution coefficient (k) of the impurities is smaller or bigger than unity. That is the ratio of the concentration of an impurity in the solid phase to that in the liquid phase. The smaller the k, the more probable it is to remove that impurity from the base metal through zone refining even up to ultra-purity levels. This process was firstly introduced by W.G.Pfann for the purification of Germanium in 1952 [1], and since then, a large amount of investigation has been conducted with the focus on the optimization of experimental parameters for different materials. These optimized parameters generally include the effective distribution coefficient ( k e f f ), zone length, zone movement velocity and the number of passes.
Particularly, zone length optimization has been studied extensively due to its significant influence on time duration, yield, as well as final purity [2]. Burris et al. [3] showed that it is not necessary to keep the zone length constant from one pass to the next, i.e., refining efficiency can be improved by using a longer zone at the early passes, followed by a shorter zone at the later passes. Pfann [4] suggested to use a longer zone in the first part of the ingot, followed by a shorter zone in the second part. Through numerical and modeling analysis, Rodway and Hunt [5] introduced a variable zone size (VZS) technique, by which the zone length is always changing in relation to the position of the freezing (liquid to solid) interface as the heater moves. This technique was rather concentrated to move the center of the impurity further and not really employed to optimize the zone length. However, it is difficult to instantly control the zone length at all times practically, and until now, no experimental research has been conducted to control the zone length along the zone refined ingot. Ho et al. [6] have investigated the optimal zone length in a single zone pass and found out that it increases with the increase in the distribution coefficient (k) and decreases with the increasing number of zone passes. In addition, Spim et al. [2] concluded, also via numerical modeling, that using a zone length of 0.2L (L is the whole length of the bar) for the initial three passes, followed by 0.1L for the fourth to sixth passes and 0.05L for other passes could deliver satisfactory results.
Zone length, however, is influenced by many experimental parameters, like heating power, zone movement velocity, crucible material, charging material and the way of cooling, all of which make the precise regulation of the zone length remarkably challenging [7]. Especially working with materials with high thermal conductivity for the charging material and/or crucible, [8] leads to an even more difficult achievement of a stable zone length. In order to compensate these problems, many researchers [9,10,11,12] attempted to use simulative or modeling methods to predict the zone length in correlation with experimental parameters, with regard to the heat transfer process in the whole system. However, the values of these parameters corresponding to one certain zone length differ significantly from another one [13]. Therefore, it is motivated to measure and even control the zone length in real time with some special techniques directly during the refining process. This work is to demonstrate a new methodology to detect, as well as to control the zone length in a horizontal zone refining system by installation and implementation of an infrared (IR) camera. Some corresponding characterization parameters, such as the temperature gradient and the real crystal growth rate, will be attained as subsidiary outcome, as well. The term “real” crystal growth is for the first time specified in this paper as the distance between the position of two moving freezing interfaces, measured by the camera, versus the measurement interval time. The real crystal growth varies along the bar due to the changing zone length. In contrast to this term, all modeling and simulating studies up to now concentrated on the theoretical growth rate as equal to the movement velocity of the heater with the pre-assumption of a constant zone length.

2. Experimental Assessment

The experimental part of this paper aimed to establish a methodology to accurately measure the length of the molten zone during the zone refining of metals. Here, aluminum was selected the exemplary metal, due to the less complicated handling and relatively lower processing temperature. This aluminum had a metallurgical purity of 99.8 wt%. However, aluminum has a very high thermal conductivity, which as described above, will make the investigation here rather challenging. Furthermore, information on the calibration of the IR camera, data acquisition and chemical analysis, as well as the correlation between thermography results with the experimental setup were investigated. Thermography can deliver some helpful information, such as the real growth rate, the thermal gradient in the molten zone and the temperature at the freezing interface, as well.

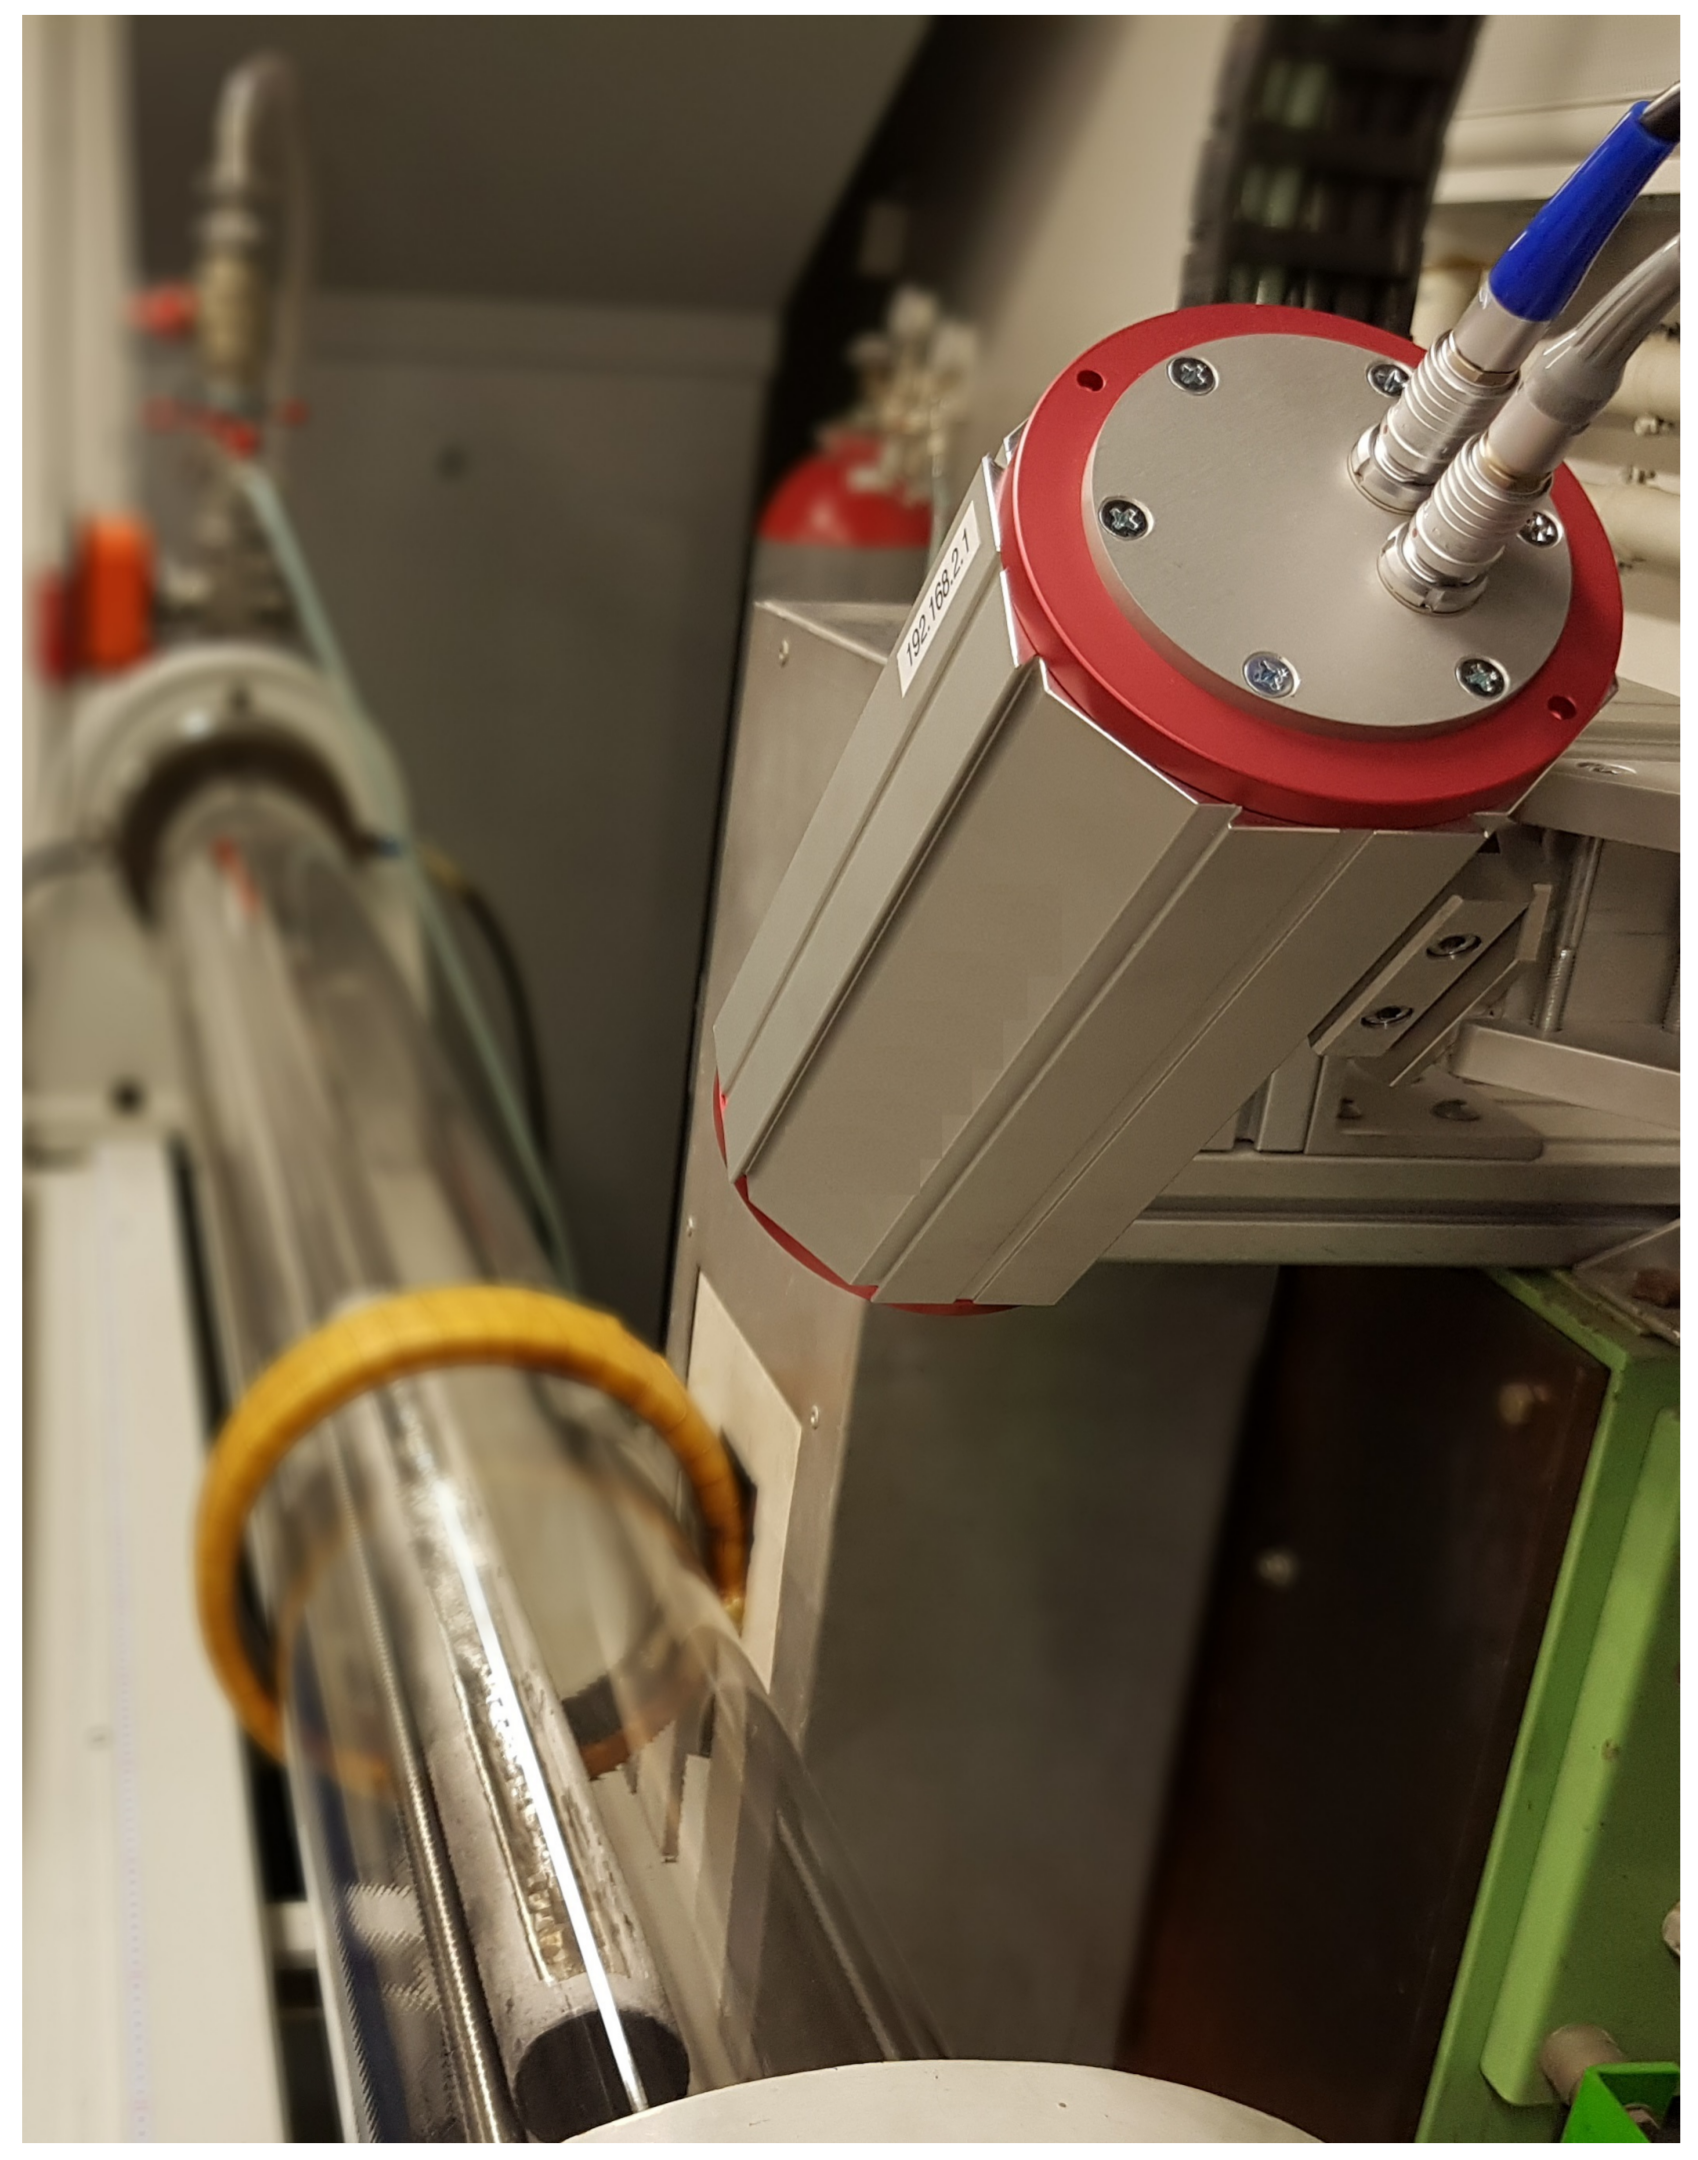
2.1. Zone Refining Equipment and Infrared Camera Setup

The trials were conducted in an industrial-scale horizontal zone refining equipment, equipped with a single induction heater (see Figure 1) capable of generating up to 45 kW with a maximum frequency of 10 kHz. The size of the quartz tube is L 1800 mm × D i n t 170 mm, and the heater can travel between 0.01 and 2.00 mm min−1 along the whole length of the equipment.
The process was recorded using an Infrared (IR) camera (see Figure 2) with a wide-angle lens of 4.8 mm (Horizontal field of view (HFOV) of 72.5°) and a pixel resolution of 1280 × 1024. This IR camera measures the infrared radiation in the spectral range between 0.78 and 1.1 μm, which allows the capture of the radiation passing through the quartz tube of the equipment. The IR camera is mounted on the heater unit and moves along with the induction coil, as seen in Figure 2. The thermography data were then recorded via the software from the IR camera. This software was initially calibrated with the practically obtained emissivity values of a lightly oxidized aluminum sample at a temperature range of 650–700 °C, as seen in Table 1.
Since the temperature data captured by the IR camera refer to the surface emitted temperature, the calibration data were obtained by measuring the temperature of the metal with the thermocouple (type K) in a position slight below the melt surface. The emissivity data of the camera were later adjusted to match the recorded temperature of the sample. Another calibration necessity is related to the quartz tube layer between the molten surface and the camera. This was performed by testing a 3-mm quartz glass with the same shape as the original one in order to compensate the changes in the emissivity due to the quartz transmissivity effect.

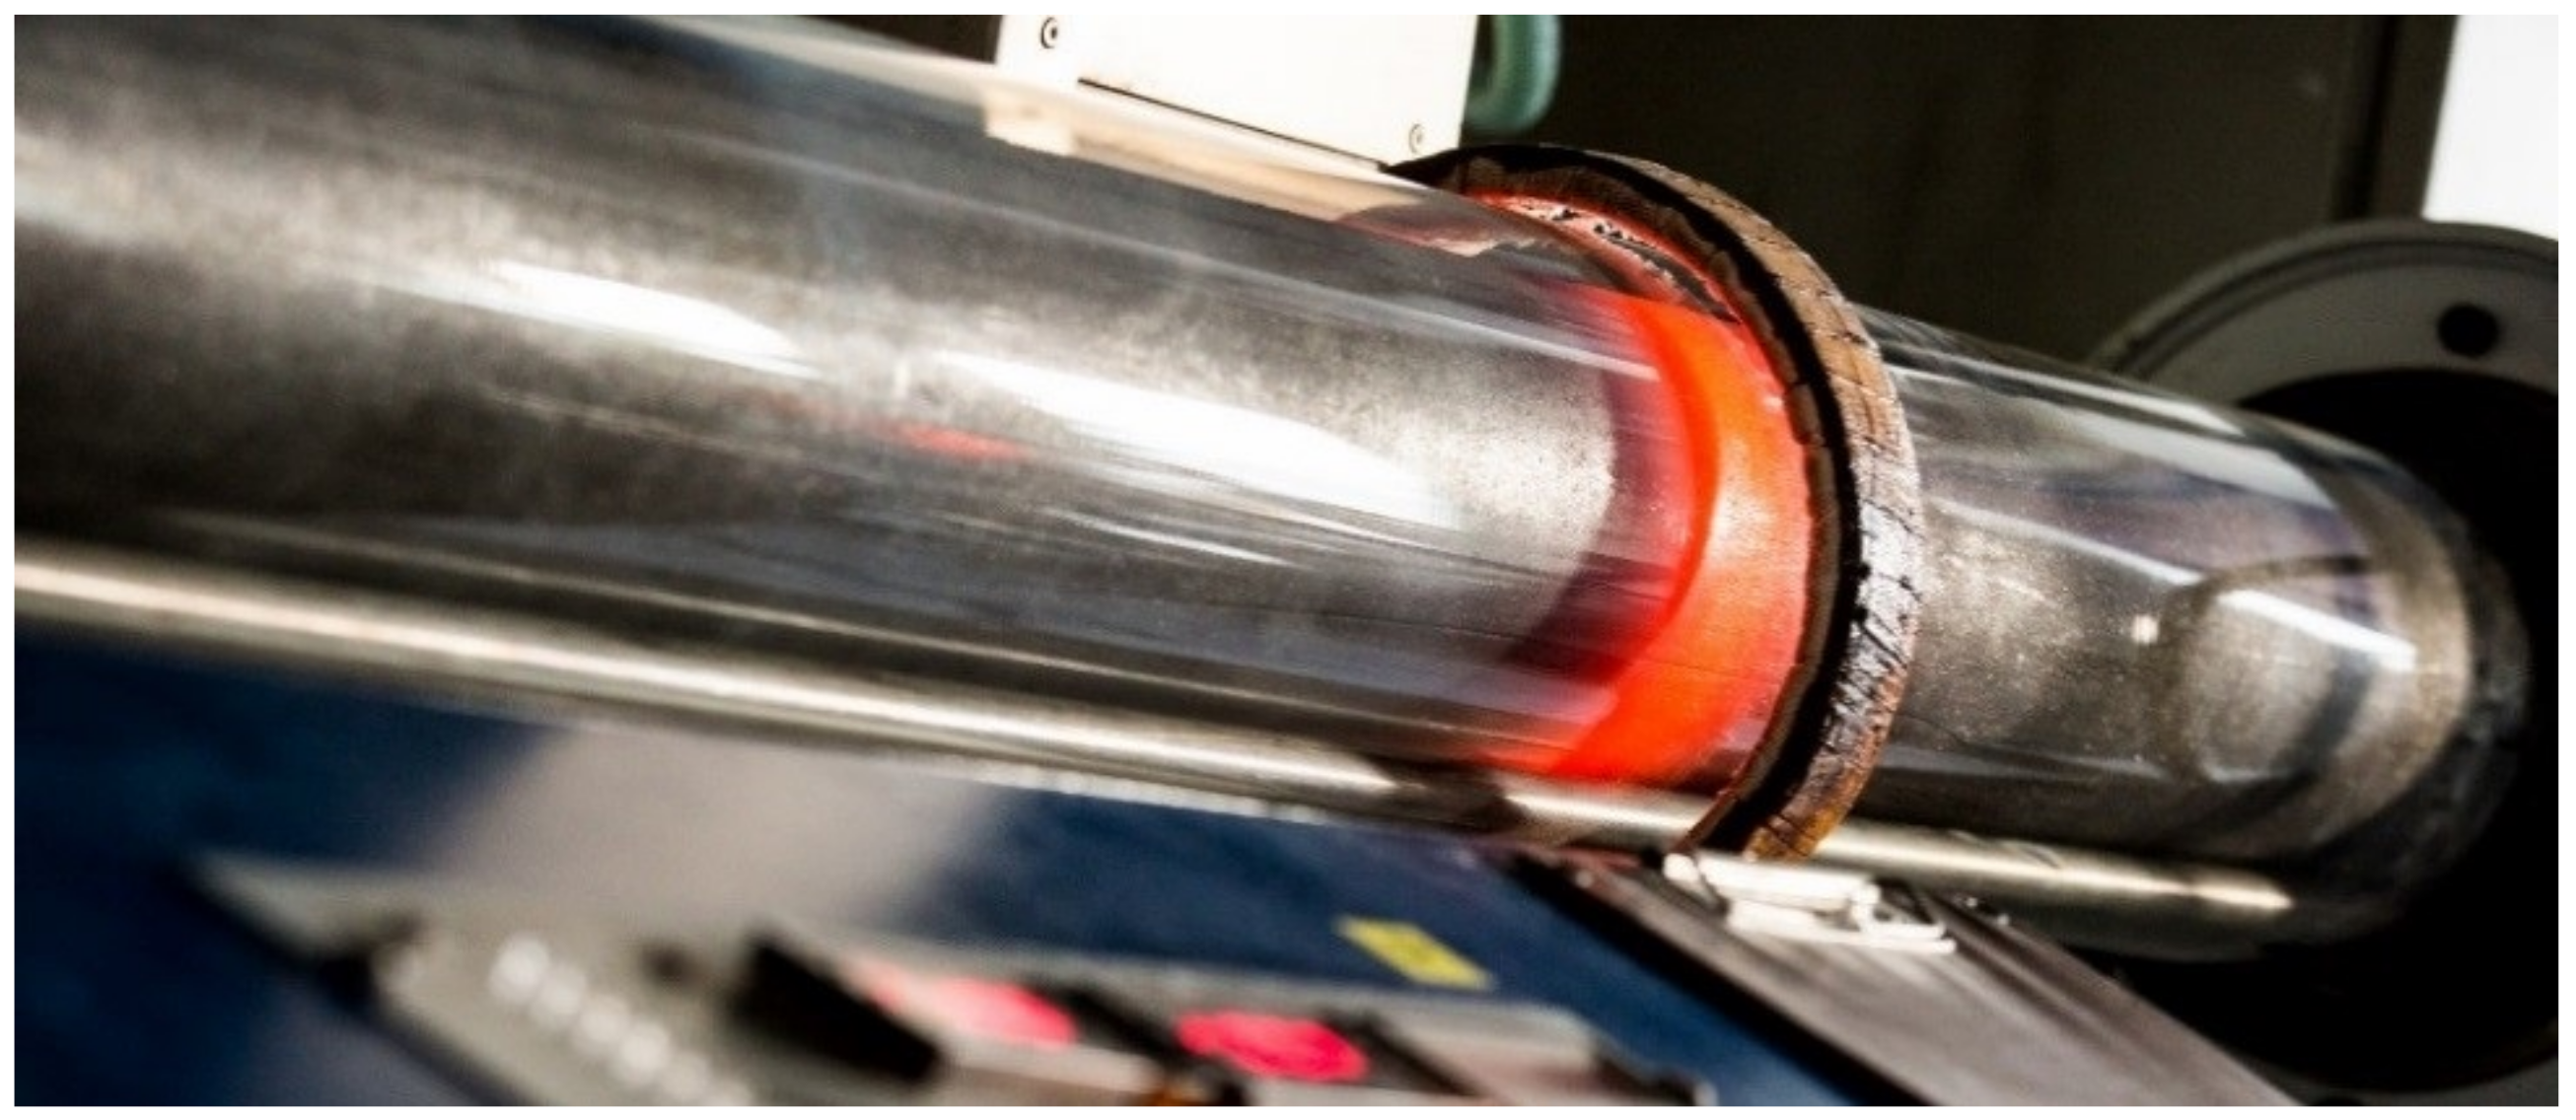
2.2. Zone Refining Trial

The trials were carried out using a graphite crucible with an internal slot of L 600 × W 35 × H 30 mm as the heating susceptor to absorb the electromagnetic energy from the induction heater and transfer it to the aluminum. The aluminum bar was then zone refined under a 400-mbar Ar-atmosphere, applying a power of 10–11 kW and a heater movement velocity of 0.8 mm min−1 from right to left. The coil movement, as well as the data recording by the infrared camera both started when the molten zone had a 200-mm length and ended when the heater moved outside of the crucible, as illustrated in Figure 3.

3. Results and Discussion

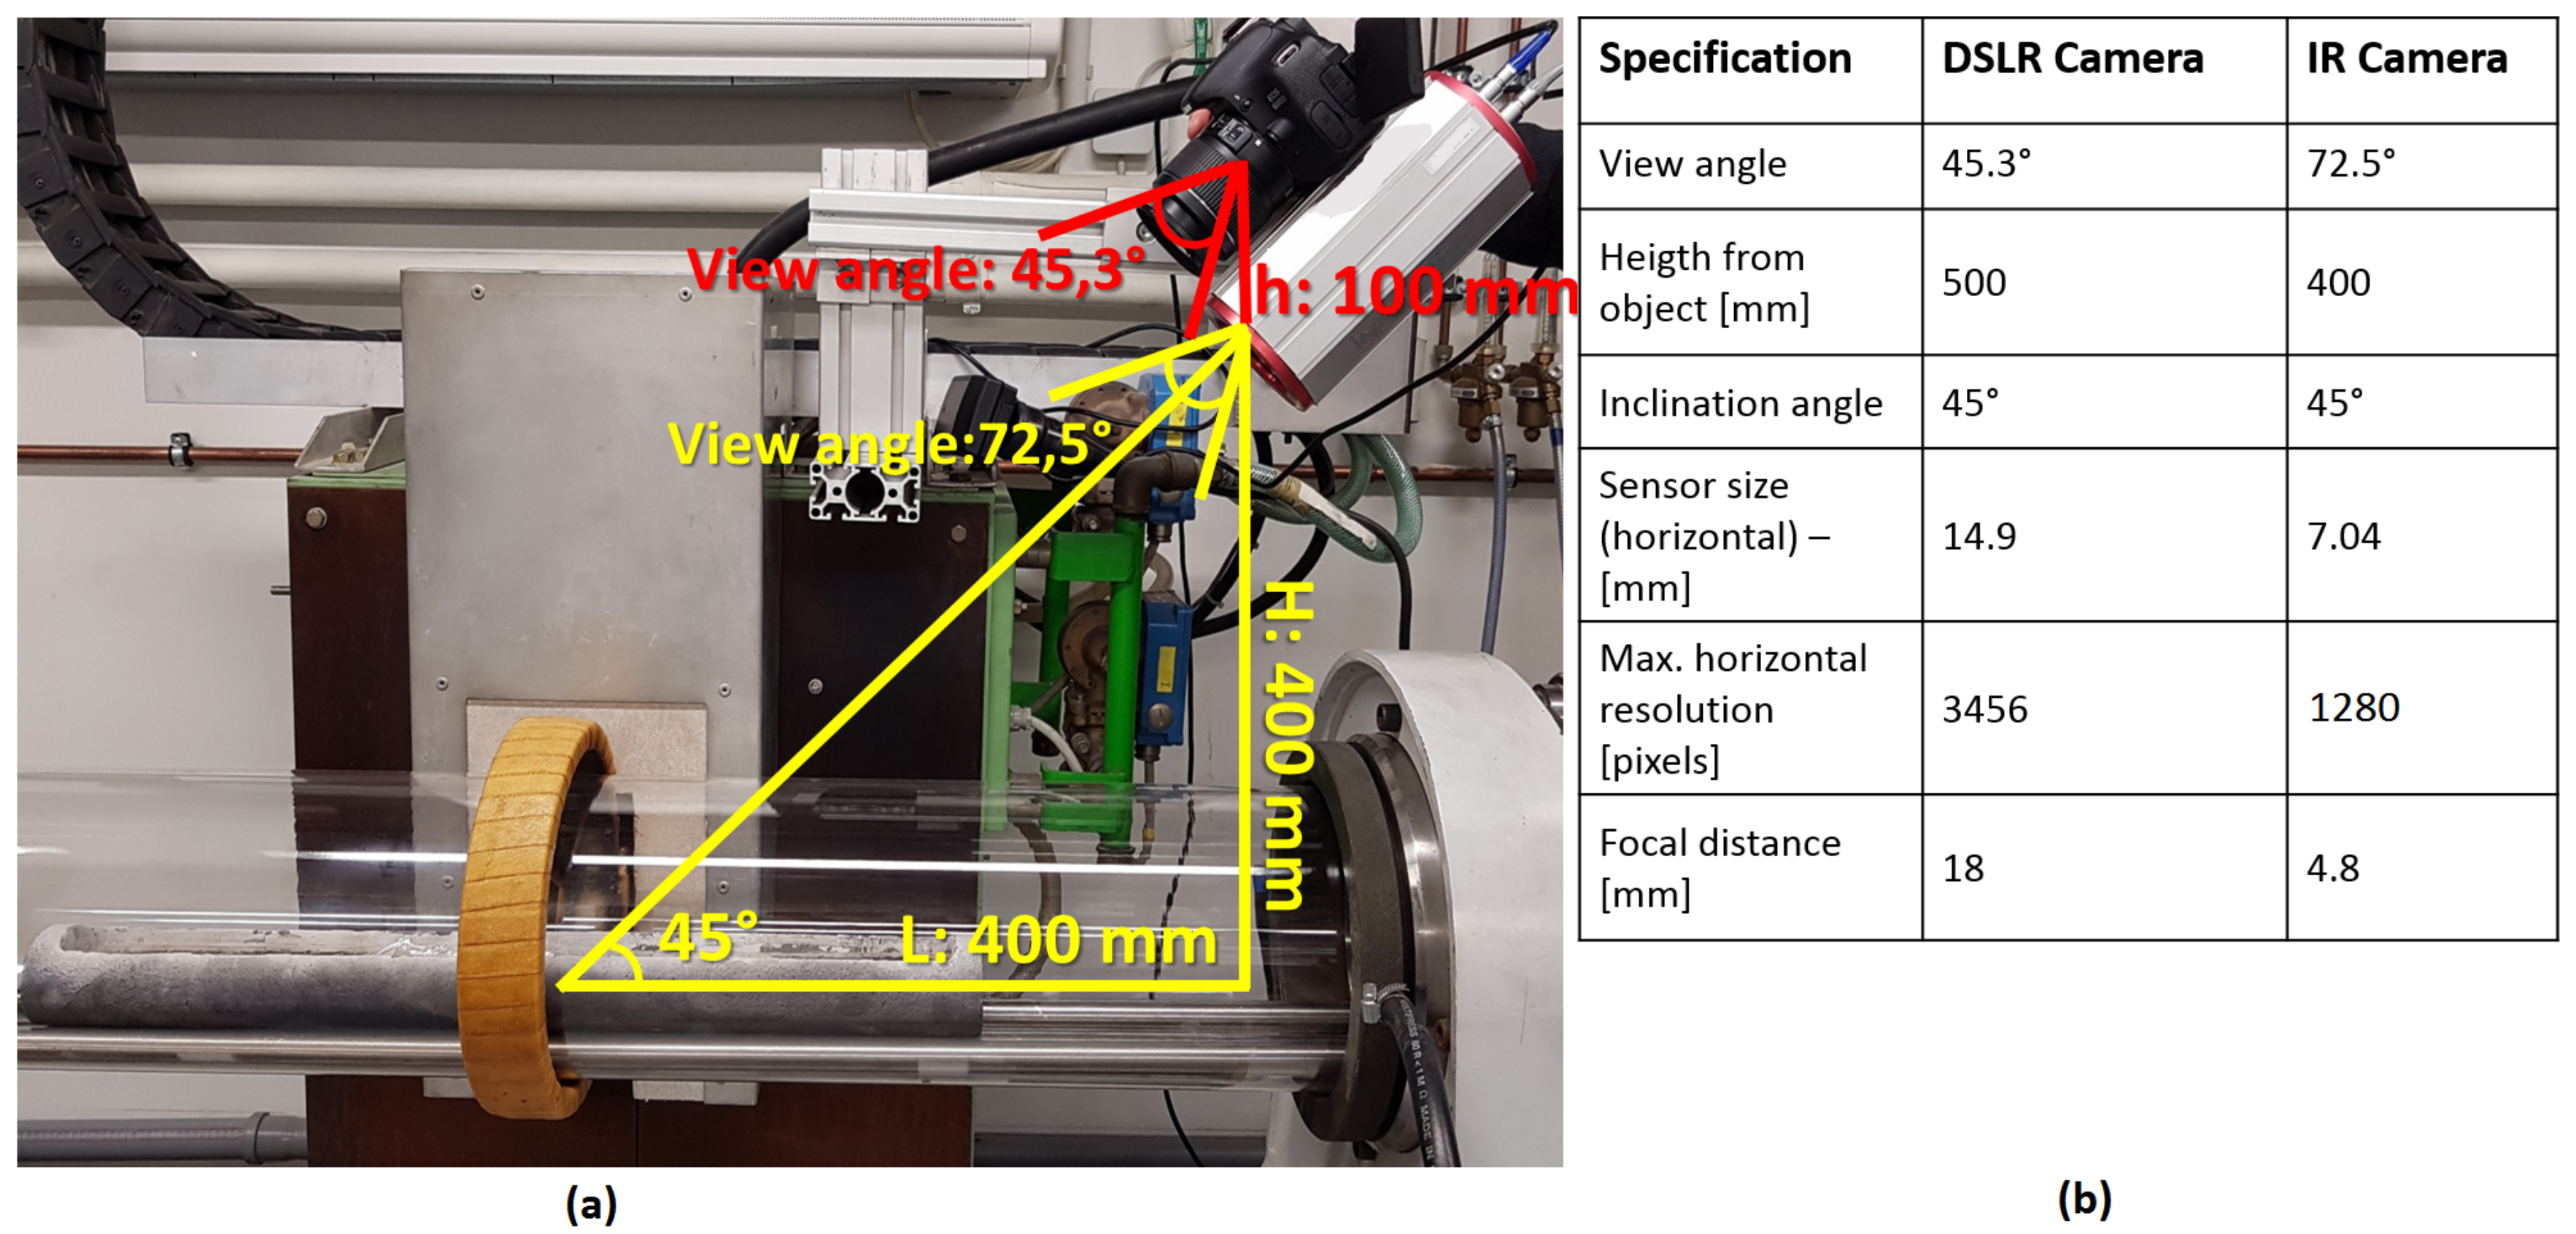
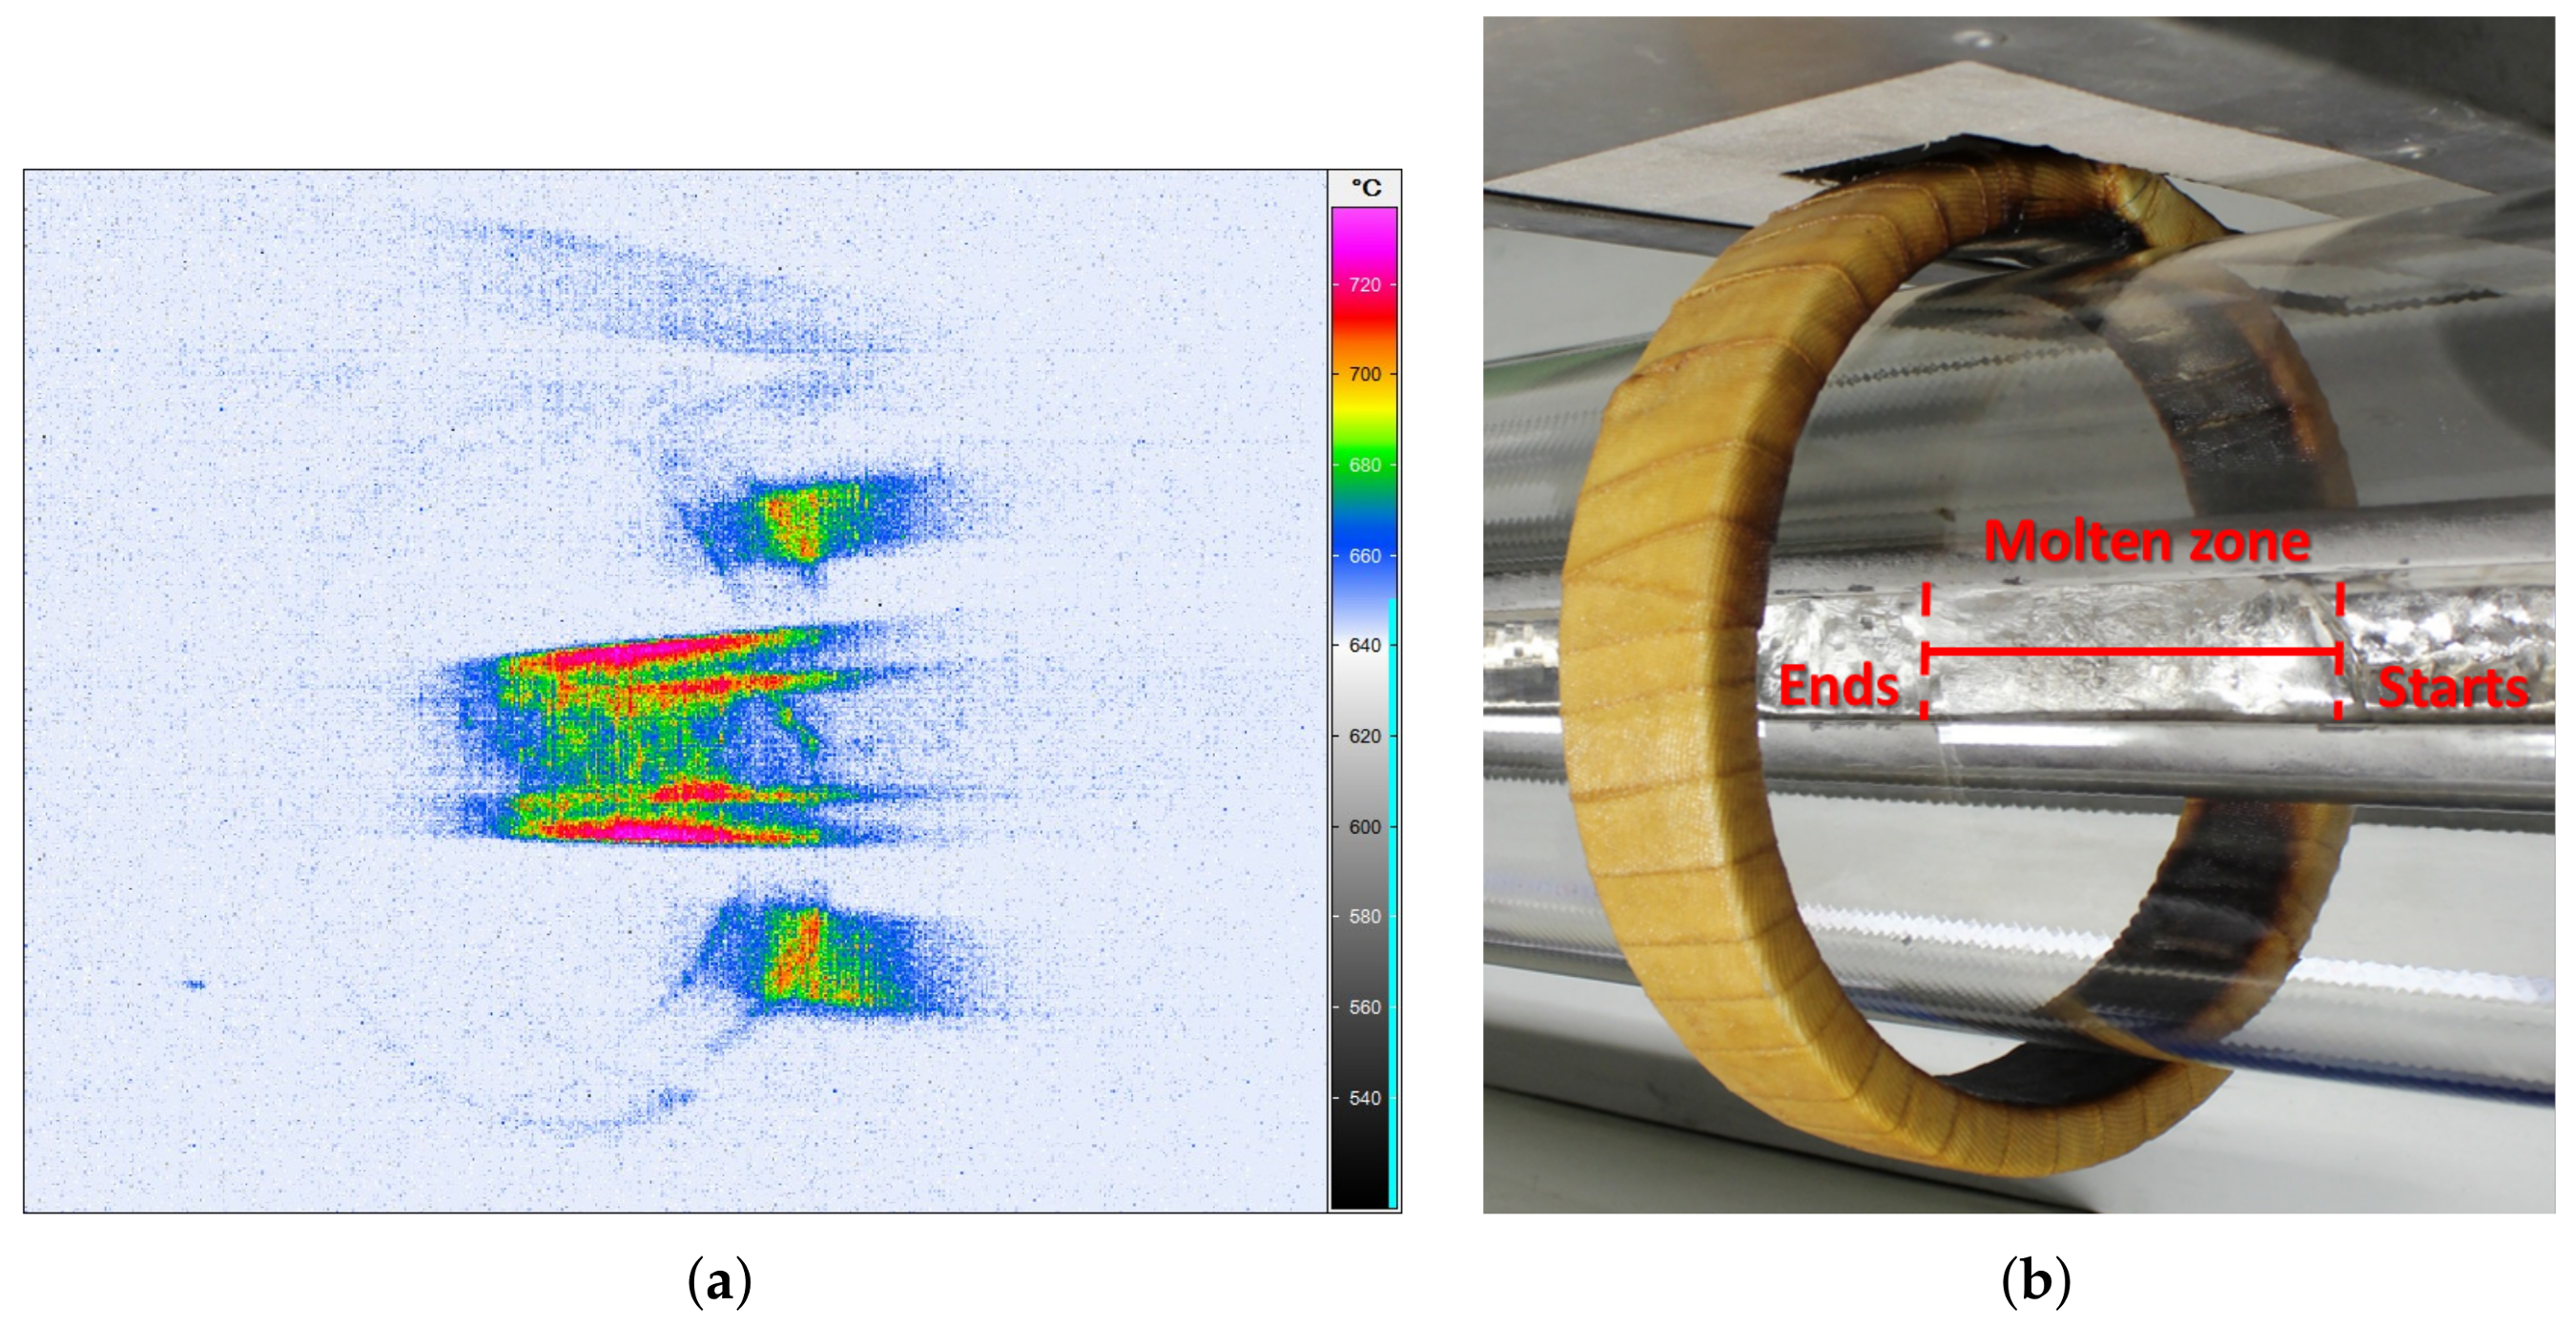
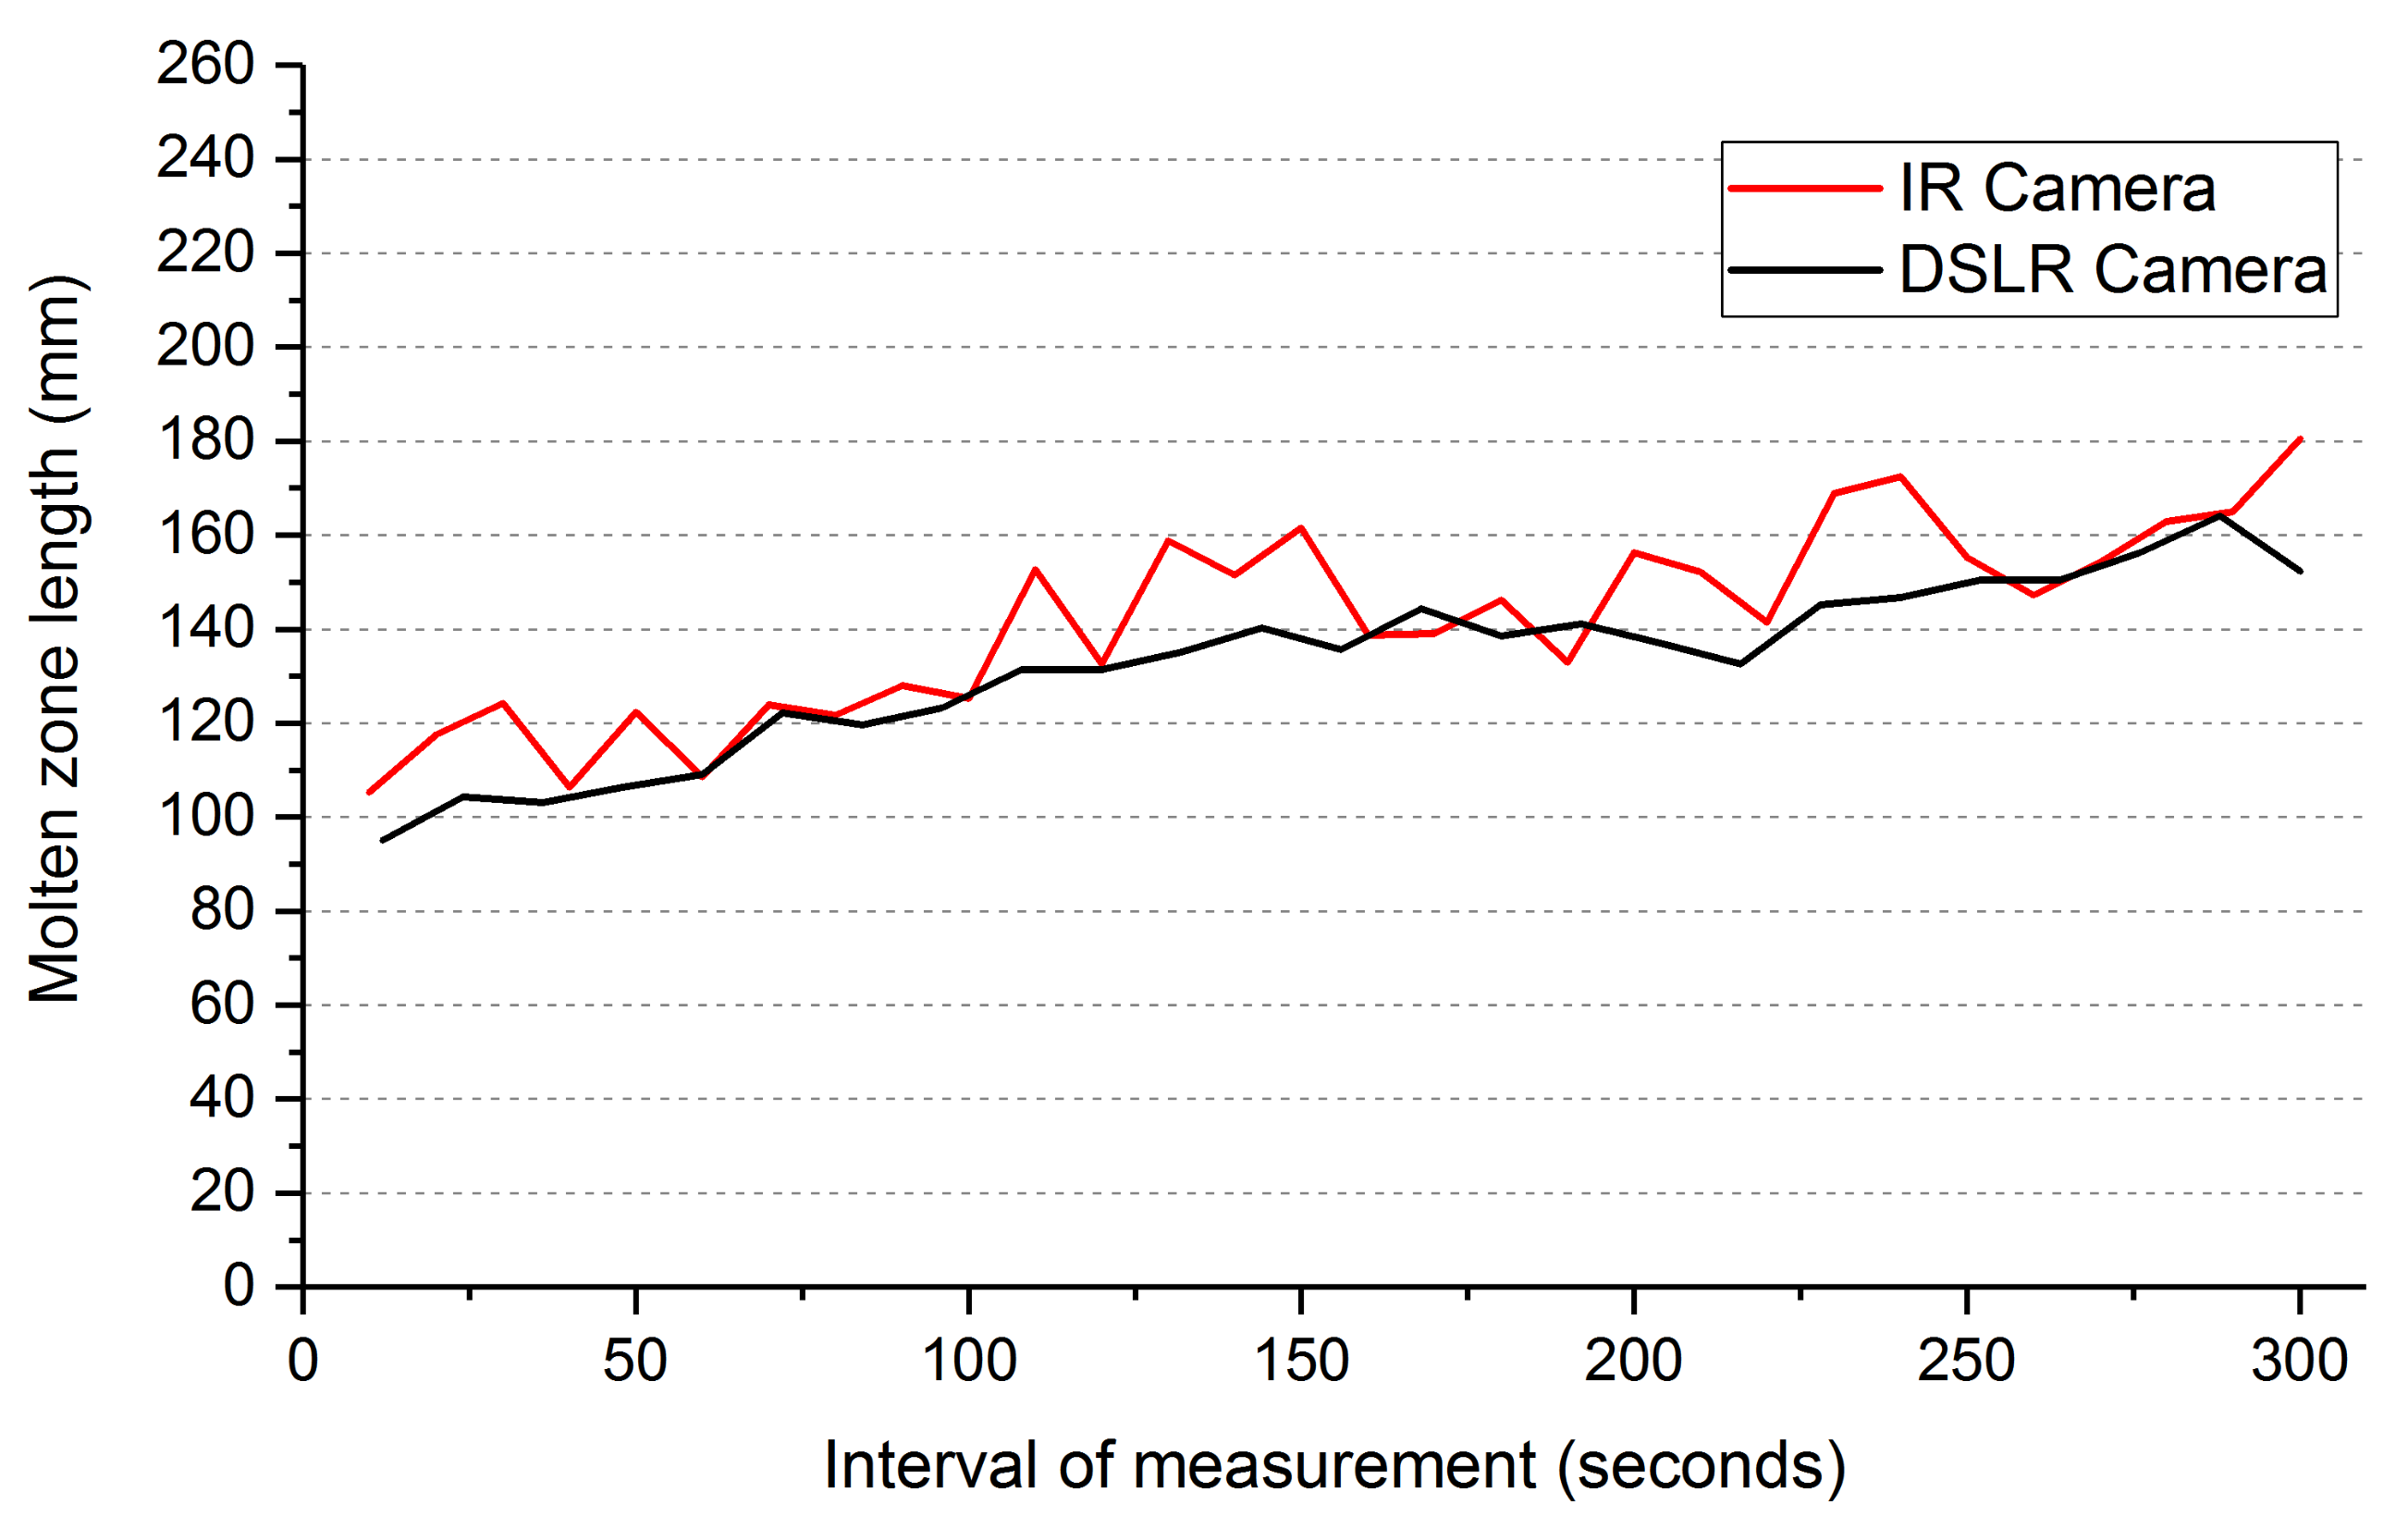
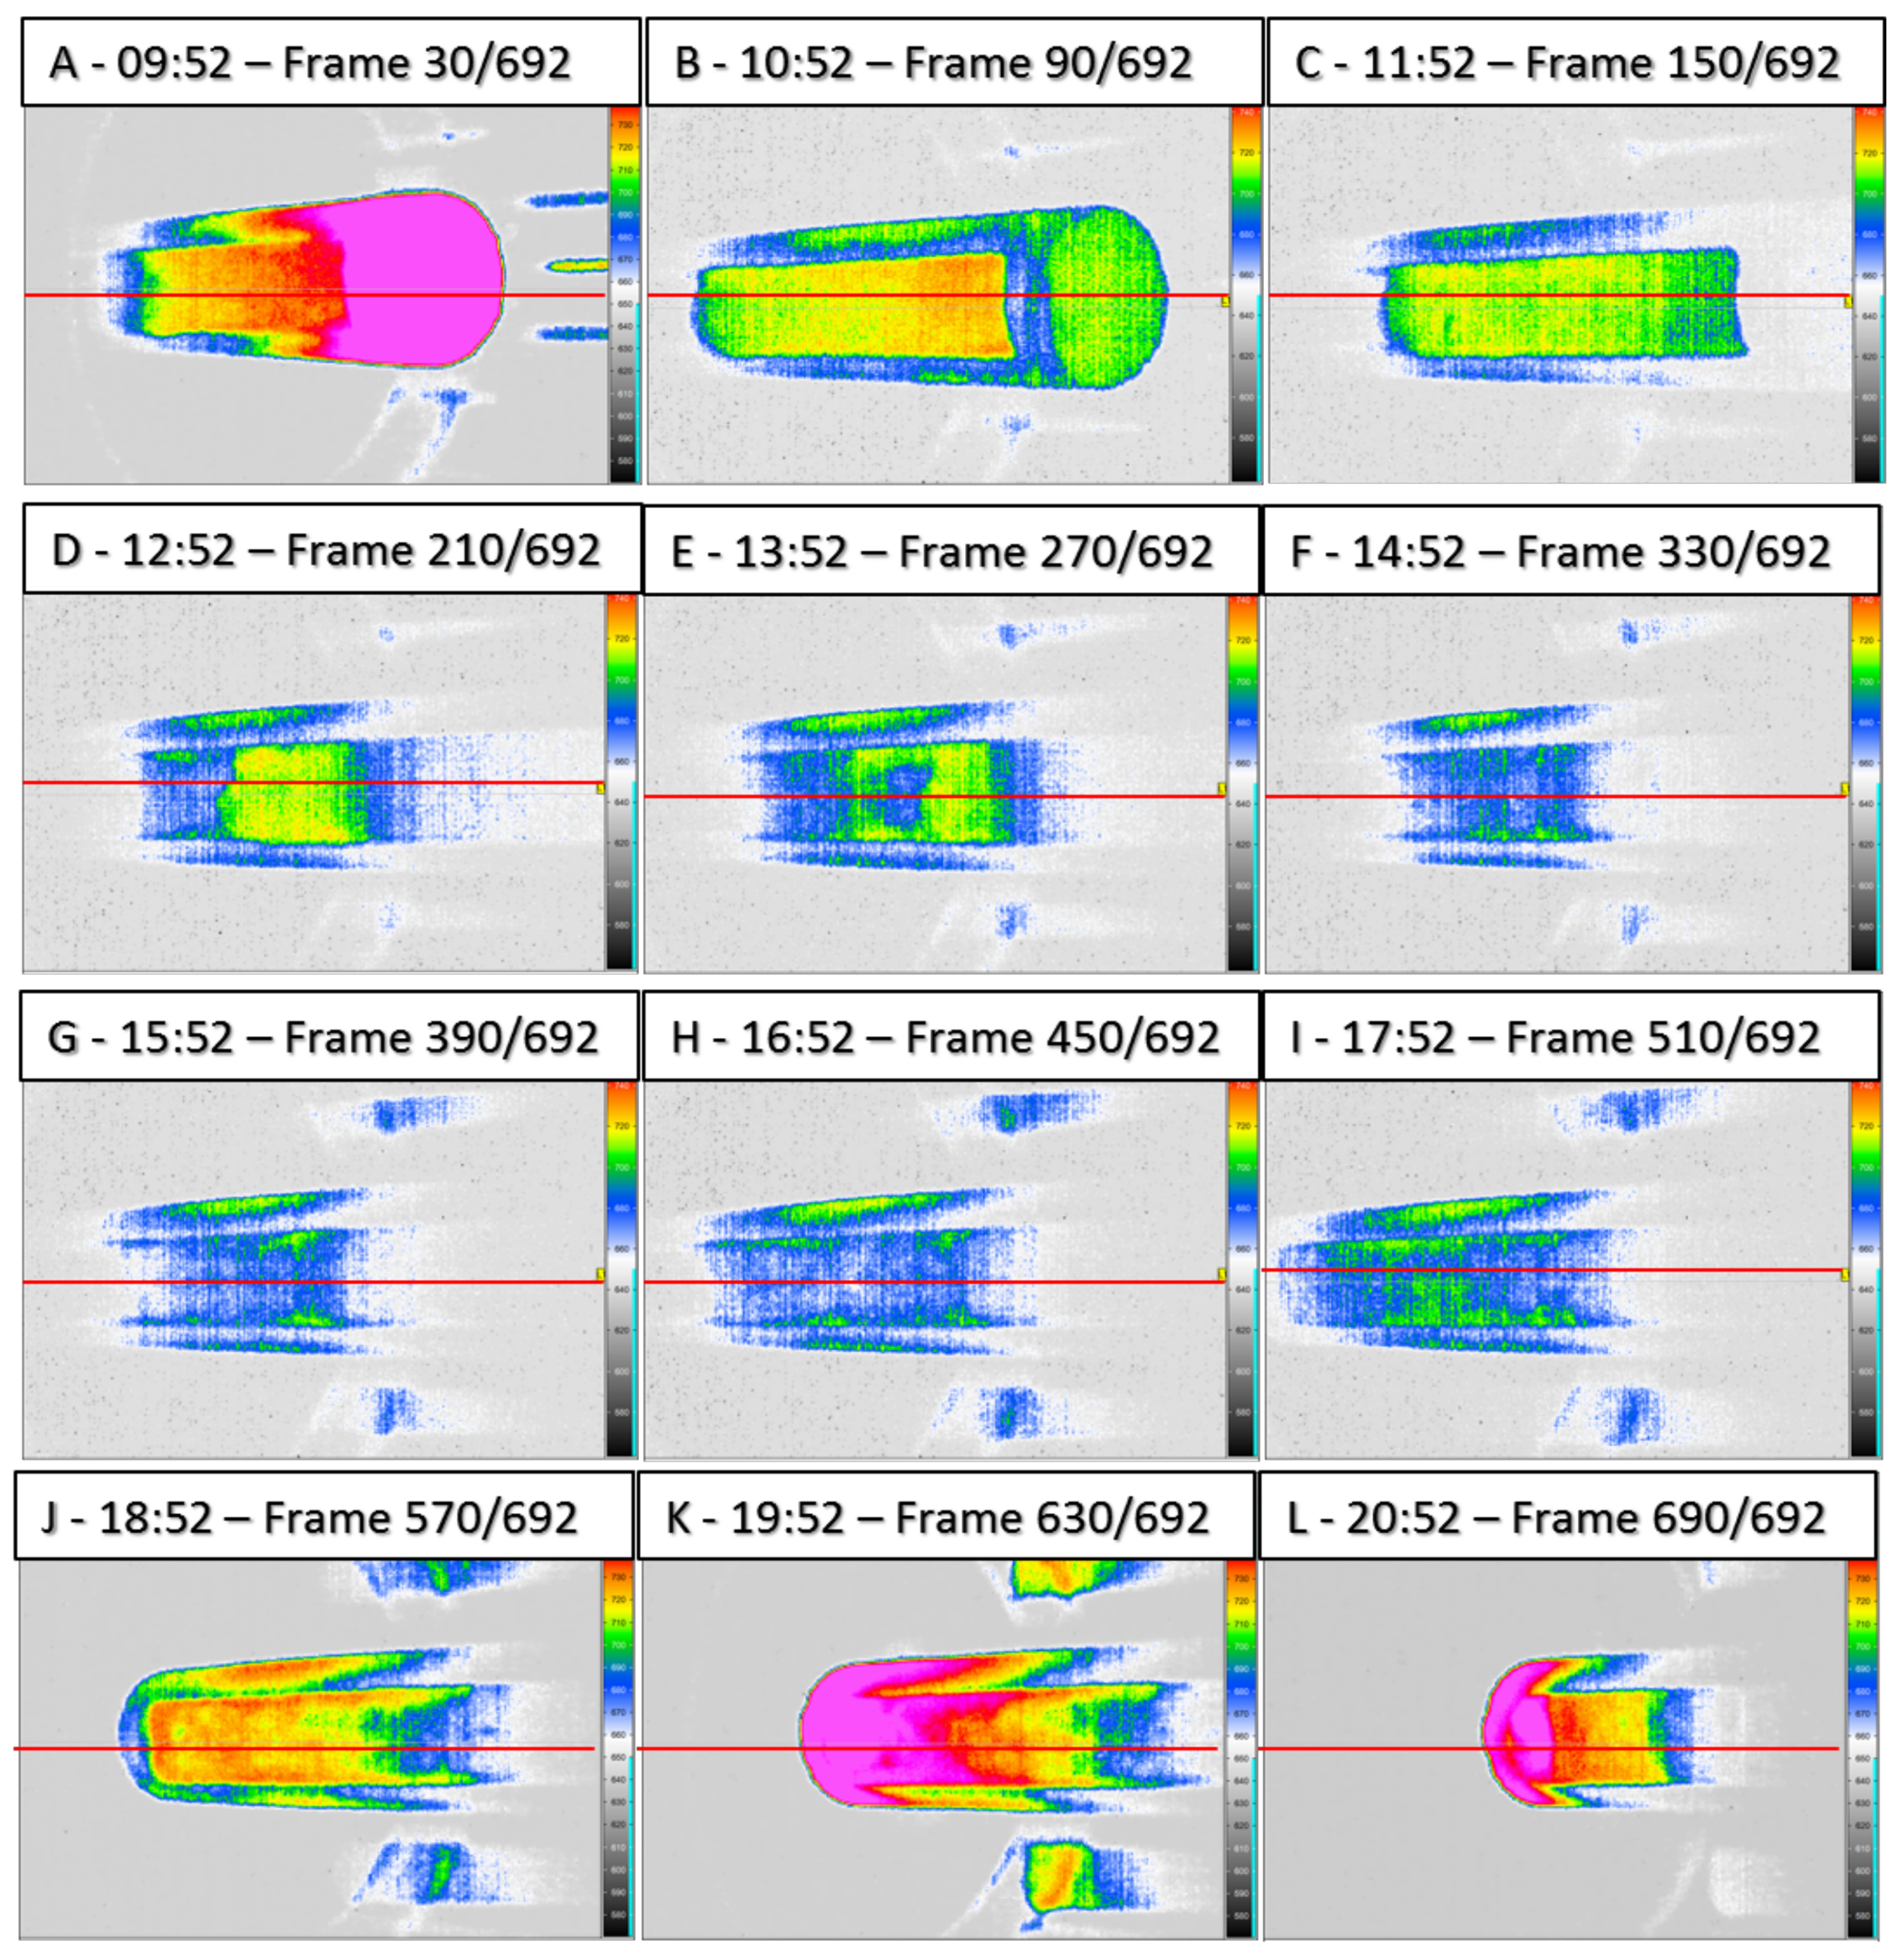
3.1. Correlation between an IR and a DSLR Camera to Determine the Zone Length

In order to confirm the accuracy of the zone length measurement via an IR camera, a parallel determination of the zone length was conducted using a conventional DSLR camera (Canon D600 with the lens EF-S 18–55 mm) as a reference. Both cameras were positioned with an inclination of 45° from the molten zone surface and a height of 500 mm and 400 mm, respectively, from the crucible region direct below the induction heating coil (see Figure 4). The special position of the cameras in terms of inclination and distance point of view leads to a perspective observation of the zone length. Therefore, the correct measurement of the molten zone length had to be adjusted based on the characteristics of the camera such as sensor dimensions, view angle, pixel resolution, etc. By using this information together with the obtained pixel distance from the beginning and end of the molten zone, it was possible to calculate the length of the molten zone in millimeters. For the DSLR measurement, both the start and the end of the molten zone were determined by analyzing the pictures (see Figure 5b); while for IR patterns (Figure 5a), these regions were determined automatically based on the melt temperature of the recorded area (see Section 3.2 for a detailed explanation).
During the trial, several DSLR pictures were taken, and at the same time, the IR camera recorded the whole process. This trial was conducted for a duration of 5 min while the coil remained static at the middle of the crucible and the induction heating was kept at 11 kW. During this period, a molten zone of around 130 mm was kept in the middle region of the bar. Since the coil remained static and gave power continually, a slight increase to around 180 mm in the length of the molten zone during the 5-min period was observed.
Equation (1), as well as Figure 6 show the mathematical background behind the calculation in MATLAB in order to obtain the length of the molten zone for both the DSLR and IR cameras (for example, through taking one frame per 10 s).
Zone Length = L 2 ( F B ) L 1 ( F A ) = f ( n 2 ) f ( n 1 )
where n 1 is the pixel number of the beginning of the molten zone; and n 2 is the pixel number of the end of the molten zone. The calculation of the function f ( n ) can be seen in Appendix A.
According to the aforementioned calculations, the zone lengths obtained by both cameras were plotted in comparison with each other (Figure 7). The results show a good correlation of both values and demonstrate the reliability of the measurement procedure for both camera systems. The maximum difference observed between measurements was around 20 mm (10% divergence) and can be ignored. As a conclusion, the IR camera is reliable enough to deliver as accurate results for the molten zone length as a real visual observation. That means the temperature values on the surface were detected correctly, as well.

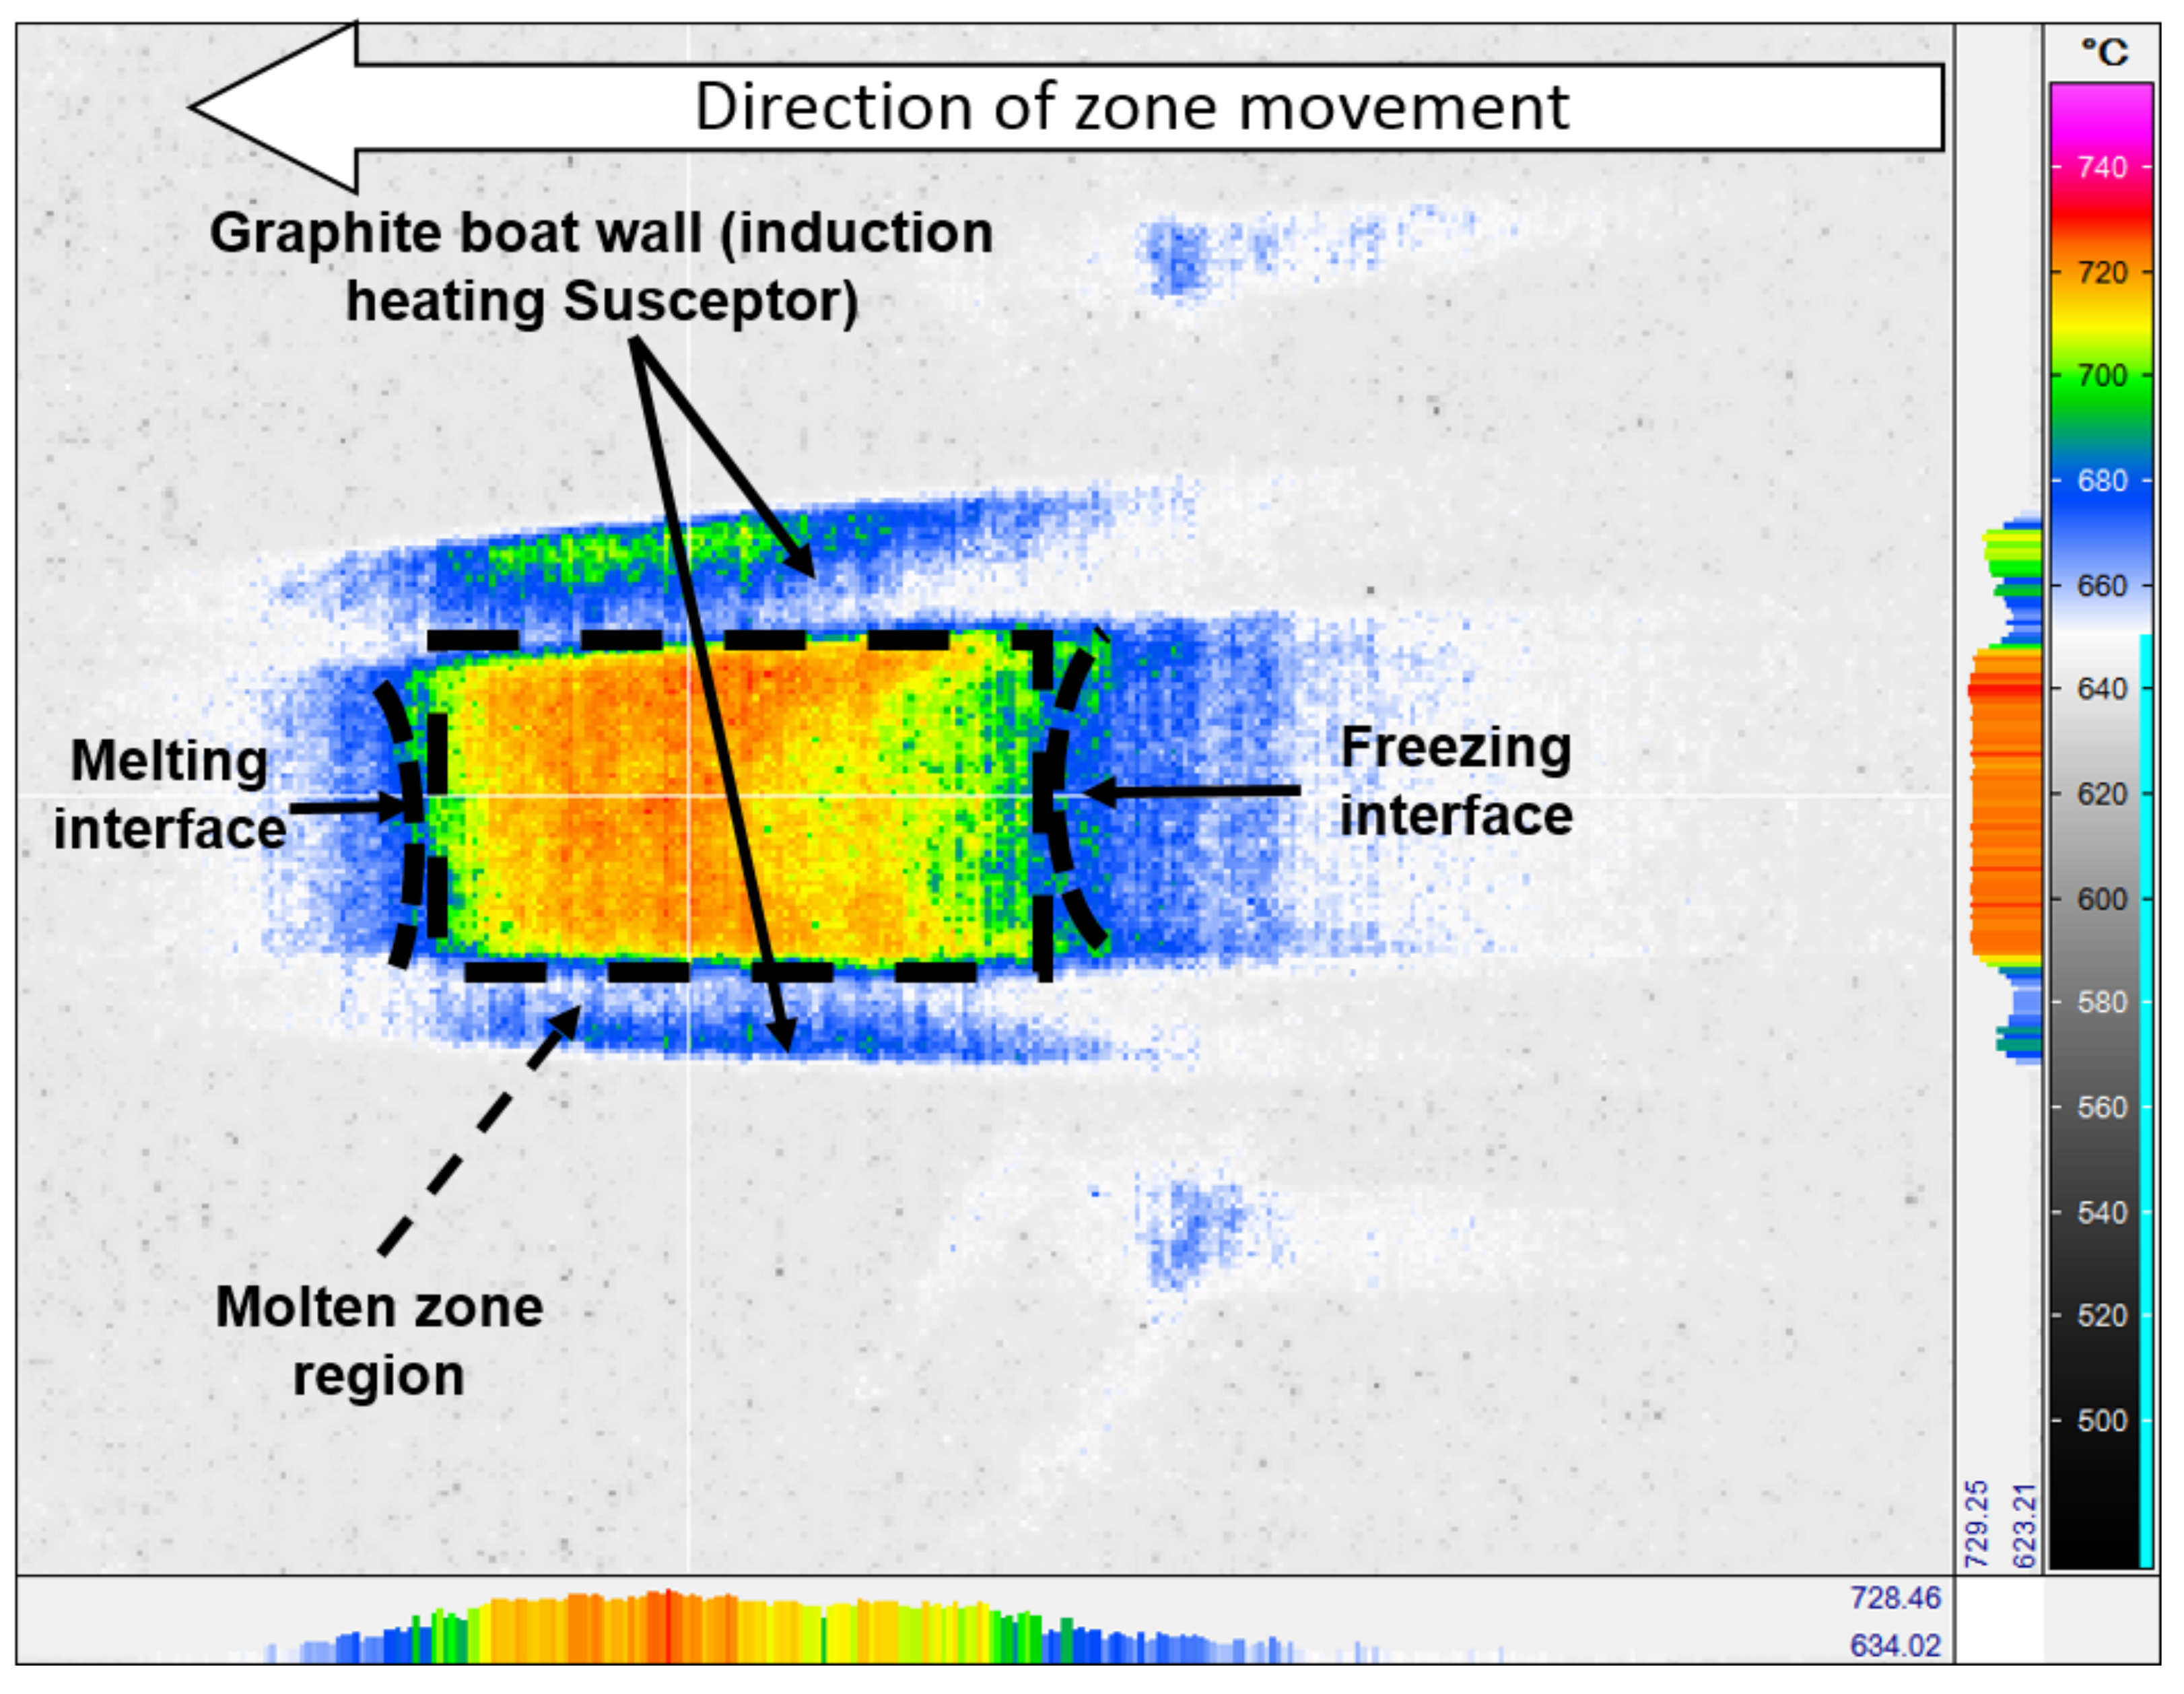
3.2. Infrared Image Analysis and Calculations

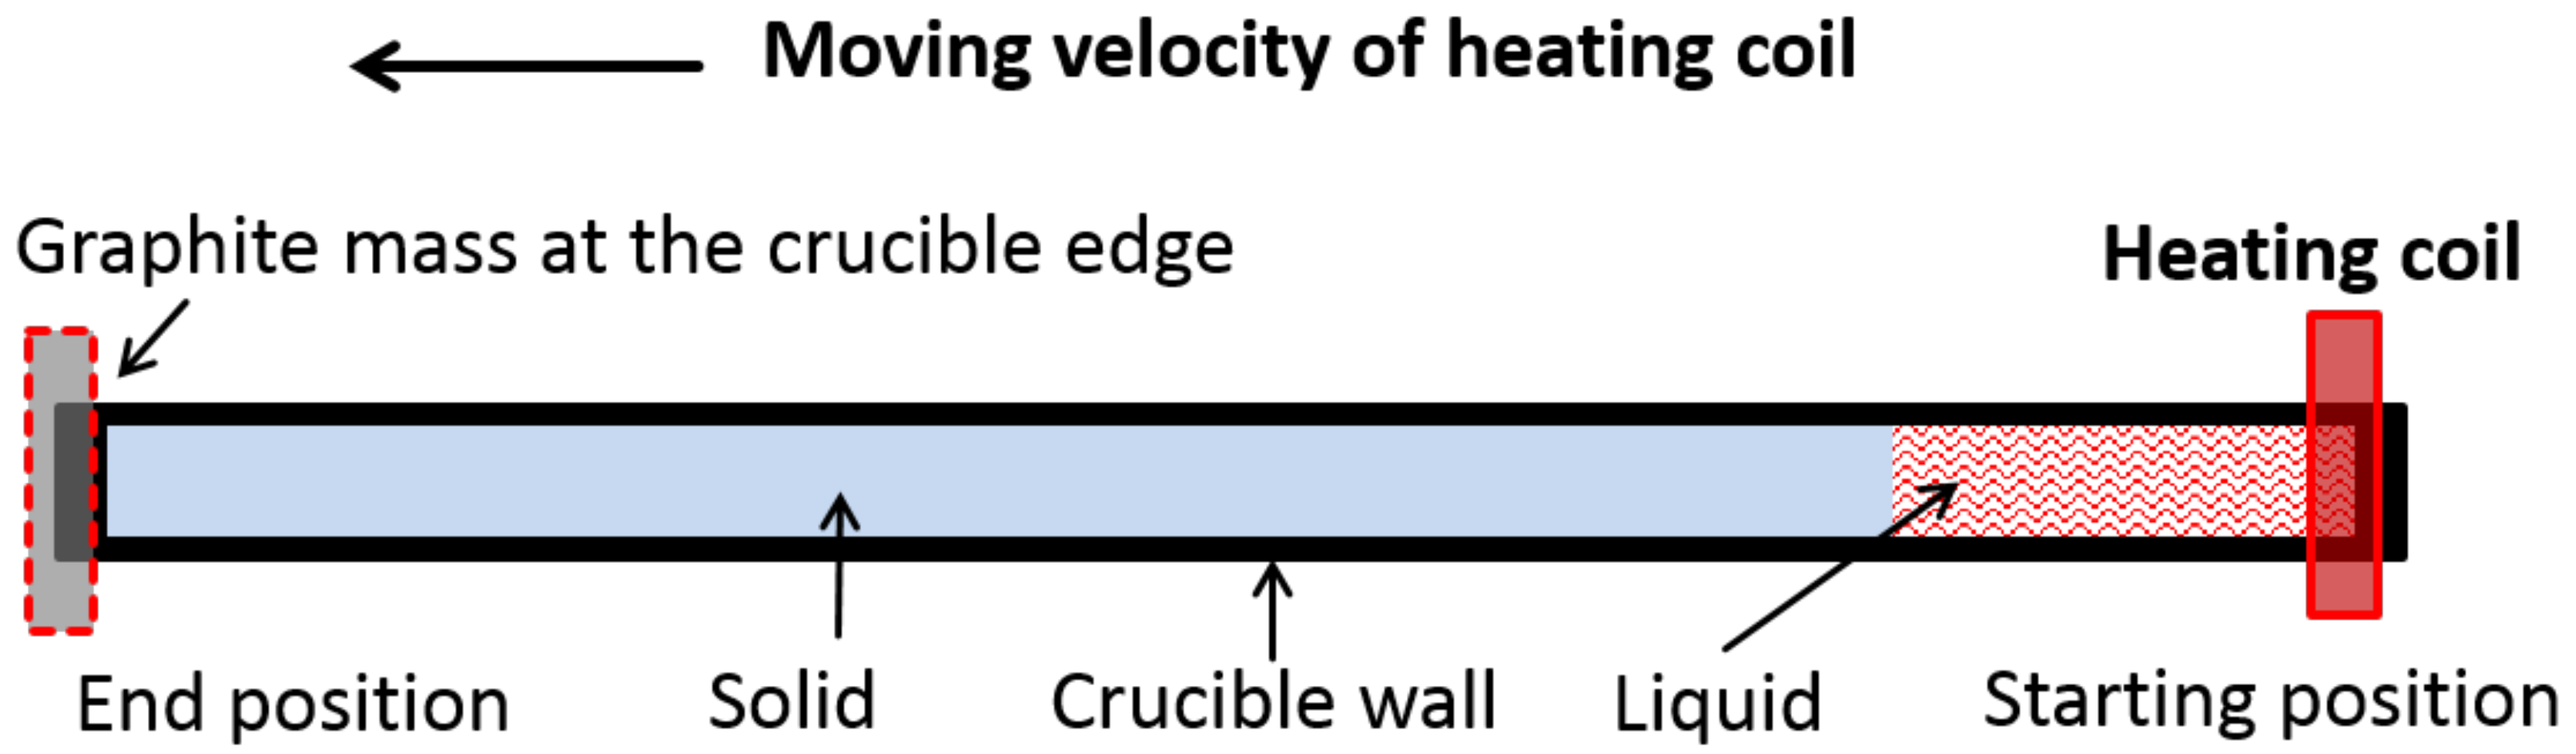
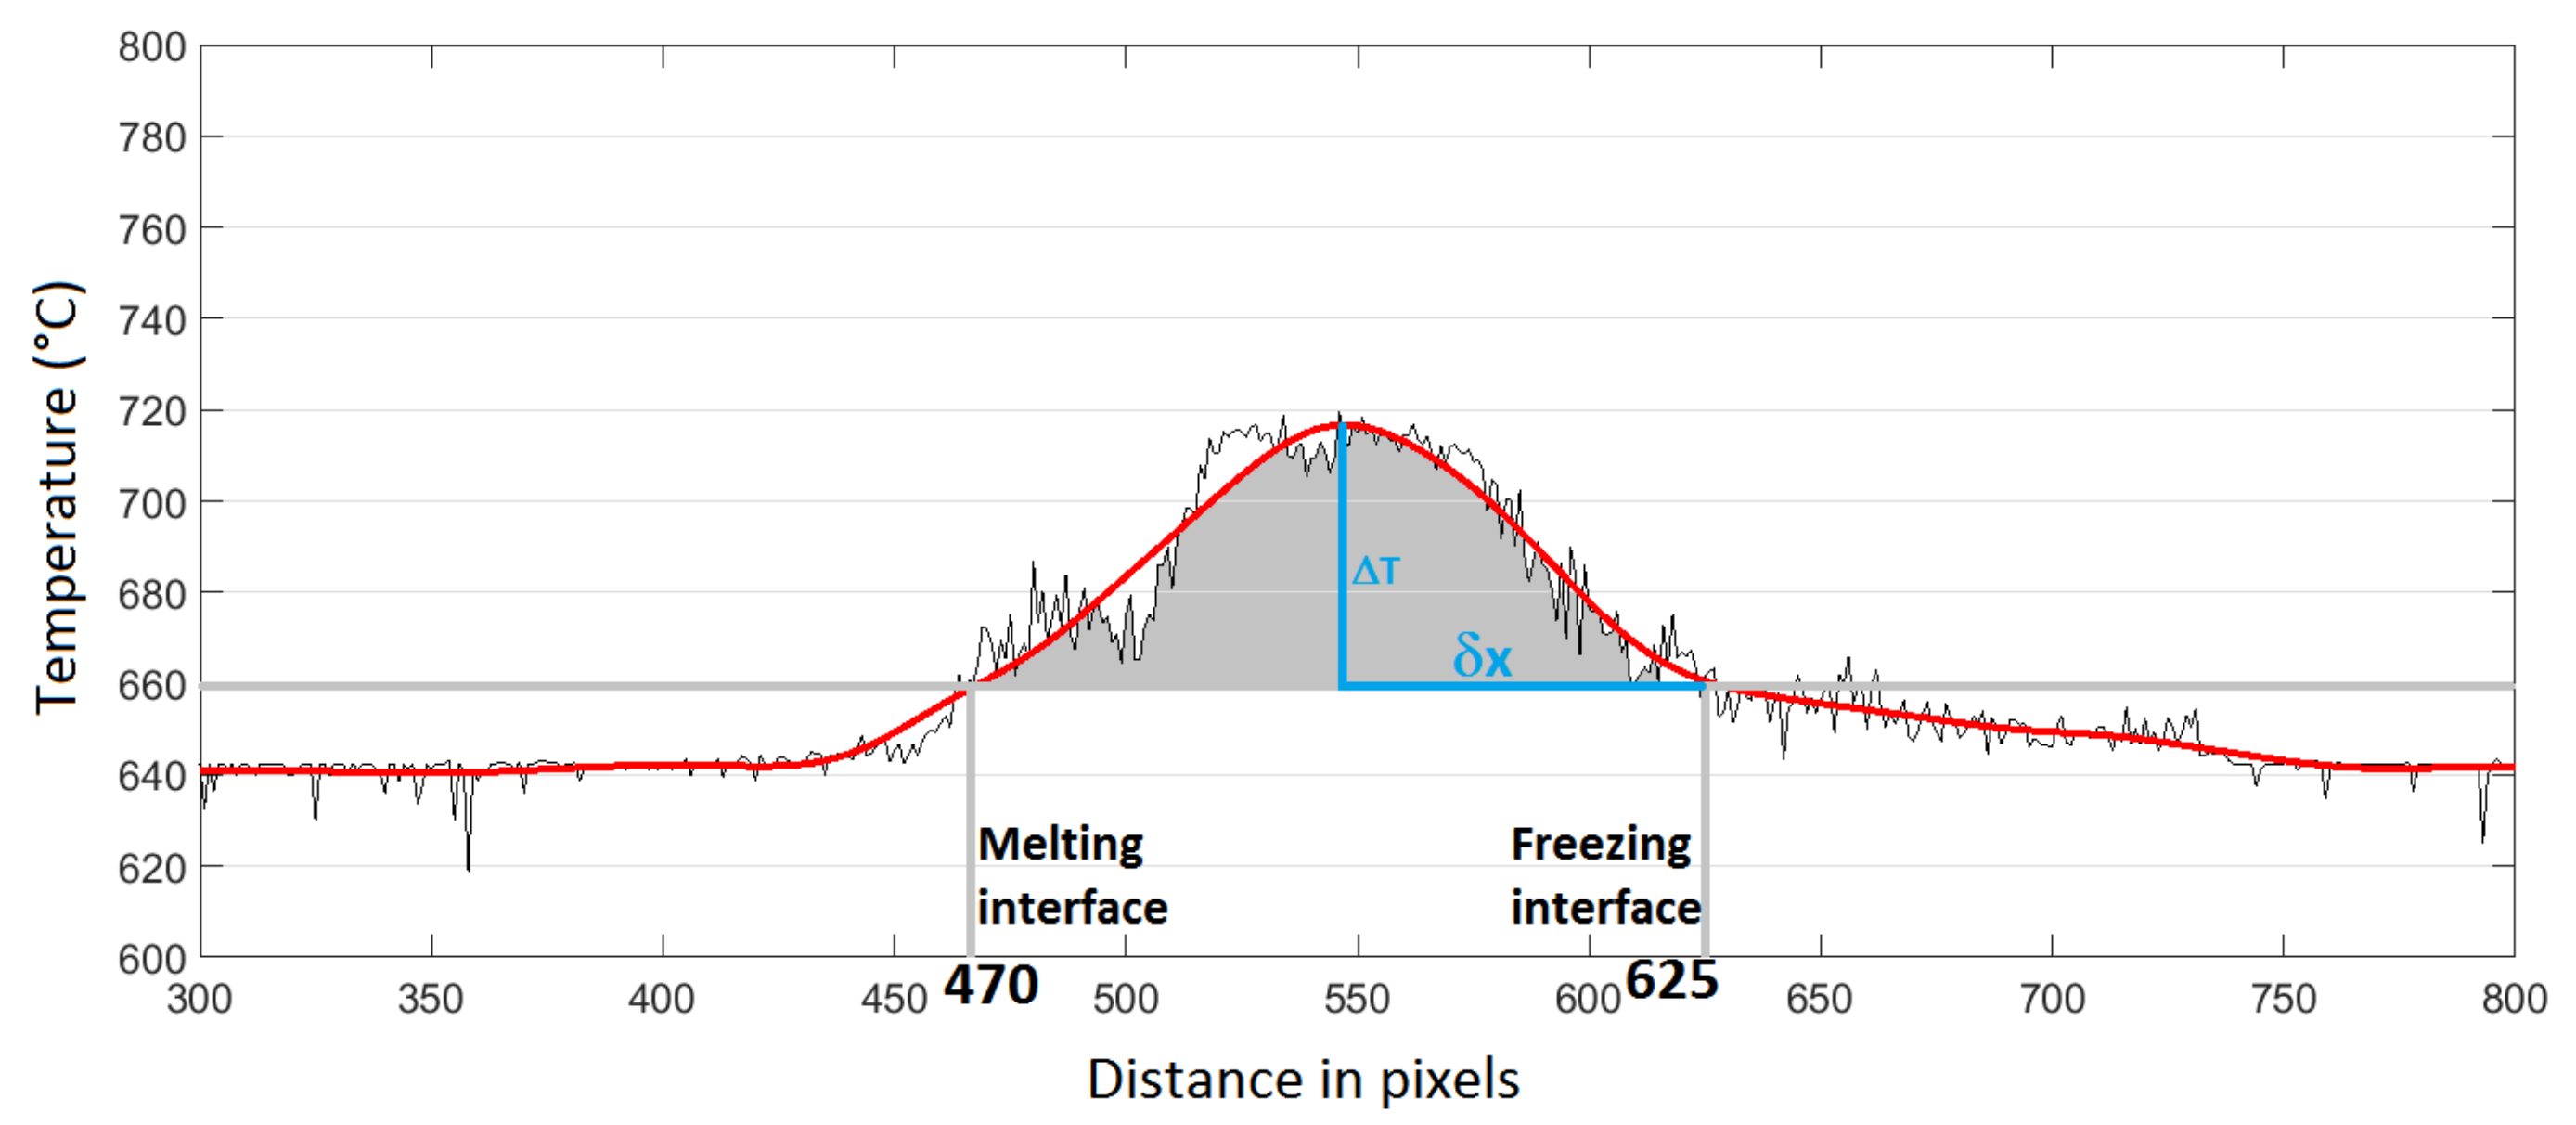
3.2.1. Calculation of Zone Length and Molten Zone Thermal Gradient

The obtained thermographic image by the infrared camera after applying the proper calibration (explained in Section 2.1) is a clear and quite precise view of the temperature distribution on the surface of the metallic bar. Figure 8 shows the molten zone region during the zone refining of the example metal, aluminum. By selecting the appropriate color schemes, the molten zone (showed within the dashed rectangle) was recognized. Therefore, a series of thermographic pictures was recorded throughout the entire zone refining process to obtain the temperature distribution in the region, the zone length across the bar, as well as the exact growth rate.
The raw data measured through this system were recorded and later analyzed. The camera was adjusted to record one frame per minute during the whole zone refining process. A faster picture recording for the whole length of the bar would lead to too many data and make the process more complicated. Nonetheless, the number of the total frames is so big that they had to be captured and processed again by a MATLAB script. In Figure 9, the recorded thermographic images illustrate the molten zone at an hourly interval for a length of a 600-mm aluminum bar subjected to induction heating power (from 10–11 kW and a 0.8-mm min−1 travel rate). This image sequence shows the changes in the molten zone, as well as the variation in the temperature profile alongside the bar. For every recorded frame, a temperature profile along the middle of the crucible (see the red line in Figure 9) is extracted from the thermographic image, and in each one of these frames, the information about the temperature distribution, as well as the molten zone length can be demonstrated, as shown in Figure 10. Here, based on the smoothed temperature profile, the intervals that are over the liquidus point of aluminum (660 °C) are determined as the length of the molten zone. These measured values correspond to the pixel interval from the IR image, which were later converted to millimeters in MATLAB.
Additionally, the values of the temperature gradient ( Δ T / δ x ) between the freezing interface and the highest temperature value in the molten zone were calculated for every frame. The Δ T value was calculated by subtracting the highest temperature within the zone length from the temperature at the freezing interface. The δ x was the distance between the position where the highest temperature was and the freezing interface. Figure 11 illustrates how the temperature gradient varies along a bar of 600 mm in length, based on the example of Figure 9. It can be seen that the gradient is slightly decreasing while moving towards the middle of the bar, as it is departing from the massive graphite crucible sides, or stays quite low and constant in the middle part of the bar. Accepting the fact that a lower temperature gradient means a lower growth rate and as a consequence a higher removal efficiency, the application of an IR system can deliver the most profitable information to control the refining efficiency through such diagrams.
However, whether this temperature gradient alone is the effective parameter to control a zone refining process or it is a mixture of many influencing factors such as changing the zone length, the absolute values of the growth rate, etc., are still not clear exactly. By all means, the IR camera system can be useful to investigate these terms, as well, as explained in the following subsections.
The temperature measured by the IR camera refers to the surface temperature according to the calibration performed (see Table 1). This means that the melt temperature close to the crucible bottom could differ slightly from the temperature measured at the surface. Since the zone refining process is very sensitive to temperature fluctuations generated for example by current or voltage fluctuation in the induction system, these aspects have to be taken into consideration while looking at the effective temperature values measured. However, when considering the high thermal conductivity of aluminum, the small thickness (15–20 mm) of the sample and the great degree of convection promoted by the induction heating system, the vertical gradient temperature is assumed to be very small and has no significant degree of influence on the results presented in this work. This assumption can be reinforced through the observation of a longitudinal section macrograph of the middle of the bar, shown in Figure 12. This macrograph demonstrates a rather stable grain growth direction, aligned horizontally towards the moving direction. This fact indirectly indicates that the vertical temperature gradients are not strong enough to influence the growth behavior of the sample, being rather mostly influenced by the horizontal temperature gradients. This is partially due to the strong effect of convection generated by the induction heating applied to the system. If these temperature differences in the vertical section between the bottom and top of the molten region were too high, the expected result would be a grain orientation towards the bottom of the crucible. However, this was not observed within our experiments.
In addition, the obtained information on the variation of the molten zone length, the effective growth rate on the freezing interface and the horizontal temperature gradient of the molten zone along the whole bar length is far more important than the punctual values of temperature measured by the camera.

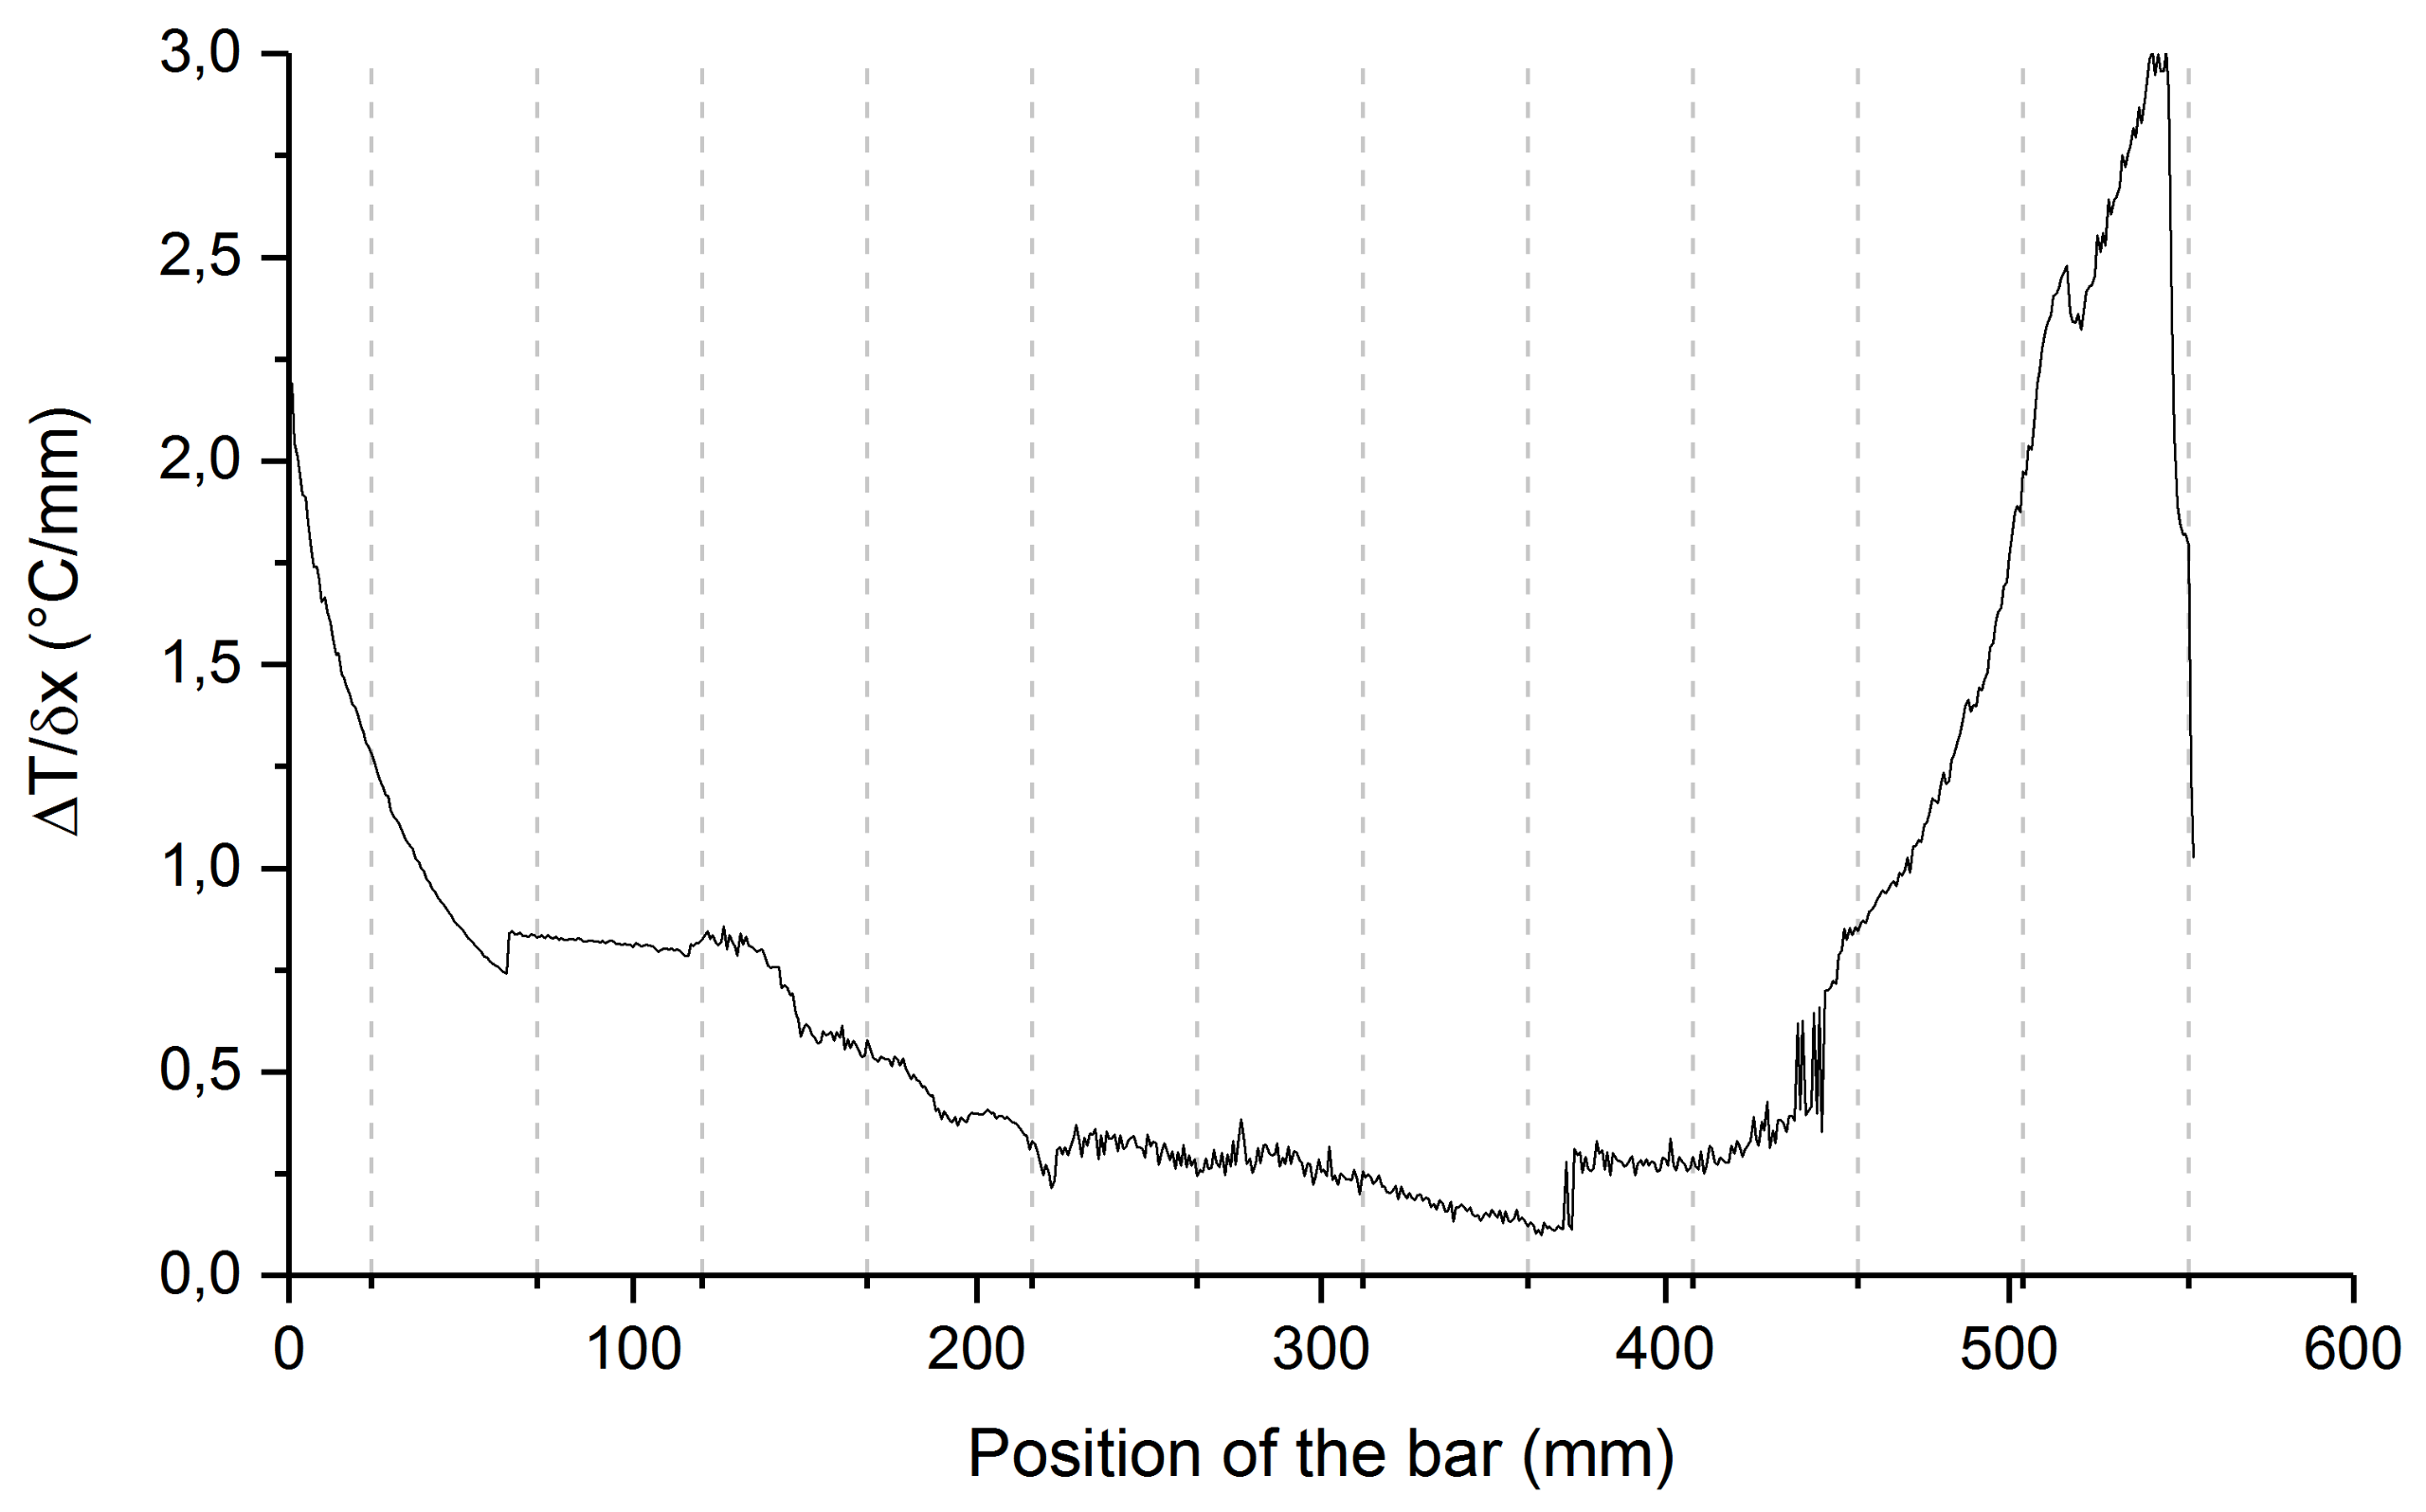
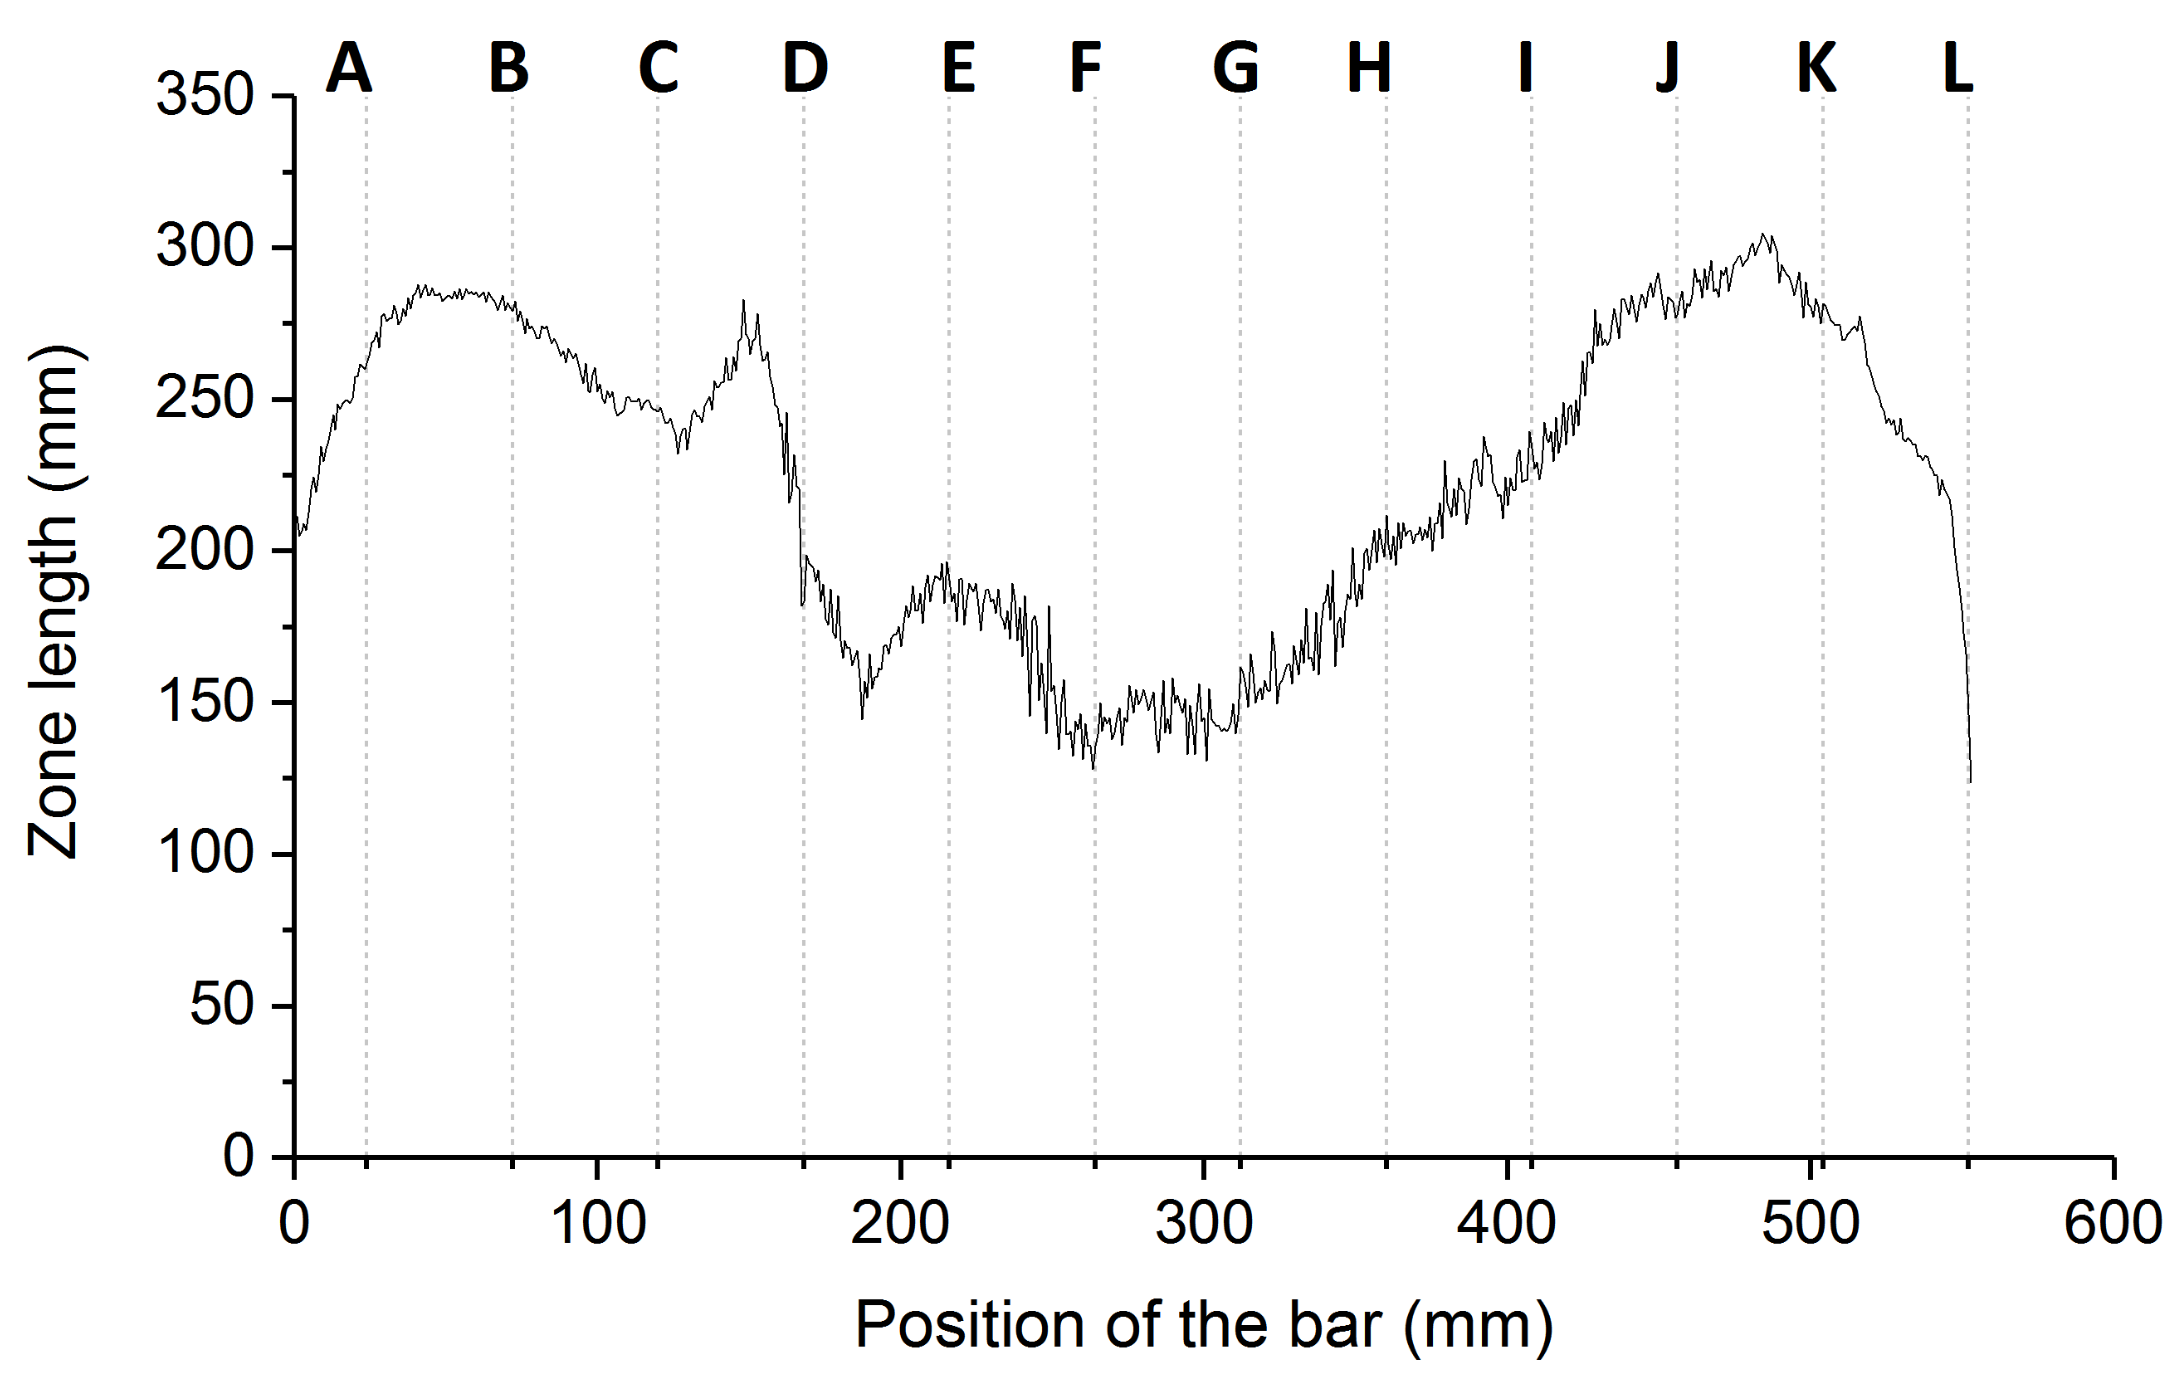
3.2.2. Calculation of the Zone Length Variation over the Bar Length

Once the values of pixels were converted to millimeter unity of distance, the variation of the molten zone length can be plotted according to its position along the bar. That is another form of the analysis the data collected by an IR camera, as seen in Figure 13. This graph describes the zone length changes along the bar for the measuring example of Figure 9, where each letter (A–L) corresponds to the respective picture frames. It can be observed that as the zone moves towards the middle of the crucible, the length of the molten zone decreases considerably, followed by an increase when it approaches the end of the crucible. This happens probably because the middle of the bar is where the heat loss reaches its maximum value, being dissipated equally to both directions of the bar; while at both extremes of the bar, the heat can only flow to one side of the bar. Additionally, the edges of the graphite crucible also act as a susceptor for the induction heating, collaborating to result in an increase in the heat transferred to the bar. Such variation of zone length degrades the refining efficiency; therefore, it is preferred to keep a big, but constant zone length during initial zone passes, as well as a smaller and constant one during the following. Another possibility would be to keep a smaller zone length in the both ends, but bigger ones in the middle of the bar in one single pass. Via the digital detection of the zone length in this work by applying an infrared camera, a promising solution to automatically adjust the zone length can be conducted in the zone refining process. It can work in such a way that, e.g., the infrared camera detects the zone length online, then inputs the signal to a program model (such as applying fuzzy logic control). Finally, the program model gives an output signal to the zone refining equipment to fulfill the control of the zone length by regulating the power, heater movement velocity or cooling water flux, etc. That would be a great modification of the way of increasing the efficiency, as well as productivity of the zone refining technique.

3.3. Calculation of the Growth Rate Variation

It is not correct to consider the growth rate of the freezing interface equal to the movement velocity of the coil. Parallel to the changes in the size of the molten zone, the movement velocity of the freezing interface (known as the solid growth rate) changes as well. The changes in the freezing interface position during time were obtained via IR thermography analysis, and its variation was added to the movement velocity, making it possible to obtain a more realistic value of the growth rate during the whole refining process. Figure 14 illustrates the growth rate in relation to the position of the freezing interface along the bar. For certain periods along the bar, the growth rate seems to become negative, pointing out that a back-melting effect occurs due to excess heat input or insufficient heat losses. This phenomenon is more obvious at both edges of the crucible where the heat transfer is more influenced by the heated graphite edges.

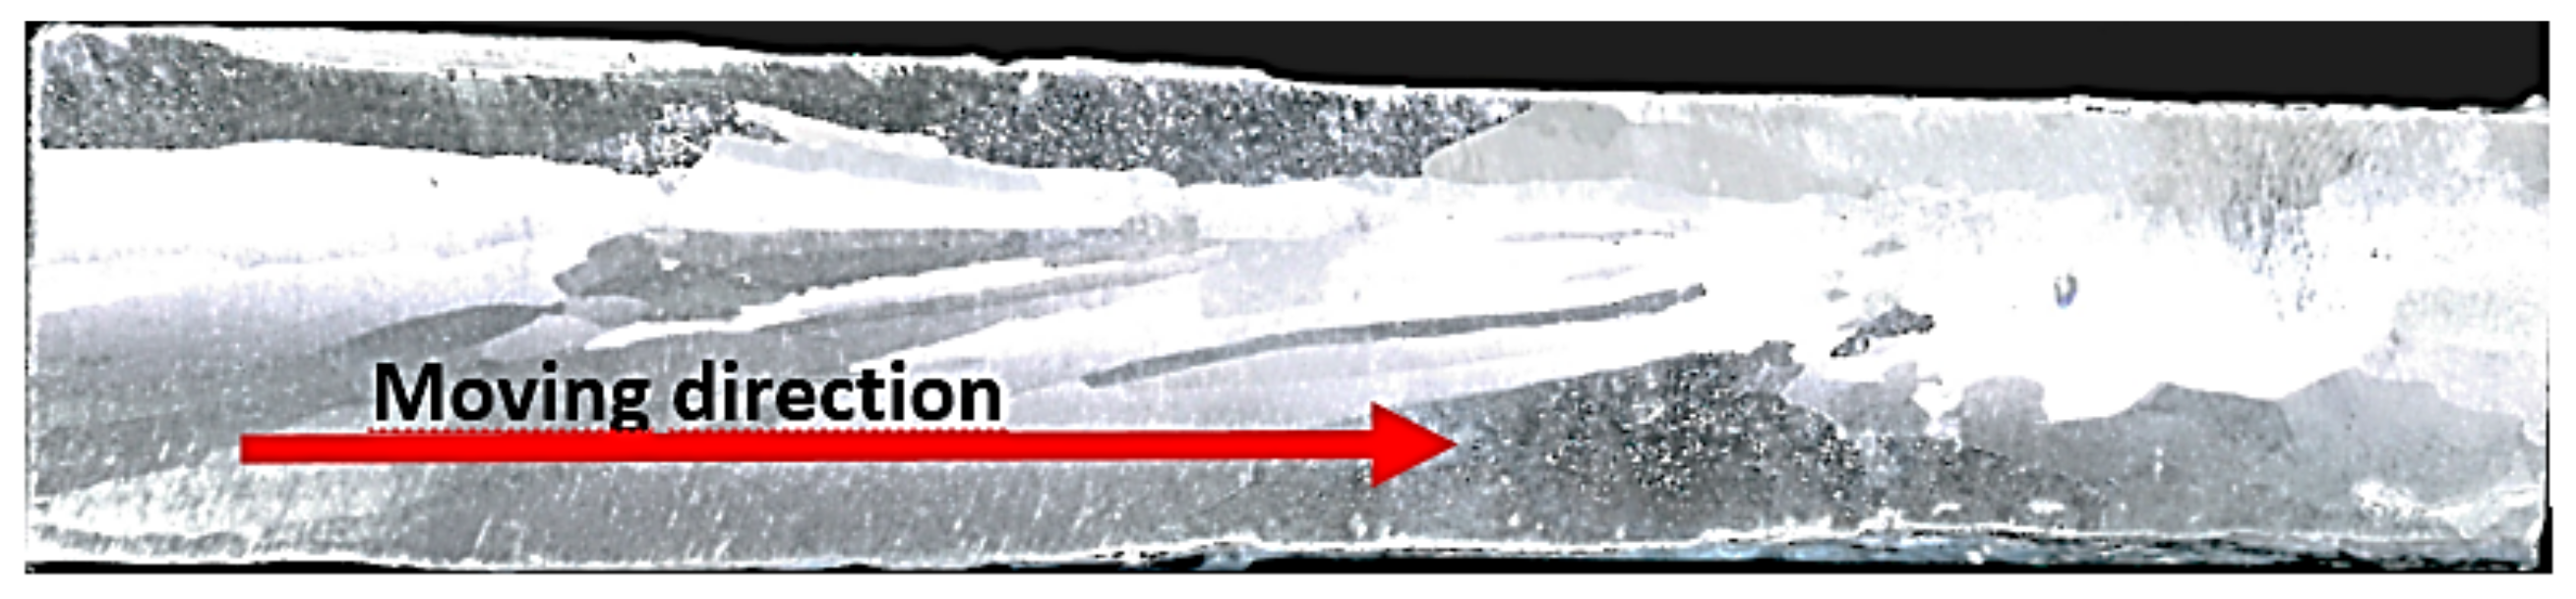
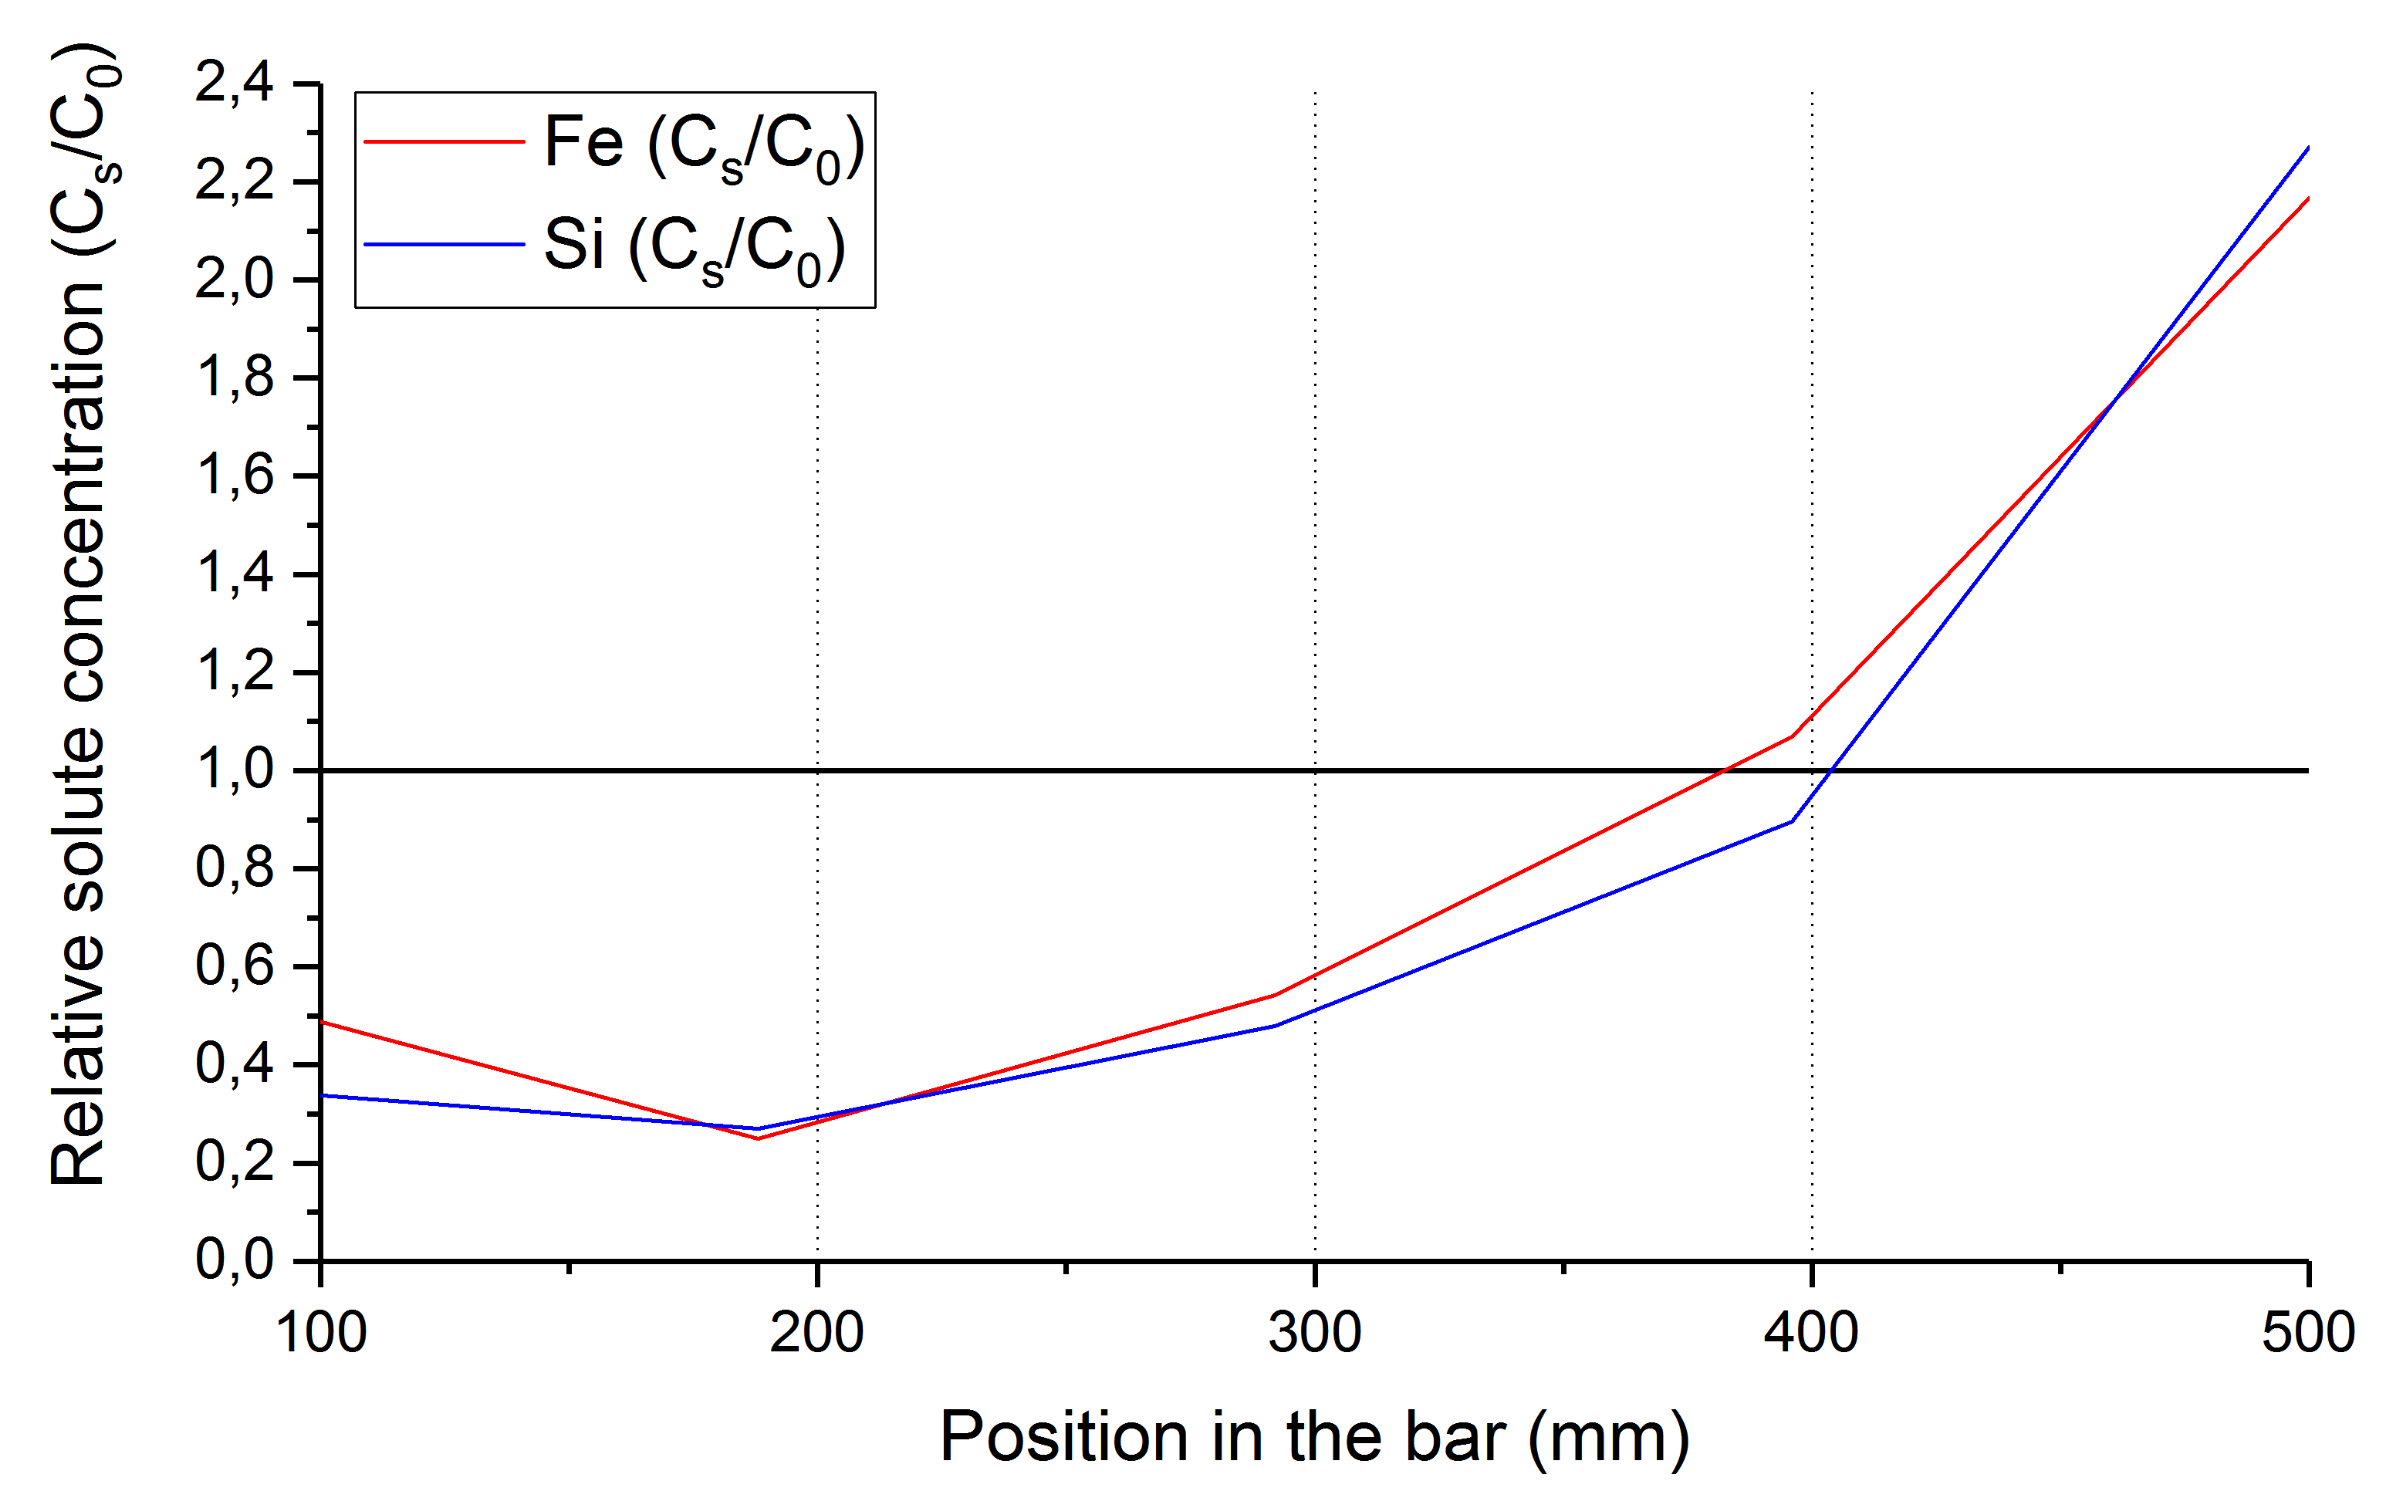
3.4. Impurity Concentration Profile

After the trial, a total of five samples was taken from every 100 mm along the aluminum bar and analyzed via an OESspark spectrometer. The relation between the concentration of the impurities Fe and Si in the solid phase of the analyzed samples and its initial composition was defined as C S / C 0 and represented in Figure 15. In the case of no or very low impurity removal, this ratio would be equal or very close to unity. The smaller this ratio than unity, the more removal via zone refining can be interpreted.
As seen above, the increased Fe and Si content at the length of 100 mm coincides with the region where higher growth rate values are observed in the Figure 14. The reason is that when the coil moved to this region, the heat transferred from the induction heater to the ends of crucible will be embedded. This leads to a sudden increase in the moving rate of the growth front and does not allow enough time for the solute to fully segregate into the molten zone ahead. In this period, the molten zone length also begins to decrease to its lower plateau of around 150 mm.

4. Conclusions

When properly calibrated, infrared thermographic analysis has been proven to be a viable method for the detailed evaluation of the zone refining process. The length of the molten zone measured by the IR camera matches well with the ones manually measured by the operator via a DSLR camera. Additionally, several other pieces of useful information including, but not limited to, the thermal gradient in the molten zone, zone length variation, as well as the real growth rate can be obtained with good precision, as well. The values of zone length and growth rate acquired by the IR analysis corresponds well with the obtained solute concentration profile results. The variation in the relative concentration profile is mostly due to the growth rate variation along the performed trial. Unlike stated by many authors, the growth rate is not only determined by the coil movement velocity, but also greatly influenced by the position of the freezing interface, as well as by the variation in the zone length, as shown by the IR camera results. This is much more aggravated when the zone refining process is done in highly thermo-conductive materials such as aluminum via induction heating using a graphite boat as the heat susceptor.
The preliminary results shown in this paper demonstrate that by applying an IR camera to measure and maybe in the next step to adjust the molten zone length along a bar, an optimized system to produce ultra-purity metals via the zone refining technique could be achieved. That contributes also to performing detailed practical investigations to understand the phenomena of crystallization while using the zone melting methodology, which is currently undertaken mainly as simulation. Future work will be done to measure the zone length, growth rate and thermal gradient in relationship to the process parameters (heating power and coil movement velocity) during zone refining. The obtained results will be later used as feed input for a simple neural network to fully automatize the zone refining equipment. The goal is that, based on the infrared thermography, the zone length, growth rate and thermal gradient could be controlled along the whole bar. The result will be the optimization of the process and possibly result in a lower number of passes and a higher purification yield.

Author Contributions

B.F. was the principal investigator. S.F., D.C.C. and X.Z. conceived of and designed the experiments. M.J.R.R. performed the experiments. S.F., D.C.C., X.Z. and M.J.R.R. analyzed the data. D.C.C., X.Z. and S.F. wrote and edited the manuscript.

Acknowledgments

The authors thank the CNPQ-Brazilian National Council for Scientific and Technological Development and China Scholarship Council (CSC) for the financial support of D. Curtolo and X. Zhang, respectively. Furthermore, many thanks are given to Martin Braun for the professional Photo in Figure 1.

Conflicts of Interest

The authors declare no conflict of interest.

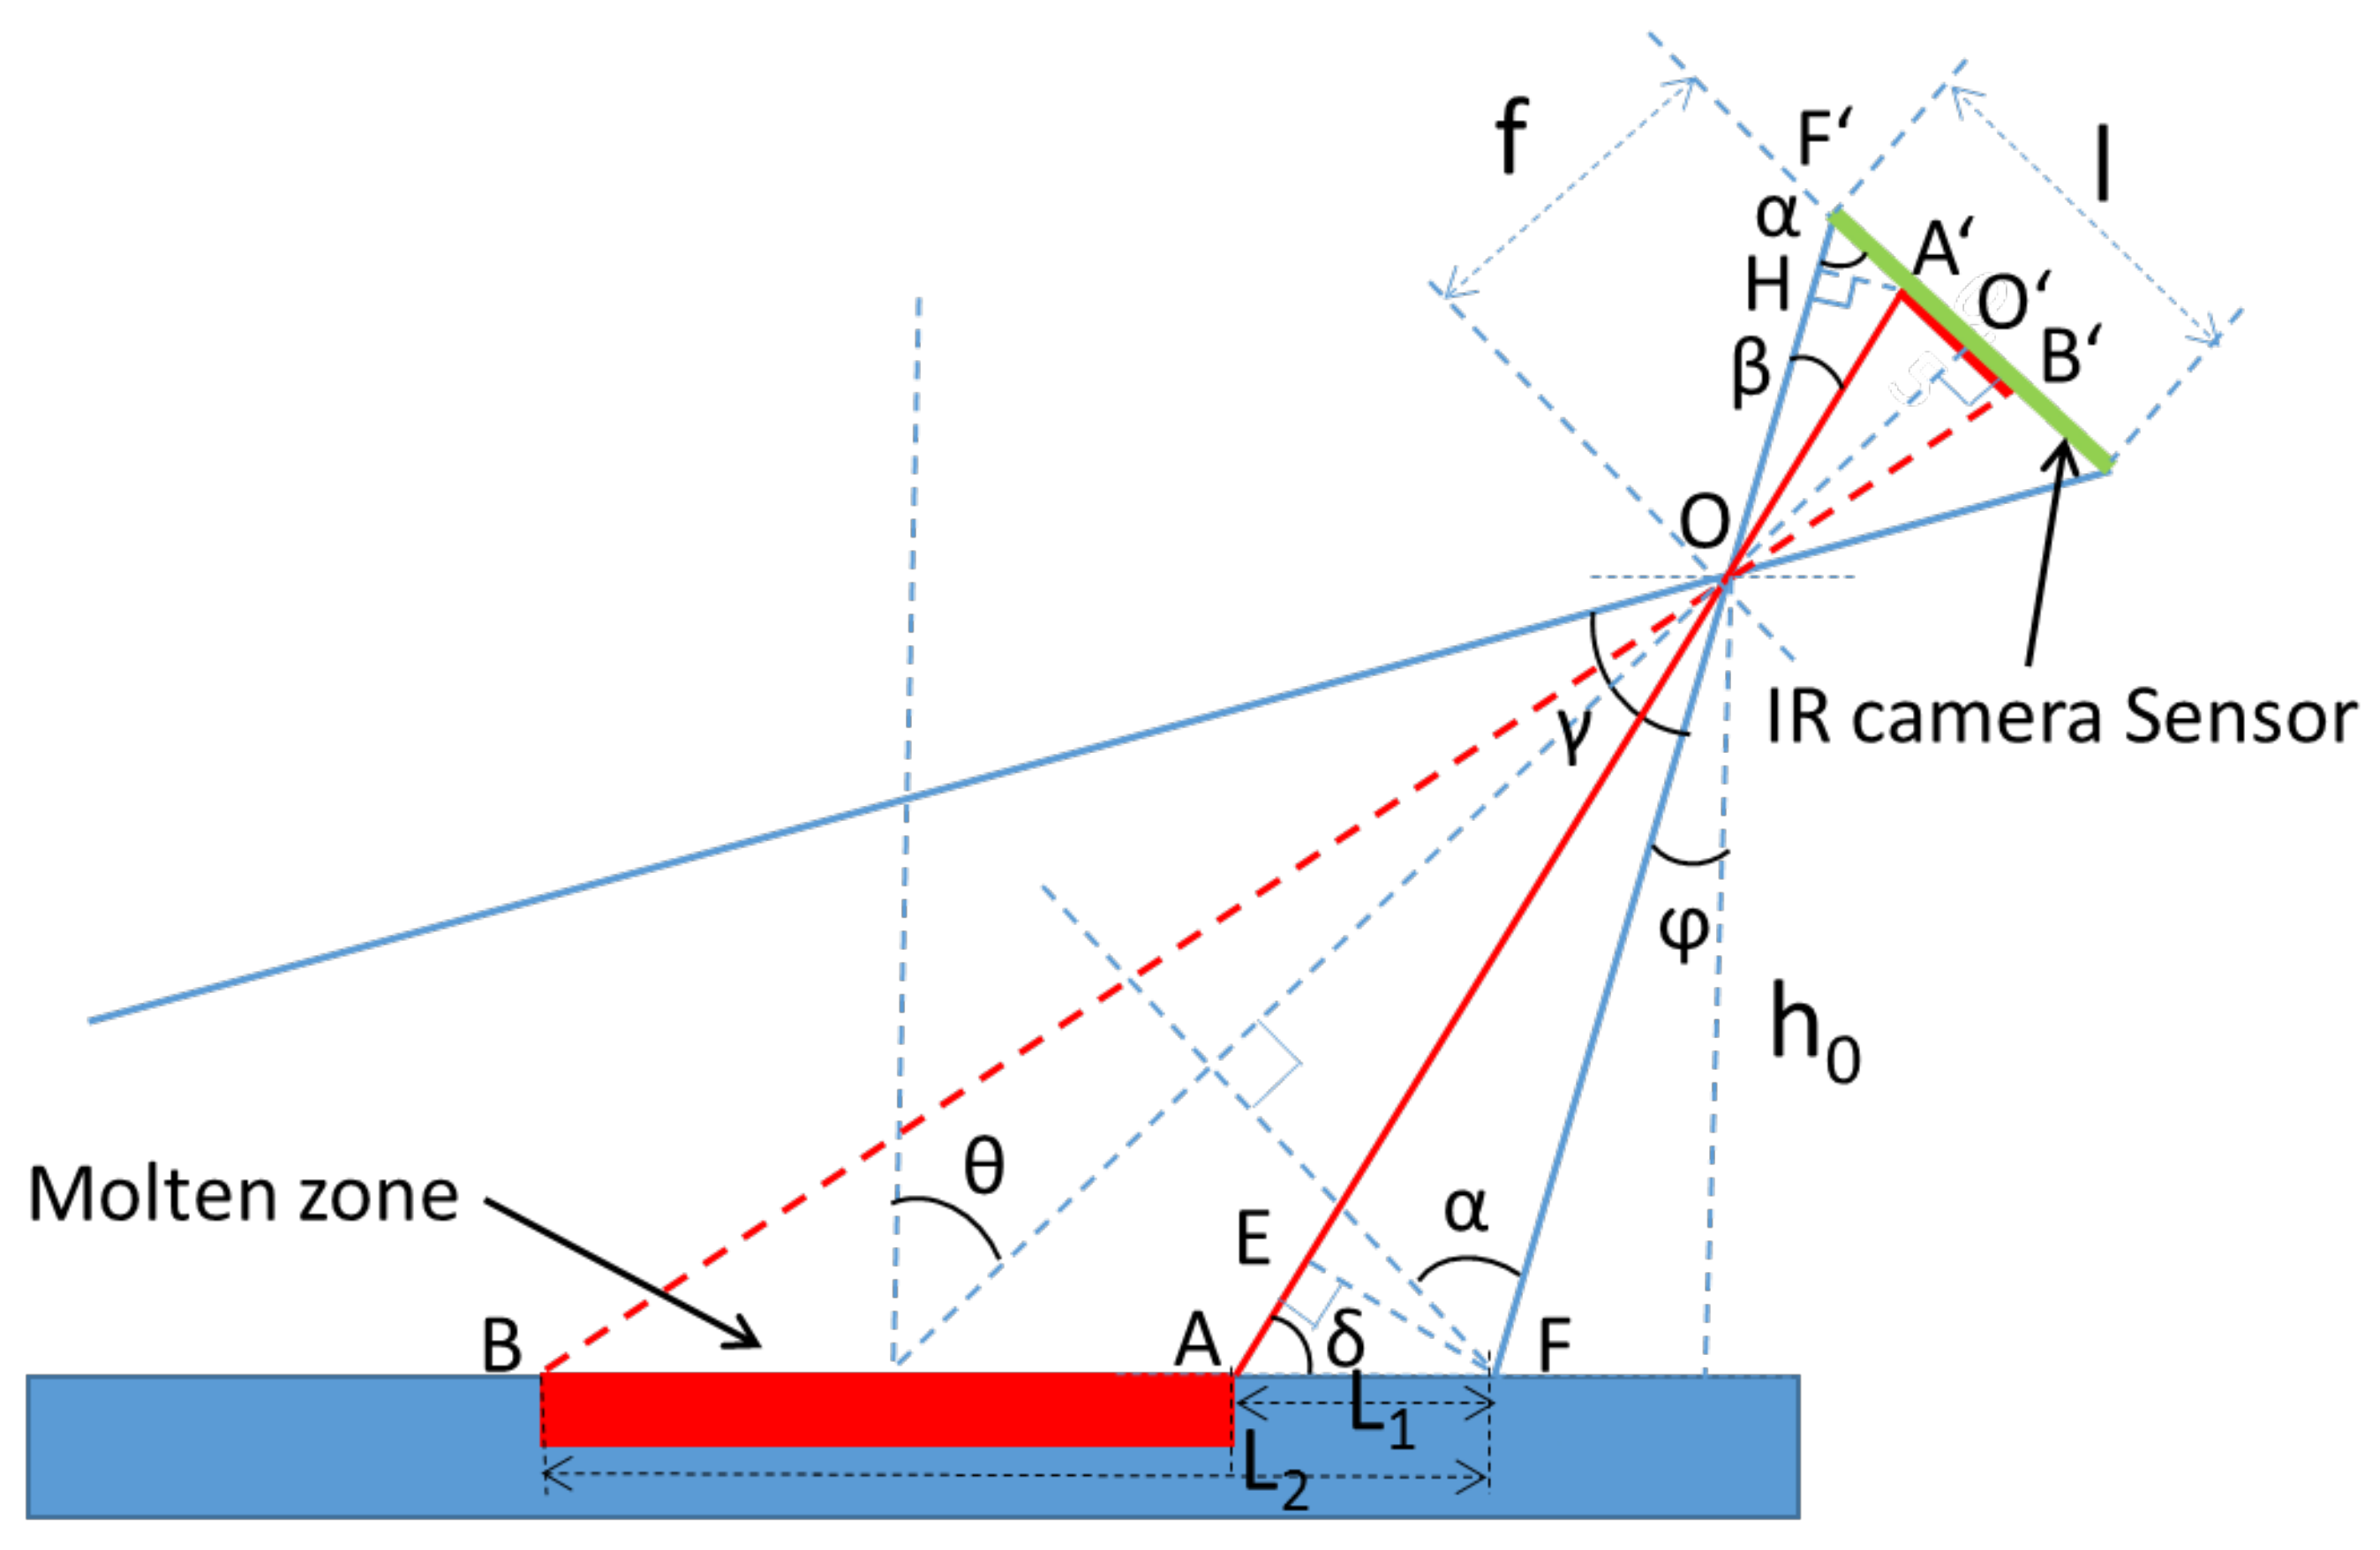
Appendix A. Function for the Conversion of the Zone Length from Pixels to Millimeters

f ( n ) = L = E F sin δ
δ = 180 α β θ Where θ is the camera inclination angle
α = 90 γ 2 Where γ is the camera s view angle
β = arcsin H A O A
O A = F A 2 + F O 2 2 F A · F O · cos α
H A = F A · sin α
F O = f sin α
F A = n 1280 · l
where l is the sensor size (mm), f is the focal length (mm), 1280 is the camera’s maximal horizontal pixel resolution and n is the pixel number obtained from the picture.
E F = O F · sin β
O F = h 0 cos φ
φ = θ γ 2

References

  1. Pfann, W.G. Principles of Zone-Melting. JOM 1952, 4, 747–753. [Google Scholar] [CrossRef]
  2. Spim, J.; Bernadou, M.; Garcia, A. Numerical modeling and optimization of zone refining. J. Alloys Compd. 2000, 298, 299–305. [Google Scholar] [CrossRef]
  3. Burris, L.; Stockman, C.H.; Dillon, I.G. Contribution to Mathematics of Zone Melting. JOM 1955, 7, 1017–1023. [Google Scholar] [CrossRef]
  4. Pfann, W.G. Zone Melting: This technique offers unique advantages in purification and in control of composition in various substances. Science 1962, 135, 1101–1109. [Google Scholar] [CrossRef] [PubMed]
  5. Rodway, G.; Hunt, J. Optimizing zone refining. J. Cryst. Growth 1989, 97, 680–688. [Google Scholar] [CrossRef]
  6. Ho, C.d.; Yeh, H.M.; Yeh, T.l. Numerical analysis on optimal zone lengths for each pass in multipass zone-refining processes. Can. J. Chem. Eng. 1998, 76, 113–119. [Google Scholar] [CrossRef]
  7. Zhang, X.; Friedrich, S.; Friedrich, B. Investigation of Influencing Parameters on Zone Melting Refining of Aluminium, Part One Impurities: Iron and Silicon. In Proceedings of the 2017 European Metallurgical Conference, Düsseldorf, Germany, 23–26 June 2017; pp. 1–8. [Google Scholar]
  8. Munirathnam, N.R.; Prasad, D.S.; Sudheer, C.; Rao, J.V.; Prakash, T.L. Zone refining of cadmium and related characterization. Bull. Mater. Sci. 2005, 28, 209–212. [Google Scholar] [CrossRef]
  9. Kobayashi, N. Power required to form a floating zone and the zone shape. J. Cryst. Growth 1978, 43, 417–424. [Google Scholar] [CrossRef]
  10. Louchev, O.A. The influence of natural convection on the formation of a molten zone under optical heating. J. Cryst. Growth 1993, 133, 261–266. [Google Scholar] [CrossRef]
  11. Wang, J.H.; Kim, D.H. Numerical analysis of melt/solid interface shape in zone melting recrystallization process. J. Cryst. Growthh 1997, 173, 201–209. [Google Scholar] [CrossRef]
  12. Roussopoulos, G.; Rubini, P. A thermal analysis of the horizontal zone refining of indium antimonide. J. Cryst. Growth 2004, 271, 333–340. [Google Scholar] [CrossRef] [Green Version]
  13. Zhang, X.; Friedrich, S.; Friedrich, B. Production of High Purity Metals: A Review on Zone Refining Process. J. Cryst. Process. Technol. 2018, 8, 33–55. [Google Scholar] [CrossRef]
Figure 1. Horizontal zone refining equipment with a single induction heater (photo by Martin Braun).
Applsci 08 00875 g001
Figure 2. Infrared camera setup focusing on the molten zone region below the induction coil.
Applsci 08 00875 g002
Figure 3. Sketch of the zone refining process in the experiment.
Applsci 08 00875 g003
Figure 4. (a) Horizontal zone refining equipment with a single induction heater at IME Institute of RWTH University showing the position and (b) technical details of an infrared, as well as a DSLR camera.
Applsci 08 00875 g004
Figure 5. Comparison between the IR thermography (a) with the DSLR camera picture (b) showing the molten zone in the aluminum bar.
Applsci 08 00875 g005
Figure 6. Geometrical illustration of the conversion of zone length distance from pixels to millimeters.
Applsci 08 00875 g006
Figure 7. Values of molten zone length obtained via the IR camera and the DSLR camera.
Applsci 08 00875 g007
Figure 8. An infrared thermographic picture showing the zone length in the middle portion of the bar and the horizontal and vertical temperature profile at the middle of the molten zone.
Applsci 08 00875 g008
Figure 9. Thermographic image of every hour from start to finish of one pass of zone refining.
Applsci 08 00875 g009
Figure 10. Temperature profile of the exemplary Frame 210 showing the region over the liquidus temperature of aluminum, as well as the Δ T and δ x.
Applsci 08 00875 g010
Figure 11. Temperature gradient according to the position in the bar.
Applsci 08 00875 g011
Figure 12. Macrograph of the longitudinal section, in the position at the middle of the bar (done using Barker’sreagent for 30 s at room temperature).
Applsci 08 00875 g012
Figure 13. Graph of zone length variation across the crucible, the positions on the graph referring to the time lapse images from Figure 9.
Applsci 08 00875 g013
Figure 14. Variation of the growth rate at the freezing interface along the bar.
Applsci 08 00875 g014
Figure 15. Relative concentration profile of Fe and Si along an aluminum bar subjected to one pass zone refining at 0.8 mm/min.
Applsci 08 00875 g015
Table 1. Experimental data for the emissivity values at different temperatures of lightly oxidized Al, based on the above-mentioned conditions.
Temperature ( ° C)650668674683692699
Emissivity ( ε )0.470.420.410.390.360.32

