The Role of the Process and Design Variables in Improving the Performance of Heat Exchanger Tube Expansion


Abstract
:1. Introduction
2. Materials and Methods
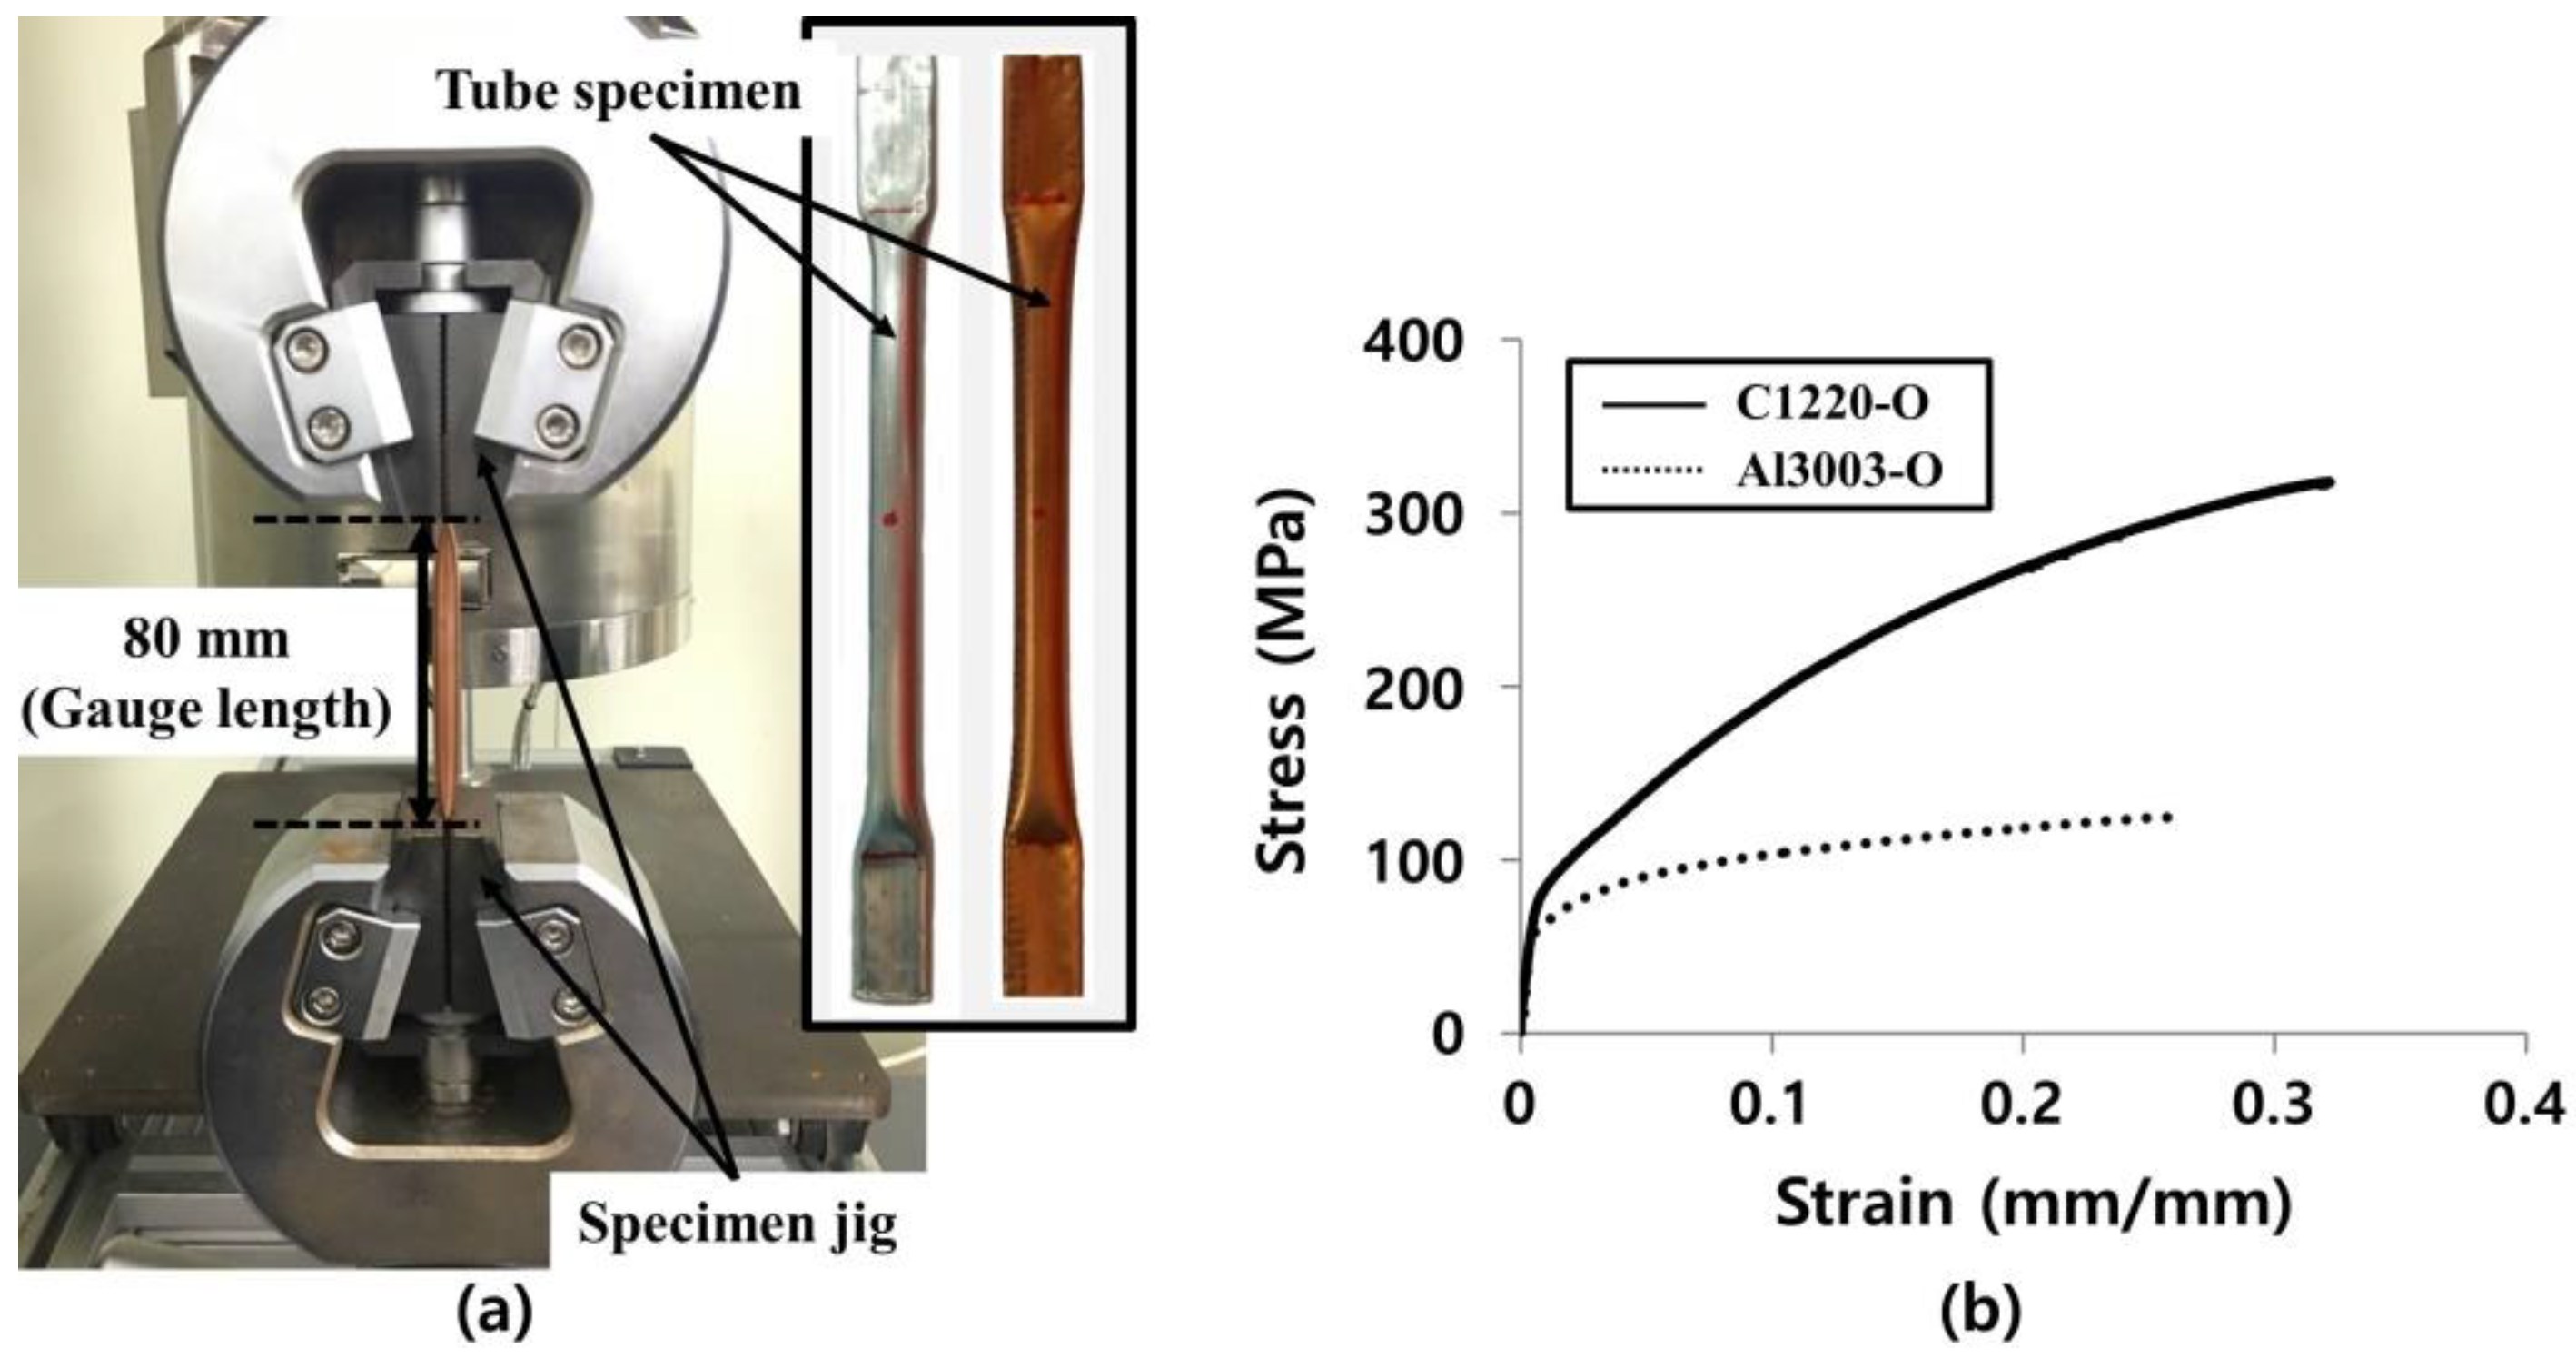
2.1. Materials
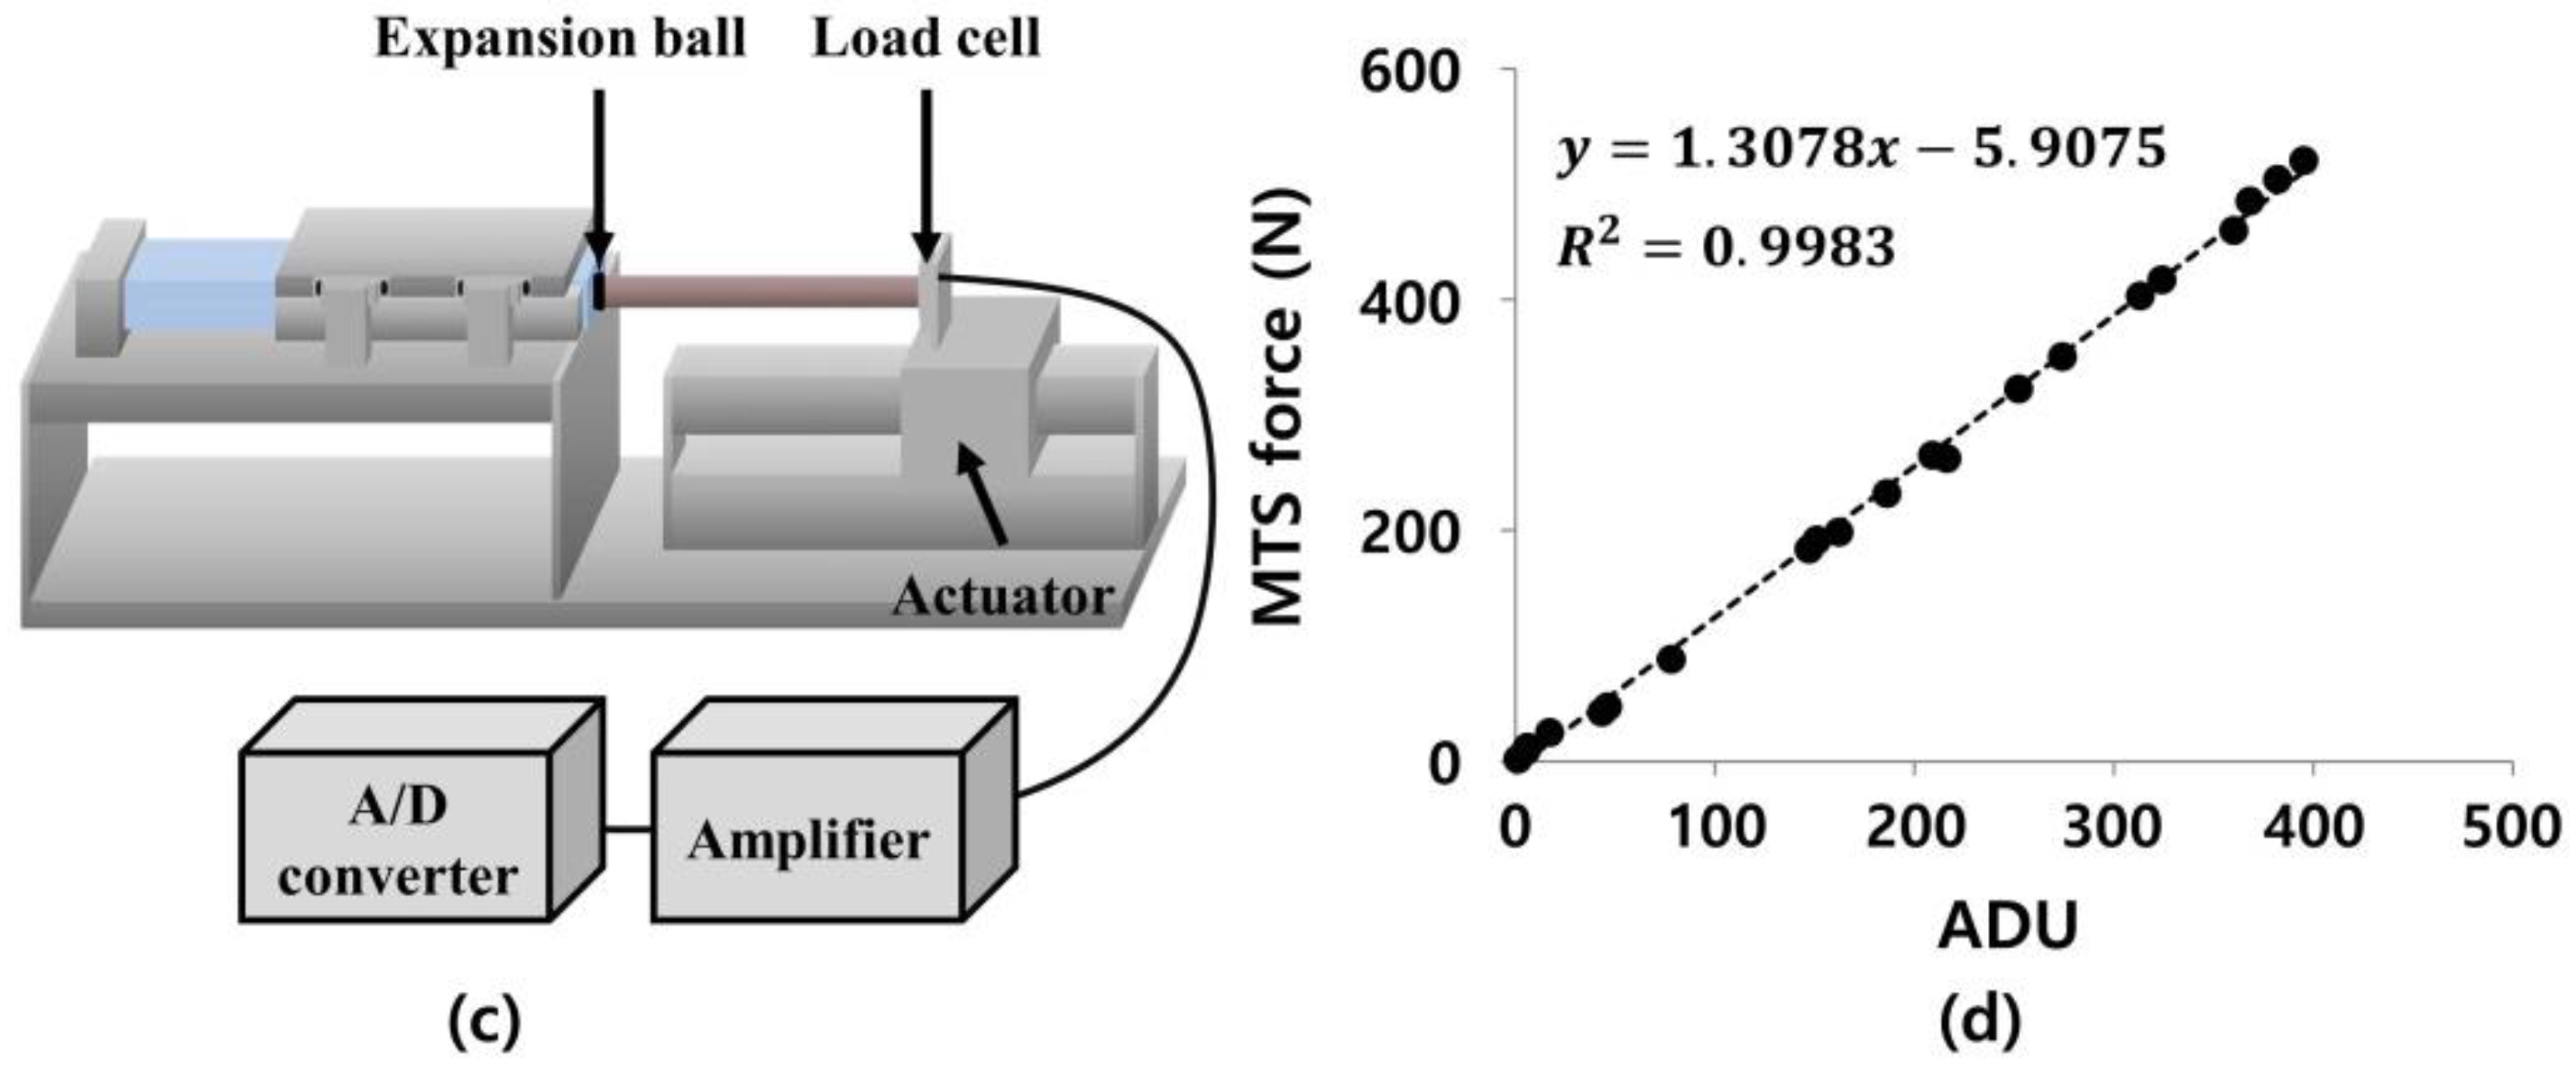
2.2. Experimental Methods
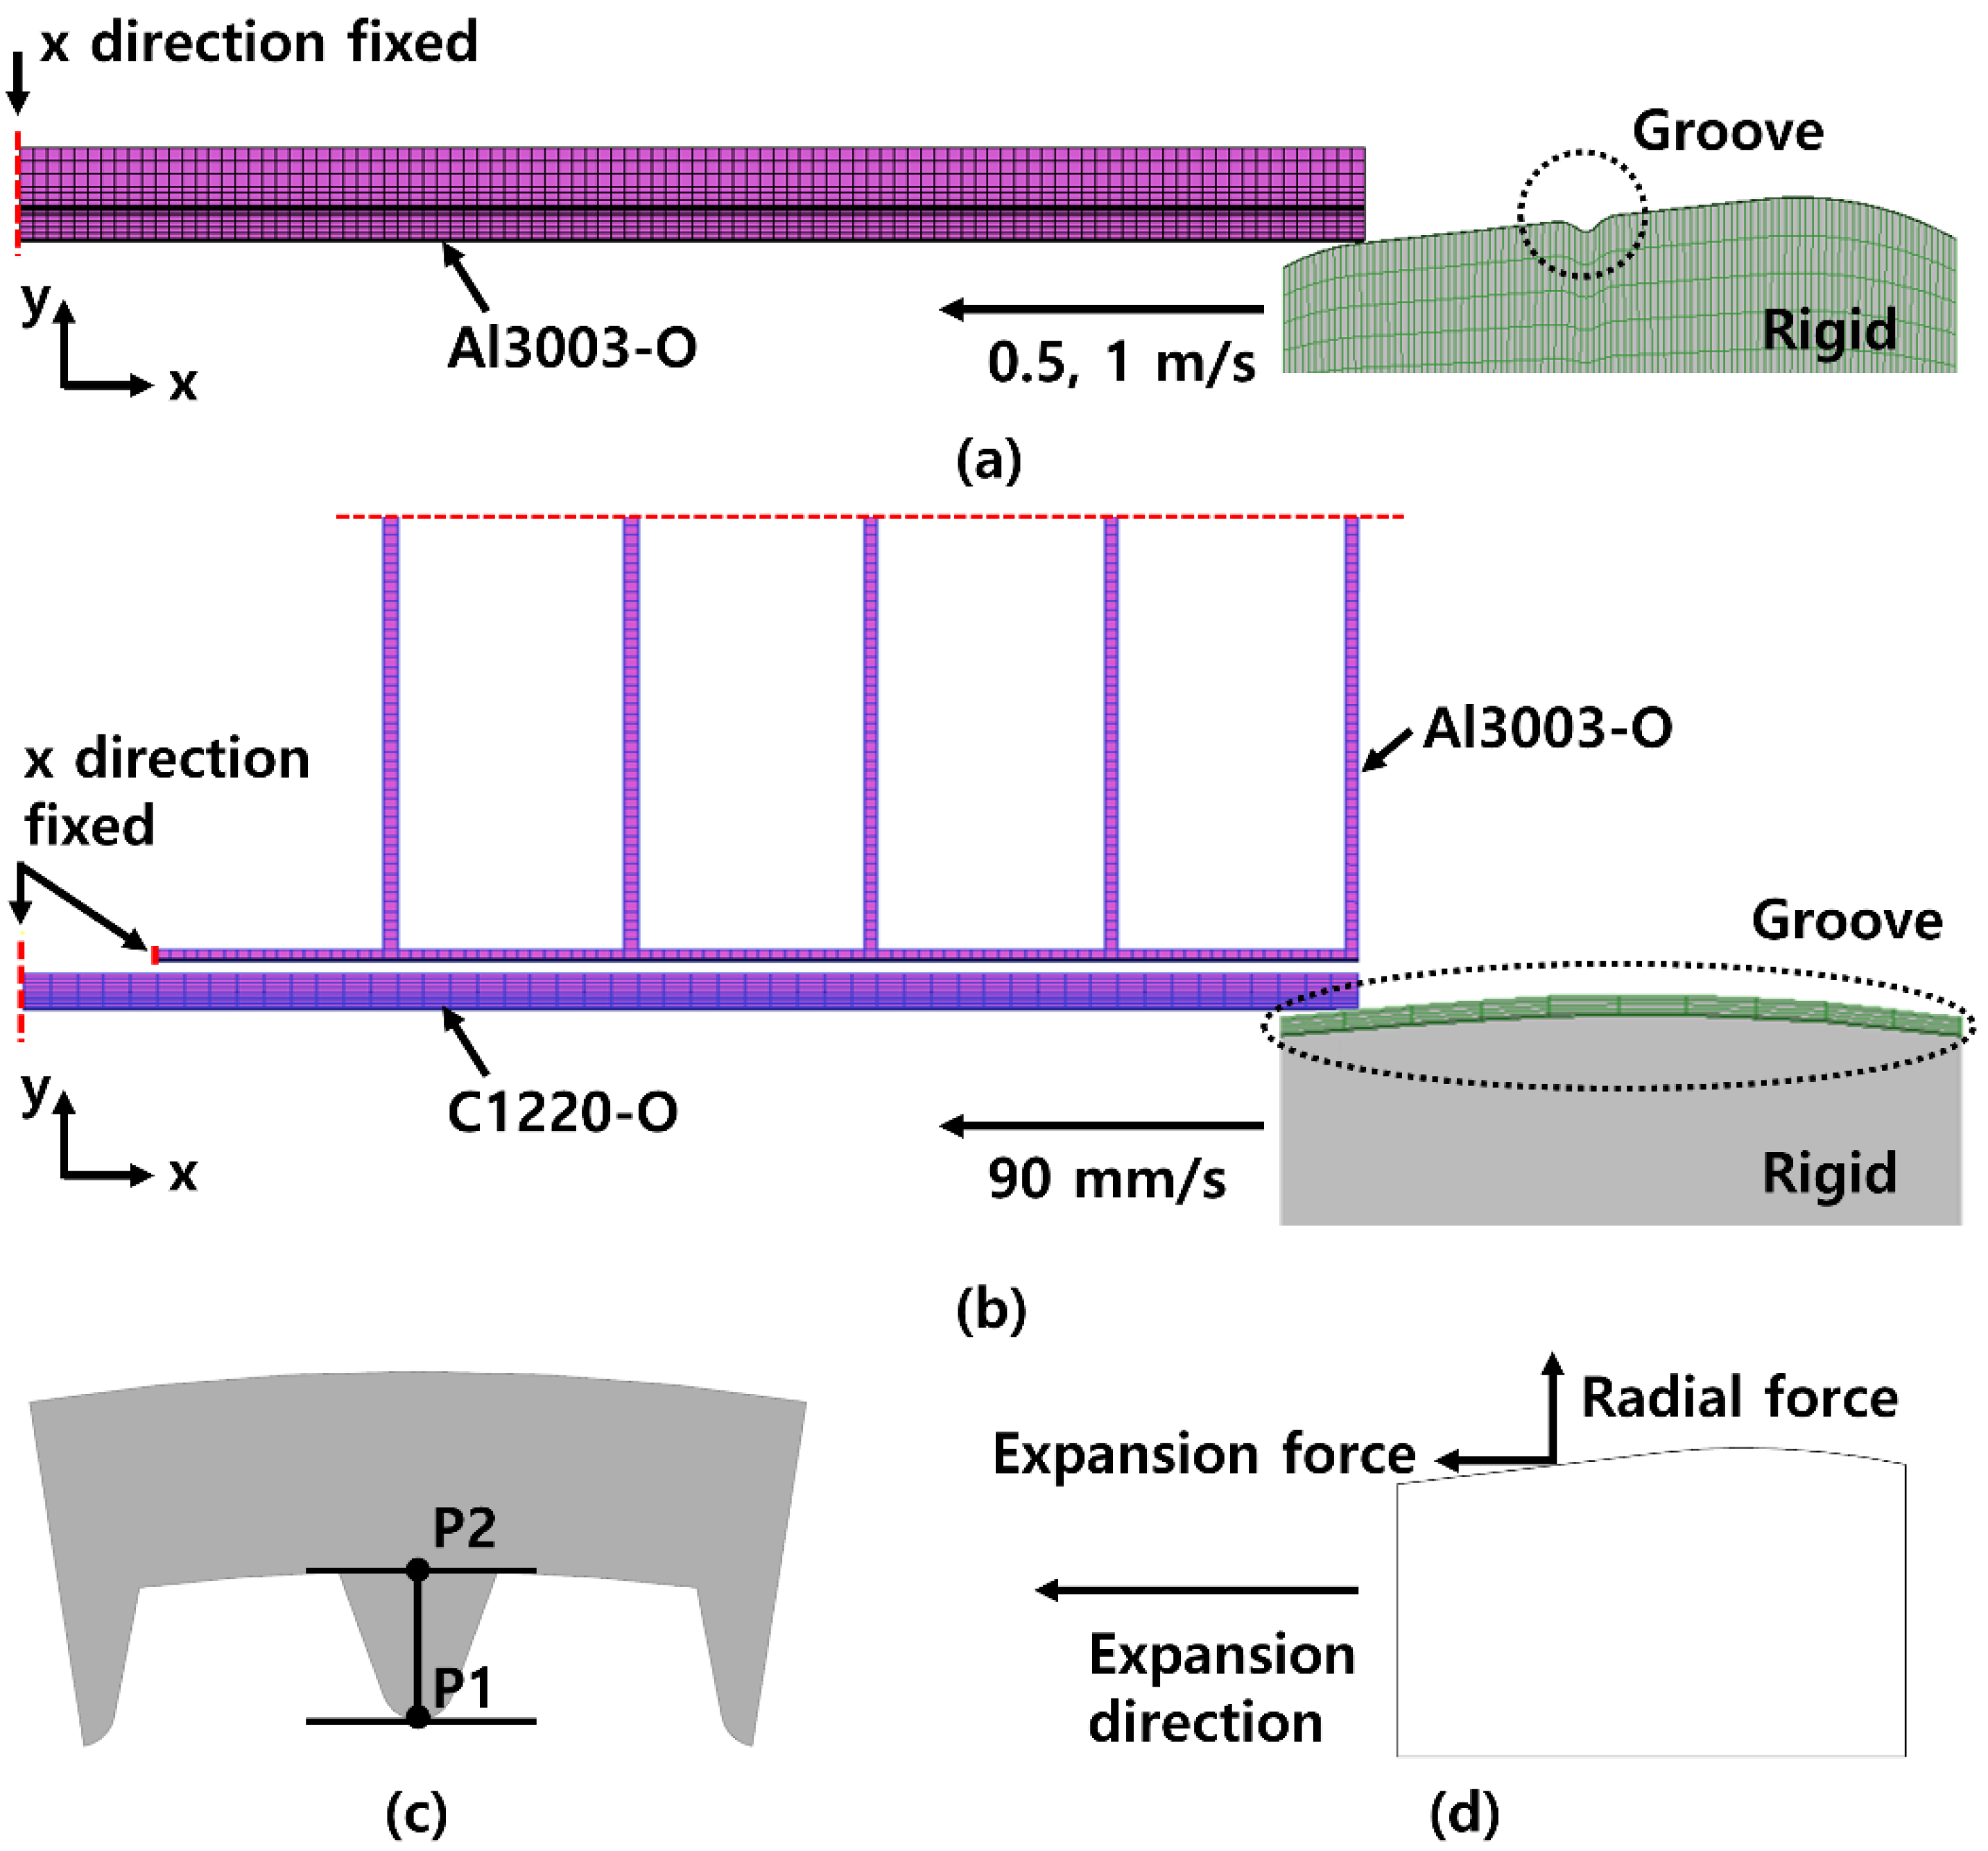
2.3. FE Analysis Methods
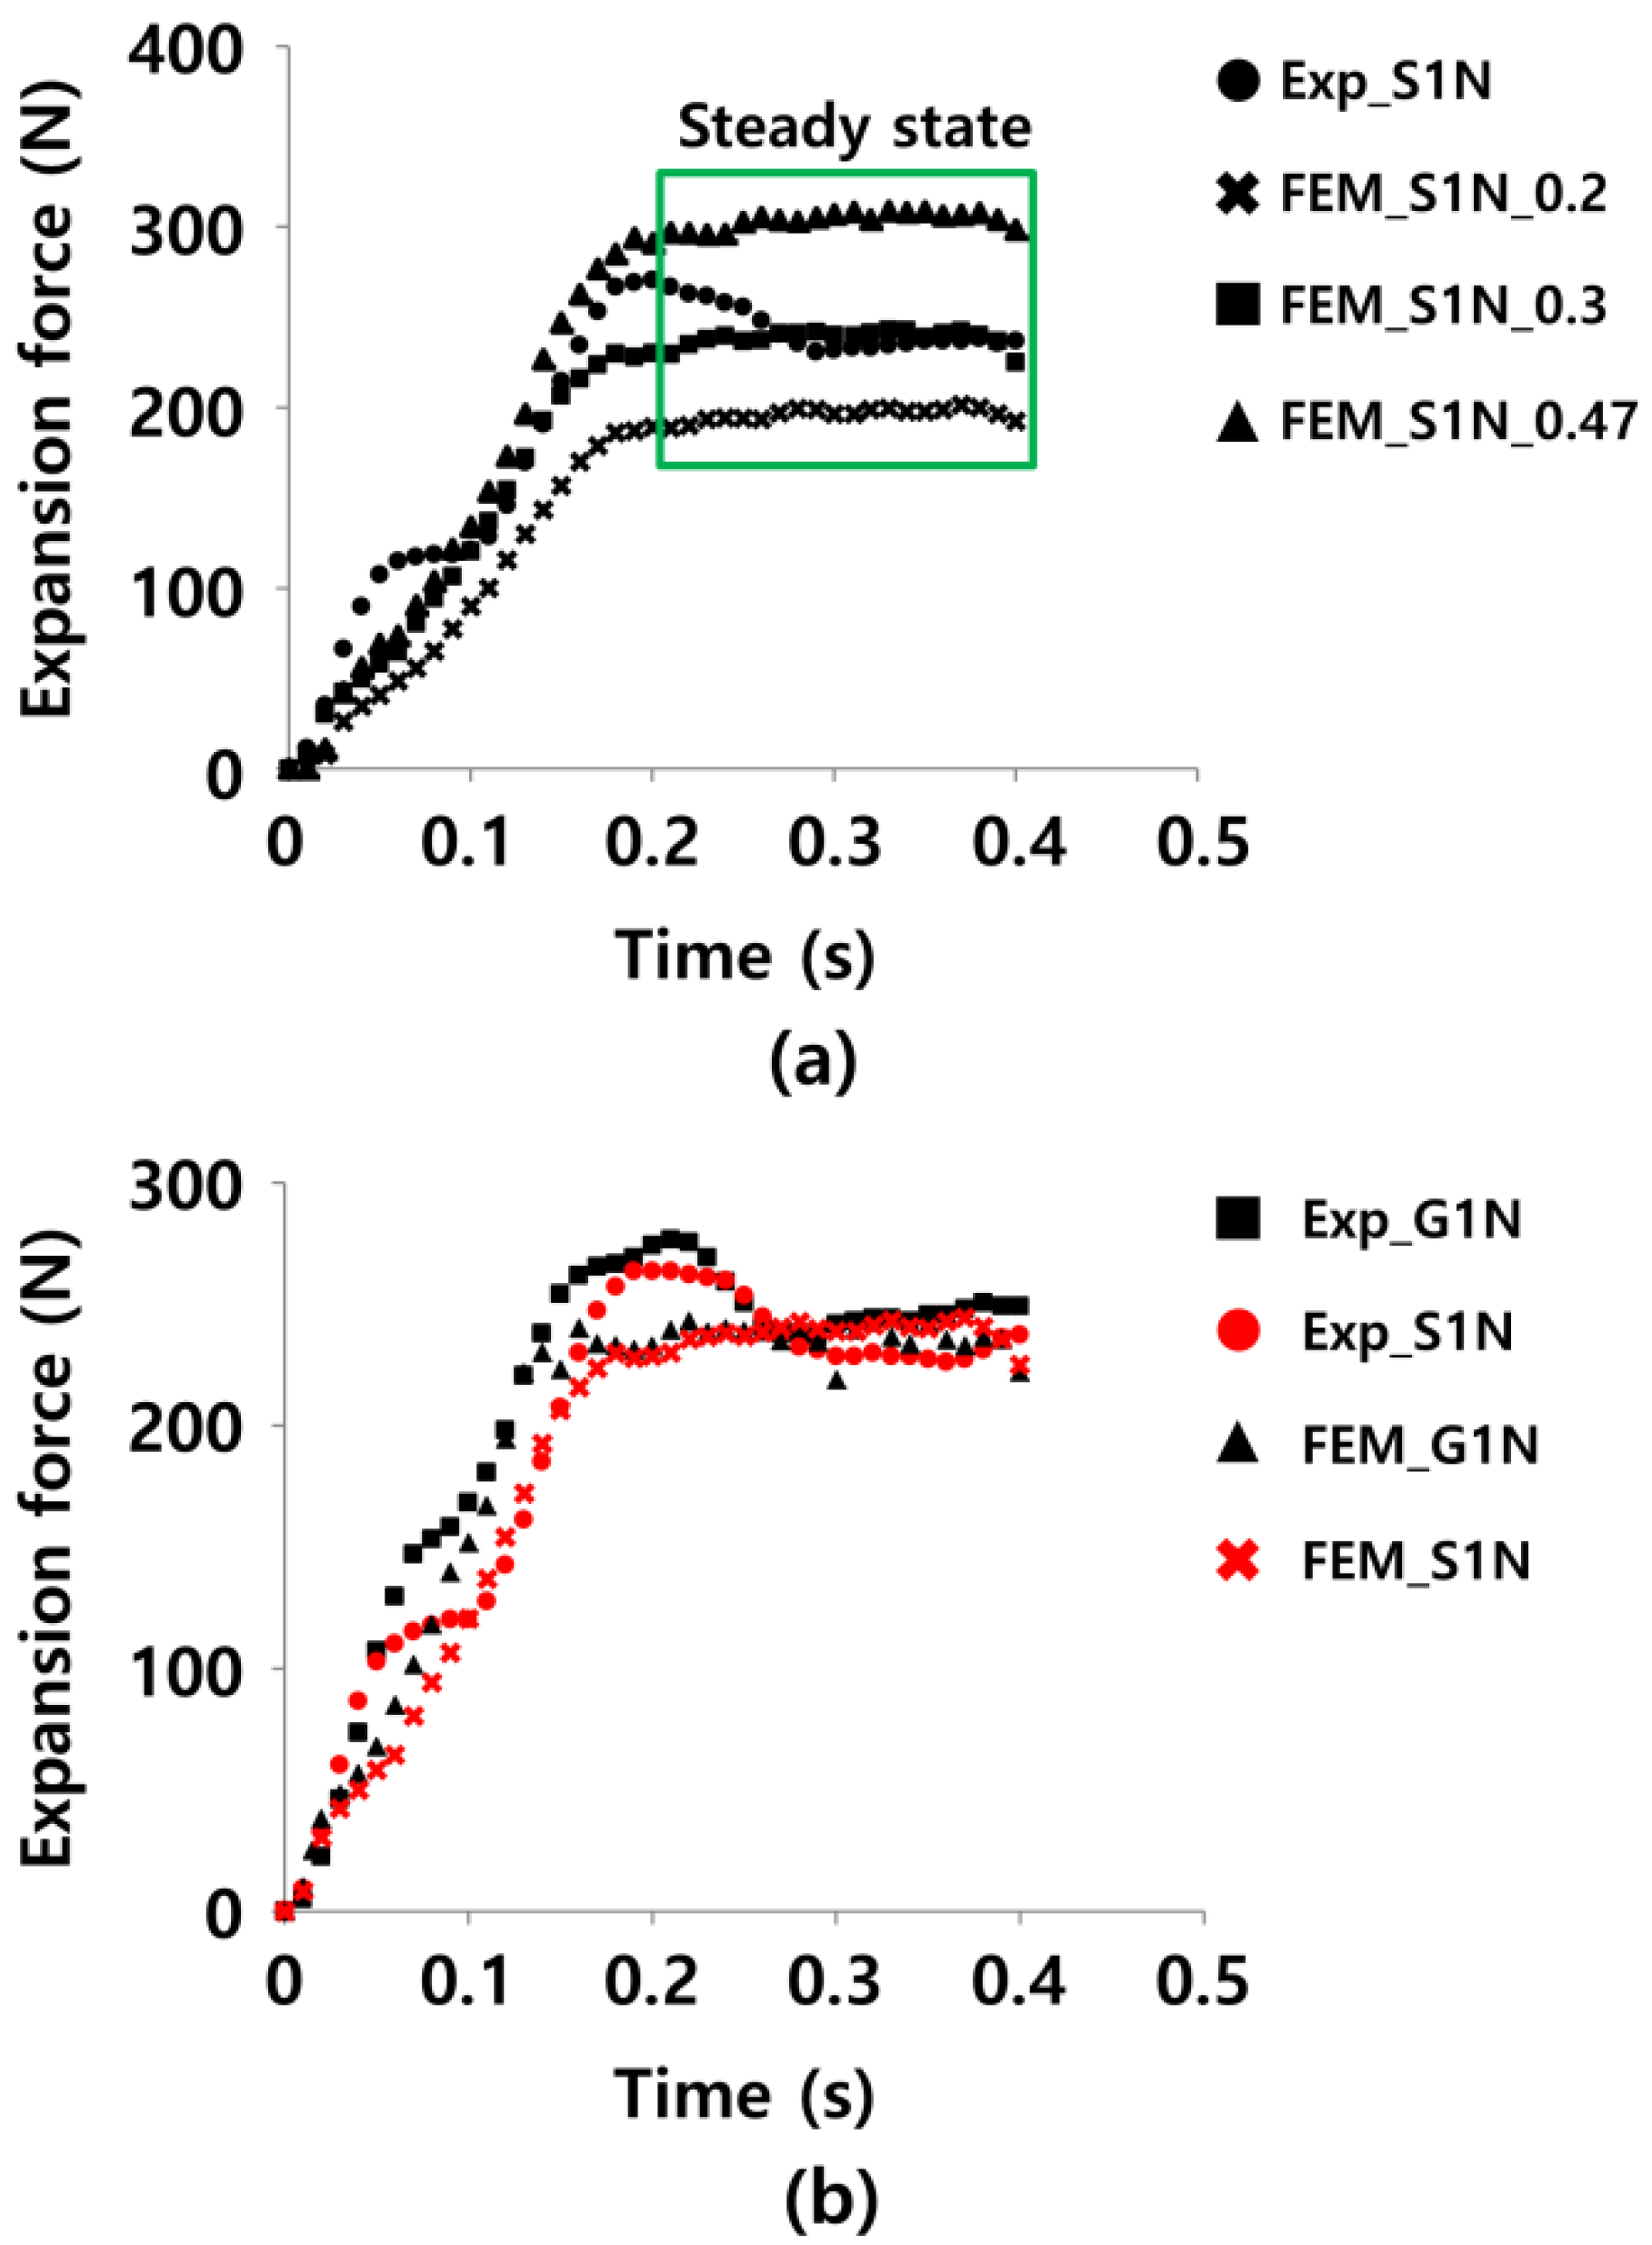
2.3.1. Validation of Finite Element Analysis
2.3.2. FE Analysis of Cu Tube Expansion
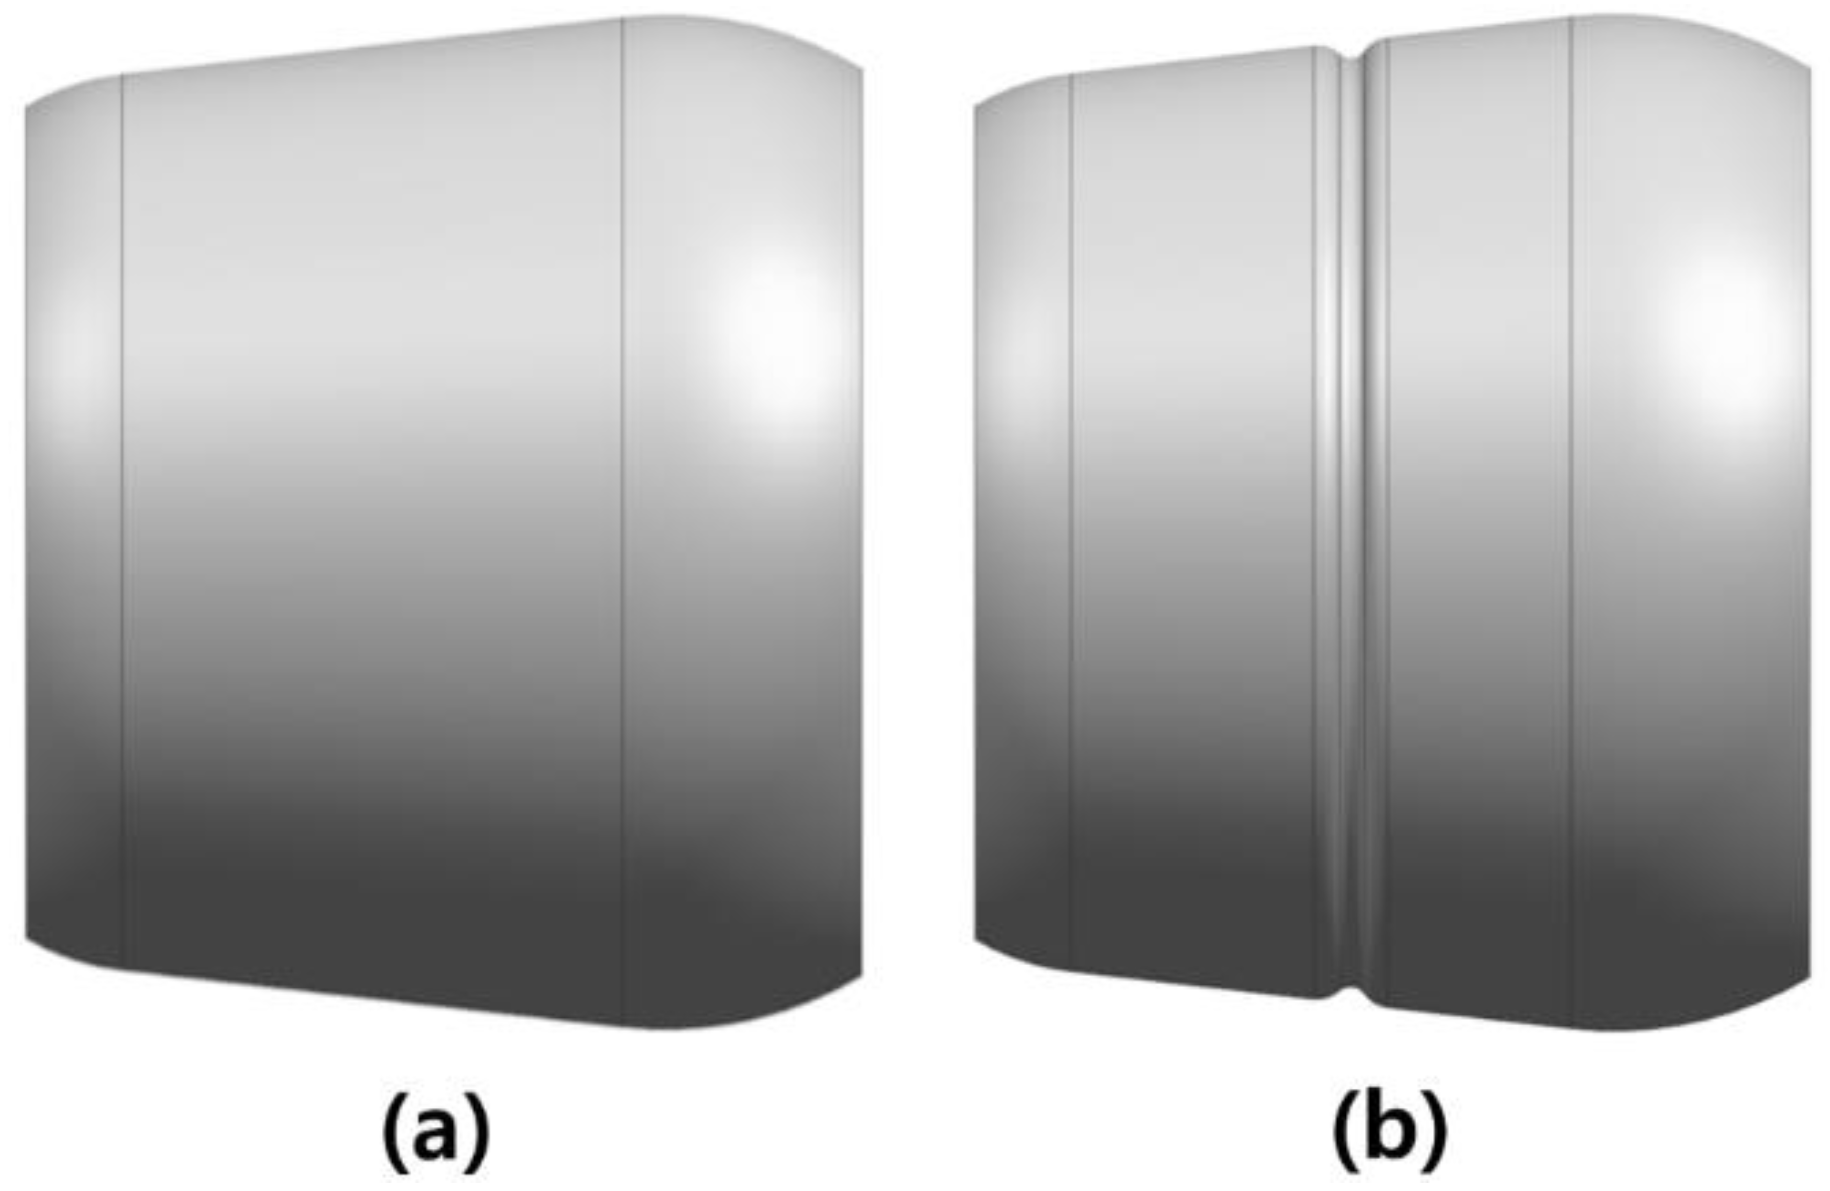
Expansion Ball Geometry
FE Analysis
2.4. Statistical Analysis
3. Results and Discussion
3.1. Al tube Expansion Experiments
3.2. Cu Tube Expansion Analysis
4. Conclusions
Author Contributions
Acknowledgments
Conflicts of Interest
References
- Finned Tube Heat Exchangers. Available online: http://www.enggcyclopedia.com/2012/03/finned-tube-heat-exchangers/ (accessed on 12 March 2012).
- Kim, Y.J.; Cho, J.M.; Kim, M.S. Experimental study on the evaporative heat transfer and pressure drop of CO2 flowing upward in vertical smooth and micro-fin tubes with the diameter of 5mm. Int. J. Refrig. 2008, 31, 771–779. [Google Scholar] [CrossRef]
- Almeida, B.; Alves, M.; Rosa, P.; Brito, A.; Martins, P. Expansion and reduction of thin-walled tubes using a die: Experimental and theoretical investigation. Int. J. Mach. Tools Manuf. 2006, 46, 1643–1652. [Google Scholar] [CrossRef]
- Pervez, T.; Qamar, S.Z.; Al-Abri, O.S.; Khan, R. Experimental and Numerical Simulation of In-Situ Tube Expansion for Deep Gas Wells. Mater. Manuf. Process. 2012, 27, 727–732. [Google Scholar] [CrossRef]
- Tang, D.; Li, D.; Peng, Y.; Du, Z. A new approach in evaluation of thermal contact conductance of tube–fin heat exchanger. Appl. Therm. Eng. 2010, 30, 1991–1996. [Google Scholar] [CrossRef]
- Avalle, M.; Priarone, P.C.; Scattina, A. Experimental and numerical characterization of a mechanical expansion process for thin-walled tubes. J. Mater. Process. Technol. 2014, 214, 1143–1152. [Google Scholar] [CrossRef]
- Scattina, A. Numerical analysis of tube expansion process for heat exchangers production. Int. J. Mech. Sci. 2016, 118, 268–282. [Google Scholar] [CrossRef]
- Karrech, A.; Seibi, A. Analytical model for the expansion of tubes under tension. J. Mater. Process. Technol. 2010, 210, 356–362. [Google Scholar] [CrossRef]
- Lee, S.-M.; Park, B.-D. Heat transfer characteristics of the non-uniform grooved tube considering tube expansion. Korean J. Air-Cond. Refrig. Eng. 2012, 24, 553–559. [Google Scholar] [CrossRef]
- Seibi, A.; Barsoum, I.; Molki, A. Experimental and numerical study of expanded aluminum and steel tubes. Procedia Eng. 2011, 10, 3049–3055. [Google Scholar] [CrossRef]
- Liu, Y.; Qiu, X. A theoretical study of the expansion metal tubes. Int. J. Mech. Sci. 2016, 114, 157–165. [Google Scholar] [CrossRef]
- Alves, M.; Almeida, B.; Rosa, P.; Martins, P. End forming of thin-walled tubes. J. Mater. Process. Technol. 2006, 177, 183–187. [Google Scholar] [CrossRef]
- Tang, D.; Li, D.; Peng, Y.; Du, Z. Mechanical Expansion of Thick-Walled Microgroove Tube for High Pressure ACR System. J. Press. Vessel. Technol. 2011, 133, 021202. [Google Scholar] [CrossRef]
- Tang, D.; Peng, Y.; Li, D. Numerical and experimental study on expansion forming of inner grooved tube. J. Mater. Process. Technol. 2009, 209, 4668–4674. [Google Scholar] [CrossRef]
- Al-Abri, O.S.; Pervez, T.; Qamar, S.Z.; Al-Busaidi, A.M. Optimum mandrel configuration for efficient down-hole tube expansion. J. Manuf. Sci. Eng. 2015, 137, 061005. [Google Scholar] [CrossRef]
- Madhusudana, C.; Cheng, W.-W. Decrease in thermal contact conductance and the contact pressure of finned-tube heat exchangers assembled with different size bullets. J. Heat Transf. 2007, 129, 907–911. [Google Scholar] [CrossRef]
- Kwon, H.; Kim, K.-H.; Han, C.; Park, S. A new methodology for detecting adhesion location in aluminum tube expansion. Adv. Mech. Eng. 2017, 9. [Google Scholar] [CrossRef]
- Chahardoli, S.; Nia, A.A. Investigation of mechanical behavior of energy absorbers in expansion and folding modes under axial quasi-static loading in both experimental and numerical methods. Thin-Walled Struct. 2017, 120, 319–332. [Google Scholar] [CrossRef]
- Reference Tables—Coefficient of Friction. Available online: http://www.engineershandbook.com/Tables/frictioncoefficients.htm (accessed on 21 September 2007).


| Experimental Group | Expansion Speed (m/s) | Lubricant | Expansion Ball Shape |
|---|---|---|---|
| G1N | 1 | Non-lubricated | Grooved |
| S1N | 1 | Non-lubricated | Smooth |
| S1A | 1 | DH173A | Smooth |
| S1H | 1 | DH23H | Smooth |
| S05H | 0.5 | DH23H | Smooth |
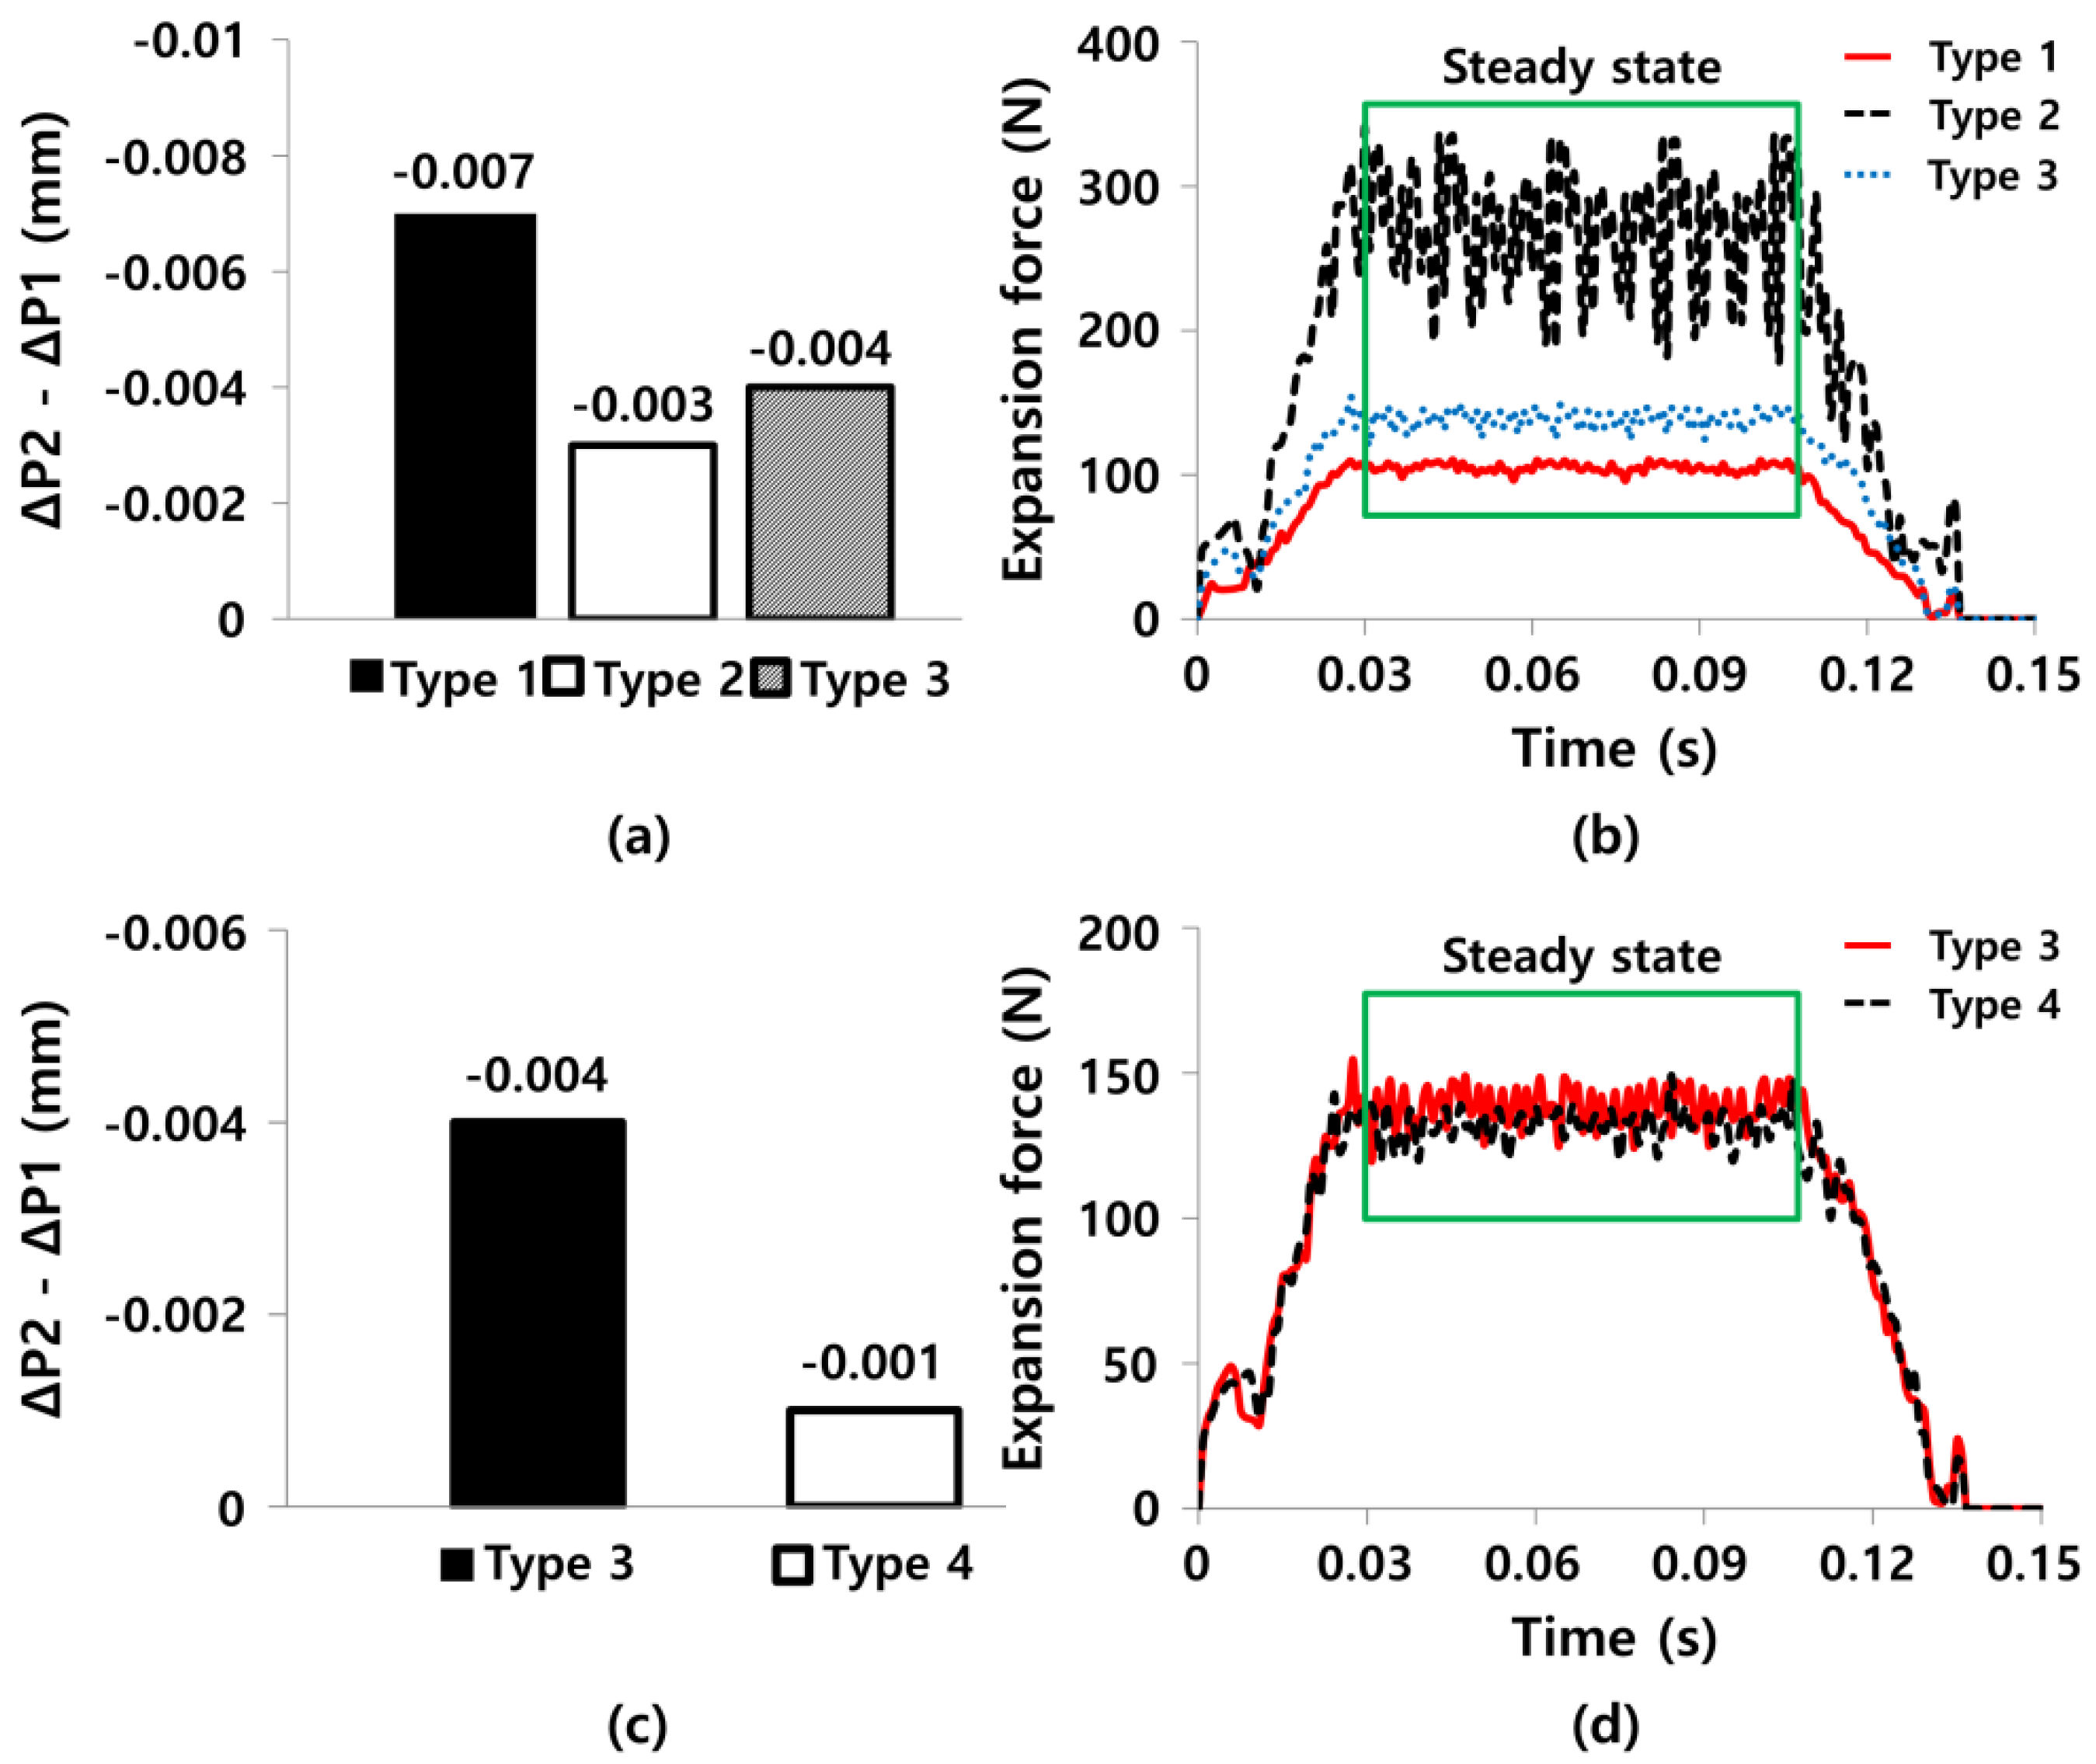
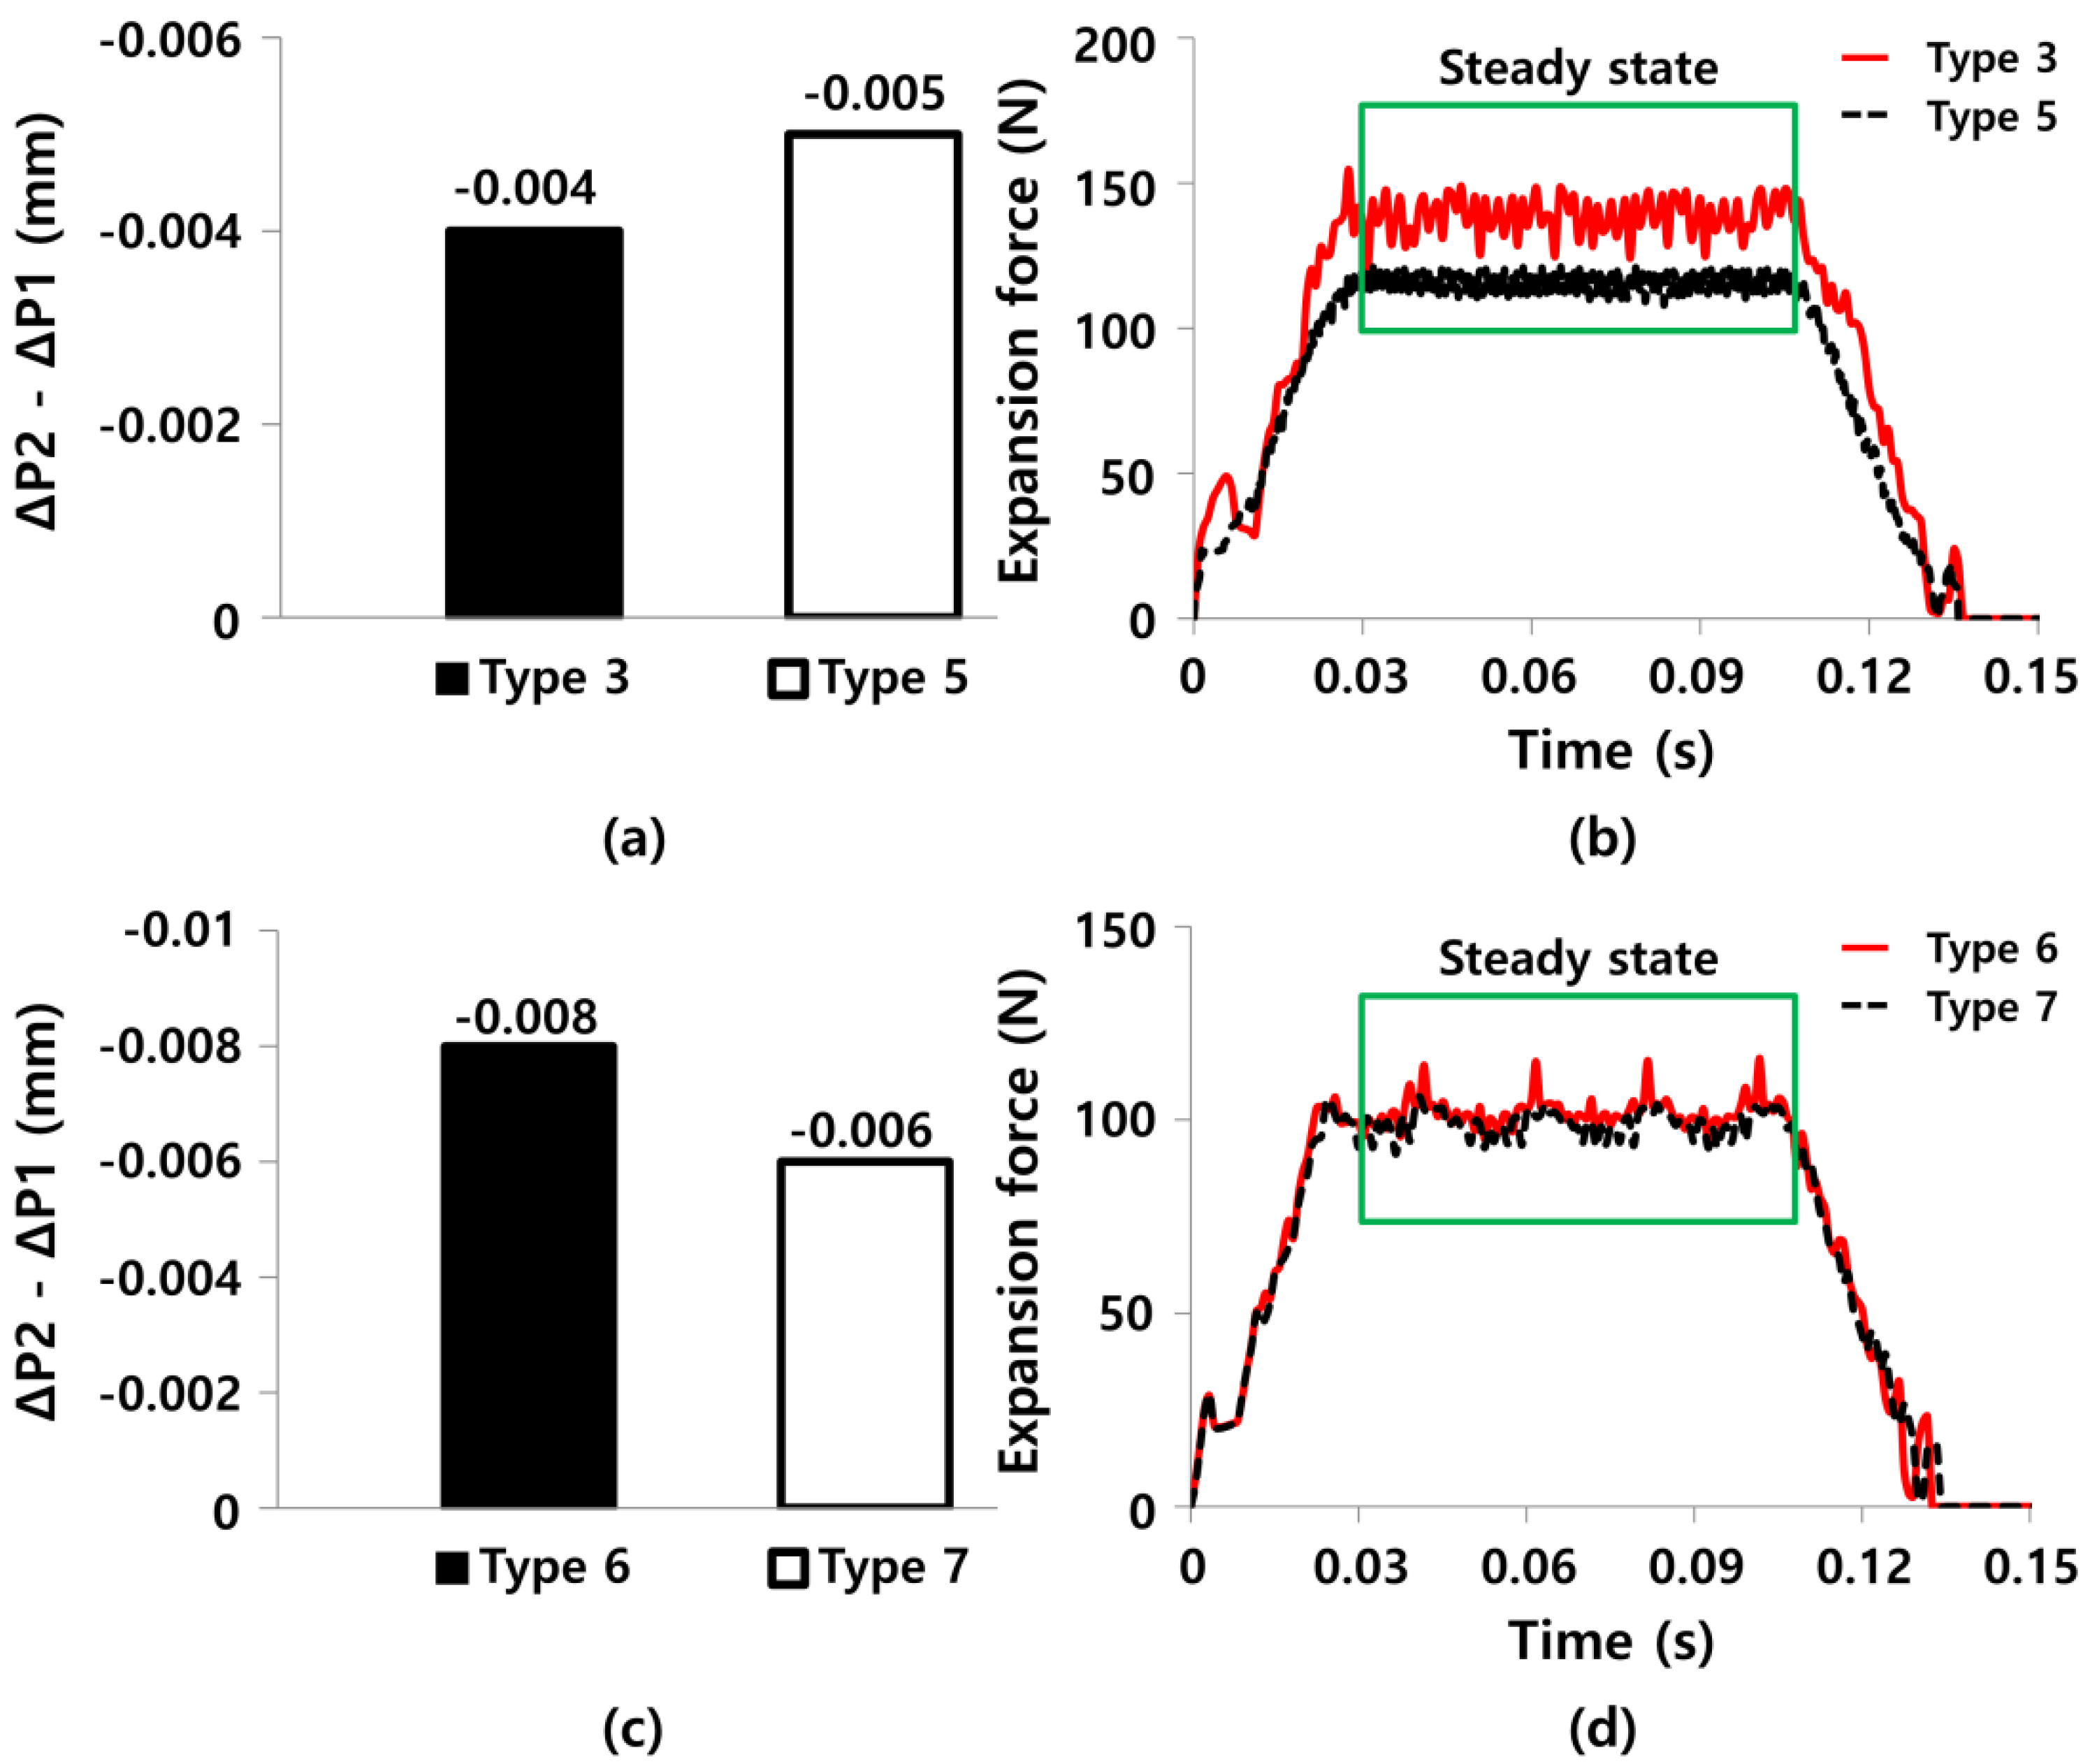
| Expansion Ball Type | Groove Number | W (mm) | H (mm) | R (mm) |
|---|---|---|---|---|
| Type 1 | 0 | 0 | 0 | 5.7 |
| Type 2 | 40 | 0.2 | 0 | 5.7 |
| Type 3 | 40 | 0.1 | 0 | 5.7 |
| Type 4 | 40 | 0.1 | 0.1 | 5.7 |
| Type 5 | 20 | 0.1 | 0 | 5.7 |
| Type 6 | 0 | 0 | 0 | 5.3 |
| Type 7 | 0 | 0 | 0 | 7.3 |
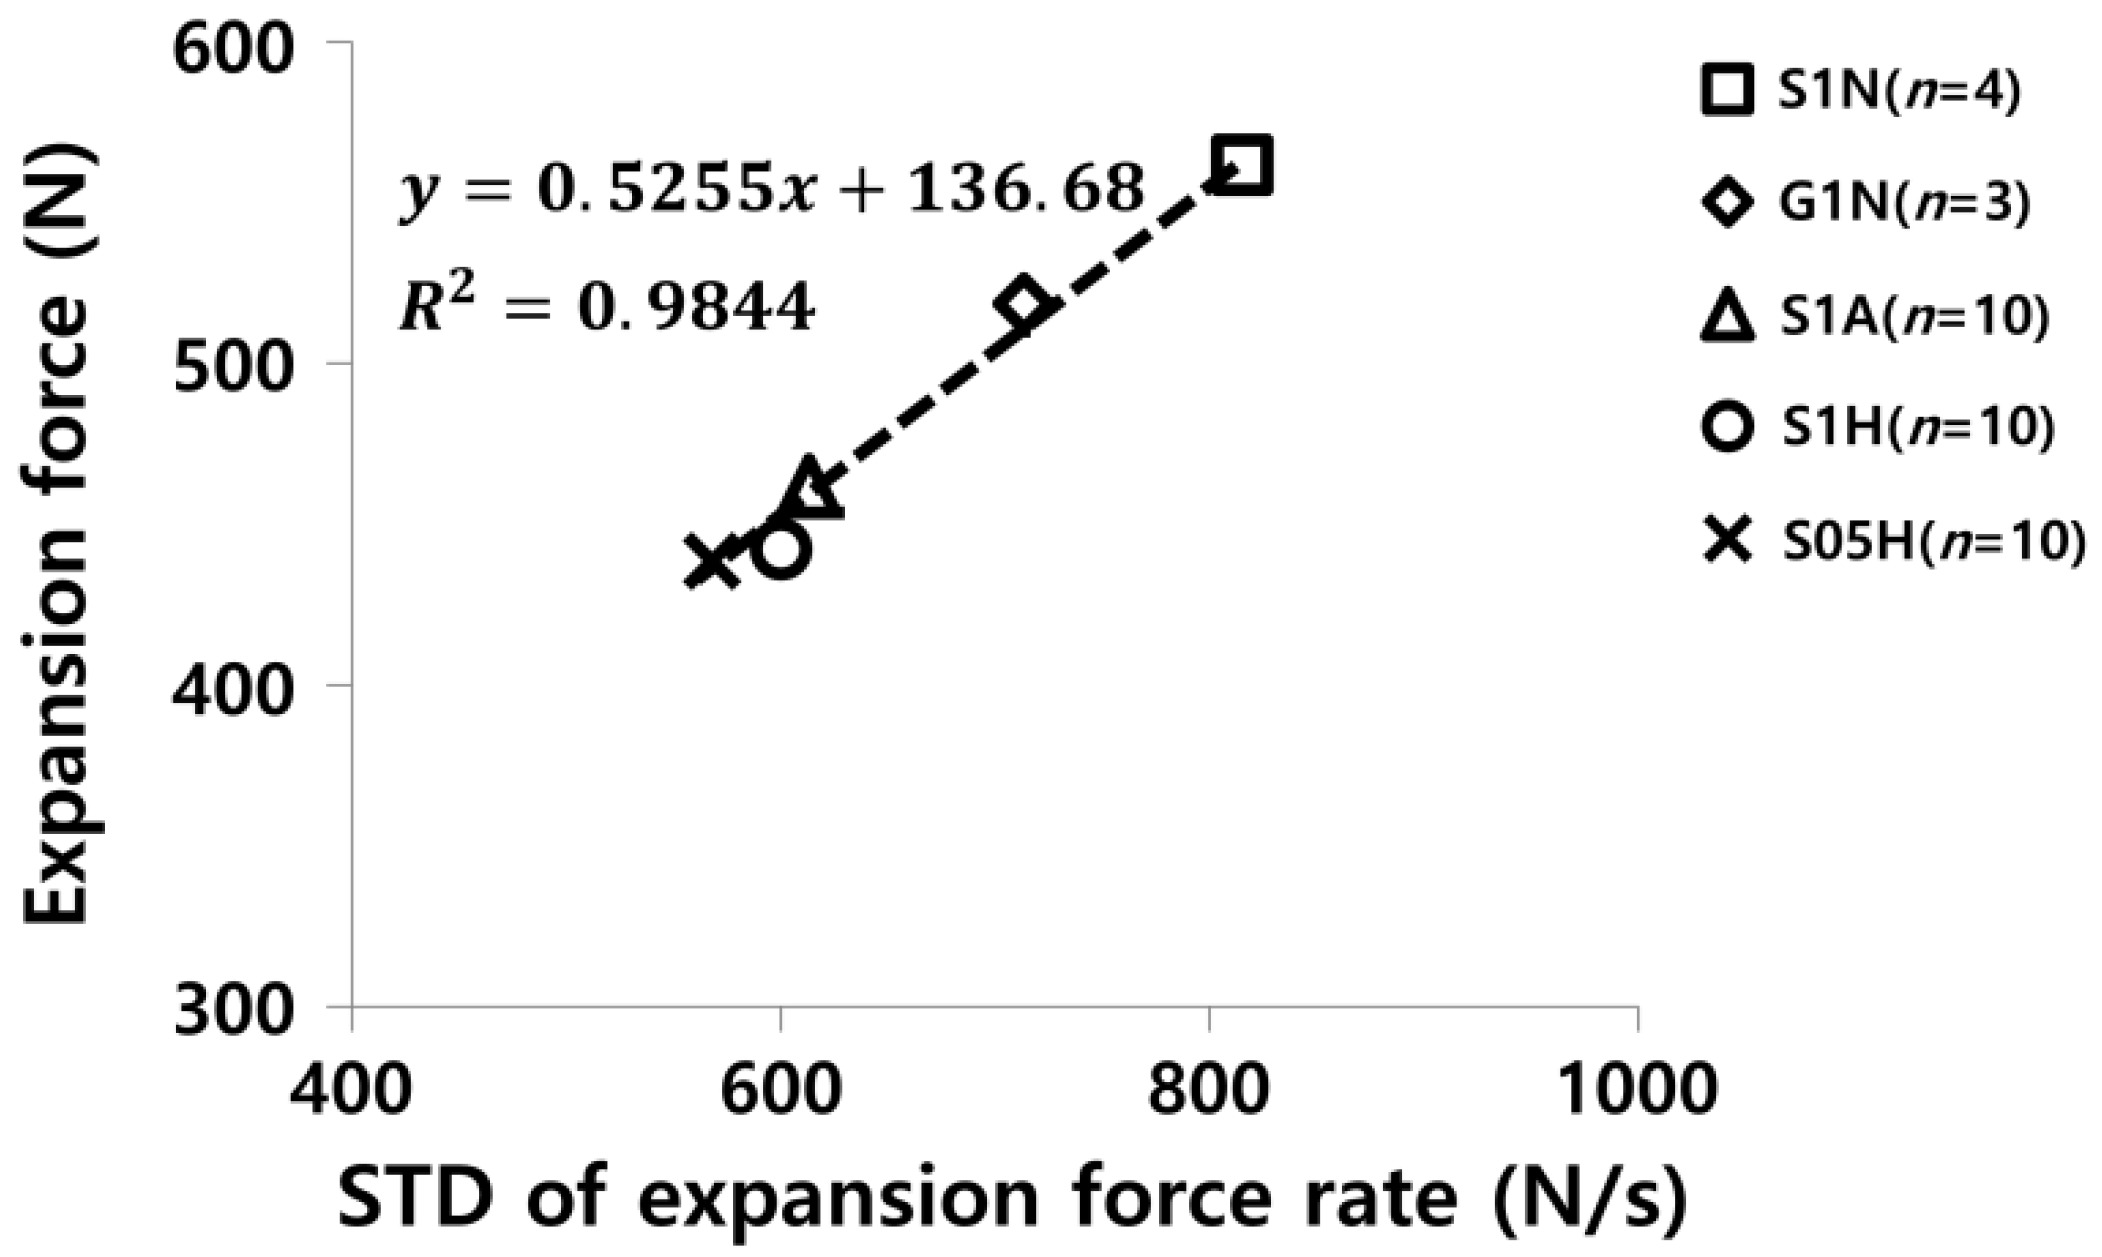
| Experimental Group | Expansion Force Rate (N/s) | STD of Expansion Force Rate (N/s) |
|---|---|---|
| G1N (n = 3) | 69.6 | 713.4 |
| S1N (n = 4) | 338.8 | 815.2 |
| S1A (n = 10) | 53.0 | 613.1 |
| S1H (n = 10) | 438.7 | 600.2 |
| S05H (n = 10) | 26.8 | 567.9 |
| Product | Measurement Method | Group | Expansion Force (N) | Tube’s Inner Groove Deformation (ΔP2 − ΔP1) (mm) |
|---|---|---|---|---|
| Aluminum tubes | Expansion experiments | G1N (n = 3) | 518.5 ± 46.6 | - |
| S1N (n = 4) | 561.3 ± 44.8 | - | ||
| S1A (n = 10) | 461.8 ± 5.3 | - | ||
| S1H (n = 10) | 442.1 ± 8.9 | - | ||
| S05H (n = 10) | 438.5 ± 17.2 | - | ||
| Copper tubes | Finite element analysis | Type 1 ball | 104.8 | −0.007 |
| Type 2 ball | 270.5 | −0.003 | ||
| Type 3 ball | 138.3 | −0.004 | ||
| Type 4 ball | 131.8 | −0.001 | ||
| Type 5 ball | 115.5 | −0.005 | ||
| Type 6 ball | 91.6 | −0.008 | ||
| Type 7 ball | 88.9 | −0.006 |
© 2018 by the authors. Licensee MDPI, Basel, Switzerland. This article is an open access article distributed under the terms and conditions of the Creative Commons Attribution (CC BY) license (http://creativecommons.org/licenses/by/4.0/).
Share and Cite
Han, C.; Sin, I.; Kwon, H.; Park, S. The Role of the Process and Design Variables in Improving the Performance of Heat Exchanger Tube Expansion. Appl. Sci. 2018, 8, 756. https://doi.org/10.3390/app8050756
Han C, Sin I, Kwon H, Park S. The Role of the Process and Design Variables in Improving the Performance of Heat Exchanger Tube Expansion. Applied Sciences. 2018; 8(5):756. https://doi.org/10.3390/app8050756
Chicago/Turabian StyleHan, Changwan, Inchul Sin, Hyerin Kwon, and Seonghun Park. 2018. "The Role of the Process and Design Variables in Improving the Performance of Heat Exchanger Tube Expansion" Applied Sciences 8, no. 5: 756. https://doi.org/10.3390/app8050756
APA StyleHan, C., Sin, I., Kwon, H., & Park, S. (2018). The Role of the Process and Design Variables in Improving the Performance of Heat Exchanger Tube Expansion. Applied Sciences, 8(5), 756. https://doi.org/10.3390/app8050756