Since the pigment-dyeing process is based on the interaction between the pigment and the fabric surface, the particle size of the pigment may affect the dyeing results. The original particle size of the pigment was an effective diameter of 206.0 nm. After ultrasound treatment, the effective diameter of the pigment was 199.9 nm. The difference in the effective diameters of the pigment before and after the ultrasound process is not significant. Thus, no additional dispersing process is required to avoid the aggregation of pigment particles during the pigment-dyeing process.
3.1. Colour Yield
Table 4 shows the colour yield (expressed as
K/
S value) of cotton fabrics dyed with pigment concentrations of 1 g/L and 5 g/L, respectively. Samples 1 to 9 represent cotton fabric treated with atmospheric pressure plasma with different combinations of operational parameters (
Table 1). It is noted that the K/S values of the atmospheric pressure plasma-treated cotton fabric are higher than untreated cotton fabric (i.e., control), which indicates more pigment particles in the atmospheric pressure plasma-treated cotton fabrics than in the untreated cotton fabric. Since atmospheric pressure plasma treatment can improve the water absorption ability of cotton fabric by inserting oxygen-containing functional groups and generating cracks/grooves in the fibre surface [
9,
10], both chemical and physical surface modifications facilitate pigment absorption in the atmospheric pressure plasma-treated cotton fabric. As a result, a better colour yield was obtained in the atmospheric pressure plasma-treated cotton fabric than in the untreated control cotton fabric.
In
Table 4, the
K/
S values of 1 g/L of pigment-dyed cotton fabrics were not significantly affected in relation to the discharge power (130 W to 170 W). Conversely, in the case of 5 g/L, the
K/
S values of 5 g/L pigment-dyed cotton fabrics had a positive relationship with the discharge power (
Table 4). Under the influence of atmospheric pressure plasma treatment, the cotton fibre surface can be modified by generating oxygen-containing functional groups (which are hydrophilic in nature) and cracks/grooves along the fibre axis [
9,
10]. Generally speaking, the discharge power at a high level can produce deep cracks/grooves along the fibre axis, because a high discharge power implies a high active species formation rate [
10,
23]. With the increasing of level of discharge power from 130 W to 170 W, deep cracks/groves are generated in the cotton fibre surface, and hence, more space is provided for accommodating the pigment particles. This makes the pigment-dyeing solution diffuse at a faster rate along the fibre axis for enhancing pigment absorption, resulting in an increased colour yield.
In the case of the oxygen flow rate, it is noted that the oxygen gas used can contribute an active plasma species for enhancing surface etching and the oxidizing effect [
2,
3,
4]. After atmospheric pressure plasma treatment, the newly inserted oxygen-containing groups (e.g., –OH and –C–O) in the cotton fibre surface are capable of forming more hydrogen bonds with water molecules [
10]; then, the pigment-dyeing solution absorption is enhanced as a result. However, based on the
K/
S values of samples 3 to 6, there is no obvious relationship between colour yield and the oxygen flow rate, although samples 3 to 6 did achieve a better colour yield than the untreated cotton fabric. To conclude, the increase in the
K/
S values of the atmospheric pressure plasma-treated cotton fabrics is influenced by the combined effect of both discharge power and the oxygen flow rate. The increase in the
K/
S values of the atmospheric pressure plasma-treated cotton fabric is mainly due to the formation of cracks/grooves in the fibre surface.
As shown in
Table 4, an increase in the head moving speed (Samples 7 to 9) shows a negative effect on the colour yield of the yellow pigment-dyeing application (1 g/L and 5 g/L). When the head moving speed is kept at 1mm/s, the
K/
S value is the highest (Sample 7). In the case of Sample 7, the slow head moving speed of 1mm/s means that the active plasma species can accumulate on the fabric surface with more time. Thus, an adequate amount of time is provided for surface interaction [
23], and continuous cracks/grooves along fibre axis are more observable in the case of the slow head moving speed [
23]. As a result, the pigment-dyeing solution absorption is enhanced by the cracks/grooves along the fibre axis due to great capillary action.
3.2. Colour Levelness
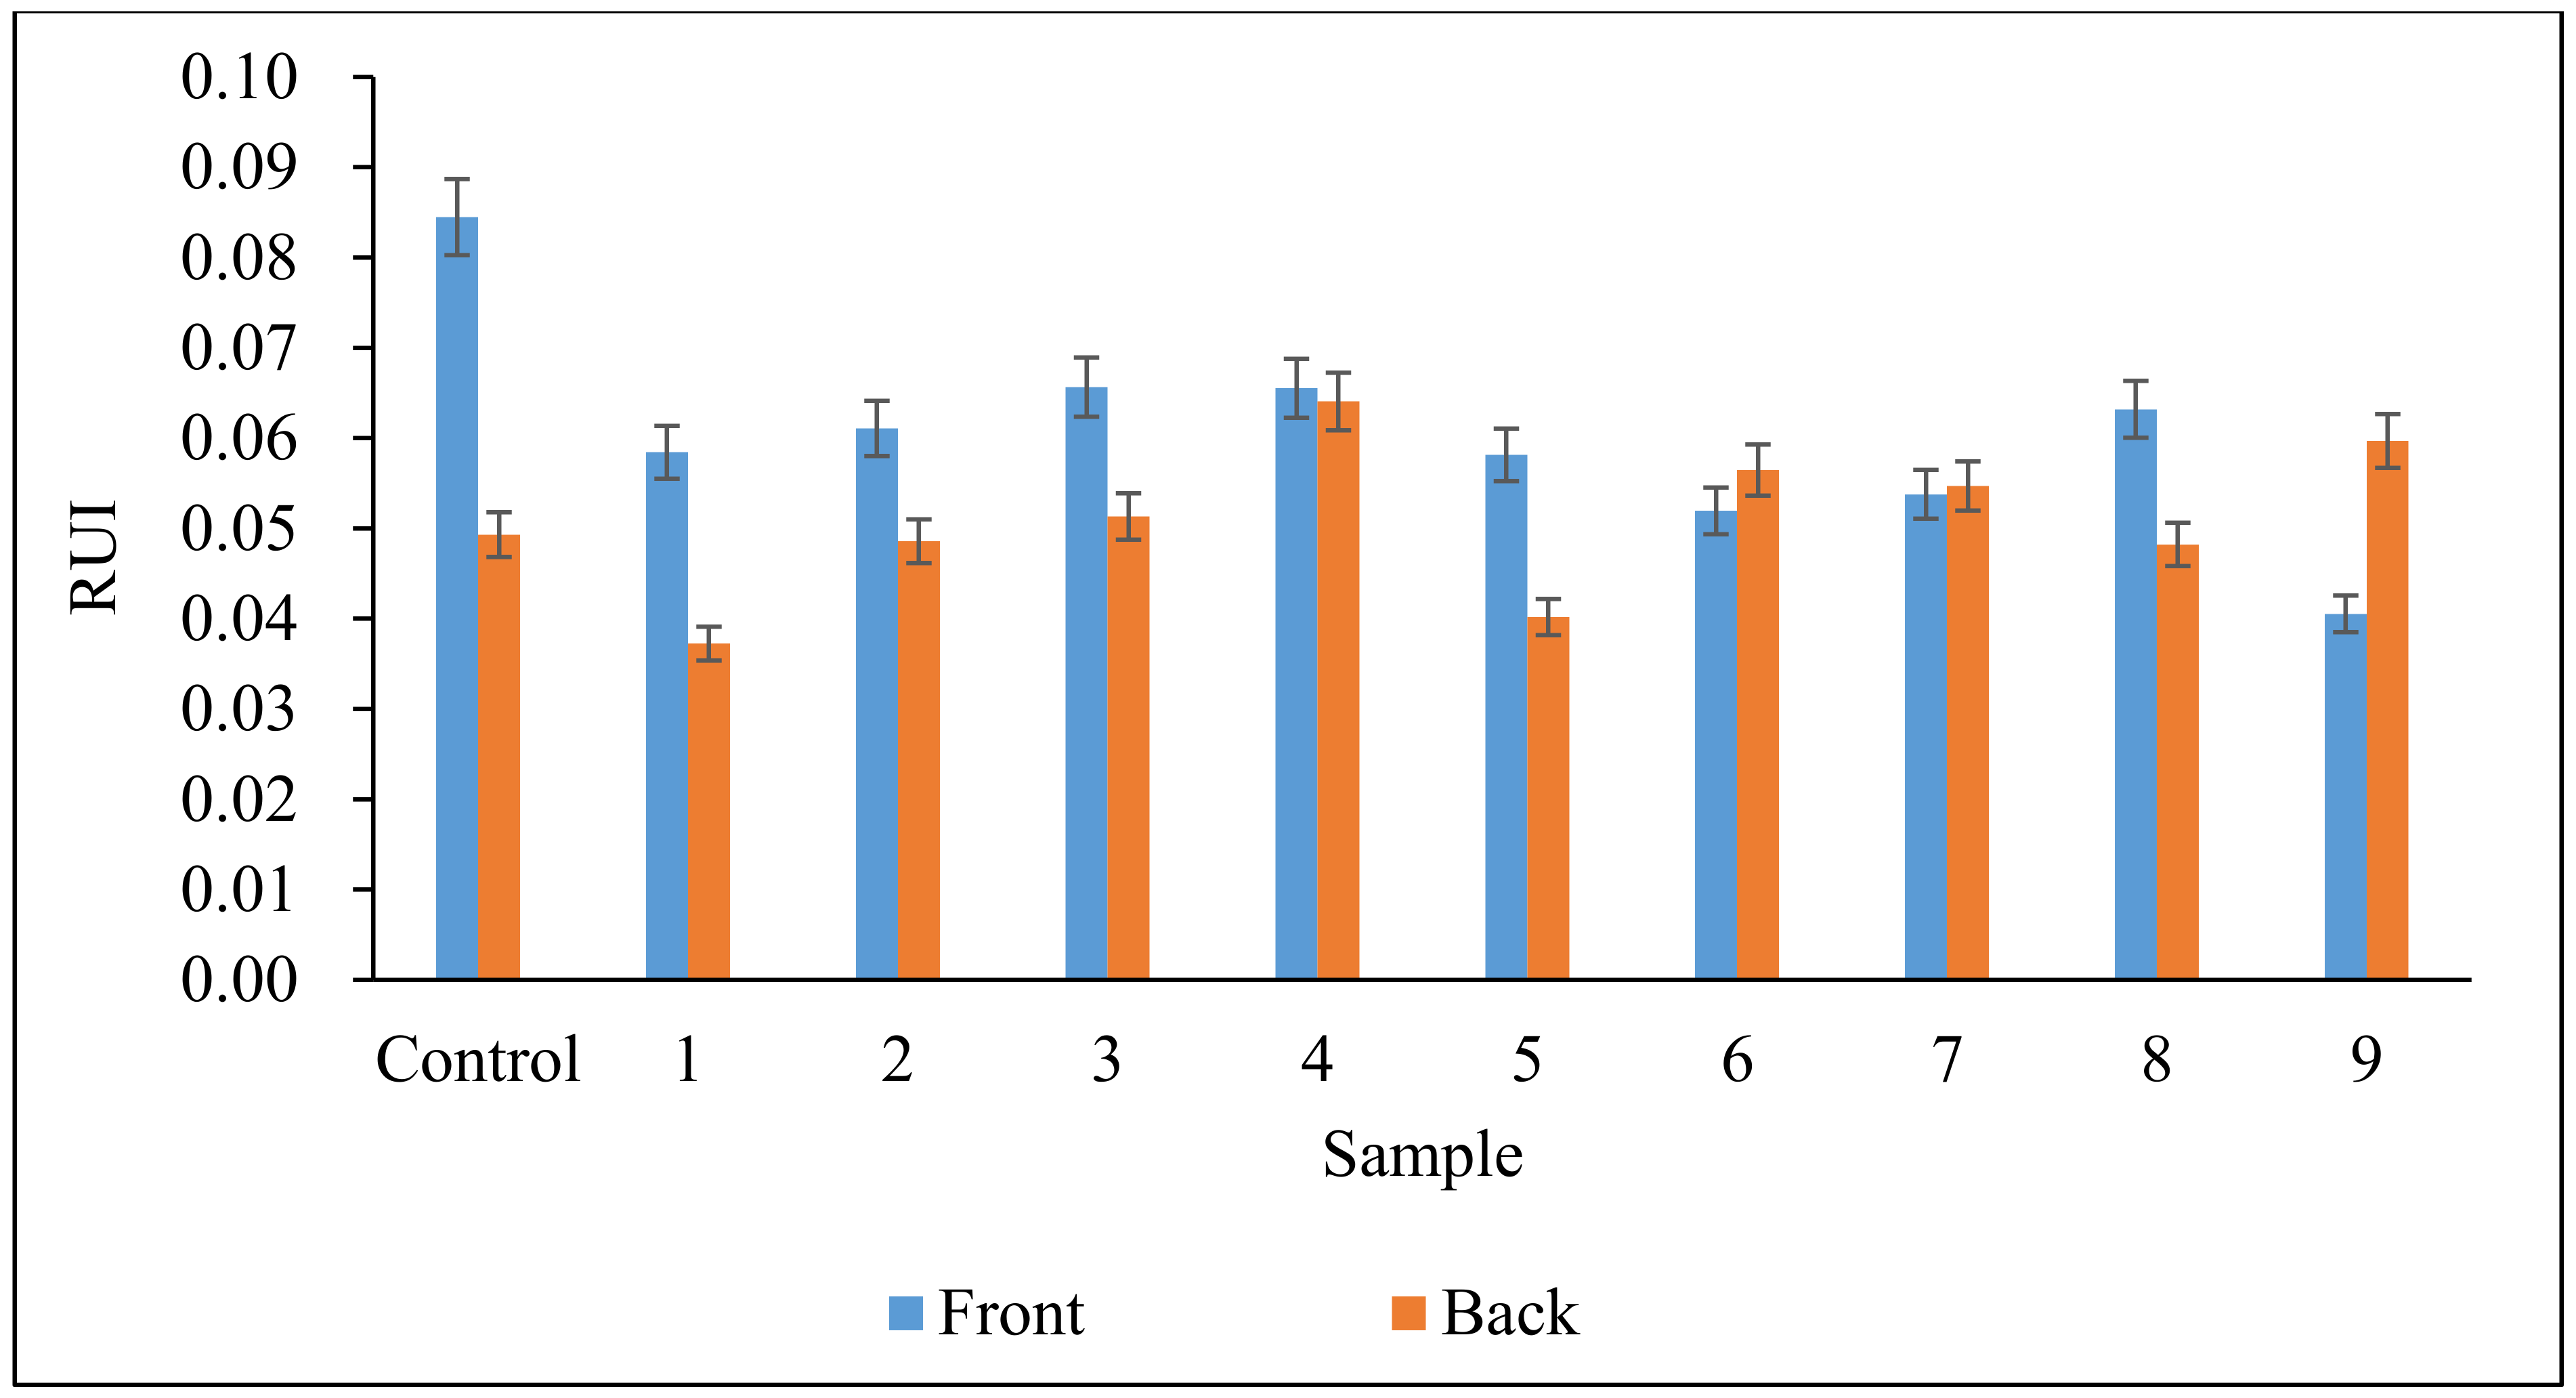
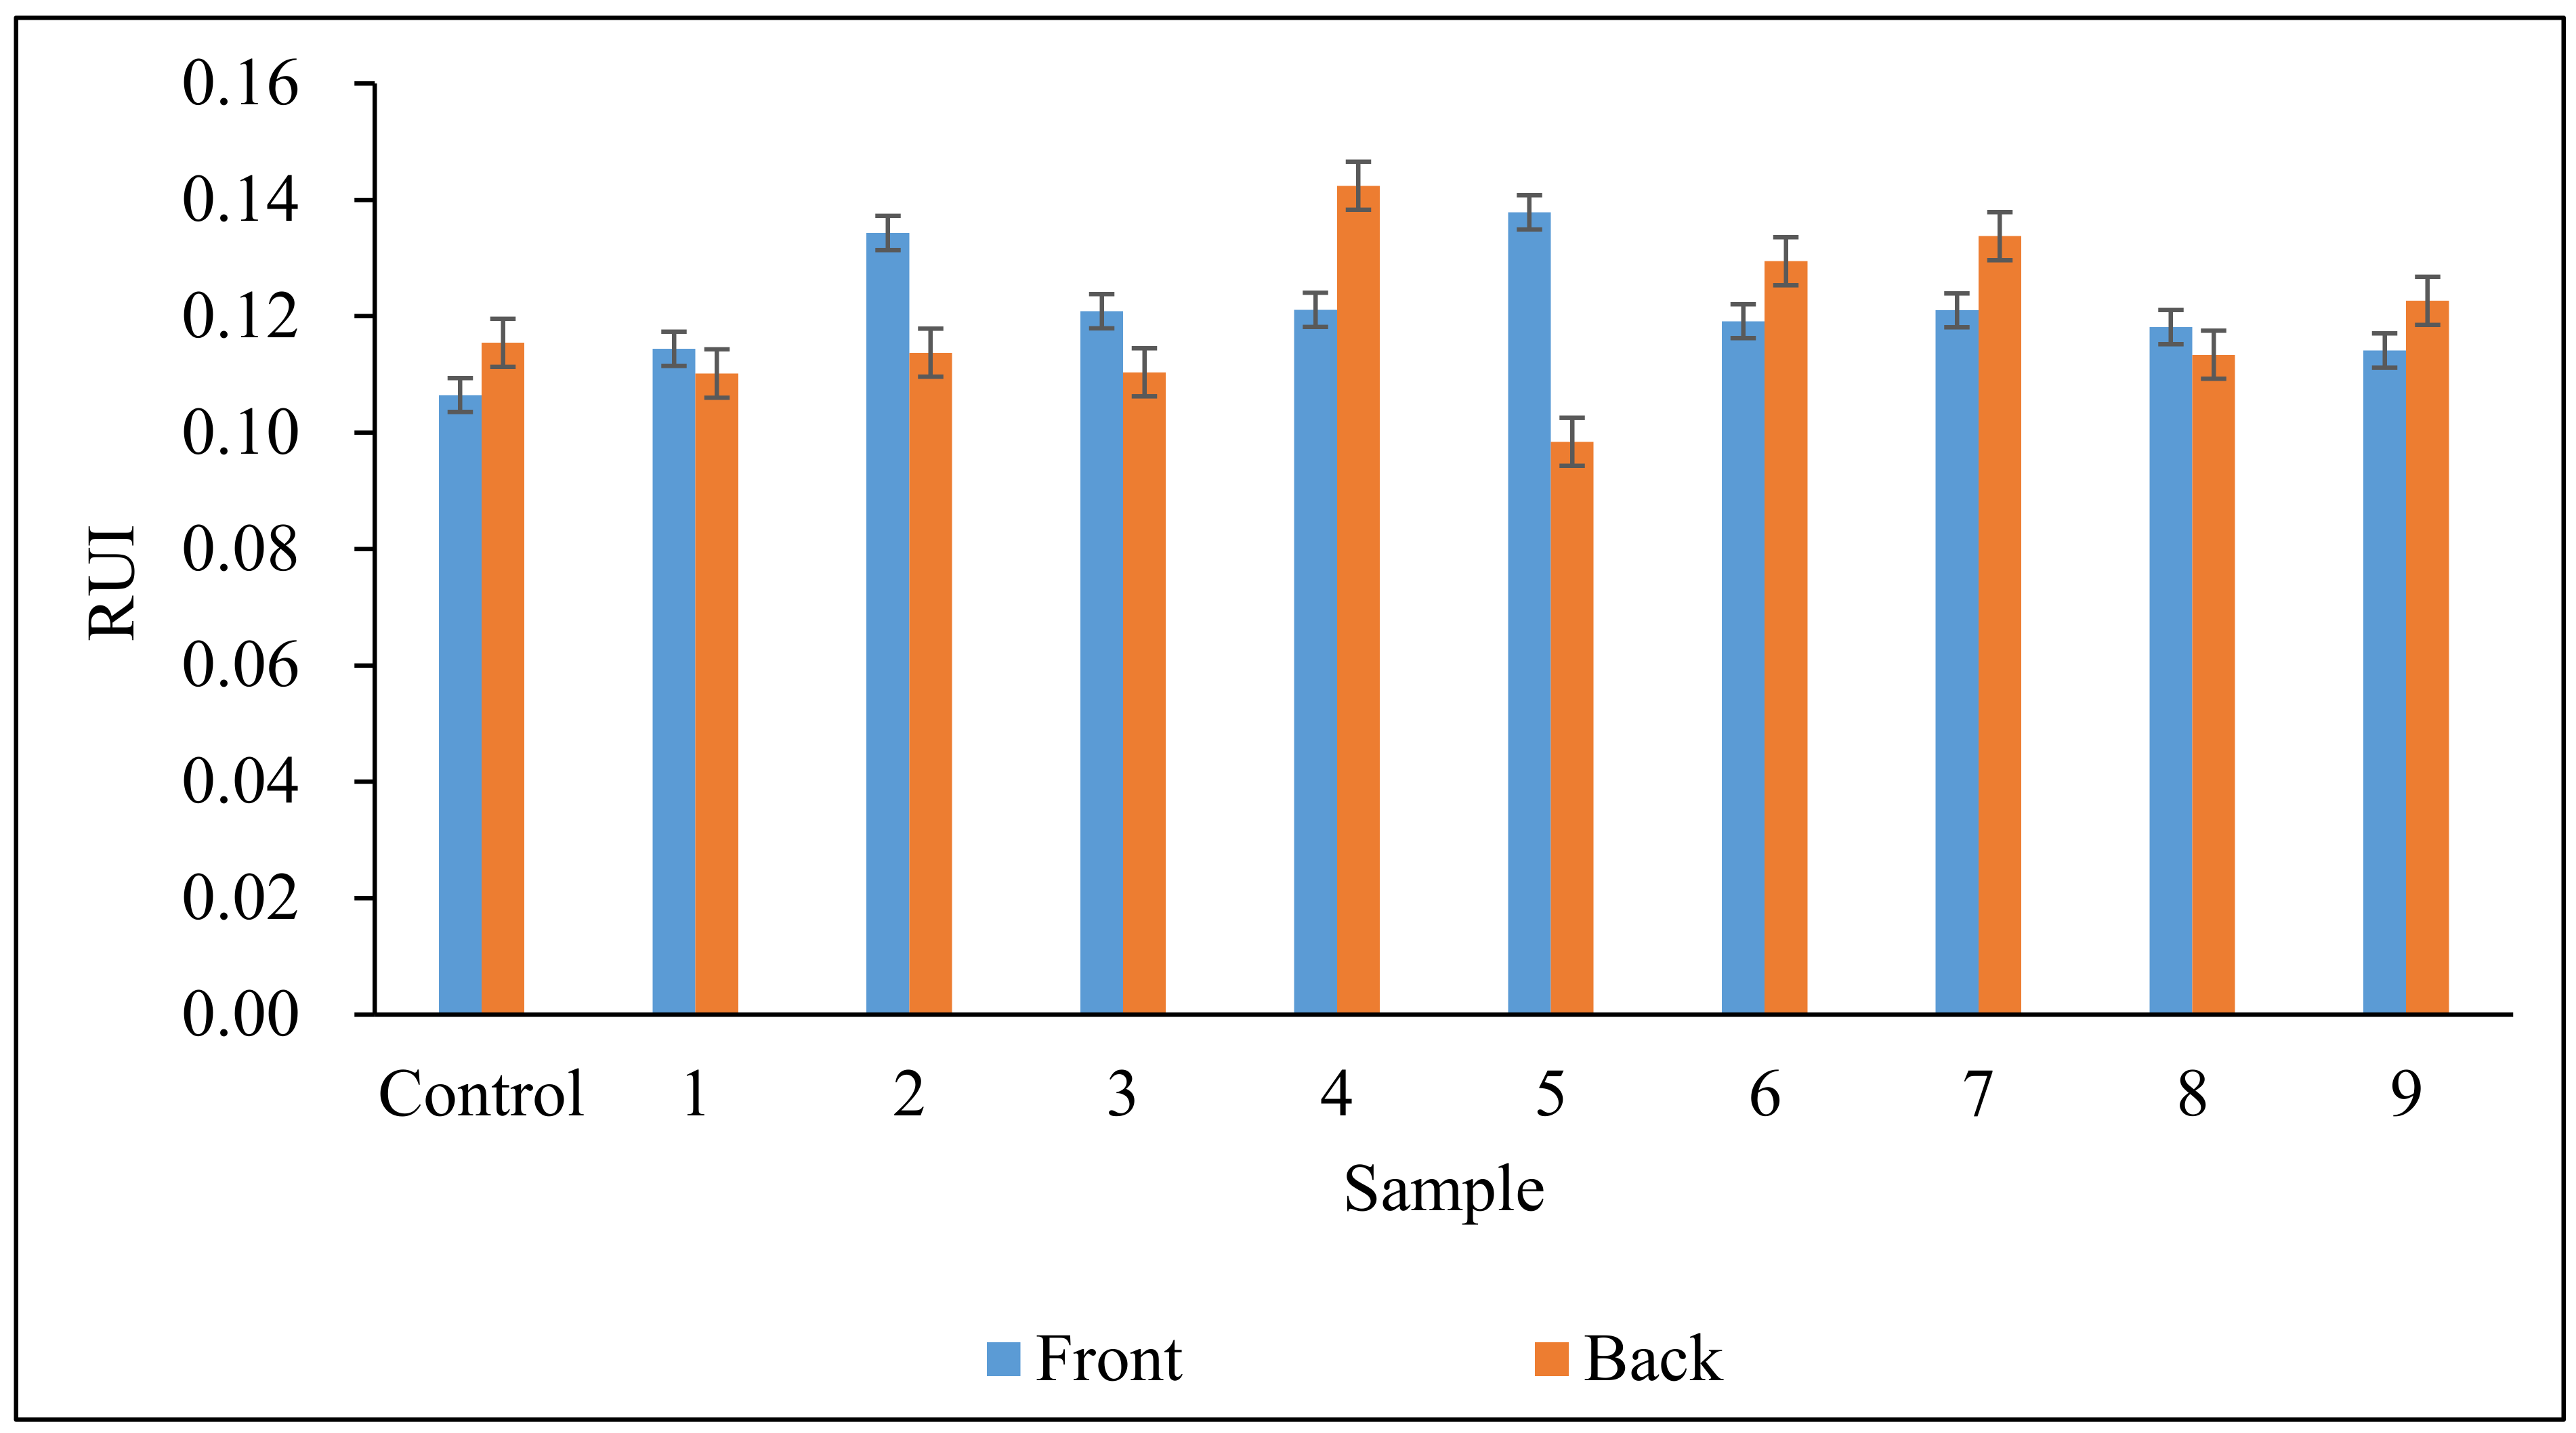
Pigment is insoluble in water, but it disperses well in the dyeing solution. However, pigment particles in the dyeing solution may get aggregated in water medium with binder. Therefore, an unlevelness of colour may occur in pigment-dyed cotton fabric due to pigment aggregation. In normal practice, a dispersing agent is added to the dyeing solution in order to avoid the aggregation of pigment particles. However, in this study, a dispersing agent was not used, because we wanted to not only study the effect of atmospheric pressure plasma treatment on the colour levelness of pigment application to cotton fabric; we also wanted to study the effect of pigment aggregation on the colour levelness of pigment-dyed cotton fabric. The colour levelness of pigment-dyed cotton fabric is expressed as an RUI value; a high RUI value indicates a poor colour levelness of the pigment-dyed cotton fabric.
After atmospheric pressure plasma treatment, the colour levelness of some pigment-dyed samples is improved, but some pigment-dyed samples have serious colour levelness problems. The RUI values of all of the pigment-dyed cotton fabric samples are less than 0.2, which means that all of the pigment-dyed (1 g/L and 5 g/L) cotton fabrics achieved excellent colour levelness in visual appearance. If the RUI values are compared based on the results shown in
Figure 2 and
Figure 3, the colour levelness problem is more serious in 5 g/L pigment-dyed cotton fabric. This may have been due to the high amount of pigment particles in the dyeing solution, which might have possibly caused pigment aggregation and poor migration during the drying process. Even if we treated the pigment-dyeing solution with ultrasound for particle dispersion and distribution, the reduction in effective diameter from 206.0 nm to 199.9 nm (with about 3% reduction) is not significant. The pigment particle aggregation and poor migration during the drying process can lead to a low colour levelness quantitatively.
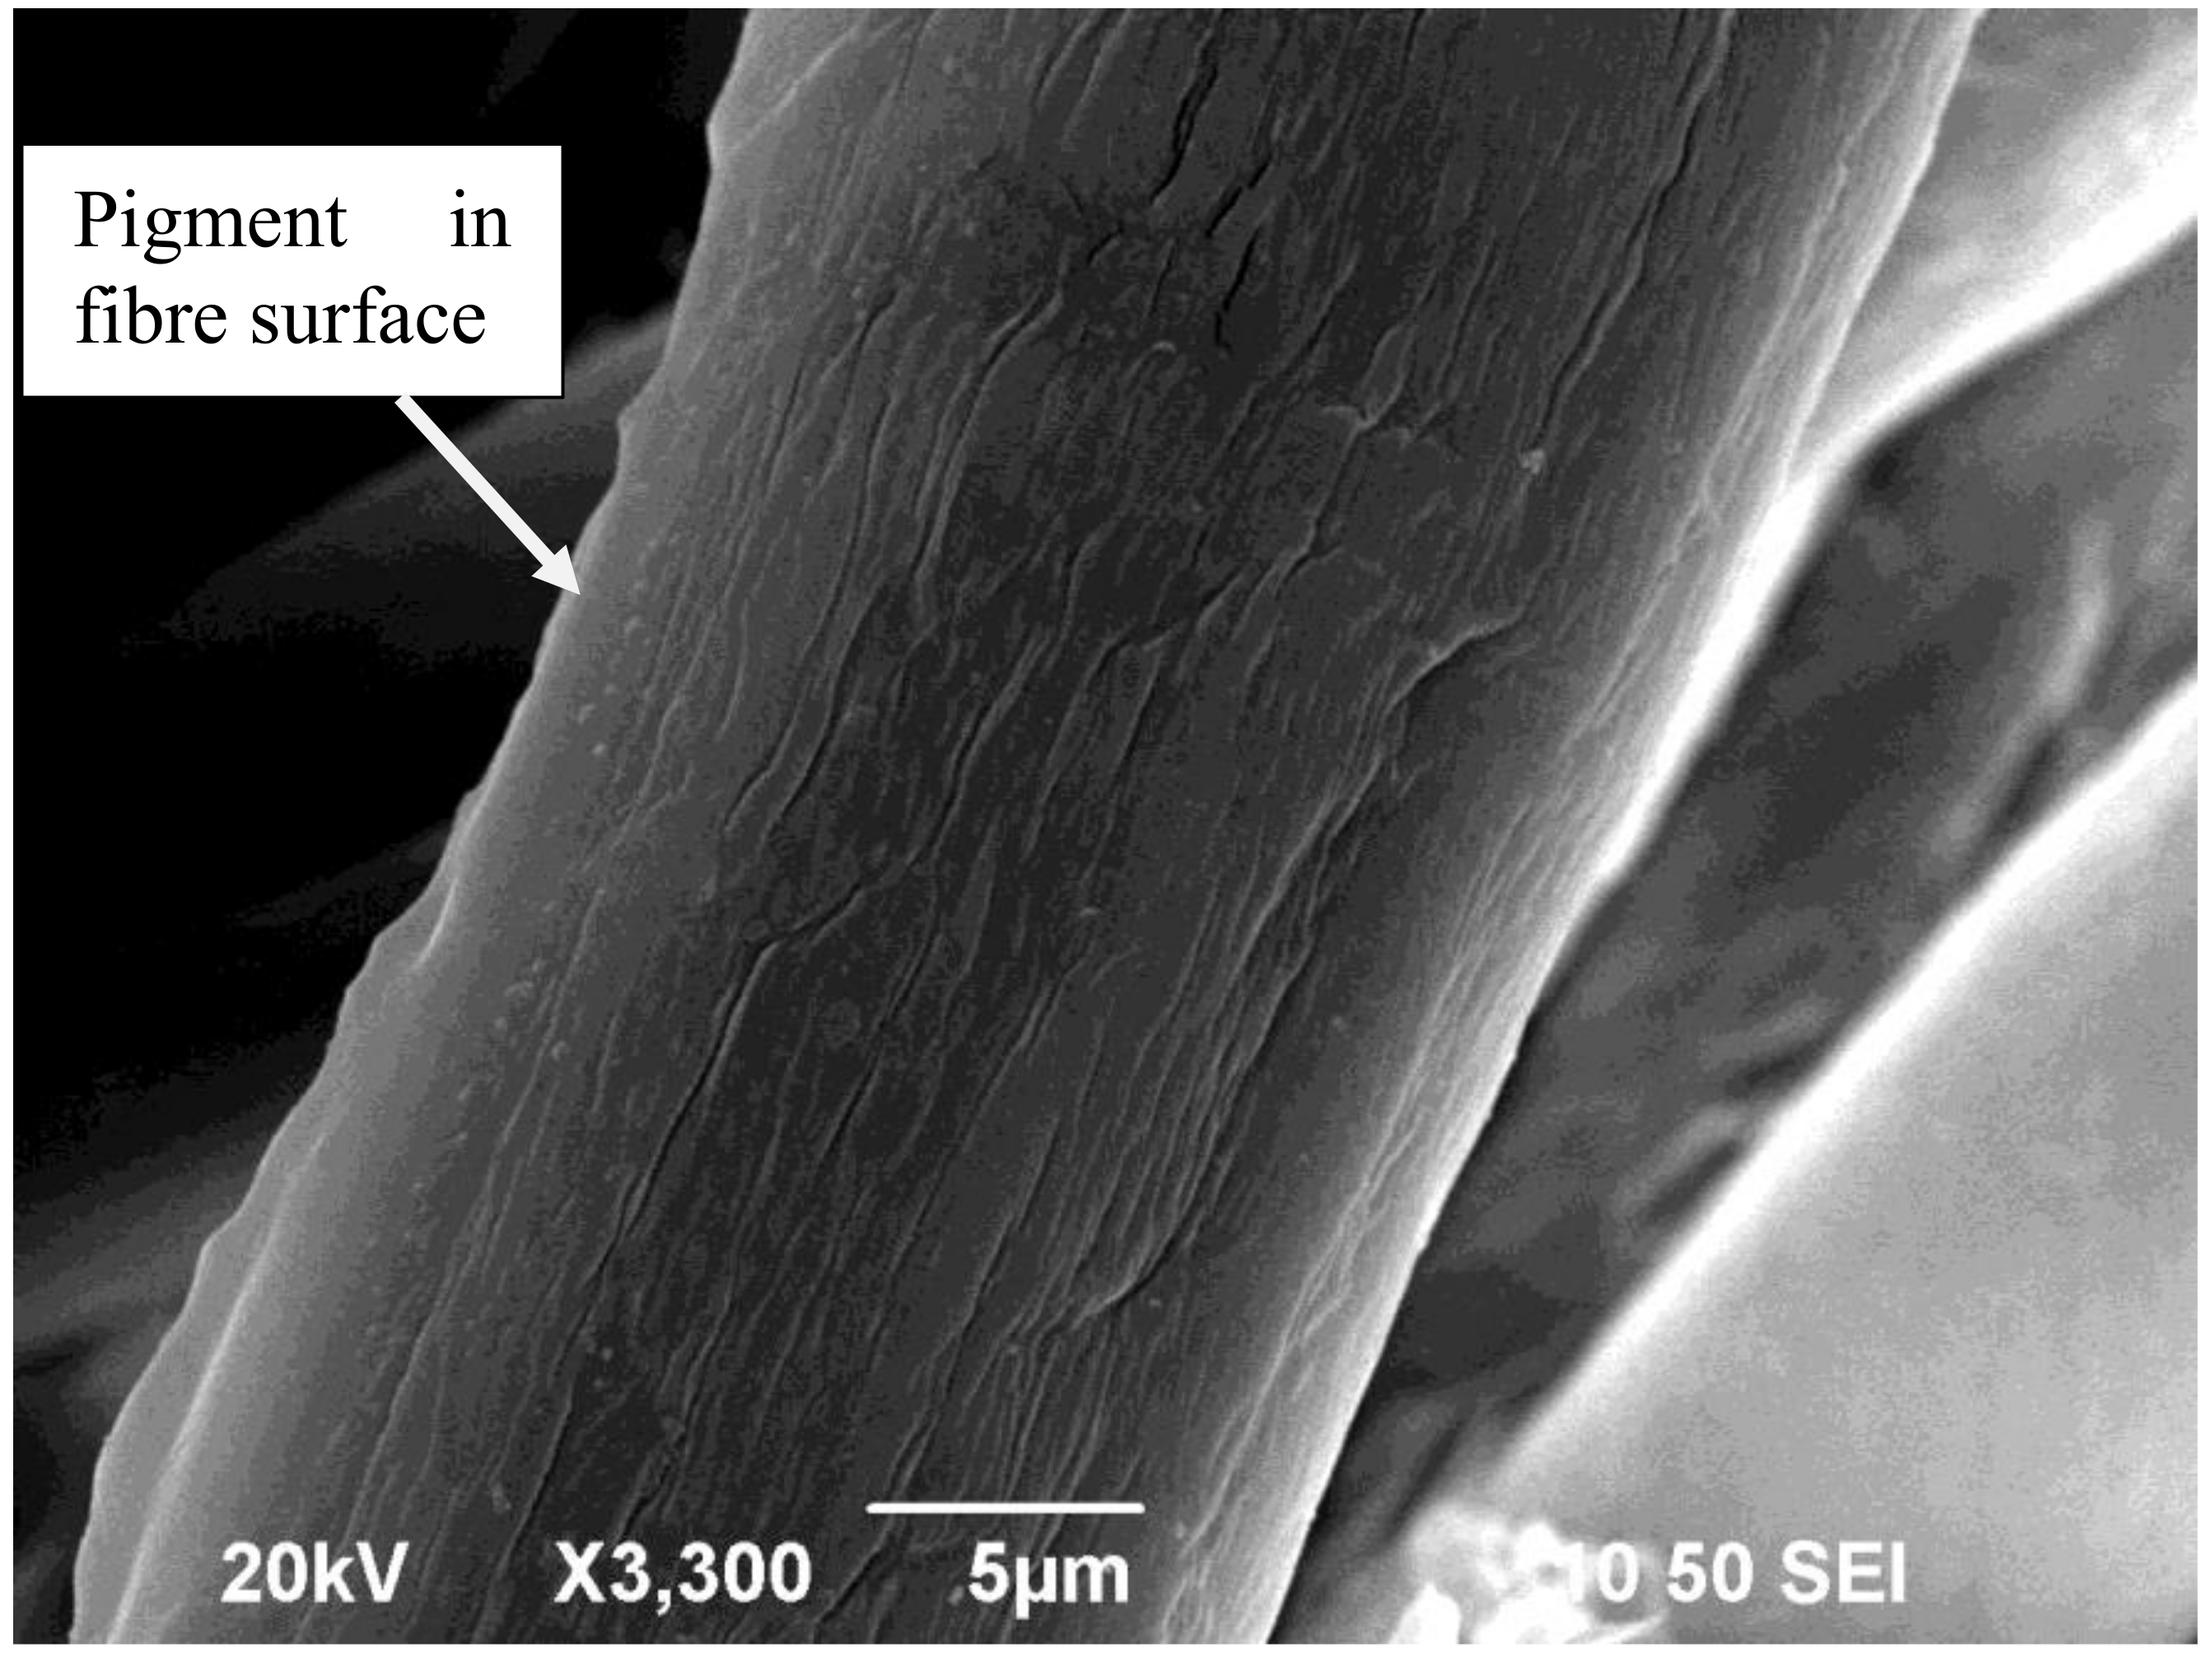
Figure 4 illustrates that pigment particles are aggregated on a fibre surface, and the effective diameters of some pigment particles, for example, are 416.7 nm (circle mark) and 213.0 nm (square mark).
Figure 5 is the SEM image showing that abundant pigment particles are encased by a binder layer on the cotton fibre surface. The uneven distribution of pigment particles on the cotton fibre surface may cause issues regarding an unlevelness of colour. The fluctuation of colour levelness is mainly due to pigment particle migration or aggregation, but not atmospheric pressure plasma treatment.
3.3. Crocking Fastness
The crocking fastness ratings of 1 g/L and 5 g/L pigment-dyed cotton fabrics are shown in
Table 5 and
Table 6, respectively. The pigment-dyed cotton fabrics have good dry crocking fastness. However, in wet crocking conditions, pigment particles can be easily removed by the wet white crocking cloth. When the white crocking cloth (which is made of cotton) was wetted, its cotton fibre got swollen, and thus due to high friction and a large contact area, more mechanical action occurred in the wet crocking operation. Thus, a worse crocking rating was the result of wet crocking. In 5 g/L pigment-dyeing conditions, the binder-to-pigment ratio is 10:1, which is smaller than the ratio in 1 g/L pigment dyeing (30:1). Since fewer binder molecules are allowed to encase pigment particles (10 binder molecules to one pigment particle in the case of a 5 g/L pigment-dyeing solution, versus 30 binder molecules to one pigment particle in the case of a 1 g/L pigment-dyeing solution), the crocking fastness of 5 g/L of pigment-dyed cotton samples is poorer than 1 g/L pigment-dyed cotton samples, especially in wet conditions, because the particles are loosely encased by a binder in the case of 1 g/L of pigment dyeing.
3.4. Dry Cleaning Fastness
The dry-cleaning fastnesses of the pigment-dyed (1 g/L and 5 g/L) cotton fabrics was excellent. The colour change rating of the pigment-dyed (1 g/L and 5 g/L) control cotton fabrics was 4, while the colour change rating of the pigment-dyed (1 g/L and 5 g/L) atmospheric pressure plasma-treated cotton fabrics was 4–5. On the other hand, the colour-staining ratings of the pigment-dyed (1 g/L and 5 g/L) control cotton fabrics in multi-fibre stripes (acetate/cotton/nylon polyester/acrylic/wool) are all 4, but after atmospheric pressure plasma treatment, the ratings of pigment-dyed (1 g/L and 5 g/L) cotton fabrics increased to 4–5. Thus, the atmospheric pressure plasma treatment process can enhance the dry-cleaning fastness of pigment-dyed cotton fabrics.
Generally speaking, pigment dyeing always gives poor dry-cleaning fastness, because pigments are deposited on the fibre surface, and can be detached easily during dry cleaning. In this study, the pigment particles in the pigment-dyeing solution have an effective diameter of 206.0 nm. This pigment particle size can enhance the dry-cleaning fastness (change of shade and staining on multiple fibre stripes) with a rating of 4–5. According to
Figure 6 and
Figure 7, nanosized pigment particles are deposited in the cracks on the atmospheric pressure plasma-treated cotton fibre surface, and are encased in the layer of binder. This enhances the affinity between the binders and the cotton fibre surface, preventing the detachment of particles in the dry-cleaning process.
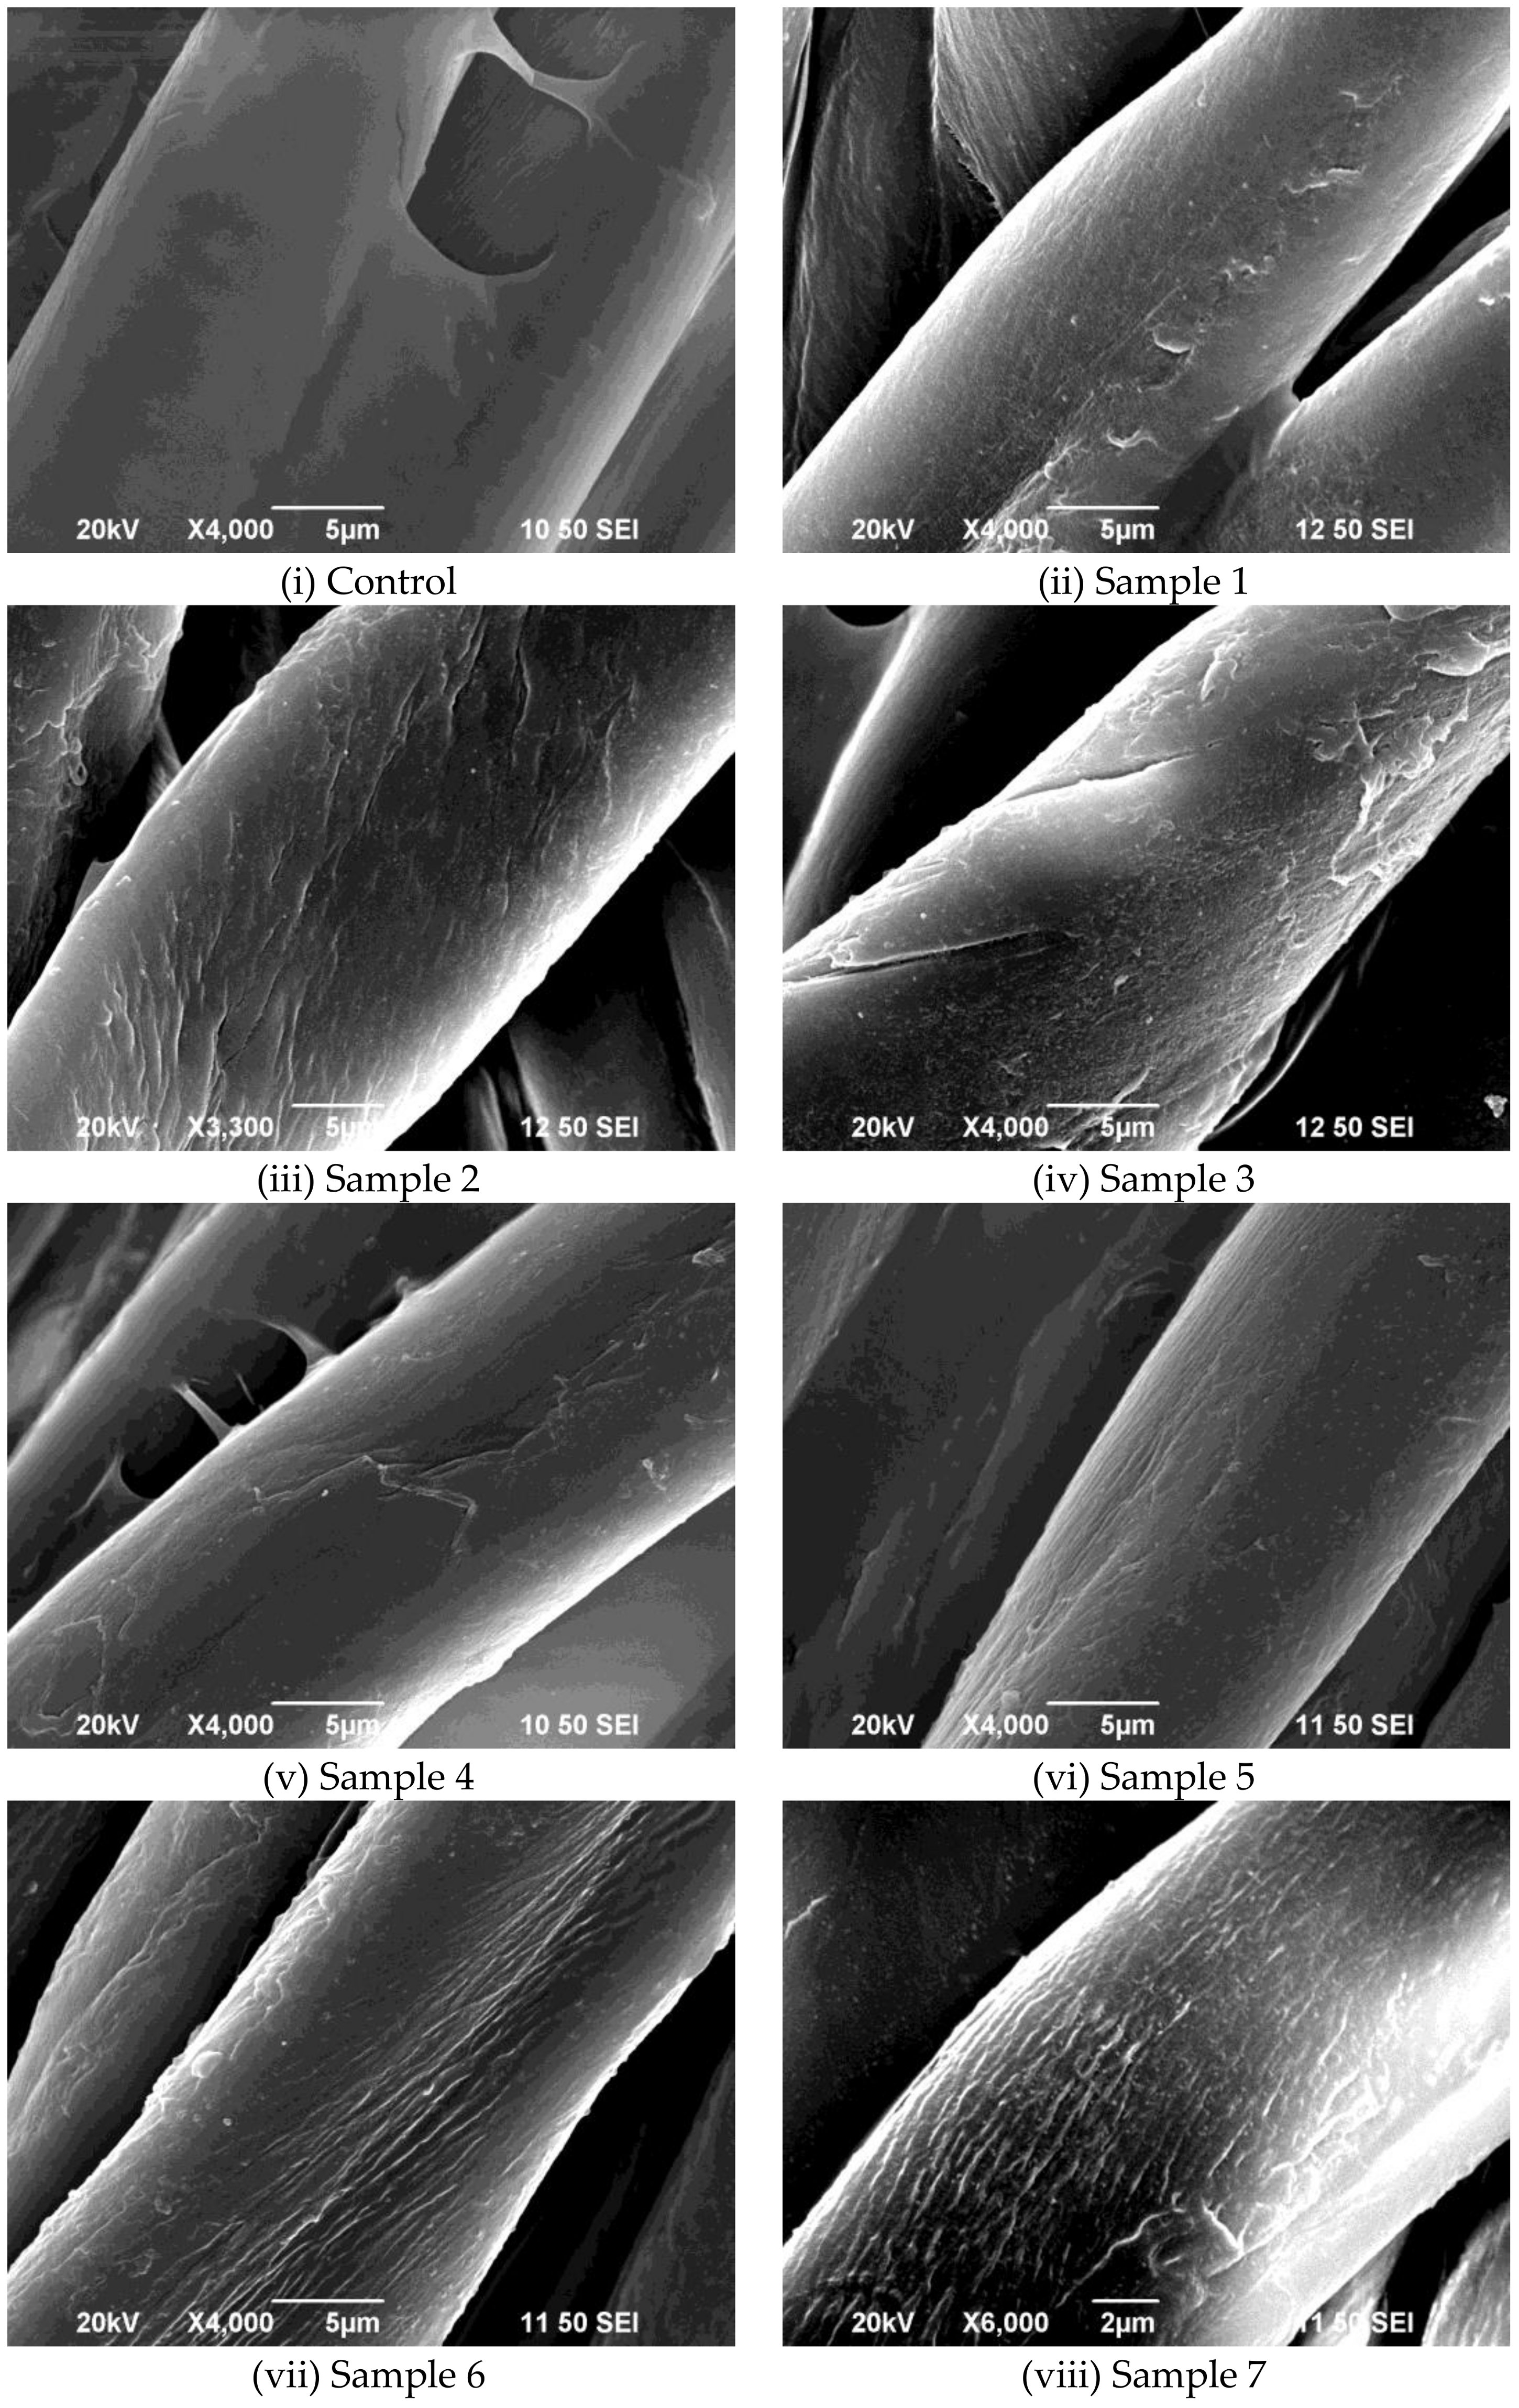
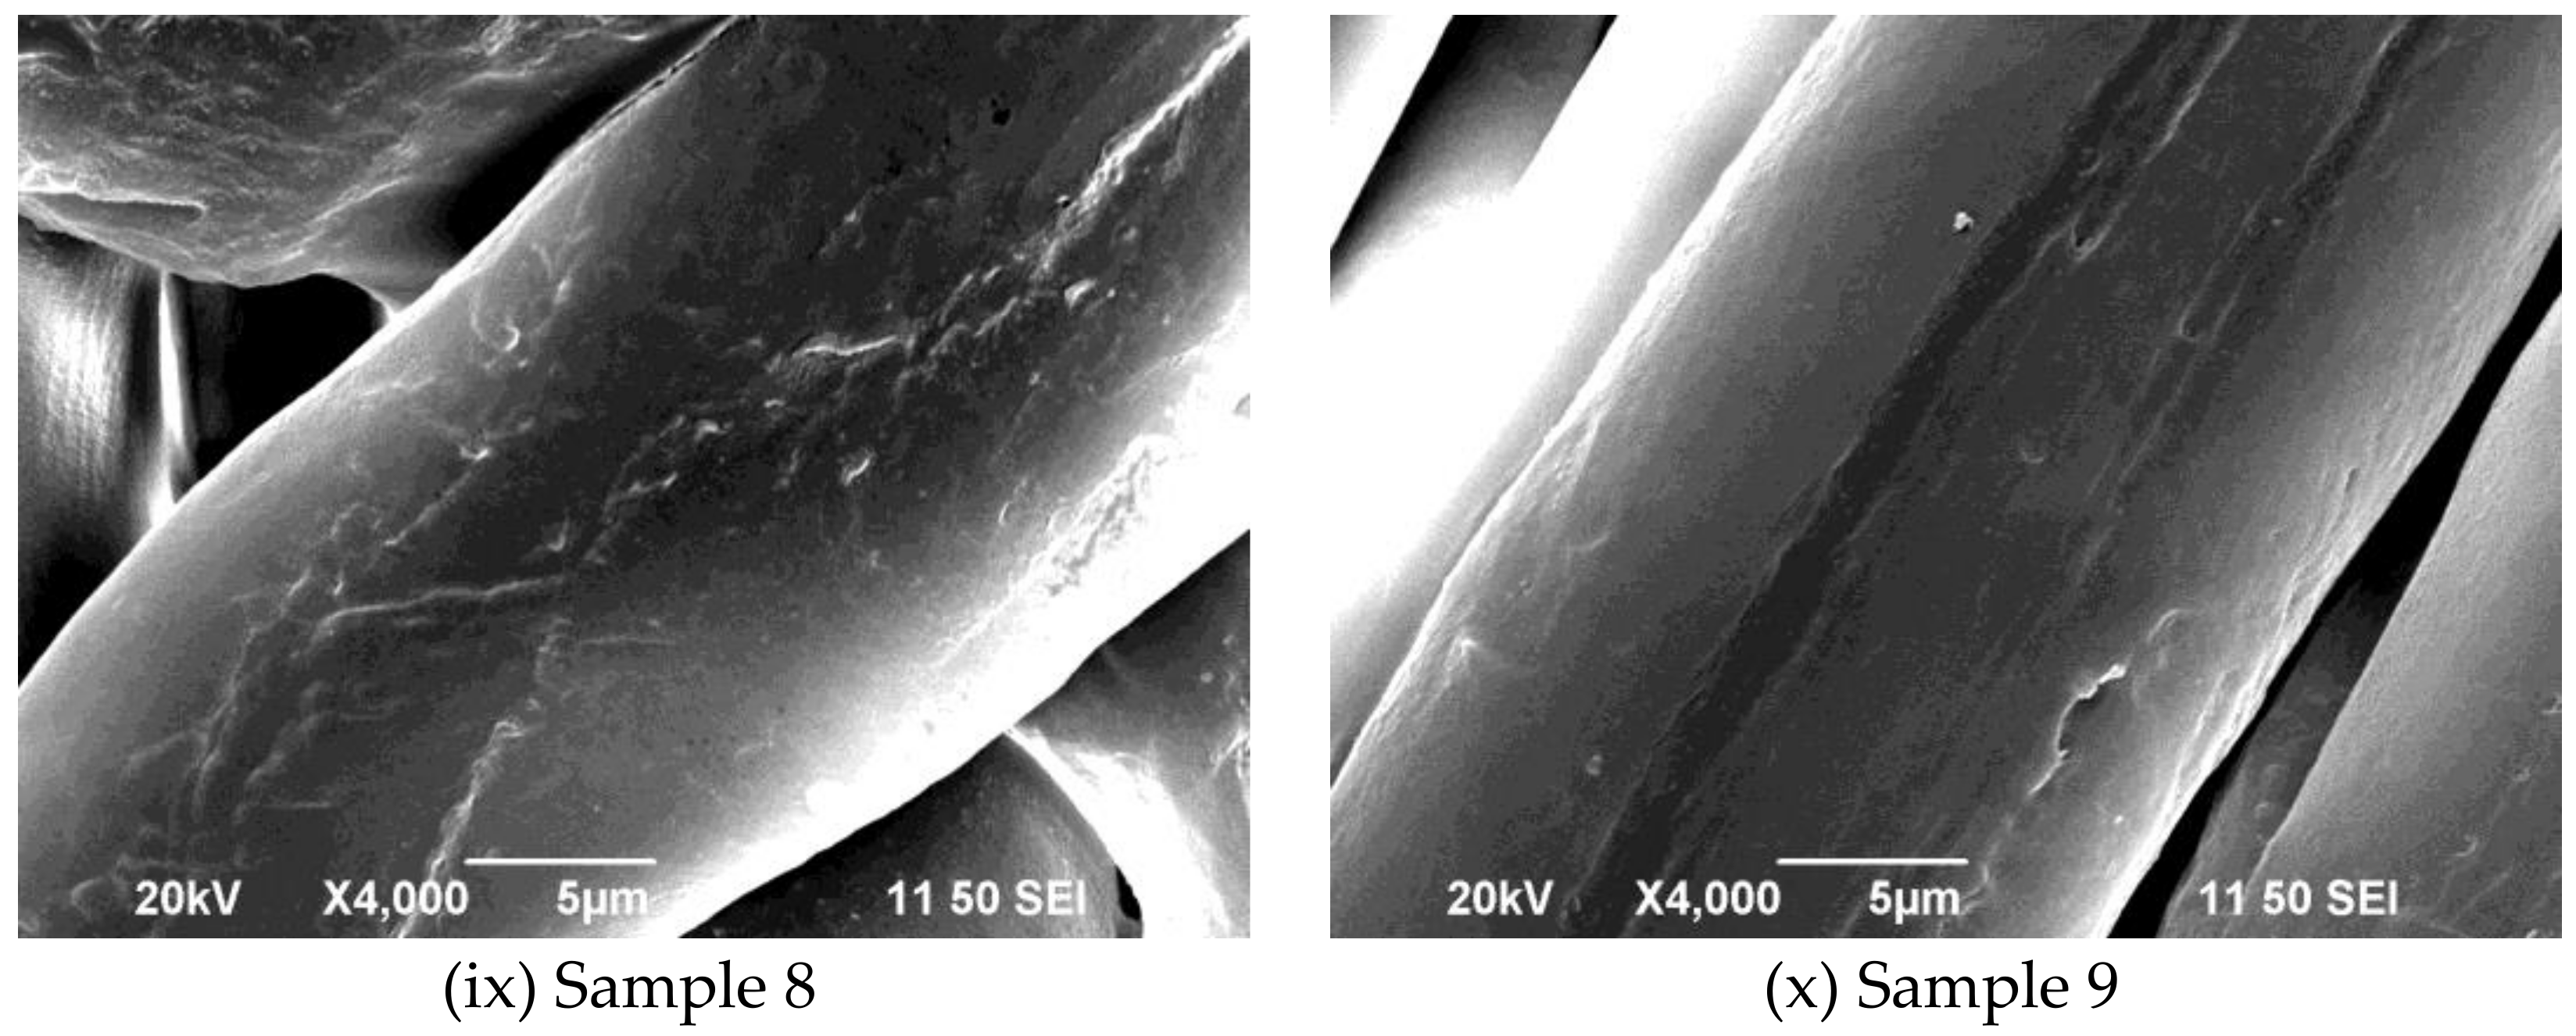
3.5. Scanning Electron Microscopy (SEM)
After dyeing, pigment particles can be clearly observed as deposited on the cotton fibre surface, as shown in
Figure 6 (1 g/L); it can also be seen that the cotton fibre surface is smoothened by the binder layer. Under different combinations of discharge power, oxygen flow rate, and head moving speed, pigment particles are deposited better on an atmospheric pressure plasma-treated cotton fibre surface.
Figure 7 shows the surface morphology of 5 g/L pigment-dyed cotton fabrics, and it is noticed that the cotton fibre surfaces are covered and smoothened by the binder layer. The pigment particles are encased in the binder layer. The fibre morphology, as shown in
Figure 7, can be used for clarifying the results in relation to the colour yield measurement (
Table 4), a high
K/S value achieved in the discharge power of 170W (
Figure 7(iv)), and a head moving speed of 1 mm/s (
Figure 7(viii)).
Figure 7(iv), (vii), and (viii) show that the cotton fibre surface contains a lot of cracks/grooves along the fibre axis, and many pigment particles are encased in the cracks/grooves. As a result, the crocking and dry-cleaning fastness of the pigment-dyed cotton fabric are improved.
3.6. Multiple Linear Regression Analysis
Correlations among the three parameters—(i) discharge power; (ii) oxygen flow rate, and (iii) head moving speed—and the colour yield of the 1g/L and 5g/L pigment-dyed cotton samples are shown in
Table 7. Based on the results in
Table 7 (positive Pearson Correlation value), the level of discharge power and oxygen flow rate have a significant relationship with the colour yield, i.e., increasing the level of discharge power or oxygen flow rate increases the colour yield when pigment concentrations are 1 g/L and 5 g/L.
Table 8 is the ANOVA table that shows the regression models of colour yield, which can be used for predicting the colour yield of the atmospheric pressure plasma-treated cotton fabric (with different discharge powers, oxygen flow rates, and head moving speeds) dyed with a pigment-dyeing concentration of 1 g/L or 5 g/L. The results reveal that the effect of the three atmospheric pressure plasma operations parameters have a significant influence on the colour yield. The significance (based on
F-test results) for the 1 g/L and 5 g/L pigment-dyed colour yield are 0.002 and 0.007 in the 95% confidence interval, respectively.
Table 9 presents the coefficients of the 1 g/L and 5 g/L colour yield models. A multiple regression equation for the 1 g/L and 5 g/L pigment-dyed colour yield predictions can be determined from the linear regression model with different operational parameters ranges, as shown in equations (4) and (5), respectively.
Y1 is the predicted value of the colour yield of 1 g/L yellow pigment-dyed cotton fabric with different inputs for the discharge power, oxygen flow rate, and head moving speed.
Y2 is the predicted value of the colour yield of 5 g/L yellow pigment-dyed cotton fabric with different inputs for the discharge power, oxygen flow rate, and head moving speed.
After having the two linear regression models (Y
1 and Y
2), as shown in Equations (4) and (5), respectively,
Table 10 shows the verification of the two linear regression models (Y
1 and Y
2). It is revealed that the two regression models can provide reliable predictions of colour yield when using the existing range of parameters.


