Article

Pigment Dyeing of Atmospheric Pressure Plasma-Treated Cotton Fabric

Institute of Textiles and Clothing, The Hong Kong Polytechnic University, Hung Hom, Kowloon, Hong Kong, China
*
Author to whom correspondence should be addressed.
Appl. Sci. 2018, 8(4), 552; https://doi.org/10.3390/app8040552
Submission received: 28 February 2018 / Revised: 21 March 2018 / Accepted: 26 March 2018 / Published: 3 April 2018
(This article belongs to the Section Chemical and Molecular Sciences)

Abstract

:
In this work, the effect of atmospheric pressure plasma treatment on improving the application of pigment dyeing in cotton was investigated. The colour-related properties such as (i) colour yield; (ii) colour levelness; (iii) crocking fastness; and (iv) dry-cleaning fastness of the pigment-dyed cotton fabric were determined and evaluated. Atmospheric pressure plasma under different combinations of operational parameters was used for treating 100% ready-for-dyeing cotton fabric. The atmospheric pressure plasma-treated cotton fabric was dyed with yellow pigment by the pad-dyeing method, and the pigment-dyeing solution concentrations were 1 g/L and 5 g/L. Experimental results revealed that colour yield of the yellow pigment-dyed cotton sample improved. The crocking and dry-cleaning fastness properties also improved. In addition, prediction model equations were developed for 1 g/L and 5 g/L pigment dyeing based on multiple linear regression, and the measured colour yield was close to the predicted colour yield.

1. Introduction

The use of pigment dyeing in textile materials is an environmentally-friendly process compared with the application of other dyes, because of the low use of chemicals, as well as the lack of a subsequent steaming and washing-off process [1]. Moreover, the adhesion of pigment in dyeing depends on the properties of the binder used, and thus, the final rubbing fastness is not generally good. In addition, a low uptake in pigment dyeing may occur if pigment application is not properly conducted. Pigment-dyeing performance is greatly dependent on the physical and chemical properties of the binder and the fabric. During pigment dyeing, the pigment solution is absorbed first on the fabric surface through capillary action by the padding process, followed by drying and curing. The size of pigments affects the absorption; the micrometer-sized pigment particles are normally deposited on the fibre surface because their molecular size is too large. Therefore, the pigments are adhered mechanically to the textile material surface by the binder. Since pigment application depends on the surface behaviour of the fibre, surface modification of the textile fibre helps enhance the pigment application. Among different surface modification techniques, plasma technology has been discussed for several decades. Textile materials can be treated with plasma to achieve the least fibre damage, but that can affect the outermost surface in regard to the depth of the nanometer scale. Plasma treatment can modify textile materials and improve properties such as hydrophilicity [2,3,4,5], hydrophobicity [6,7,8], dyeability [9,10,11,12], shrinkage resistance [13,14], and adhesion to different chemical finishing materials [15,16,17]. In the case of dyeing textile materials with pigment, plasma has been proved to enhance the dyeing quality of silk and polyester [18,19,20]. However, the importance of pigment dyeing cotton is increasing in the market, and the effect of atmospheric plasma treatment on the colour quality of pigment dyed cotton fabric has apparently not been examined. This research is expected to benefit cotton apparel manufacturers by providing valuable plasma treatment information related to pigment dyeing. Thus, the aim of this paper is to study the colour quality of pigment-dyed cotton fabric under the influence of different operational parameters of atmospheric pressure plasma treatment.

2. Experimental

2.1. Materials

The material used was 100% ready-for-dyeing plain weave cotton fabric (Lai Tak Enterprises Limited, Hong Kong, China) (Weight = 249 g/m2; Thickness = 0.52 mm). The cotton fabric was immersed in acetone (Tin Hang Technology Limited, Hong Kong, China) (99%, GR Grade) for 5 min to remove oily impurities. The acetone-cleaned cotton fabric was dried completely at 50 °C in an oven. The dried samples were conditioned (relative humidity: 65 ± 2% and temperature: 20 ± 2 °C) for at least 24 h before further experiments.

2.2. Atmospheric Pressure Plasma Treatment of Cotton Fabric

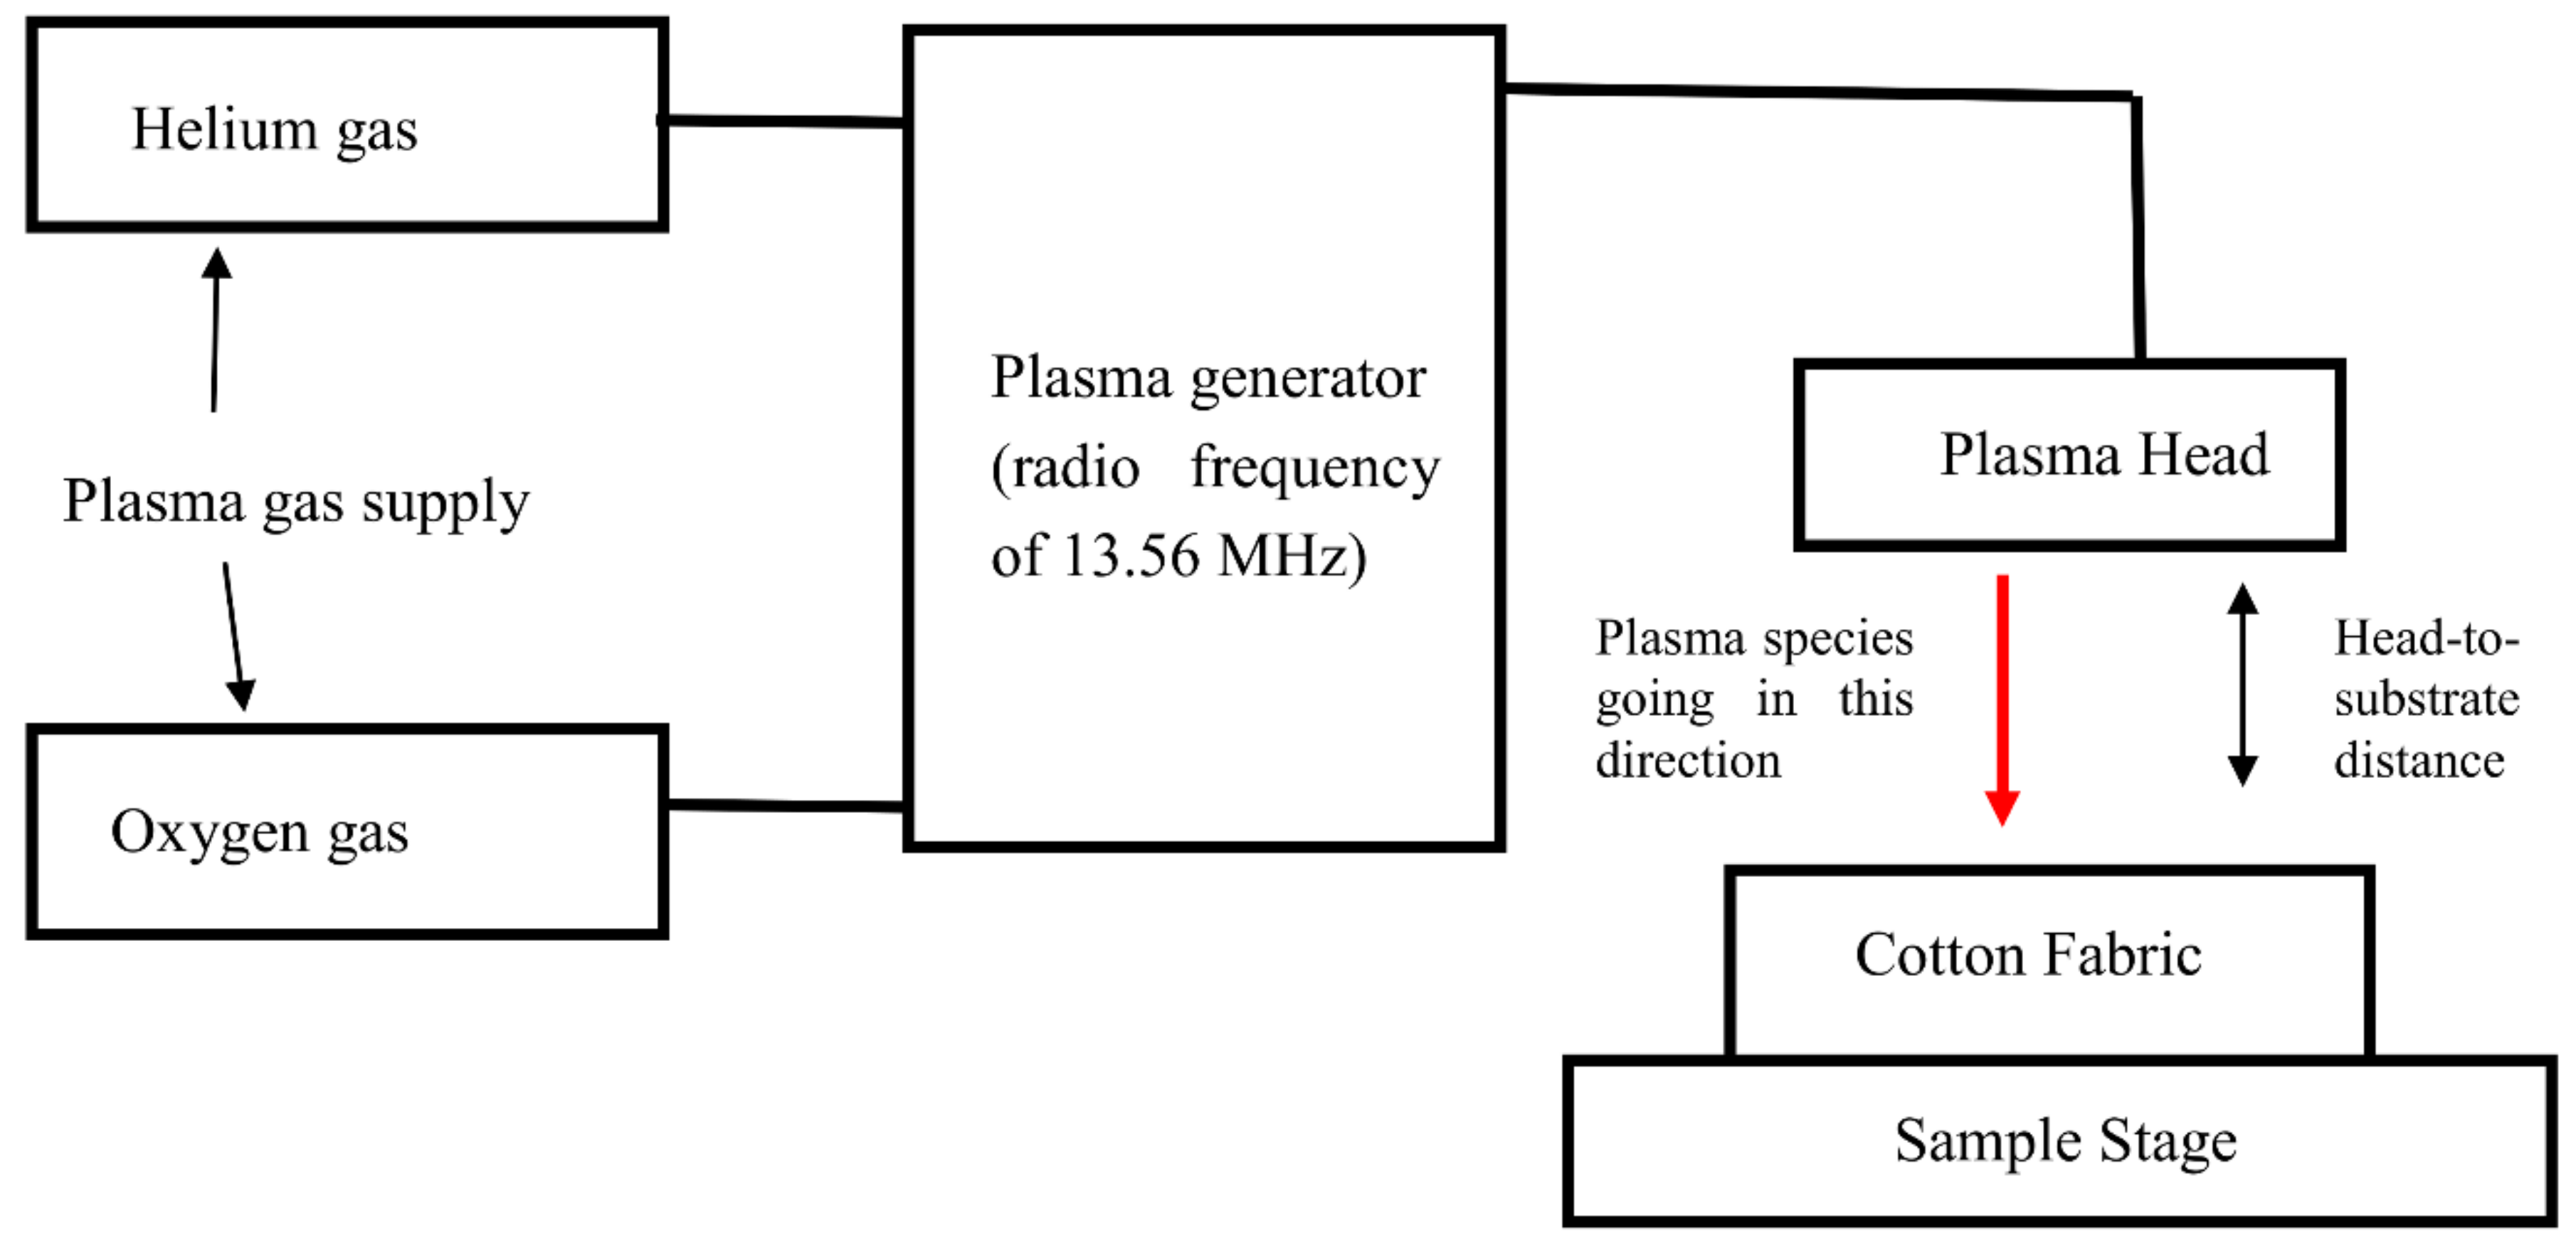
The atmospheric pressure plasma treatment set-up consisted of a (i) gas supply; (ii) plasma generator; (iii) plasma head; and (iv) sample stage [5] (Figure 1). The carrier gas used for plasma treatment was helium (99.995% purity), and oxygen (99.7% purity) was used as the reactive gas. The flow rate of helium was kept at 30 L/min, while that of the reactive gas was varied, according to Table 1. The plasma is generated at a radio frequency of 13.56 MHz in the plasma generator (Atomflo 400, Surfx Technologies LLC, Redondo Beach, CA, USA). A plasma head (AH-500L, Surfx Technologies LLC, Redondo Beach, CA, USA) was connected to the plasma generator vertically above the cotton fabric, such that the active plasma species could interact with the cotton fabric. The cotton fabric was stationed in a sample stage, and the plasma head was moved at varying speeds (Table 1). Three plasma operational parameters: discharge power, the flow rate of oxygen, and the head moving speed were varied in different combinations (Table 1). The head-to-substrate distance was kept at 3 mm. After atmospheric pressure plasma treatment, the cotton fabric was stored in standard condition (20 ± 2 °C and 65 ± 2% relative humidity) for 24 h before pigment dyeing.

2.3. Pigment Dyeing

For pigment dyeing, a pad-dry-cure process was used. Yellow pigment (Printofix T-C Yellow, provided by Clariant, Shanghai, China) and binder (Printofix Binder MTB-01, provided by Clariant, Shanghai, China) were mixed with deionized water according to the mixing ratio in Table 2 to prepare a yellow pigment-dyeing solution with concentrations of 1 g/L and 5 g/L. After preparing the pigment-dyeing solution, it was thoroughly mixed ultrasonically for 30 s to ensure complete mixing. The pigment-dyeing solution was applied to a cotton fabric by pad (70% wet pick-up) → dry (90 °C, 3 min) → cure (145 °C, 5 min) process. After pigment dyeing, the cotton fabrics were conditioned (relative humidity: 65 ± 2% and temperature: 20 ± 2 °C) for 24 h prior to evaluation.

2.4. Colour Yield

Reflectance values of pigment-dyed cotton fabric were measured at 590 nm (λmaximum) by a spectrophotometer (Macbeth Color-Eye 7000A, Datacolor, Hong Kong, China). The reflectance measuring condition was illuminant D65 with a 10° standard observer. In order to ensure complete opacity for colour yield measurements, the pigment-dyed cotton fabric was folded four times. Eight reflectance measurements were conducted for each sample so as to collect more accurate results. The reflectance value was then converted into K/S values according to the Kubelka–Munk function as shown in Equation (1) in order to evaluate the uptake (colour yield) of the pigment dye.
K S = ( 1     R ) 2 2 R
where
  • K is the absorption coefficient of the colourant;
  • S is the scattering coefficient of the dyed substrate; and
  • R (R = %R/100) is the reflectance of the coloured sample.
Generally speaking, the higher the K/S value of the measured sample, the better the uptake (colour yield) of the pigment-dyed cotton fabric.

2.5. Colour Levelness

The colour levelness of the cotton fabric dyed with pigment was assessed instrumentally in order to obtain a quantitative term of the relative unlevelness index (RUI) [9,10,21,22]. Reflectance values at eight different points on the pigment-dyed cotton fabric were measured by spectrophotometer (Macbeth Color-Eye 7000A) with illuminant D65 and a 10° standard observer within the visible spectrum (400 nm to 700 nm). RUI values of the pigment-dyed fabric sample were calculated by Equations (2) and (3) [9,10,21,22].
S λ =   i = 1 n ( R i R m ) 2 n 1
where
  • Sλ is the standard deviation of the reflectance values;
  • Ri is the reflectance value of the ith measurement for each wavelength; and
  • Rm is the mean of the reflectance values of m measurements for each wavelength [9,10,21,22].
R U I =   400 700 C λ   V λ     =   400 700 S λ R   V λ
where
  • Vλ is the photopic relative luminous efficiency function.
Using Equation (3), the degree of colour levelness of a dyed sample can be described in accordance with the calculated RUI value. Table 3 summarises the interpretations of RUI values [21].

2.6. Colourfastness

The colourfastness of the pigment-dyed cotton fabrics after crocking was assessed by the AATCC Test Method 8-2016 (Colourfastness to Crocking: Crockmeter Method). The colourfastness of pigment-dyed cotton fabrics after dry cleaning was assessed by AATCC Test Method 132-2013.

2.7. Particles Size Measurement

The effective diameters of the pigments were measured by a particle size analyzer (Zeta Potential Analyzer, Brookhaven Instruments Corporation, Holtsville, NY, USA). In the particle size measurement, the original pigment size and the ultrasound-treated pigment size were measured and compared. In the original pigment size measurement, before the particle size measurements, the pigment-dyeing solution was mixed thoroughly by ultrasound for 30 s. For the measurement of ultrasound-treated pigment size, the ultrasound-treated pigment-dyeing solution was placed in a water bath for 20 min before particle size measurement. In order to maintain a good accuracy of results, 10 measurements were conducted for each sample.

2.8. Scanning Electron Microscopy (SEM)

A scanning electron microscope (SEM, JSM-6490, JEOL Ltd., Tokyo, Japan) was used for evaluating the surface features of the cotton fibre.

2.9. Multiple Linear Regression

In order to statistically study the influence of atmospheric pressure plasma operational parameters on the colour yield of pigment dyeing, multiple linear regression was used for investigating their relationships, and a regression equation is provided after the analysis.

3. Results and Discussion

Since the pigment-dyeing process is based on the interaction between the pigment and the fabric surface, the particle size of the pigment may affect the dyeing results. The original particle size of the pigment was an effective diameter of 206.0 nm. After ultrasound treatment, the effective diameter of the pigment was 199.9 nm. The difference in the effective diameters of the pigment before and after the ultrasound process is not significant. Thus, no additional dispersing process is required to avoid the aggregation of pigment particles during the pigment-dyeing process.

3.1. Colour Yield

Table 4 shows the colour yield (expressed as K/S value) of cotton fabrics dyed with pigment concentrations of 1 g/L and 5 g/L, respectively. Samples 1 to 9 represent cotton fabric treated with atmospheric pressure plasma with different combinations of operational parameters (Table 1). It is noted that the K/S values of the atmospheric pressure plasma-treated cotton fabric are higher than untreated cotton fabric (i.e., control), which indicates more pigment particles in the atmospheric pressure plasma-treated cotton fabrics than in the untreated cotton fabric. Since atmospheric pressure plasma treatment can improve the water absorption ability of cotton fabric by inserting oxygen-containing functional groups and generating cracks/grooves in the fibre surface [9,10], both chemical and physical surface modifications facilitate pigment absorption in the atmospheric pressure plasma-treated cotton fabric. As a result, a better colour yield was obtained in the atmospheric pressure plasma-treated cotton fabric than in the untreated control cotton fabric.
In Table 4, the K/S values of 1 g/L of pigment-dyed cotton fabrics were not significantly affected in relation to the discharge power (130 W to 170 W). Conversely, in the case of 5 g/L, the K/S values of 5 g/L pigment-dyed cotton fabrics had a positive relationship with the discharge power (Table 4). Under the influence of atmospheric pressure plasma treatment, the cotton fibre surface can be modified by generating oxygen-containing functional groups (which are hydrophilic in nature) and cracks/grooves along the fibre axis [9,10]. Generally speaking, the discharge power at a high level can produce deep cracks/grooves along the fibre axis, because a high discharge power implies a high active species formation rate [10,23]. With the increasing of level of discharge power from 130 W to 170 W, deep cracks/groves are generated in the cotton fibre surface, and hence, more space is provided for accommodating the pigment particles. This makes the pigment-dyeing solution diffuse at a faster rate along the fibre axis for enhancing pigment absorption, resulting in an increased colour yield.
In the case of the oxygen flow rate, it is noted that the oxygen gas used can contribute an active plasma species for enhancing surface etching and the oxidizing effect [2,3,4]. After atmospheric pressure plasma treatment, the newly inserted oxygen-containing groups (e.g., –OH and –C–O) in the cotton fibre surface are capable of forming more hydrogen bonds with water molecules [10]; then, the pigment-dyeing solution absorption is enhanced as a result. However, based on the K/S values of samples 3 to 6, there is no obvious relationship between colour yield and the oxygen flow rate, although samples 3 to 6 did achieve a better colour yield than the untreated cotton fabric. To conclude, the increase in the K/S values of the atmospheric pressure plasma-treated cotton fabrics is influenced by the combined effect of both discharge power and the oxygen flow rate. The increase in the K/S values of the atmospheric pressure plasma-treated cotton fabric is mainly due to the formation of cracks/grooves in the fibre surface.
As shown in Table 4, an increase in the head moving speed (Samples 7 to 9) shows a negative effect on the colour yield of the yellow pigment-dyeing application (1 g/L and 5 g/L). When the head moving speed is kept at 1mm/s, the K/S value is the highest (Sample 7). In the case of Sample 7, the slow head moving speed of 1mm/s means that the active plasma species can accumulate on the fabric surface with more time. Thus, an adequate amount of time is provided for surface interaction [23], and continuous cracks/grooves along fibre axis are more observable in the case of the slow head moving speed [23]. As a result, the pigment-dyeing solution absorption is enhanced by the cracks/grooves along the fibre axis due to great capillary action.

3.2. Colour Levelness

Pigment is insoluble in water, but it disperses well in the dyeing solution. However, pigment particles in the dyeing solution may get aggregated in water medium with binder. Therefore, an unlevelness of colour may occur in pigment-dyed cotton fabric due to pigment aggregation. In normal practice, a dispersing agent is added to the dyeing solution in order to avoid the aggregation of pigment particles. However, in this study, a dispersing agent was not used, because we wanted to not only study the effect of atmospheric pressure plasma treatment on the colour levelness of pigment application to cotton fabric; we also wanted to study the effect of pigment aggregation on the colour levelness of pigment-dyed cotton fabric. The colour levelness of pigment-dyed cotton fabric is expressed as an RUI value; a high RUI value indicates a poor colour levelness of the pigment-dyed cotton fabric.
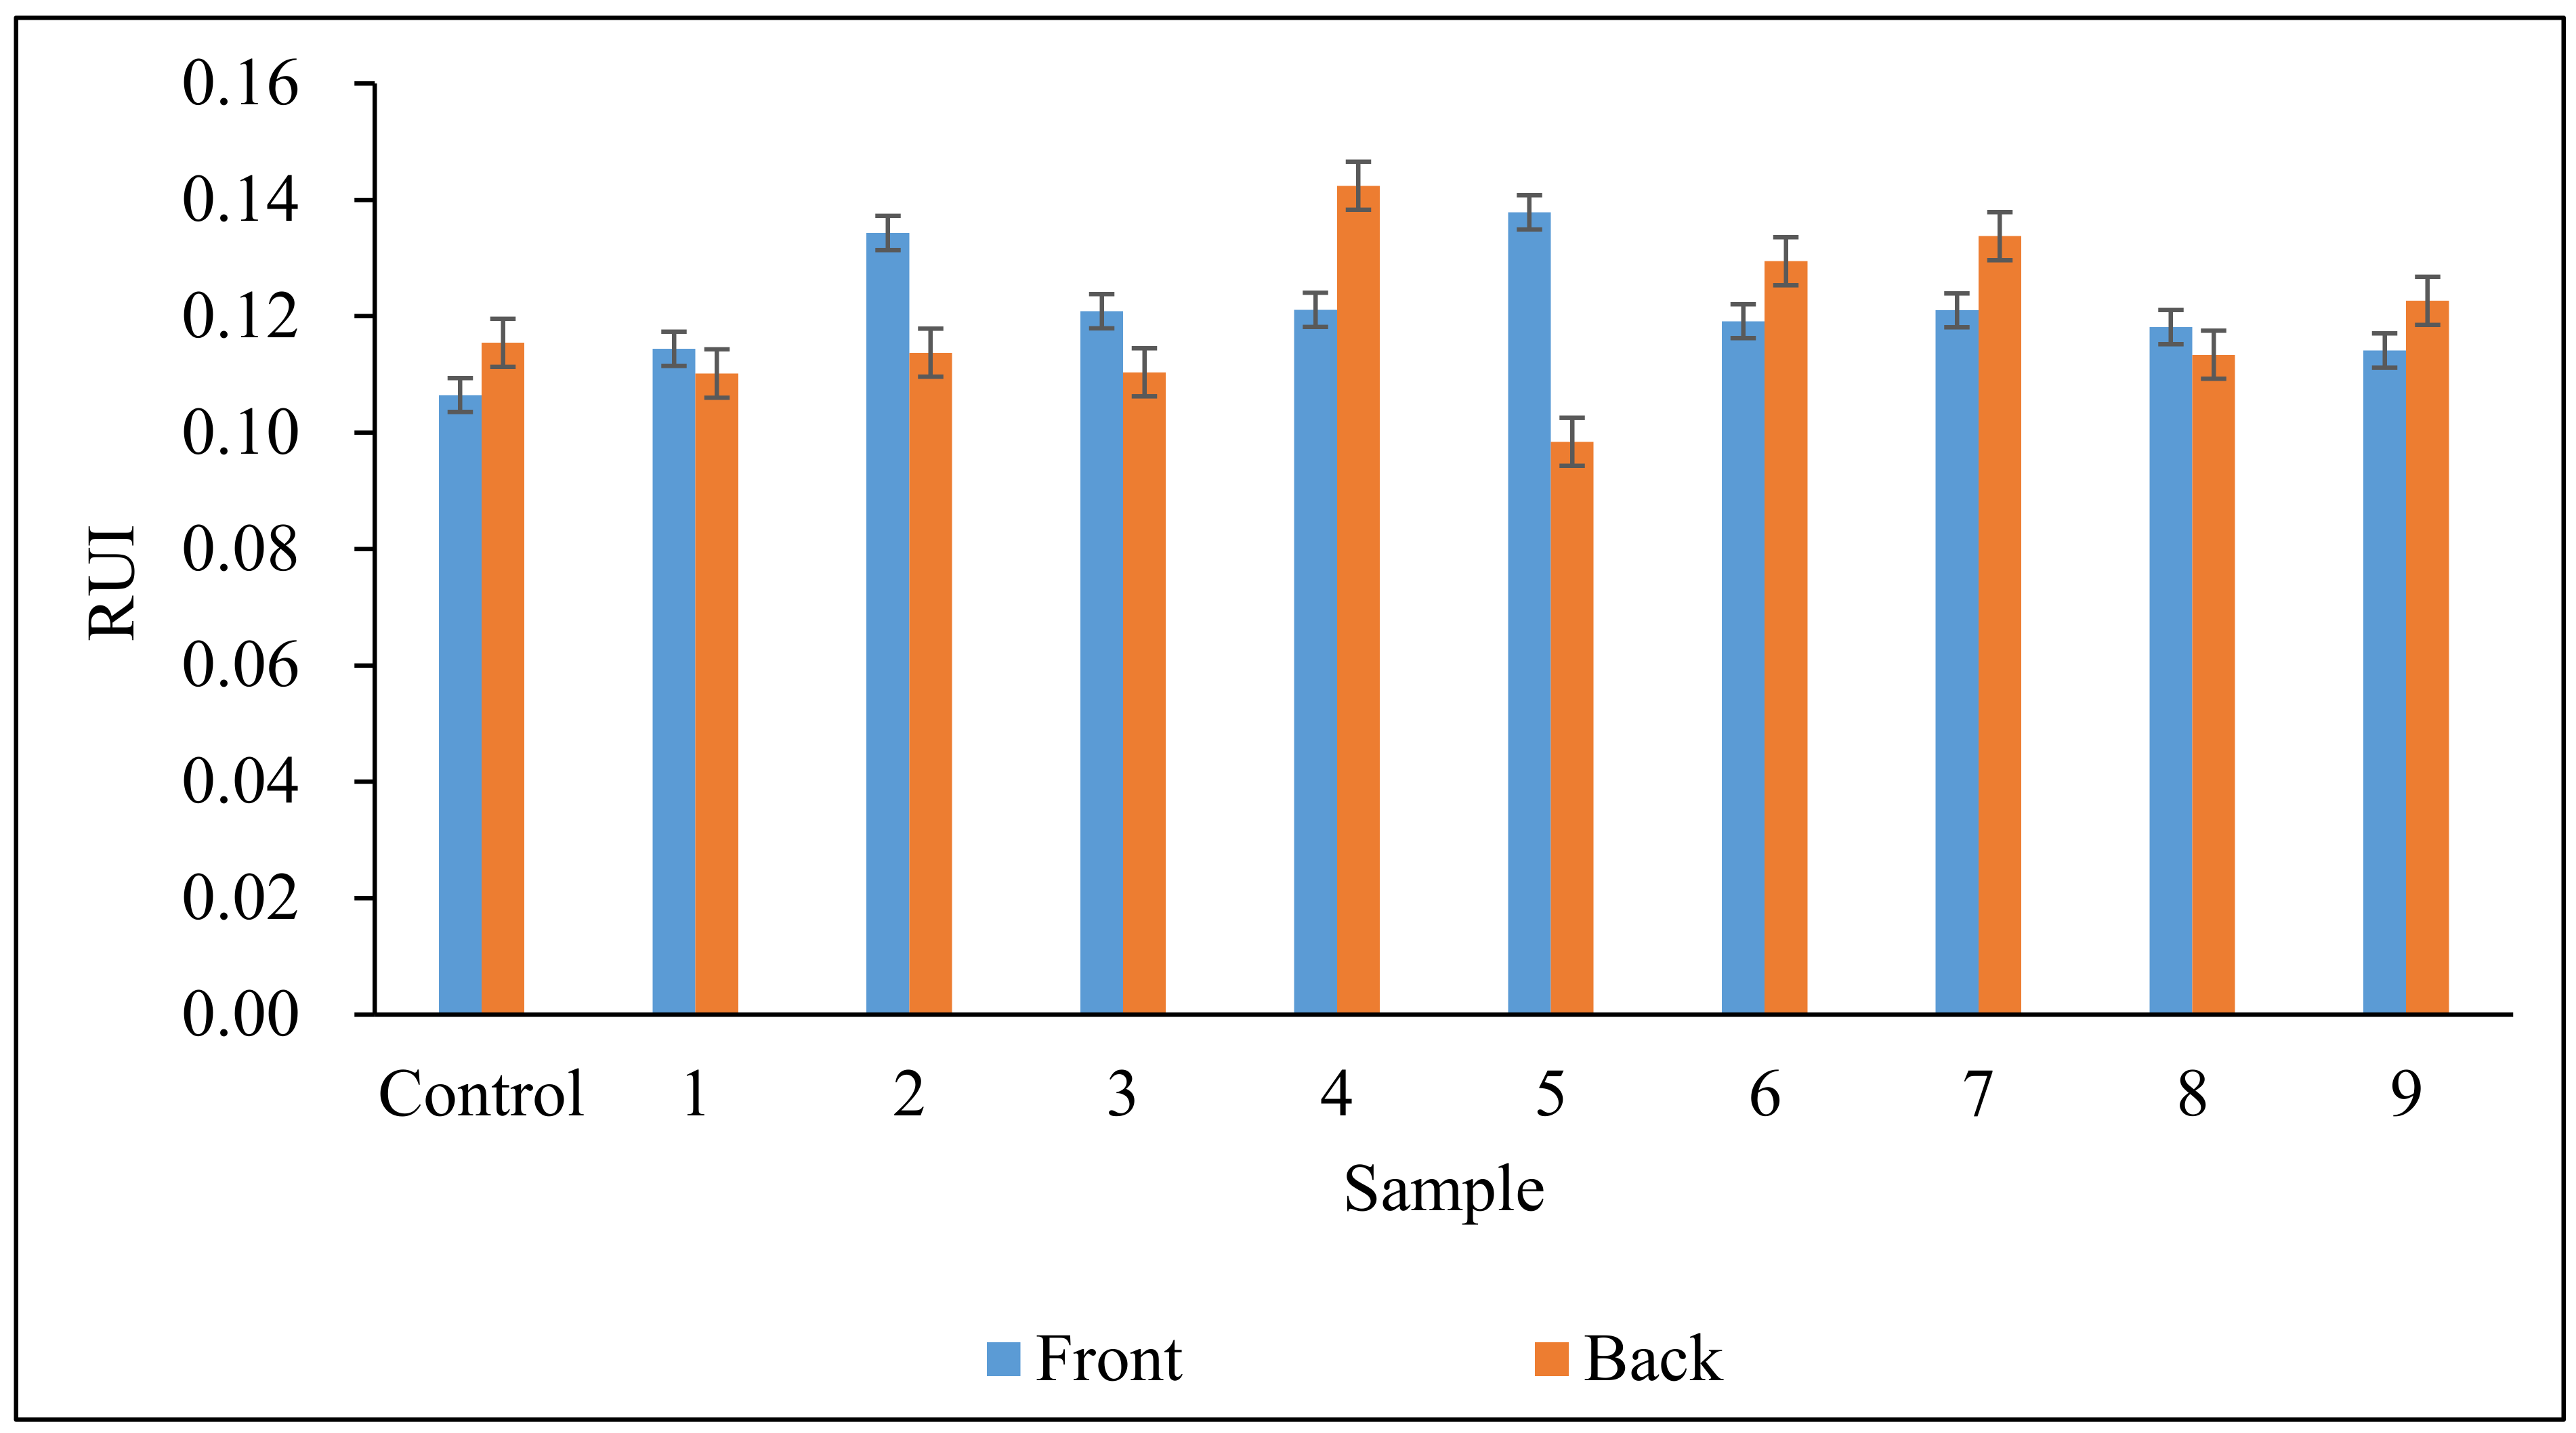
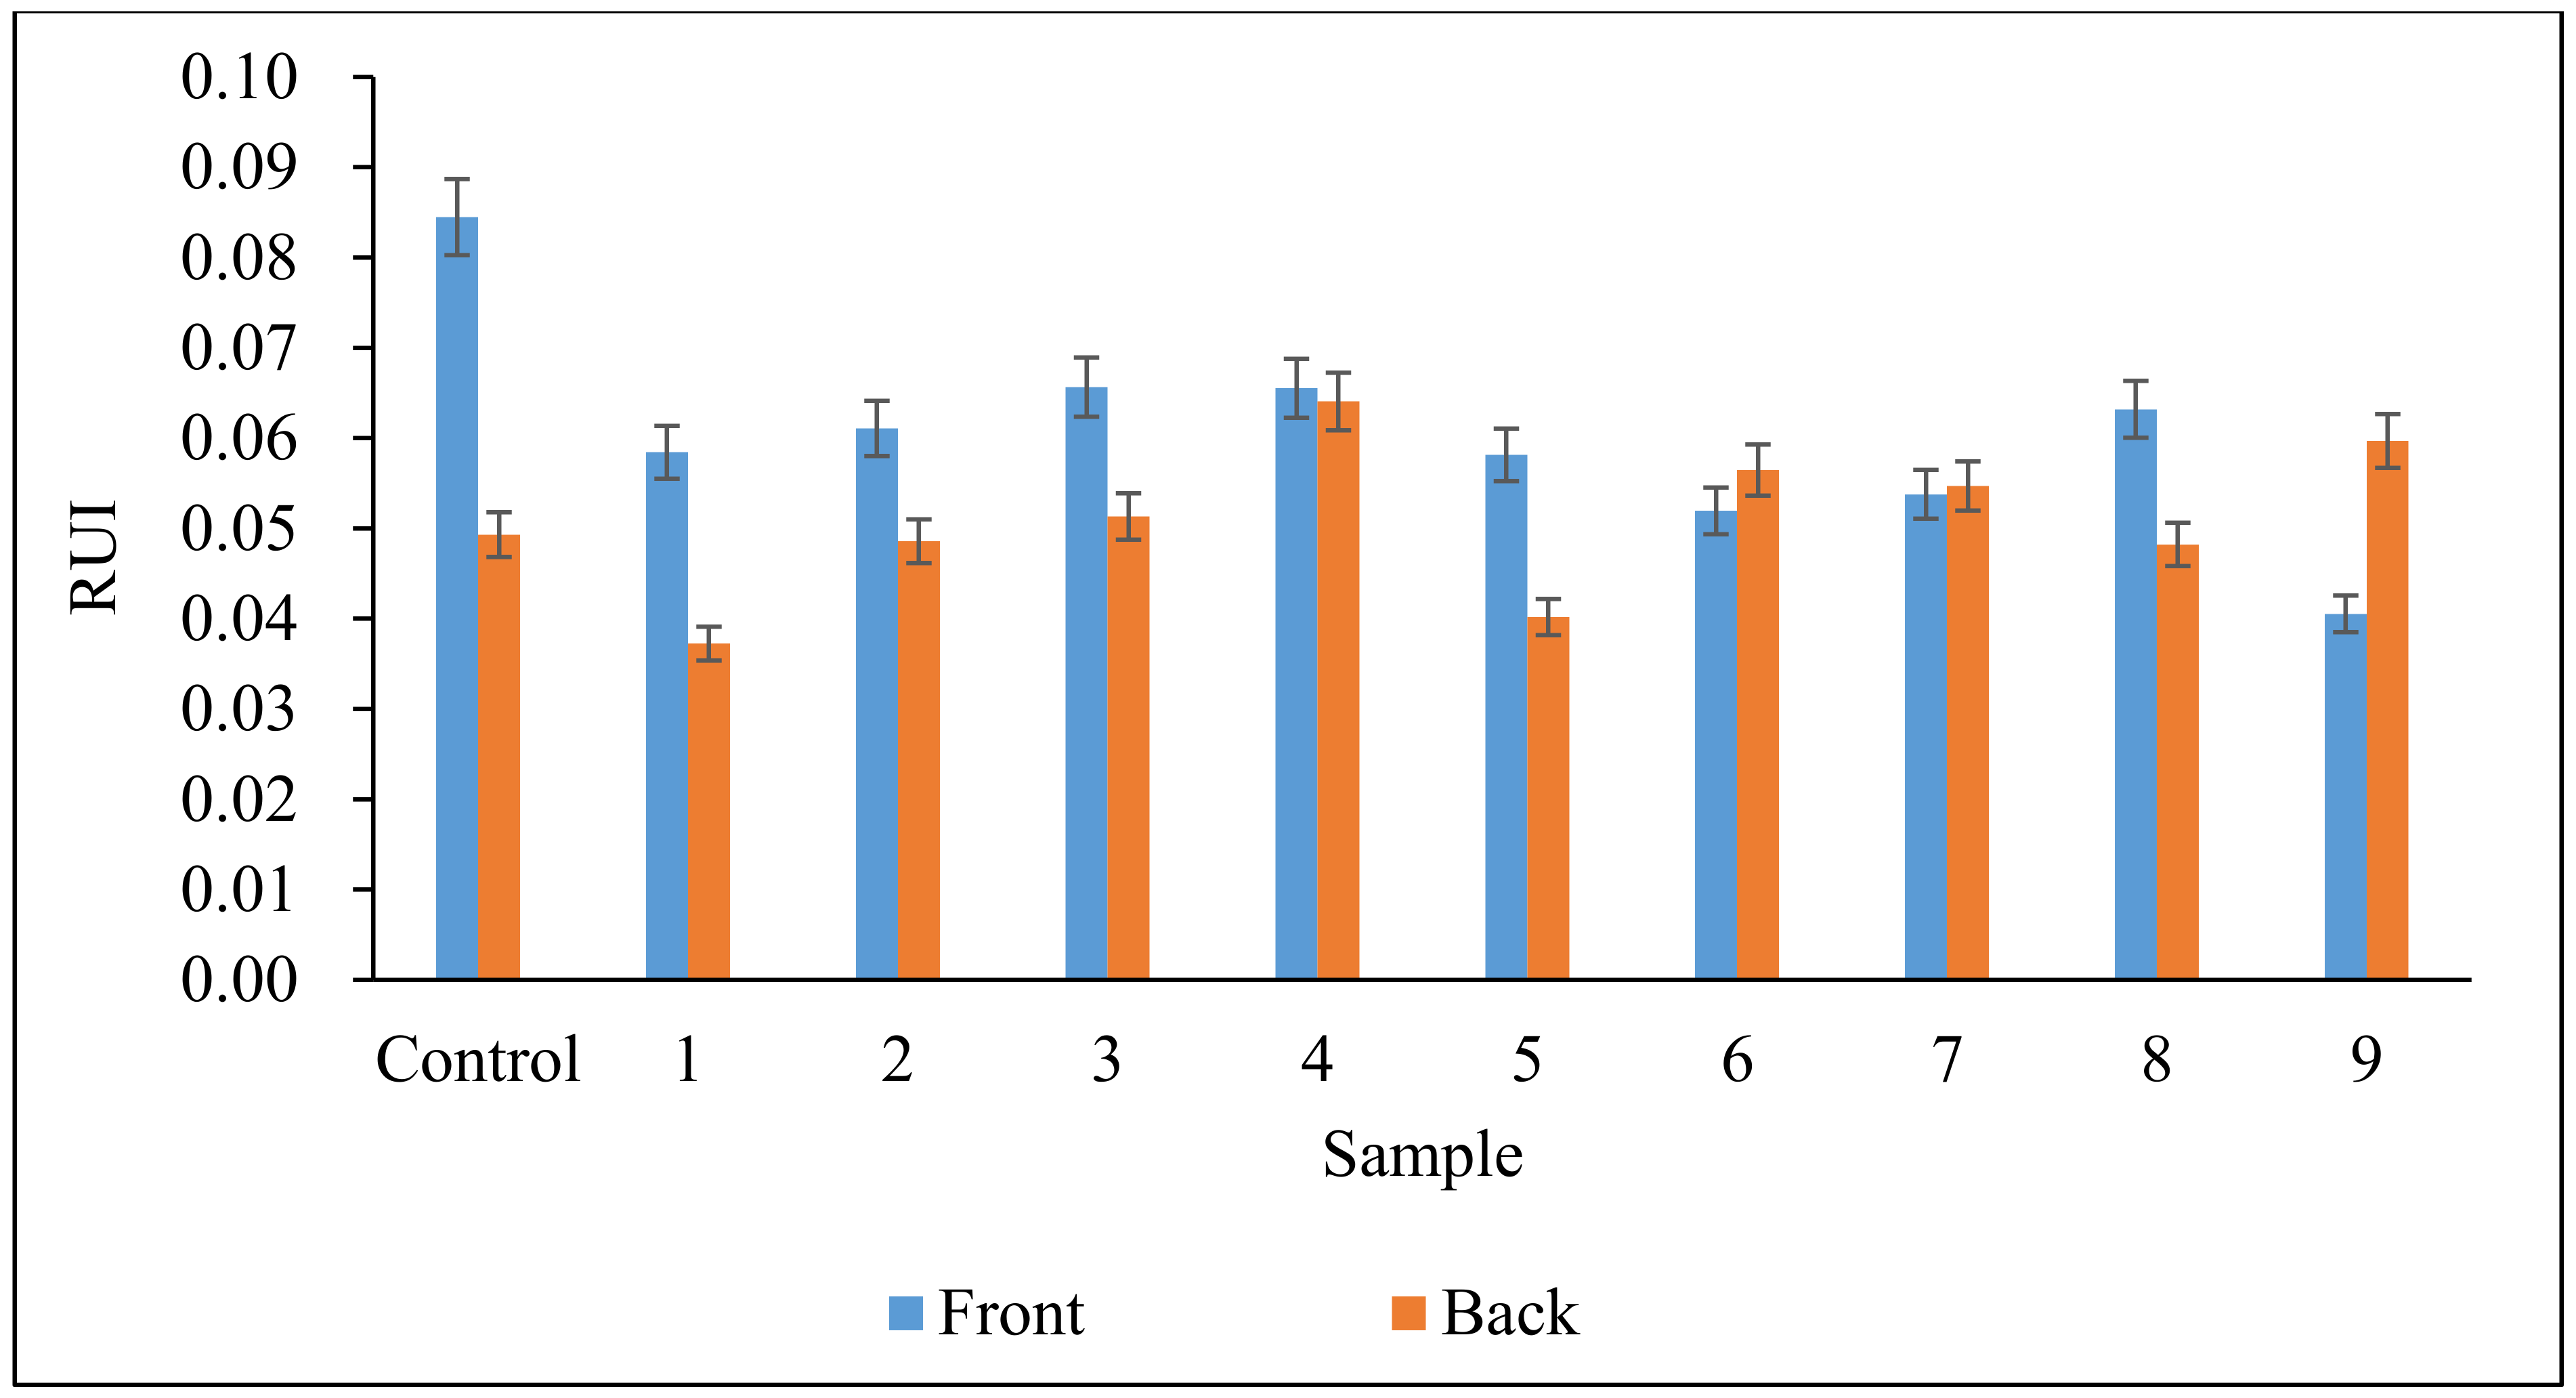
After atmospheric pressure plasma treatment, the colour levelness of some pigment-dyed samples is improved, but some pigment-dyed samples have serious colour levelness problems. The RUI values of all of the pigment-dyed cotton fabric samples are less than 0.2, which means that all of the pigment-dyed (1 g/L and 5 g/L) cotton fabrics achieved excellent colour levelness in visual appearance. If the RUI values are compared based on the results shown in Figure 2 and Figure 3, the colour levelness problem is more serious in 5 g/L pigment-dyed cotton fabric. This may have been due to the high amount of pigment particles in the dyeing solution, which might have possibly caused pigment aggregation and poor migration during the drying process. Even if we treated the pigment-dyeing solution with ultrasound for particle dispersion and distribution, the reduction in effective diameter from 206.0 nm to 199.9 nm (with about 3% reduction) is not significant. The pigment particle aggregation and poor migration during the drying process can lead to a low colour levelness quantitatively.
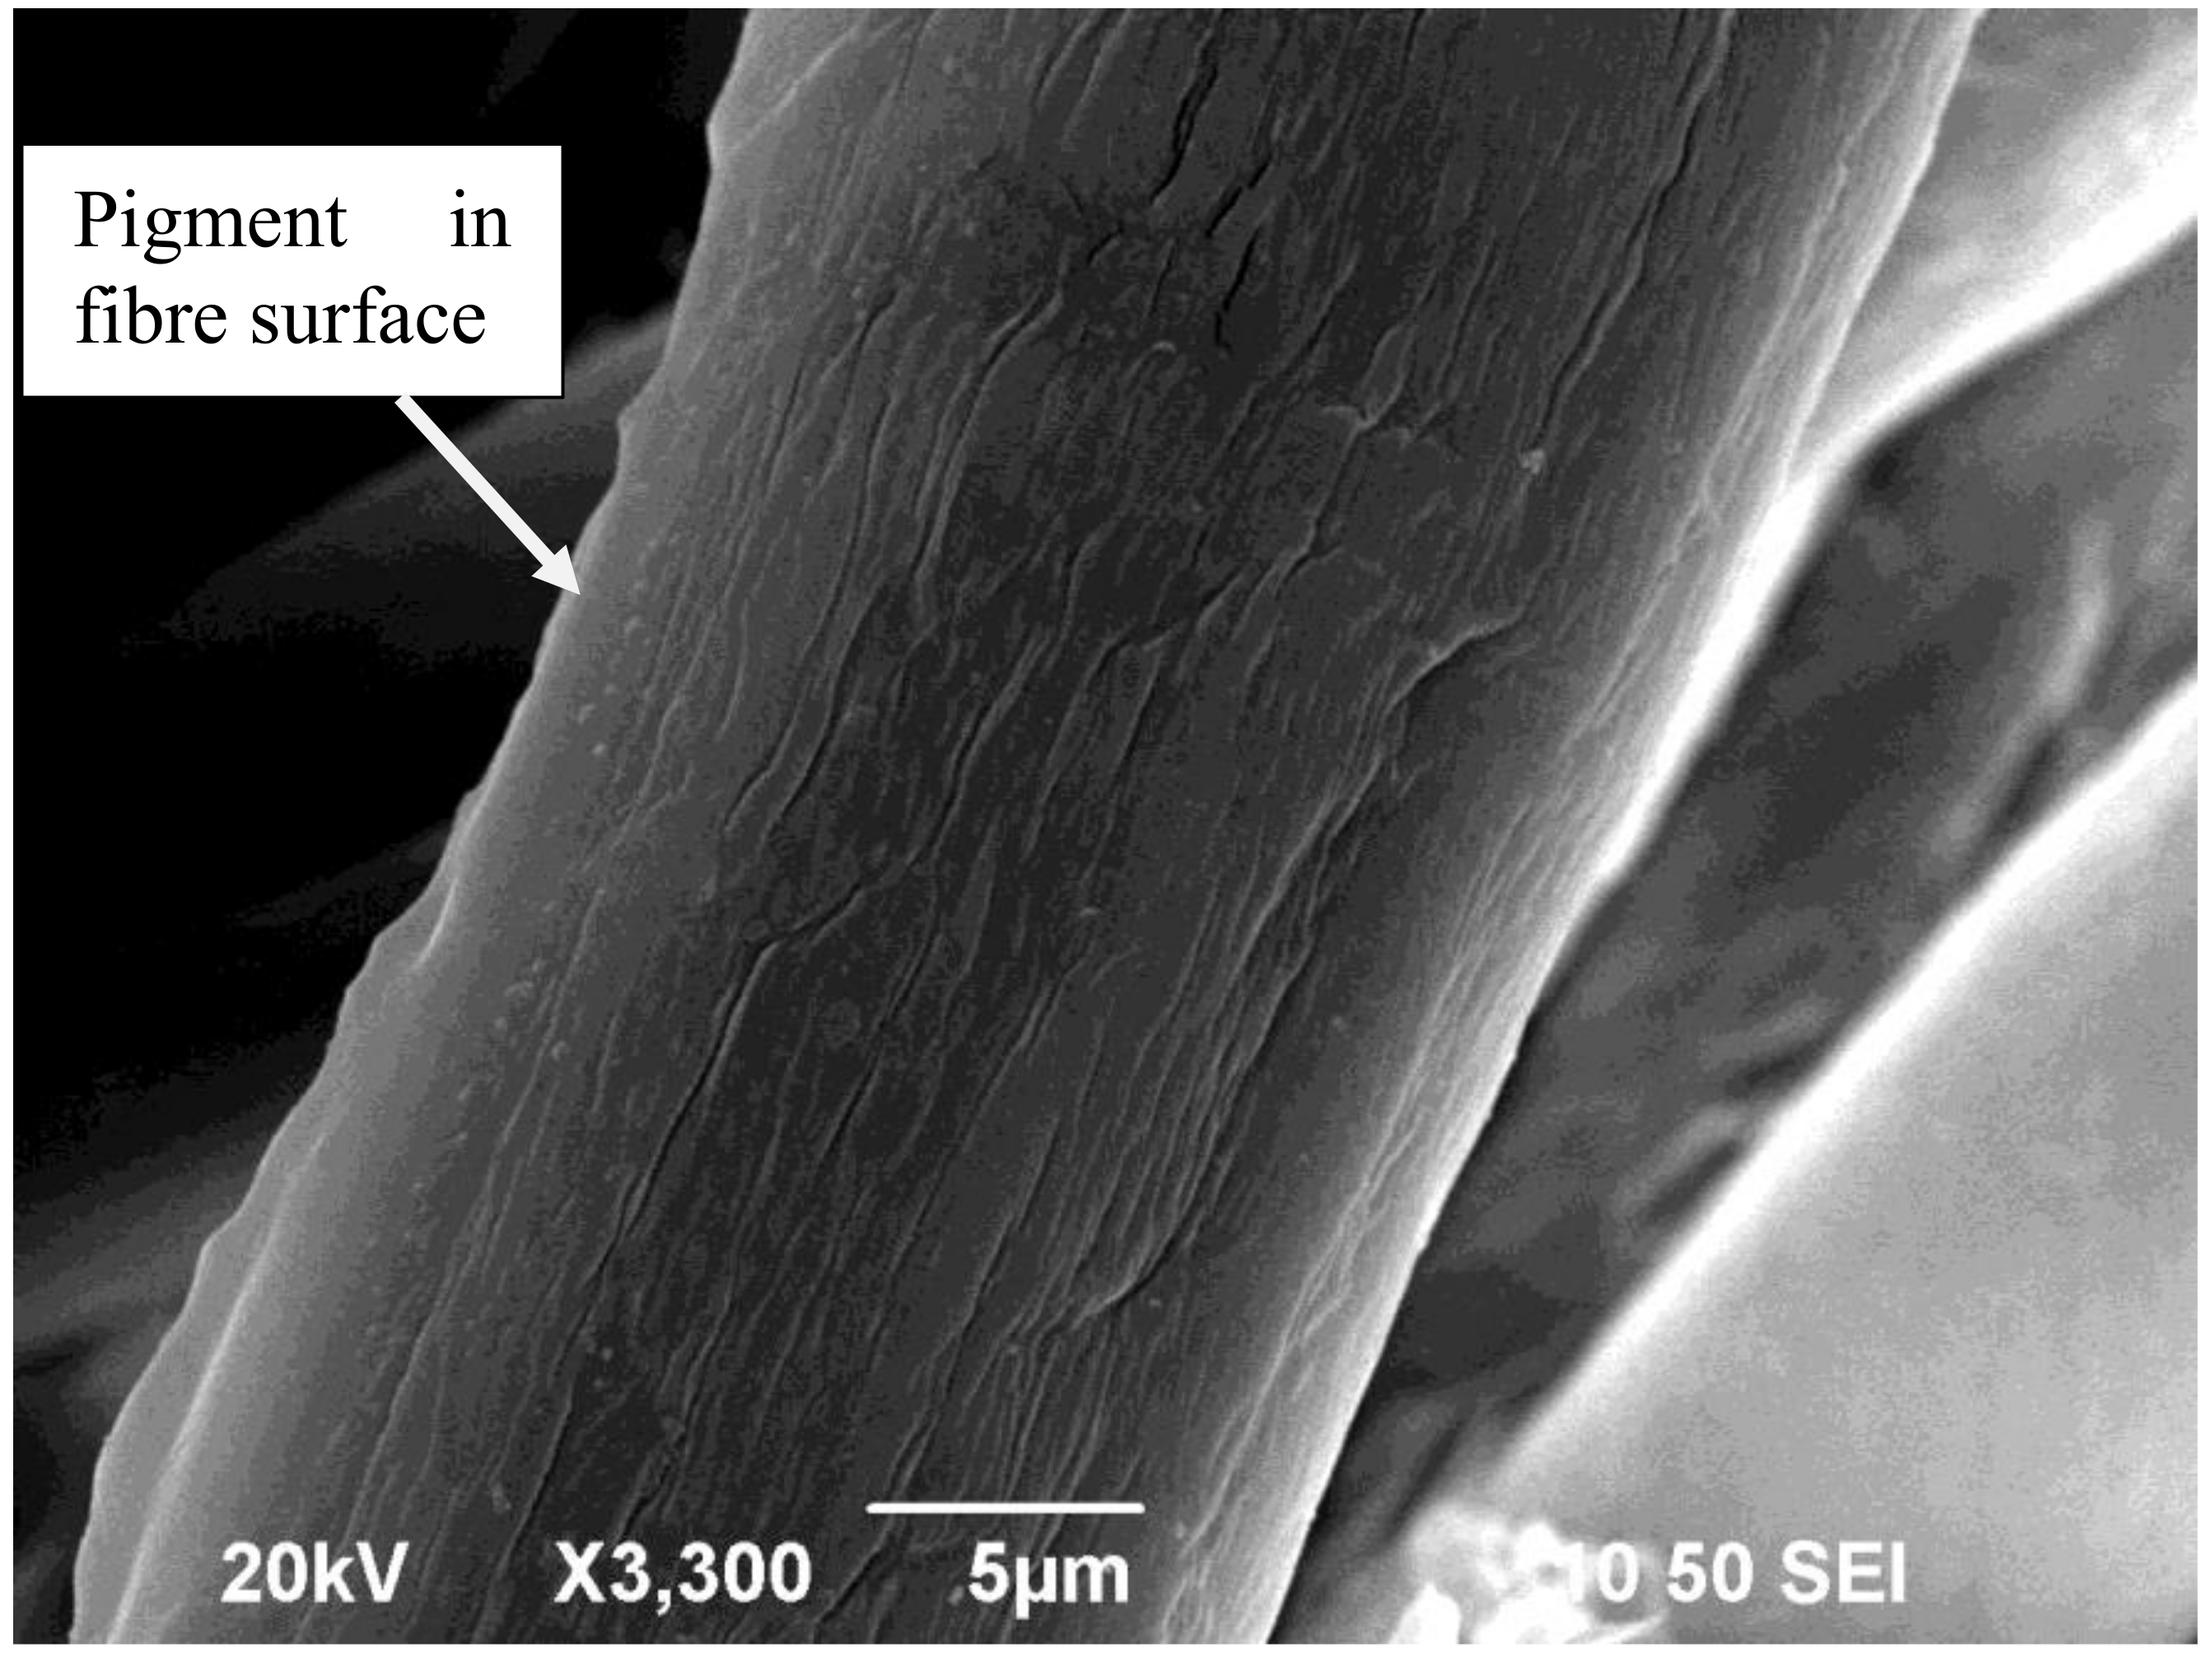
Figure 4 illustrates that pigment particles are aggregated on a fibre surface, and the effective diameters of some pigment particles, for example, are 416.7 nm (circle mark) and 213.0 nm (square mark). Figure 5 is the SEM image showing that abundant pigment particles are encased by a binder layer on the cotton fibre surface. The uneven distribution of pigment particles on the cotton fibre surface may cause issues regarding an unlevelness of colour. The fluctuation of colour levelness is mainly due to pigment particle migration or aggregation, but not atmospheric pressure plasma treatment.

3.3. Crocking Fastness

The crocking fastness ratings of 1 g/L and 5 g/L pigment-dyed cotton fabrics are shown in Table 5 and Table 6, respectively. The pigment-dyed cotton fabrics have good dry crocking fastness. However, in wet crocking conditions, pigment particles can be easily removed by the wet white crocking cloth. When the white crocking cloth (which is made of cotton) was wetted, its cotton fibre got swollen, and thus due to high friction and a large contact area, more mechanical action occurred in the wet crocking operation. Thus, a worse crocking rating was the result of wet crocking. In 5 g/L pigment-dyeing conditions, the binder-to-pigment ratio is 10:1, which is smaller than the ratio in 1 g/L pigment dyeing (30:1). Since fewer binder molecules are allowed to encase pigment particles (10 binder molecules to one pigment particle in the case of a 5 g/L pigment-dyeing solution, versus 30 binder molecules to one pigment particle in the case of a 1 g/L pigment-dyeing solution), the crocking fastness of 5 g/L of pigment-dyed cotton samples is poorer than 1 g/L pigment-dyed cotton samples, especially in wet conditions, because the particles are loosely encased by a binder in the case of 1 g/L of pigment dyeing.

3.4. Dry Cleaning Fastness

The dry-cleaning fastnesses of the pigment-dyed (1 g/L and 5 g/L) cotton fabrics was excellent. The colour change rating of the pigment-dyed (1 g/L and 5 g/L) control cotton fabrics was 4, while the colour change rating of the pigment-dyed (1 g/L and 5 g/L) atmospheric pressure plasma-treated cotton fabrics was 4–5. On the other hand, the colour-staining ratings of the pigment-dyed (1 g/L and 5 g/L) control cotton fabrics in multi-fibre stripes (acetate/cotton/nylon polyester/acrylic/wool) are all 4, but after atmospheric pressure plasma treatment, the ratings of pigment-dyed (1 g/L and 5 g/L) cotton fabrics increased to 4–5. Thus, the atmospheric pressure plasma treatment process can enhance the dry-cleaning fastness of pigment-dyed cotton fabrics.
Generally speaking, pigment dyeing always gives poor dry-cleaning fastness, because pigments are deposited on the fibre surface, and can be detached easily during dry cleaning. In this study, the pigment particles in the pigment-dyeing solution have an effective diameter of 206.0 nm. This pigment particle size can enhance the dry-cleaning fastness (change of shade and staining on multiple fibre stripes) with a rating of 4–5. According to Figure 6 and Figure 7, nanosized pigment particles are deposited in the cracks on the atmospheric pressure plasma-treated cotton fibre surface, and are encased in the layer of binder. This enhances the affinity between the binders and the cotton fibre surface, preventing the detachment of particles in the dry-cleaning process.

3.5. Scanning Electron Microscopy (SEM)

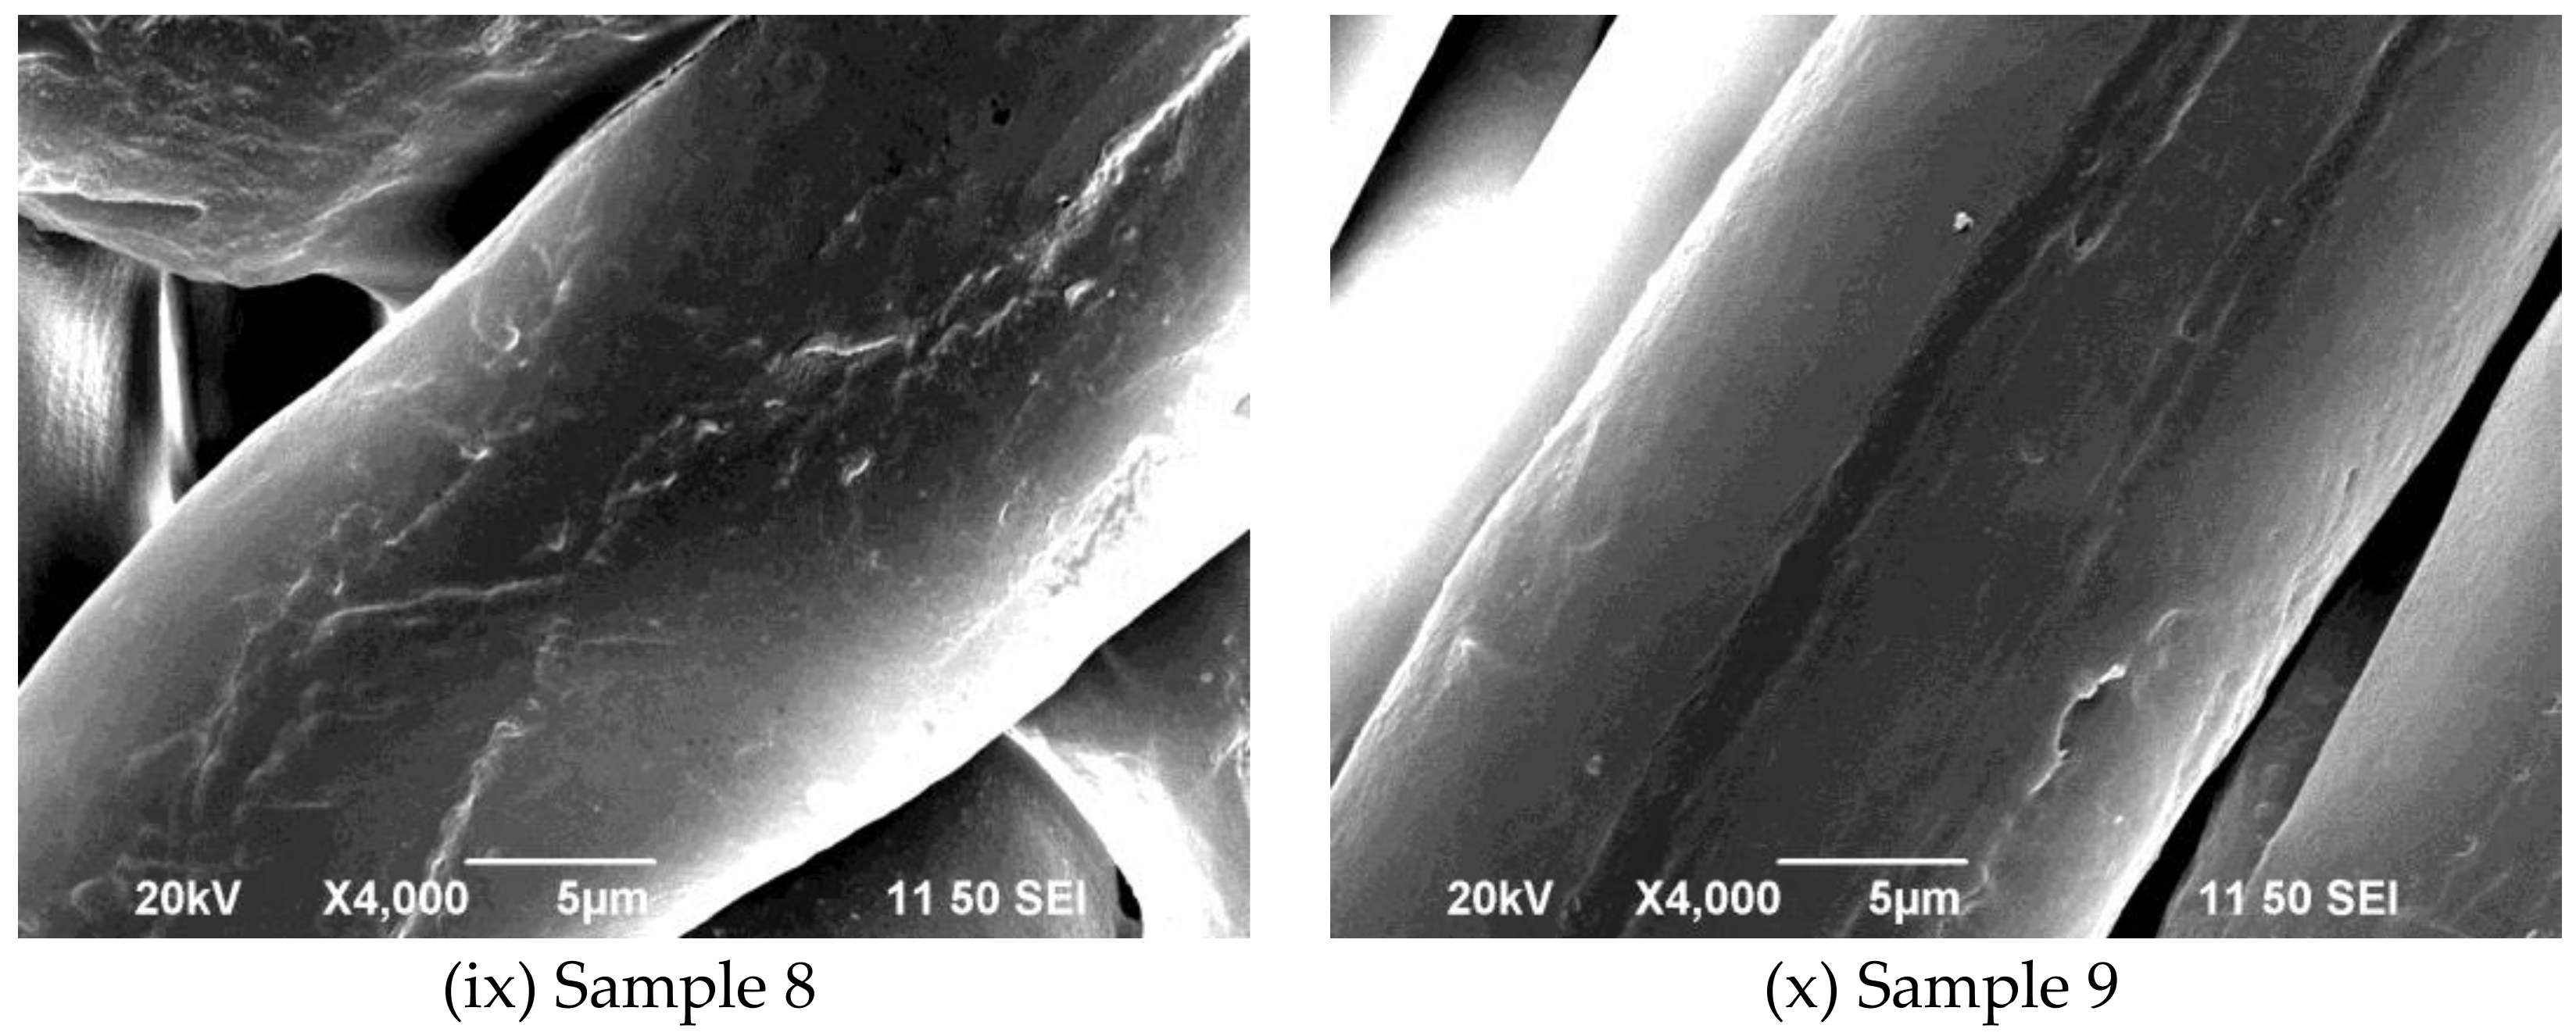
After dyeing, pigment particles can be clearly observed as deposited on the cotton fibre surface, as shown in Figure 6 (1 g/L); it can also be seen that the cotton fibre surface is smoothened by the binder layer. Under different combinations of discharge power, oxygen flow rate, and head moving speed, pigment particles are deposited better on an atmospheric pressure plasma-treated cotton fibre surface.
Figure 7 shows the surface morphology of 5 g/L pigment-dyed cotton fabrics, and it is noticed that the cotton fibre surfaces are covered and smoothened by the binder layer. The pigment particles are encased in the binder layer. The fibre morphology, as shown in Figure 7, can be used for clarifying the results in relation to the colour yield measurement (Table 4), a high K/S value achieved in the discharge power of 170W (Figure 7(iv)), and a head moving speed of 1 mm/s (Figure 7(viii)). Figure 7(iv), (vii), and (viii) show that the cotton fibre surface contains a lot of cracks/grooves along the fibre axis, and many pigment particles are encased in the cracks/grooves. As a result, the crocking and dry-cleaning fastness of the pigment-dyed cotton fabric are improved.

3.6. Multiple Linear Regression Analysis

Correlations among the three parameters—(i) discharge power; (ii) oxygen flow rate, and (iii) head moving speed—and the colour yield of the 1g/L and 5g/L pigment-dyed cotton samples are shown in Table 7. Based on the results in Table 7 (positive Pearson Correlation value), the level of discharge power and oxygen flow rate have a significant relationship with the colour yield, i.e., increasing the level of discharge power or oxygen flow rate increases the colour yield when pigment concentrations are 1 g/L and 5 g/L.
Table 8 is the ANOVA table that shows the regression models of colour yield, which can be used for predicting the colour yield of the atmospheric pressure plasma-treated cotton fabric (with different discharge powers, oxygen flow rates, and head moving speeds) dyed with a pigment-dyeing concentration of 1 g/L or 5 g/L. The results reveal that the effect of the three atmospheric pressure plasma operations parameters have a significant influence on the colour yield. The significance (based on F-test results) for the 1 g/L and 5 g/L pigment-dyed colour yield are 0.002 and 0.007 in the 95% confidence interval, respectively.
Table 9 presents the coefficients of the 1 g/L and 5 g/L colour yield models. A multiple regression equation for the 1 g/L and 5 g/L pigment-dyed colour yield predictions can be determined from the linear regression model with different operational parameters ranges, as shown in equations (4) and (5), respectively.
Y1 = 9.364 + 0.003Discahreg power + 0.421Oxygen flow rate − 0.041Head moving speed
Y1 is the predicted value of the colour yield of 1 g/L yellow pigment-dyed cotton fabric with different inputs for the discharge power, oxygen flow rate, and head moving speed.
Y2 = 47.981 + 0.013Discharge power +1.935Oxygen flow − 0.290Head moving speed
Y2 is the predicted value of the colour yield of 5 g/L yellow pigment-dyed cotton fabric with different inputs for the discharge power, oxygen flow rate, and head moving speed.
After having the two linear regression models (Y1 and Y2), as shown in Equations (4) and (5), respectively, Table 10 shows the verification of the two linear regression models (Y1 and Y2). It is revealed that the two regression models can provide reliable predictions of colour yield when using the existing range of parameters.
4. Conclusions

Atmospheric pressure plasma treatment before dyeing can improve the colour yield of a yellow pigment-dyed cotton fabric with pigment concentrations of 1 g/L and 5 g/L. The crocking and dry-cleaning fastness of yellow pigment-dyed cotton fabrics were improved after atmospheric pressure plasma treatment. The improvement in crocking fastness is more obvious in 5 g/L pigment dyeing than in 1 g/L pigment dyeing. The improvement of the crocking and dry-cleaning fastness was mainly contributed by an increase in the roughness and functionality of the cotton fibre surface, as shown in the SEM pictures. The colour levelness of some yellow pigment-dyed cotton fabrics was worse after atmospheric pressure plasma treatment, which may be due to the aggregation of pigment particles on the fibre surface. In addition, prediction model equations are developed for 1 g/L and 5 g/L pigment dyeing based on multiple linear regression, and the results of the predicted colour yield were found to be close to the measured colour yield. Thus, the prediction equations can be used as a simple tool for colour yield prediction when selecting the operational parameters in atmospheric pressure plasma treatment.

Acknowledgments

Authors would like to thank The Hong Kong Polytechnic University for the financial support of this work. The information in the paper containing data of Wai-shan Man’s unpublished MPhil research project submitted to the Institute of Textiles and Clothing, The Hong Kong Polytechnic University.

Author Contributions

Chi-Wai Kan formulated the research idea; Chi-Wai Kan and Wai-Shan Man designed the experiments; Wai-Shan Man performed the experiments; Chi-Wai Kan and Wai-Shan Man analysed the data; Chi-Wai Kan contributed reagents/materials/analysis tools; Chi-Wai Kan and Wai-Shan Man wrote the paper.

Conflicts of Interest

The authors declare no conflict of interest.

References

  1. Aspland, J.R. Reactive dyes and their application. Text. Chem. Color. 1992, 24, 31–36. [Google Scholar]
  2. Karahan, H.A.; Özdoğan, E. Improvements of surface functionality of cotton fibres by atmospheric plasma treatment. Fibers Polym. 2008, 9, 21–26. [Google Scholar] [CrossRef]
  3. Leroux, F.; Perwuelz, A.; Campagne, C.; Behary, N. Atmospheric air-plasma treatments of polyester textile structures. J. Adhes. Sci. Technol. 2006, 20, 939–957. [Google Scholar] [CrossRef]
  4. Samanta, K.K.; Jassal, M.; Agrawal, A.K. Improvement in water and oil absorbency of textile substrate by atmospheric pressure cold plasma treatment. Surf. Coat. Technol. 2009, 203, 1336–1342. [Google Scholar] [CrossRef]
  5. Kan, C.W.; Lam, Y.L. The effect of plasma treatment on water absorption properties of silk fabrics. Fibers Polym. 2015, 16, 1705–1714. [Google Scholar] [CrossRef]
  6. Hodak, S.K.; Supasai, T.; Paosawatyanyong, B.; Kamlangkla, K.; Pavarajarn, V. Enhancement of the hydrophobicity of silk fabrics by SF6 plasma. Appl. Surf. Sci. 2008, 254, 4744–4749. [Google Scholar] [CrossRef]
  7. Lei, J.; Shi, M.; Zhang, J. Surface graft copolymerization of hydrogen silicon fluid onto fabric through corona discharge and water repellency of grafted fabric. Eur. Polym. J. 2000, 36, 1277–1281. [Google Scholar] [CrossRef]
  8. Leroux, F.; Campagne, C.; Perwuelz, A.; Gengembre, L. Fluorocarbon nano-coating of polyester fabrics by atmospheric air plasma with aerosol. Surf. Coat. Technol. 2008, 254, 3902–3908. [Google Scholar] [CrossRef]
  9. Kan, C.W.; Man, W.S. Enhancing dark shade pigment dyeing of cotton fabric with plasma treatment. Coatings 2017, 7, 104. [Google Scholar] [CrossRef]
  10. Kan, C.W.; Man, W.S.; Ng, S.P. A study of pigment application on atmospheric pressure plasma treated cotton fabric. Fibers Polym. 2014, 15, 2313–2318. [Google Scholar] [CrossRef]
  11. Kan, C.W.; Lo, C.K.Y.; Man, W.S. Mini review–environmentally friendly aspects in coloration. Color. Technol. 2016, 132, 4–8. [Google Scholar] [CrossRef]
  12. Wan, C.C.; Lin, L.H.; Chen, C.W.; Lo, Y.C. Surface modification of poly(lactic acid) fabrics with plasma pretreatment and chitosan/siloxane polyesters coating for color strength improvement. Polymers 2017, 9, 371. [Google Scholar] [CrossRef]
  13. Tokino, S.; Wakida, T.; Uchiyama, H.; Lee, M. Laundering shrinkage of wool fabric treated with low-temperature plasmas under atmospheric pressure. J. Soc. Dyers Colour. 1993, 109, 334–335. [Google Scholar] [CrossRef]
  14. Chen, C.; Jia, L.; Liu, R.; Chen, X.; Jin, C.; Liu, H.; Feng, C.; Zhang, C.; Qiu, Y. The effects of humidity on the surface modification of wool fabric through atmospheric pressure plasma jet. Fibers Polym. 2016, 17, 1181–1185. [Google Scholar] [CrossRef]
  15. Salem, T.; Simon, F.; Atef El-Sayed, A.; Salama, M. Plasma-assisted surface modification of polyester fabric for developing halochromic properties. Fibers Polym. 2017, 18, 731–740. [Google Scholar] [CrossRef]
  16. Šimor, M.; Ráhel, J.; Černák, M.; Imahori, Y.; Štefečka, M.; Kando, M. Atmospheric-pressure plasma treatment of polyester nonwoven fabrics for electroless plating. Surf. Coat. Technol. 2003, 172, 1–6. [Google Scholar] [CrossRef]
  17. Szabová, R.; Černáková, L.; Wolfová, M.; Černák, M. Coating of TiO2 nanoparticles on the plasma activated polypropylene fibres. Acta Chim. Slovaca 2009, 2, 70–76. [Google Scholar]
  18. Fang, K.J.; Wang, S.H.; Wang, C.X.; Tian, A.L. Inkjet printing effects of pigments inks on silk fabrics surface-modified with O2 plasma. J. Appl. Polym. Sci. 2008, 107, 2949–2955. [Google Scholar] [CrossRef]
  19. Zhang, C.M.; Fang, K.J. Surface modification of polyester fabrics for inkjet printing with atmospheric-pressure air/Ar plasma. Surf. Coat. Technol. 2009, 203, 2058–2063. [Google Scholar] [CrossRef]
  20. Kan, C.W.; Lam, Y.L.; Li, M.Y. The effect of plasma treatment on dyeing properties of silk fabric. Color. Technol. 2016, 132, 9–16. [Google Scholar] [CrossRef]
  21. Chong, C.L.; Li, S.Q.; Yeung, K.W. An objective method for the assessment of levelness of dyed materials. J. Soc. Dyers Colour. 1992, 108, 528–530. [Google Scholar] [CrossRef]
  22. Man, W.S.; Kan, C.W.; Ng, S.P. The use of atmospheric pressure plasma treatment on enhancing the pigment application on cotton fabric. Vacuum 2014, 99, 7–11. [Google Scholar] [CrossRef]
  23. Wang, C.X.; Qiu, Y.P. Two sided modification of wool fabric by atmospheric pressure plasma jet: Influence of processing parameter on plasma penetration. Surf. Coat. Technol. 2007, 201, 6273–6277. [Google Scholar] [CrossRef]
Figure 1. Atmospheric pressure plasma treatment set-up.
Applsci 08 00552 g001
Figure 2. Relative unlevelness index (RUI) of 1 g/L pigment-dyed cotton samples (Front: atmospheric pressure plasma-treated fabric side; Back: non-atmospheric pressure plasma-treated fabric side).
Applsci 08 00552 g002
Figure 3. RUI of 5 g/L pigment-dyed cotton samples (Front: atmospheric pressure plasma-treated fabric side; Back: non-atmospheric pressure plasma-treated fabric side).
Applsci 08 00552 g003
Figure 4. SEM image of atmospheric pressure plasma-treated cotton fibre after 5 g/L pigment dyeing (atmospheric pressure plasma treatment condition: discharge power = 170 W; oxygen flow rate = 0.6 L/min; head moving speed = 1 mm/s; and head-to-substrate distance = 3 mm).
Applsci 08 00552 g004
Figure 5. SEM image of atmospheric pressure plasma-treated cotton fibre after 5 g/L pigment dyeing (atmospheric pressure plasma treatment condition: discharge power = 170 W; oxygen flow rate = 0.6 L/min; head moving speed = 1 mm/s and head-to-substrate distance = 3 mm).
Applsci 08 00552 g005
Figure 6. SEM images of 1 g/L pigment dyed samples treated with different atmospheric pressure plasma treatment conditions.
Applsci 08 00552 g006aApplsci 08 00552 g006b
Figure 7. SEM images of 5 g/L pigment-dyed samples treated with different atmospheric pressure plasma conditions.
Applsci 08 00552 g007aApplsci 08 00552 g007b
Table 1. Combination of plasma operational parameters.
SampleDischarge Power (W)Oxygen Flow Rate (L/min)Head Moving Speed (mm/s)Head-to-Substrate Distance (mm)
11300.353
21500.353
31700.353
41700.253
51700.453
61700.653
71500.413
81500.453
91500.493
Table 2. Mixing of pigment and binder in 1 litre of deionised water.
Printofix T-C Yellow (g)Printofix Binder MTB-01 (g)
130
550
Table 3. Interpretation of relative unlevelness index (RUI) values. Reproduced with permission from [21], Copyright John Wiley and Sons, 1992.
RUIVisual Appearance of Colour Levelness
>1.0Bad
0.5–1.0Poor
0.2–0.49Good
<0.2Execellent
Table 4. K/S values of 1 g/L and 5 g/L pigment-dyed cotton samples.
ConcentrationControl123456789
1 g/L0.920.970.960.950.980.980.971.000.980.97
5 g/L4.544.684.714.904.864.844.934.944.844.75
Table 5. Crocking fastness rating of 1 g/L pigment-dyed cotton samples.
Crocking fastnessSample
Control123456789
Dry4–5555555555
Wet44–54–54–54–54–54–54–54–54–5
Remark: Rating “1” = worst crocking fastness; “5” = best crocking fastness.
Table 6. Crocking fastness rating of 5g/L pigment-dyed cotton samples.
Crocking fastnessSample
Control123456789
Dry4–5555555555
Wet3–4444444444
Remark: Rating “1” = worst crocking fastness; “5” = best crocking fastness.
Table 7. Correlations between colour yield and atmospheric pressure plasma operation parameters.
Colour YieldDischarge PowerOxygen Flow RateHead Moving Speed
Pearson Correlation1 g/L Colour yield1.0000.5670.5250.125
Discharge power0.5671.0000.7420.620
Oxygen flow rate0.5250.7421.0000.475
Head moving speed0.1250.6200.4751.000
Sig. (1-tailed)1 g/L Colour yield-0.0010.0010.255
Discharge power0.001-0.0000.000
Oxygen flow rate0.0010.000-0.004
Head moving speed0.2550.0000.004-
Pearson Correlation5 g/L Colour yield1.0000.3660.374-0.126
Discharge power0.3661.0000.7420.620
Oxygen flow rate0.3740.7421.0000.475
Head moving speed-0.1260.6200.4751.000
Sig. (1-tailed)5 g/L Colour yield-0.0230.0210.253
Discharge power0.023-0.0000.000
Oxygen flow rate0.0210.000-0.004
Head moving speed0.2530.0000.004-
Table 8. ANOVA table of colour yield regression model.
ModelSum of SquaresDfMean SquareFSignificance
1 g/L Colour YieldRegression0.86130.2876.6020.002
Residual1.130260.043
Total1.99029
5 g/L Colour YieldRegression14.88434.9614.9780.007
Residual25.914260.997
Total40.79829
Table 9. Coefficient of the regression models of yellow pigment-dyed colour yield.
Colour YieldModelCoefficient
1 g/LConstant9.364
Discharge power0.003
Oxygen flow rate0.421
Head moving speed-0.041
5 g/LConstant47.981
Discharge power0.013
Oxygen flow rate1.935
Head moving speed-0.290
Table 10. Verification of Y1 and Y2.
For 1 g/L yellow pigment dyeing (9.364 + 0.003Power + 0.421Oxygen − 0.041Speed)
SampleDischarge PowerOxygen Flow RateHead Moving SpeedPredicted Colour YieldMeasured Colour YieldDifference (%) *
Control0009.369.32−0.43
11300.3510.099.76−3.33
21500.3510.159.72−4.38
31700.3510.219.65−5.75
41700.2510.169.85−3.18
51700.4510.259.9−3.51
61700.6510.339.84−5.00
71500.4110.0210.141.15
81500.4510.199.85−3.43
91500.4910.359.75−6.17
For 5 g/L yellow pigment dyeing (47.981 + 0.013Power +1.935Oxygen − 0.290Speed)
Control00047.9848.310.68
11300.3548.8047.75−2.20
21500.3549.0648.08−2.04
31700.3549.3249.961.28
41700.2549.1349.610.97
51700.4549.5249.37−0.29
61700.6549.9050.330.85
71500.4150.4250.34−0.15
81500.4549.2649.330.15
91500.4948.1048.420.67
* D i f f e r e n c e   ( % ) = M e a s u r e d   C o l o u r   Y i e l d P r e d i c t e d   C o l o u r   Y i e l d M e a s u r e d   C o l o u r   Y i e l d × 100 .